

Abstract
Purpose
A novel ablation catheter capable of local impedance (LI) monitoring (IntellaNav MiFi OI, Boston Scientific) has been recently introduced to clinical practice. We aimed to determine the optimal LI drops for an effective radiofrequency ablation during cavo‐tricuspid isthmus (CTI) ablation.
Methods
This retrospective observational study enrolled 50 consecutive patients (68 ± 9 years; 34 males) who underwent a CTI ablation using the IntellaNav MiFi OI catheter, guided by Rhythmia. The LI at the start of radiofrequency applications (initial LI) and minimum LI during radiofrequency applications were evaluated. The absolute and percentage LI drops were defined as the difference between the initial and minimum LIs and 100× absolute LI drop/initial LI, respectively.
Results
A total of 518 radiofrequency applications were analyzed. The absolute and percentage LI drops were significantly greater at effective ablation sites than ineffective sites (median, 15 ohms vs 8 ohms, P < .0001; median, 14.7% vs 8.3%, P < .0001). A receiver‐operating characteristic analysis demonstrated that at optimal cutoffs of 12 ohms and 11.6% for the absolute and percentage LI drops, the sensitivity and specificity for predicting the effectiveness of the ablation were 66.5% and 88.2%, and 65.1% and 88.2%, respectively. Finally, bidirectional conduction block along the CTI was achieved in all patients.
Conclusions
During the LI‐guided CTI ablation, the effective RF ablation sites exhibited significantly greater absolute and percentage LI drops than the ineffective RF ablation sites. Absolute and percentage LI drops of 12 ohms and 11.6% may be suitable targets for effective ablation.
Keywords: atrial flutter, cavo‐tricuspid isthmus, high‐resolution mapping, local impedance, radiofrequency catheter ablation
During the local impedance (LI)‐guided linear ablation along the cavo‐tricuspid isthmus (CTI), the effective radiofrequency (RF) ablation sites exhibited significantly greater absolute and percentage LI drops than the ineffective RF ablation sites. The receiver operating characteristics analysis suggested that an absolute LI drop of 12 ohms and percentage LI drop of 11.6% may be suitable targets for an effective RF ablation during a CTI linear ablation.
1. INTRODUCTION
A radiofrequency (RF) catheter‐based linear ablation along the cavo‐tricuspid isthmus (CTI) is the established therapeutic approach for CTI‐dependent atrial flutters. 1 , 2 The endpoint of the CTI linear ablation is to achieve bidirectional conduction block along the CTI. 3 A CTI linear ablation generally has a high success rate, and several parameters during the ablation have been reported to further facilitate the achievement of bidirectional conduction block: contact force (CF), 4 , 5 force‐time integral (FTI), 6 Ablation Index (AI) incorporating the CF, RF application duration, and power in a weighted formula, 7 and the electroanatomic coupling index. 8
A novel ablation catheter capable of local impedance (LI) monitoring (IntellaNav MiFi OI; Boston Scientific) has been recently introduced to clinical practice. Recent studies demonstrated that the LI provides valuable information on the catheter‐tissue coupling and lesion formation during RF catheter ablation (RFCA), and a change in the LI during ongoing ablation is more sensitive than that in the generator impedance. 9 , 10 , 11 So far there have been limited studies evaluating the usefulness of LI monitoring during CTI linear ablation. Thus, the purpose of this study was to determine the optimal values of the LI drops for an effective RF ablation during an LI‐guided CTI linear ablation.
2. METHODS
2.1. Study population
This retrospective observational study enrolled a total of 50 consecutive patients who underwent an initial CTI linear ablation using the IntellaNav MiFi OI catheter, guided by the Rhythmia system (Boston Scientific), at Gunma Prefectural Cardiovascular Center from August 2019 to February 2020. Forty‐eight patients (96.0%) underwent a CTI ablation concomitant with an RFCA of atrial fibrillation (AF), and the remaining two underwent a CTI ablation only. Ten patients (20%) had CTI‐dependent atrial flutters, which were clinically diagnosed before the ablation.
All patients received oral anticoagulation therapy for at least 1 month before the ablation procedure and underwent transesophageal echocardiography to rule out any intracardiac thrombi on the day of the RFCA procedure or the day before. All antiarrhythmic drugs, except for bepridil, were discontinued for at least five half‐lives before the procedure, whereas bepridil was continued throughout the periprocedural period. Written informed consent for the RFCA was obtained from all patients. The study protocol was approved by the local ethics committee and complied with the principles of the Declaration of Helsinki.
2.2. RFCA
The RFCA procedures and periprocedural anticoagulation have been previously described in detail. 12 Deep conscious sedation was maintained throughout the procedure using propofol or dexmedetomidine and pentazocine. Immediately after the femoral venous puncture, a heparin bolus was given intravenously, followed by a continuous and additional bolus infusion of heparin to maintain an activated clotting time between 300 and 400 s. A multielectrode catheter was positioned in the coronary sinus (CS) via the right femoral vein and served as the positional reference for mapping using the Rhythmia system. The ablation catheter was introduced into the right atrium (RA) through an 8‐French long sheath (SL0; Abbott). The CTI linear ablation was performed with a point‐by‐point ablation from the tricuspid annulus to the inferior vena cava during CTI‐dependent atrial flutters or pacing from the proximal CS. Continuous RF lesions were created along the CTI with an interlesion distance of 4‐5 mm between two neighboring lesions. The tip of the ablation catheter was initially placed parallel to the endocardial surface along the CTI. However, if the catheter tip was suspected not to have adequate contact with the ablation sites fluoroscopically and electrically, the catheter orientation was changed from parallel to oblique or perpendicular relative to those sites. Each application of RF energy was delivered with a power output of 25‐40 W, RF duration of 20‐40 s, and maximum temperature of 40°C at an irrigation flow rate of heparinized saline of 8 or 15 mL/min. The RF energy deliveries were commenced when the LI values of the ablation catheter on the CTI line increased compared to that of the blood pool, and were interrupted when the LI values reached the plateau of the impedance curve, decreased to >40 ohms from that when commencing the RF applications, 10 or increased during ongoing ablation. If the ablation catheter was displaced during ongoing ablation, the RF energy deliveries were immediately interrupted and applied again at the same site after repositioning the ablation catheter. When the LI values did not sufficiently drop during ongoing ablation, the RF power output was increased or the catheter tip‐tissue contact was improved by changing the catheter orientation relative to the ablation sites (parallel, oblique, or perpendicular) at the operators' discretion. On the other hand, when the LI values rapidly dropped during the ongoing ablation, the RF power output was decreased.
Bidirectional conduction block along the CTI was assessed by conventional methods consisting of both differential pacing maneuvers and recording widely separated double potentials along the CTI ablation line. 13 , 14 First‐pass conduction block was defined as the completion of bidirectional conduction block by the first linear ablation from the tricuspid valve annulus to the inferior vena cava without additional RF applications. When the first‐pass block was not achieved or the recovery of conduction occurred during the waiting period, the conduction gaps were mapped using the ablation catheter or 64‐electrode mini‐basket catheter (Orion, Boston Scientific), and additional RF ablation was applied to eliminate the gaps. The sites without conduction gaps were regarded as effective ablation sites, whereas the sites with conduction gaps were regarded as ineffective ablation sites.
2.3. LI measurement
The LI was measured using a 4‐electrode method, by driving a nonstimulatory alternating current (5.0 μA at 14.5 kHz) between the tip electrode and proximal ring to create a local potential field. 10 In this study, the baseline, initial, and minimum LIs were defined as follows: the LI value measured in the blood pool of the RA, that at the start of the RF applications, and the minimum value during the RF applications, respectively (Figure 1A). Furthermore, the absolute and percentage LI drops were obtained as the difference between the initial and minimum LIs and 100× absolute LI drop/initial LI, respectively.
FIGURE 1.
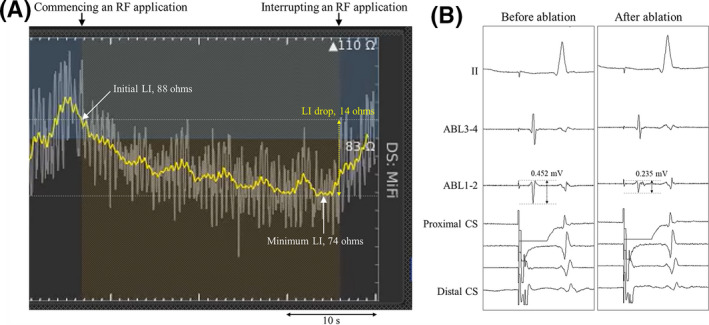
(A) Real‐time LI curves and (B) local bipolar electrograms recorded before and after the RF ablation. The baseline, initial, and minimum LI values in this case were 83, 88, and 74 ohms, respectively, and the absolute and percentage LI drops were 14 ohms and 15.9%, respectively. The initial and final bipolar electrogram amplitudes were 0.452 and 0.235 mV, respectively, and the absolute and percentage electrogram amplitude drops were 0.217 mV and 48.0%, respectively. The yellow and white curves indicate the mean LI values for the last 3 s and raw data of the LI values, respectively. ABL 1‐2 and 3‐4; distal and proximal ablation catheter recordings; CS, coronary sinus recordings; LI, local impedance; RF, radiofrequency
2.4. Electrogram amplitude measurement
Body surface and intracardiac electrograms were stored digitally on an electrophysiology recording system (Workmate Claris; Abbott). All bipolar electrograms were filtered from 30 and 500 Hz. The bipolar electrogram amplitude recorded from the distal electrode pair of the ablation catheter was measured at a sweep speed of 150 mm/s. In this study, the initial and final bipolar electrogram amplitudes were defined as the electrogram amplitudes at the start and end of the RF applications, respectively (Figure 1B). Furthermore, the absolute and percentage electrogram amplitude drops were obtained as the difference between the initial and final electrogram amplitudes and 100× absolute electrogram amplitude drop/initial electrogram amplitude, respectively.
2.5. Statistical analysis
Normally distributed continuous variables were expressed as the mean ± standard deviation (SD), non‐normally distributed continuous variables were as the median and interquartile range (IQR, 25th‐75th percentile), and categorical variables were as the number and percentage of patients. A comparative analysis between the effective and ineffective ablation sites was performed using a Mann‐Whitney's U‐test for continuous variables. To compare the strength of the association of the parameters with a prediction of an effective RF ablation, the area under the receiver operating characteristics (ROC) curve for each parameter was estimated. The statistical significance for all tests was accepted at a P‐value of <.05. The statistical analyses were performed using JMP 11.2 software (SAS Institute Inc).
3. RESULTS
The baseline and procedural characteristics of the study population are summarized in Tables 1 and 2. The mean age was 68 ± 9 years, and 68% of the subjects were male. Thirty‐three patients (66.0%) had first‐pass conduction block along the CTI and no patients had any recovery of conduction during the waiting period. Finally, bidirectional conduction block along the CTI was achieved in all patients with and without additional RF applications. Figure 2 shows a representative case with a conduction gap on the CTI line after the first‐pass CTI linear ablation, which was successfully eliminated by touch‐up ablation. No procedure‐related complications, including a cardiac tamponade, audible steam pop, or stroke, occurred in this series. During a median follow‐up period of 176 days (IQR, 122‐244 days) after the ablation procedure, none of the patients had any CTI‐dependent atrial flutters.
TABLE 1.
Patient characteristics
| Number of patients | 50 |
| Age (y) | 68 ± 9 |
| Male sex, n (%) | 34 (68) |
| Body mass index (kg/m2) | 23.4 ± 3.2 |
| Hypertension, n (%) | 26 (52) |
| Diabetes mellitus, n (%) | 6 (12) |
| Heart failure, n (%) | 2 (4) |
| Stroke/transient ischemic attack, n (%) | 2 (4) |
| CHADS2 score | 1 (0‐2) |
| Transthoracic echocardiographic findings | |
| Left atrial diameter (mm) | 38 ± 5 |
| Left ventricular ejection fraction (%) | 62 ± 6 |
CHADS2, congestive heart failure, hypertension, age ≧ 75 y, diabetes mellitus (1 point for the presence of each), and a stroke and transient ischemic attack (2 points).
TABLE 2.
Procedural characteristics during the CTI ablation
| Total procedure time (min) | 11.0 (8.0‐15.0) |
| Total fluoroscopic time (min) | 4.5 (2.8‐9.1) |
| Number of RF applications | 11 (9‐13) |
| Total RF duration (s) | 428 (387‐525) |
Abbreviations: CTI, cavo‐tricuspid isthmus; RF, radiofrequency.
FIGURE 2.
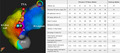
An activation map during proximal CS pacing demonstrating the conduction gap on the CTI after the first‐pass CTI linear ablation in the infero‐superior view. The red, light green, and light blue tags on the map and online video represent effective and ineffective RF ablation sites and touch‐up ablation site for completing conduction block along the CTI, respectively. The numbers in the tags correspond to that in the table. The dark red on the map represent the activation wavefront passing through the conduction gap on the CTI. CTI, cavo‐tricuspid isthmus; IVC, inferior vena cava; LI, local impedance; RA, right atrial; RF, radiofrequency; TVA, tricuspid valve annulus
3.1. LI analysis
Among a total of 518 RF ablation sites, 501 sites had an effective RF ablation and the remaining 17 had an ineffective RF ablation (Table 3). The LI values reached the plateau of the impedance curve in 481 RF applications (96.0%) at effective ablation sites and 17 (100%) at ineffective ablation sites, respectively. On the other hand, the LI values kept decreasing during the ongoing ablation in nine (1.8%) at effective ablation sites and in none at ineffective ablation sites, respectively, and those RF applications were interrupted when the LI values reached >40 ohms. Eleven RF applications (2.2%) at effective ablation sites were interrupted even though the maximum LI drop was 10‐19 ohms, because the LI values increased during the ongoing ablation.
TABLE 3.
Comparison of the LI‐ and local electrogram‐related parameters between the effective and ineffective RF ablation sites during the CTI ablation
| Effective sites (n = 501) | Ineffective sites (n = 17) | P value | |
|---|---|---|---|
| Maximum RF power output (W) | 35 (35‐40) | 40 (35‐40) | .13 |
| RF application duration (s) | 30 (28‐36) | 30 (28‐34) | .93 |
| RF energy delivery (J) | 980 (811‐1158) | 1078 (850‐1186) | .37 |
| Baseline LI (ohms) | 91 (87‐98) | 91 (85‐95) | .47 |
| Initial LI (ohms) | 102 (95‐112) | 100 (93‐110) | .41 |
| Minimum LI (ohms) | 88 (81‐94) | 93 (86‐102) | .039 |
| Absolute LI drop (ohms) | 15 (10‐20) | 8 (6‐10) | <.0001 |
| Percentage LI drop (%) | 14.7 (9.9‐19.2) | 8.3 (5.4‐10.8) | <.0001 |
| Initial bipolar electrogram amplitude (mV) | 0.76 (0.37‐1.49) | 0.89 (0.59‐2.39) | .07 |
| Final bipolar electrogram amplitude (mV) | 0.49 (0.23‐0.83) | 0.73 (0.40‐1.12) | .06 |
| Absolute bipolar electrogram amplitude drop (mV) | 0.23 (0.02‐0.74) | 0.30 (0.05‐1.44) | .22 |
| Percentage bipolar electrogram amplitude drop (%) | 34.6 (5.1‐61.3) | 38.9 (11.5‐64.6) | .67 |
Abbreviations: LI, local impedance, RF, radiofrequency.
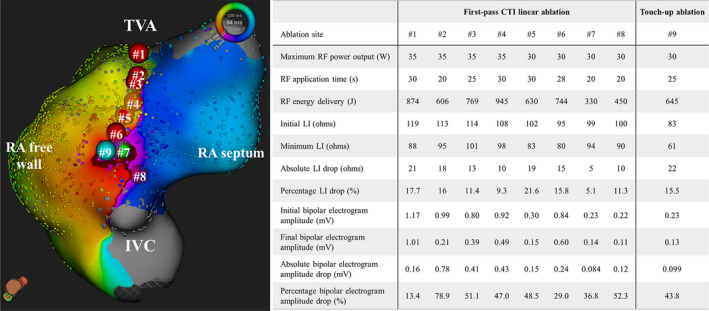
The absolute and percentage LI drops were significantly greater at the effective ablation sites than ineffective ablation sites (median, 15 ohms [IQR, 10‐20 ohms] vs median, 8 ohms [IQR, 6‐10 ohms], P < .0001; median, 14.7% [IQR, 9.9%‐19.2%] vs median, 8.3% [IQR, 5.4%‐10.8%], P < .0001) (Figure 3), whereas the baseline and initial LI values did not significantly differ between those sites. The maximum RF power output, RF application duration, initial and final bipolar electrogram amplitudes, and bipolar electrogram amplitude drops were comparable between the effective and ineffective ablation sites.
FIGURE 3.
Comparison of the absolute (left panel) and percentage (right panel) LI drops between the effective and ineffective RF ablation sites during the CTI ablation. The black dots represent the values of the absolute and percentage LI drops. In the box‐and‐whisker plots, the horizontal lines with boxes, and bars represent the median with the interquartile range, maximum and minimum values excluding outliers, respectively. LI, local impedance
An ROC analysis demonstrated that the area under the curve (AUC) was 0.80 (95% CI, 0.72‐0.86) for the absolute LI drop and 0.81 (95% confidence interval [CI], 0.73‐0.87) for the percentage LI drop, respectively, and did not significantly differ between the absolute and percentage LI drops (P = .42) (Figure 4). According to the results of the ROC analysis, at optimal cutoffs of 12 ohms for the absolute LI drop and 11.6% for the percentage LI drop, the sensitivity and specificity for predicting the effectiveness of ablation were 66.5% and 88.2%, and 65.1% and 88.2%, respectively. The LI values reached the plateau of the impedance curve without an absolute LI drop of ≥12 ohms at 168 (33.5%) of 501 effective ablation sites and 15 (88.2%) of 17 ineffective ablation sites, respectively, whereas the LI values reached the plateau of the impedance curve without a percentage LI drop of ≥11.6% at 175 effective ablation sites (34.9%) and 15 ineffective ablation sites (88.2%), respectively.
FIGURE 4.
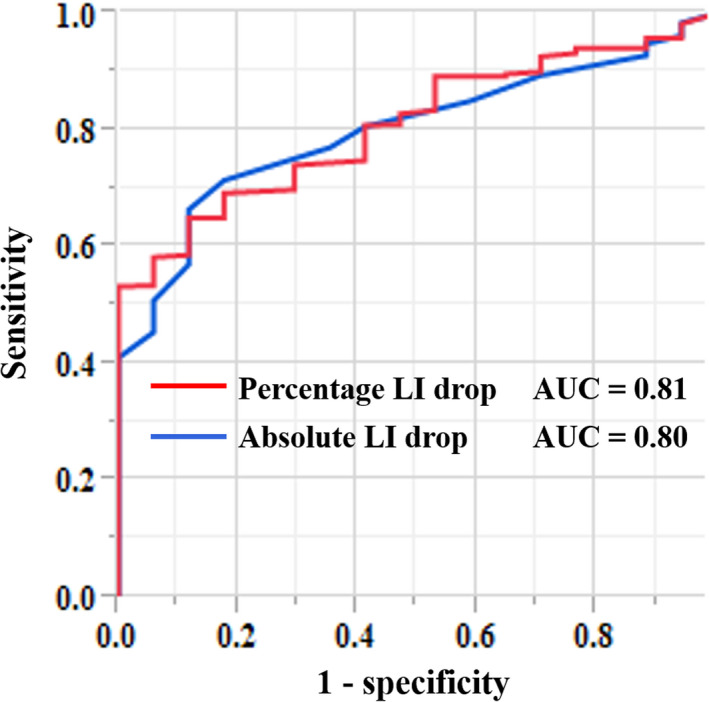
Receiver operating characteristic curves for the absolute (blue line) and percentage (red line) LI drops as predictors of an effective RF ablation during the CTI ablation. AUC, area under the curve; LI, local impedance
4. DISCUSSION
4.1. Major findings
This study described the usefulness of LI monitoring during CTI linear ablation. Our study demonstrated that the absolute and percentage LI drops were significantly greater at the effective ablation sites than ineffective ablation sites during the LI‐guided CTI ablation. The ROC analysis suggested that an absolute LI drop of 12 ohms and percentage LI drop of 11.6% may be suitable targets for an effective RF ablation during a CTI linear ablation.
4.2. LI monitoring during CTI ablation
Electrode‐tissue contact is an important factor that affects the lesion size, transmurality, and successful outcomes of RFCA procedures. 4 , 5 , 15 , 16 Thus, CF‐sensing ablation catheters have been widely used during RFCA and now provide a novel marker of the ablation lesion quality such as the AI and lesion size index. 17 , 18 On the other hand, recent studies reported that the LI provides information on the catheter‐tissue coupling, tissue characteristics, and tip electrode surface area covered by the myocardium, and LI drops could predict lesion formation during RF ablation. 10 , 11 , 19 Munkler et al demonstrated that the absolute LI drops were significantly greater at the effective ablation sites than ineffective sites during the VT ablation. 9 Martin et al demonstrated that the absolute and percentage LI drops were significantly greater at the successful lesions than unsuccessful lesions during ablation in the left atrium (LA) and ventricle. 11 The results of our study with a CTI ablation were consistent with that of those previous studies. Furthermore, the values of the absolute and percentage LI drops during the CTI ablation in this study were almost similar to that during the LA ablation in the study by Martin et al. 11
The endpoint of each RF application during the CTI ablation in this study was reaching the plateau of the LI curve. Gunawardene et al demonstrated that once the maximum LI drop was observed, a prolongation of the RF application did not further lower the LI values. 19 Thus, we speculated that the RF lesion size may not be significantly changed even if we further continue the RF applications after reaching the plateau of the LI curve. In addition, the time to reach the plateau of the LI curve has been reported to depend on the RF power output during the ablation. 10 We changed the RF power output according to the change in the LI values and impedance curve during the ongoing ablation, as mentioned in the methods section. Therefore, we regarded reaching the plateau of the LI curve without including the RF application duration as the ablation endpoint.
It has been reported that higher initial LI values are associated with greater LI drops. 11 , 19 However, there was no statistically significant difference in the initial LI values between the effective and ineffective ablation sites in our study, however, the LI drops were significantly greater at effective ablation sites than ineffective ablation sites. A possible explanation of those results was that the initial LI values widely ranged from 74 to 145 ohms in this cohort. That may have been because the initial LI values varied depending on the study subject and were partially affected by the previous RF energy deliveries applied at neighboring sites.
Sasaki et al demonstrated that a greater generator impedance drop was not associated with the bipolar voltage before the ablation or percent reduction in the bipolar voltage during the pulmonary vein isolation with CF monitoring. 20 Also during the CTI ablation in this study, neither the bipolar electrogram amplitudes at the start of the RF applications nor bipolar electrogram amplitude drops significantly differed between the effective and ineffective ablation sites.
4.3. Target LI drops for creating conduction block along the CTI
Creating continuous and transmural RF lesions is essential to achieve bidirectional conduction block along the CTI. 7 , 8 This study suggested that the optimal absolute and percentage LI drops for an effective RF ablation during the CTI linear ablation were ≥12 ohms and ≥11.6%, respectively. On the other hand, an excessive ablation is associated with an increased risk of steam pops, cardiac tamponades, and thrombus formation. 4 , 21 Thus, it is important to determine not only the minimum target of the LI drops for creating transmural lesions but also maximum target for preventing an excessive ablation during a CTI ablation. Nevertheless, the maximum target of the LI drops remains unclear in this study because of no RF applications with steam pops and charring on the ablation catheter tip. An experimental study by Sulkin et al demonstrated that larger LI drops were associated with the occurrence of steam pops, and the RF applications with steam pops had an LI drop of 59 ohms (IQR, 46‐73 ohms), whereas those without steam pops had an LI drop of 18 ohms (IQR, 11‐26 ohms) with 30 W applications and 28 ohms (IQR, 18‐49 ohms) with 50 W applications. 10 We interrupted the RF applications when the LI values decreased to >40 ohms from that when commencing the RF applications, which may be a reason for the absence of steam pops. Nine RF applications had an overshoot of the LI drop of up to 41‐52 ohms after the interruption of the RF energy deliveries, but none of the RF applications had any audible steam pops.
4.4. Study limitations
This study had several limitations. First, the analyzed data were derived from a single center, and the sample size was relatively small. Second, the study had a retrospective, nonrandomized design, which introduced a sample selection bias. Further understanding of the usefulness of LI monitoring during CTI ablation will require an investigation in a prospective multicenter study with a comparison between a CTI ablation guided by LI monitoring and that guided by conventional surrogate markers estimating the lesion formation. Third, the study focused on the acute success of the LI‐guided CTI ablation. The relationship of the LI monitoring during ablation and long‐term efficacy for a CTI ablation remains uncertain, because 40 patients in this study underwent a CTI linear ablation as part of AF catheter ablation and did not have CTI‐dependent atrial flutters, which were clinically diagnosed before the ablation. Finally, we did not evaluate the relationship between the LI drops and anatomical features of the CTI, such as the presence of a pouch, because not all patients underwent either right atriography or intracardiac echocardiography. However, we speculated that when the ablation catheter tip was placed within the pouch and the contact area between the catheter tip and endocardial surface of the pouch was relatively small, the LI drops during the ablation were likely to be small.
5. CONCLUSIONS
During the LI‐guided CTI ablation, the effective RF ablation sites exhibited significantly greater absolute and percentage LI drops than the ineffective RF ablation sites. An absolute LI drop of 12 ohms and percentage LI drop of 11.6% may be suitable targets for an effective RF ablation during the CTI linear ablation. The results of this study suggest that the LI may be a useful parameter to guide a CTI ablation.
CONFLICT OF INTEREST
The authors declare no conflict of interests for this article. The protocol for this research project has been approved by a suitably constituted Ethics Committee of Gunma Prefectural Cardiovascular Center (Approval number, 2020002; Approval date, April 30, 2020) and it conforms to the provisions of the Declaration of Helsinki.
Supporting information
Supplementary Material
Sasaki T, Nakamura K, Inoue M, et al. Optimal local impedance drops for an effective radiofrequency ablation during cavo-tricuspid isthmus ablation. J Arrhythmia. 2020;36:905–911. 10.1002/joa3.12403
REFERENCES
- 1. Perez FJ, Schubert CM, Parvez B, Pathak V, Ellenbogen KA, Wood MA. Long‐term outcomes after catheter ablation of cavo‐tricuspid isthmus dependent atrial flutter: a meta‐analysis. Circ Arrhythm Electrophysiol. 2009;2(4):393–401. [DOI] [PubMed] [Google Scholar]
- 2. Spector P, Reynolds MR, Calkins H, Sondhi M, Yingxin X, Martin A, et al. Meta‐analysis of ablation of atrial flutter and supraventricular tachycardia. Am J Cardiol. 2009;104(5):671–7. [DOI] [PubMed] [Google Scholar]
- 3. Cauchemez B, Haissaguerre M, Fischer B, Thomas O, Clementy J, Coumel P. Electrophysiological effects of catheter ablation of inferior vena cava‐tricuspid annulus isthmus in common atrial flutter. Circulation. 1996;93(2):284–94. [DOI] [PubMed] [Google Scholar]
- 4. Yokoyama K, Nakagawa H, Shah DC, Lambert H, Leo G, Aeby N, et al. Novel contact force sensor incorporated in irrigated radiofrequency ablation catheter predicts lesion size and incidence of steam pop and thrombus. Circ Arrhythm Electrophysiol. 2008;1(5):354–62. [DOI] [PubMed] [Google Scholar]
- 5. Ikeda A, Nakagawa H, Lambert H, Shah DC, Fonck E, Yulzari A, et al. Relationship between catheter contact force and radiofrequency lesion size and incidence of steam pop in the beating canine heart: electrogram amplitude, impedance, and electrode temperature are poor predictors of electrode‐tissue contact force and lesion size. Circ Arrhythm Electrophysiol. 2014;7(6):1174–80. [DOI] [PubMed] [Google Scholar]
- 6. Gould PA, Booth C, Dauber K, Ng K, Claughton A, Kaye GC. Characteristics of cavotricuspid isthmus ablation for atrial flutter guided by novel parameters using a contact force catheter. J Cardiovasc Electrophysiol. 2016;27(12):1429–36. [DOI] [PubMed] [Google Scholar]
- 7. Zhang T, Wang Y, Han Z, Zhao H, Liang Z, Wang YE, et al. Cavotricuspid isthmus ablation using ablation index in typical right atrial flutter. J Cardiovasc Electrophysiol. 2019;30(11):2414–9. [DOI] [PubMed] [Google Scholar]
- 8. Maines M, Peruzza F, Zorzi A, Catanzariti D, Angheben C, Del Greco M. Use of impedance‐based catheter tip‐to‐tissue contact assessment (electroanatomic coupling index, ECI) in typical right atrial flutter ablation. J Interv Card Electrophysiol. 2018;53(2):225–31. [DOI] [PubMed] [Google Scholar]
- 9. Münkler P, Gunawardene MA, Jungen C, Klatt N, Schwarzl JM, Akbulak RÖ, et al. Local impedance guides catheter ablation in patients with ventricular tachycardia. J Cardiovasc Electrophysiol. 2020;31(1):61–9. [DOI] [PubMed] [Google Scholar]
- 10. Sulkin MS, Laughner JI, Hilbert S, Kapa S, Kosiuk J, Younan P, et al. Novel measure of local impedance predicts catheter‐tissue contact and lesion formation. Circ Arrhythm Electrophysiol. 2018;11(4):e005831. [DOI] [PubMed] [Google Scholar]
- 11. Martin CA, Martin R, Gajendragadkar PR, Maury P, Takigawa M, Cheniti G, et al. First clinical use of novel ablation catheter incorporating local impedance data. J Cardiovasc Electrophysiol. 2018;29(9):1197–206. [DOI] [PubMed] [Google Scholar]
- 12. Nakamura K, Naito S, Sasaki T, Take Y, Minami K, Kitagawa Y, et al. Uninterrupted vs. interrupted periprocedural direct oral anticoagulants for catheter ablation of atrial fibrillation: a prospective randomized single‐centre study on post‐ablation thrombo‐embolic and haemorrhagic events. EP Europace. 2019;21(2):259–67. [DOI] [PubMed] [Google Scholar]
- 13. Shah D, Haissaguerre M, Takahashi A, Jais P, Hocini M, Clementy J. Differential pacing for distinguishing block from persistent conduction through an ablation line. Circulation. 2000;102(13):1517–22. [DOI] [PubMed] [Google Scholar]
- 14. Tada H, Oral H, Sticherling C, Chough SP, Baker RL, Wasmer K, et al. Double potentials along the ablation line as a guide to radiofrequency ablation of typical atrial flutter. J Am Coll Cardiol. 2001;38(3):750–5. [DOI] [PubMed] [Google Scholar]
- 15. Lin H, Chen YH, Hou JW, Lu ZY, Xiang Y, Li YG. Role of contact force‐guided radiofrequency catheter ablation for treatment of atrial fibrillation: a systematic review and meta‐analysis. J Cardiovasc Electrophysiol. 2017;28(9):994–1005. [DOI] [PubMed] [Google Scholar]
- 16. Afzal MR, Chatta J, Samanta A, Waheed S, Mahmoudi M, Vukas R, et al. Use of contact force sensing technology during radiofrequency ablation reduces recurrence of atrial fibrillation: a systematic review and meta‐analysis. Heart Rhythm. 2015;12(9):1990–6. [DOI] [PubMed] [Google Scholar]
- 17. Hussein A, Das M, Chaturvedi V, Asfour IK, Daryanani N, Morgan M, et al. Prospective use of Ablation Index targets improves clinical outcomes following ablation for atrial fibrillation. J Cardiovasc Electrophysiol. 2017;28(9):1037–47. [DOI] [PubMed] [Google Scholar]
- 18. Dello Russo A, Fassini GM, Casella M, Romanelli E, Pala S, Riva S, et al. Lesion index: a novel guide in the path of successful pulmonary vein isolation. J Interv Card Electrophysiol. 2019;55(1):27–34. [DOI] [PubMed] [Google Scholar]
- 19. Gunawardene M, Münkler P, Eickholt C, Akbulak RÖ, Jularic M, Klatt N, et al. A novel assessment of local impedance during catheter ablation: initial experience in humans comparing local and generator measurements. EP Europace. 2019;21(suppl 1):i34–42. [DOI] [PubMed] [Google Scholar]
- 20. Sasaki N, Okumura Y, Watanabe I, Sonoda K, Kogawa R, Takahashi K, et al. Relations between contact force, bipolar voltage amplitude, and mapping point distance from the left atrial surfaces of 3D ultrasound‐ and merged 3D CT‐derived images: implication for atrial fibrillation mapping and ablation. Heart Rhythm. 2015;12(1):36–43. [DOI] [PubMed] [Google Scholar]
- 21. Okumura Y, Johnson SB, Bunch TJ, Henz BD, O'Brien CJ, Packer DL. A systematical analysis of in vivo contact forces on virtual catheter tip/tissue surface contact during cardiac mapping and intervention. J Cardiovasc Electrophysiol. 2008;19(6):632–40. [DOI] [PubMed] [Google Scholar]
Associated Data
This section collects any data citations, data availability statements, or supplementary materials included in this article.
Supplementary Materials
Supplementary Material