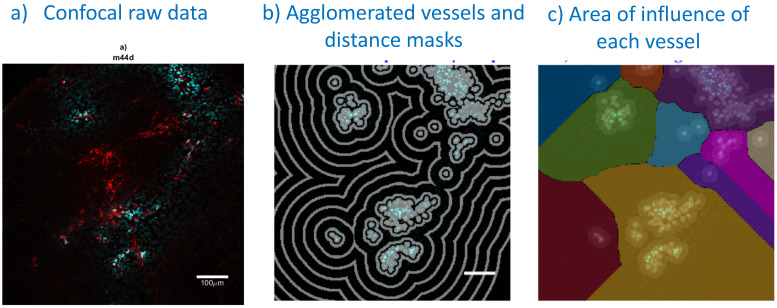
Figure 2.
Confocal image analysis, including vessel segmentation and determination of each vessel area of influence: a) A typical example of a confocal image (treated side, 5000cyc, 0 h): perfusion stain (Hoechst33342) in blue and antibody fluoresence in red; b) vessel agglomeration and distance masks (spaced 36 µm apart) used in distance analyses; c) watershedding operator to determine the area of influence of each vessel. Bar is 100 μm.

