Figure 3.
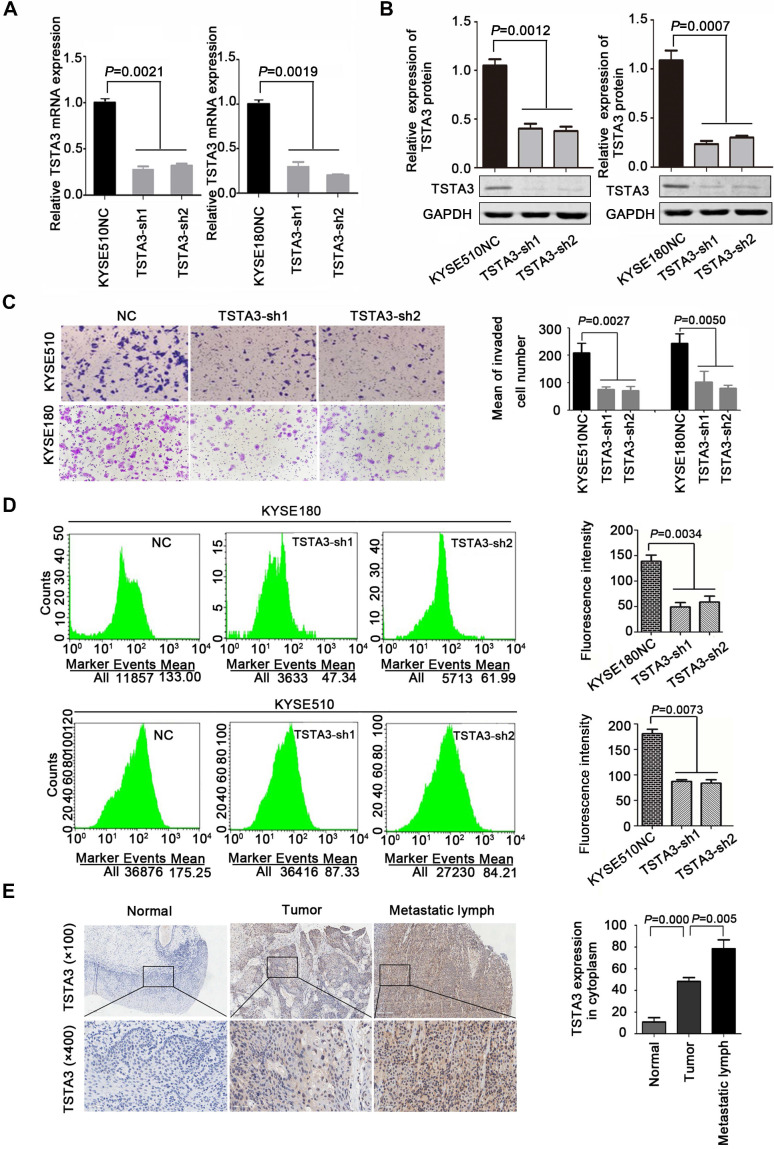
TSTA3 silencing reduced ESCC cells invasion and fucosylation level. (A) Relative TSTA3 mRNA levels in KYSE510 (left) and KYSE180 (right) cells treated with the lentivirus expressing TSTA3-shRNA (sh1 or sh2) or sh-NC (negative control) were assessed by qPCR. (B) Relative expression of TSTA3 protein in KYSE510 (left) and KYSE180 (right) cells treated with the lentivirus expressing TSTA3-shRNA (sh1 or sh2) or sh-NC were assessed by western blot. (C) Transwell invasion assays on KYSE510 (upper) and KYSE180 (bottom) with TSTA3 knockdown and control group. Right is a bar chart for quantitative analysis. (D) UEA-I fluorescence of KYSE180 (upper) and KYSE510 (bottom) cells was analyzed by FACS. The right panel shows quantitation of UEA-I fluorescence. All data are presented as the mean ± standard deviation and three independent experiments. (E) Representative immunohistochemistry images of TSTA3 expression in tumor tissues, matched normal tissues and metastatic lymph node from paraffin-embedded formalin-fixed 11 ESCC tissues. Right: TSTA3 expression in metastatic lymph node tissue showed significantly higher expression than that of matched tumor and normal tissues.

