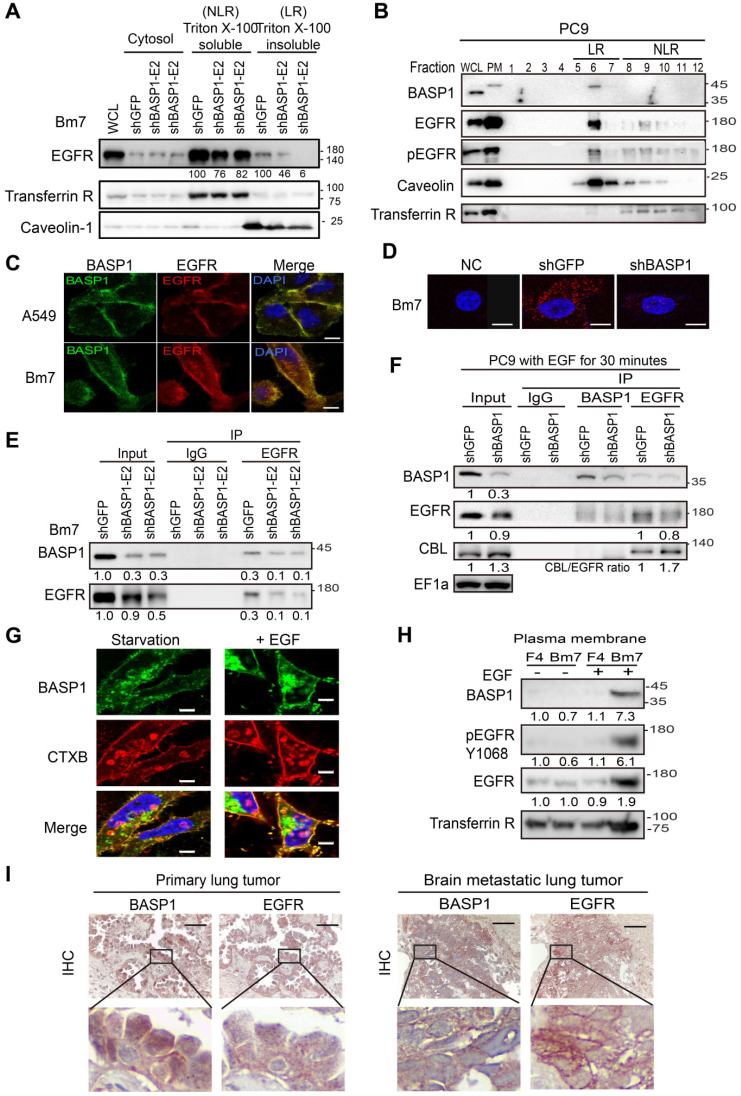
Figure 5.
A positive feedback of BASP1 and EGFR. (A) Western blot analysis of membrane proteins from Triton X-100 soluble (nonlipid raft, NLR) and Triton X-100 insoluble (lipid raft, LR) fractions. Transferrin receptor, control of nonlipid raft; caveolin-1, control of lipid raft. (B) Western blot analysis of plasma membranes of PC9 cells with density gradient ultracentrifugation fractionation. PM, plasma membrane. Fraction is indicated by the collecting tube number from top to bottom after centrifugation. (C) Confocal microscopy of endogenous BASP1 and EGFR in lung cancer cells. Scale bar, 5 µm. (D) Proximity ligation assay for BASP1 and EGFR in Bm7 lung cancer cells (red fluorescence dots). Scale bar, 5 µm. (E) Coimmunoprecipitation of BASP1 and EGFR in Bm7 cells. (F) Co-IP analysis in PC9 cells treated with EGF for 30 min. (G) Confocal microscopy of BASP1-GFP expression (green) and CTXB staining in lipid rafts (red) in CL1-0 cells transiently transfected with BASP1-GFP plasmids and treated with EGF for 10 minutes. Scale bar, 7 µm. (H) Western blot analysis of the plasma membrane fraction of F4 and Bm7 cells treated with EGF (50 ng/mL) for 15 min. (I) Representative images of BASP1 and EGFR IHC staining in serial sections of clinical paraffin block specimens of primary lung tumor and brain metastasis tumor specimens from different lung cancer patients. Scale bar, 50 µm.

