

Abstract
In recent years, circular RNAs (circRNAs) have been shown to have critical regulatory roles in the resistance to anti-cancer drugs. However, the contributions of circRNAs to sorafenib resistance in hepatocellular carcinoma (HCC) remain largely unknown. The present study aims to explore the involvement of circFN1 in sorafenib resistance and how circFN1 is associated with the miR-1205/E2F1 pathway, which have been demonstrated to mediate this resistance in HCC cells. We investigated the expression of circRNAs in five paired sorafenib-sensitive HepG2 cells and sorafenib-resistant (SR)-HepG2 cells by microarray analysis. The quantitative real-time PCR analysis was used to investigate the expression pattern of circFN1 in HCC patient tissues and cell lines. Then, the effects of circFN1 on sorafenib resistance, cell proliferation, and apoptosis were assessed in HCC in vitro and in vivo. In this study, circFN1 was observed to be upregulated in HCC patient tissues and cell lines. Overexpression of circFN1 in HCC was significantly correlated with aggressive characteristics and served as an independent risk factor for overall survival in patients with HCC. Our in vivo and in vitro data indicated that inhibition of circFN1 enhances the sorafenib sensitivity of HCC cells. Mechanistically, we found that circFN1 could promote the expression of E2F1 by sponging miR-1205. In summary, our study demonstrated that circFN1 contributes to sorafenib resistance by regulating the miR-1205/E2F1 signaling pathway. These results indicate that circFN1 may represent a potentially valuable target for overcoming sorafenib resistance for HCC.
Keywords: circRNAs, circFN1, microR-1205, E2F1, hepatocellular carcinoma, sorafenib, drug resistance
Graphical Abstract
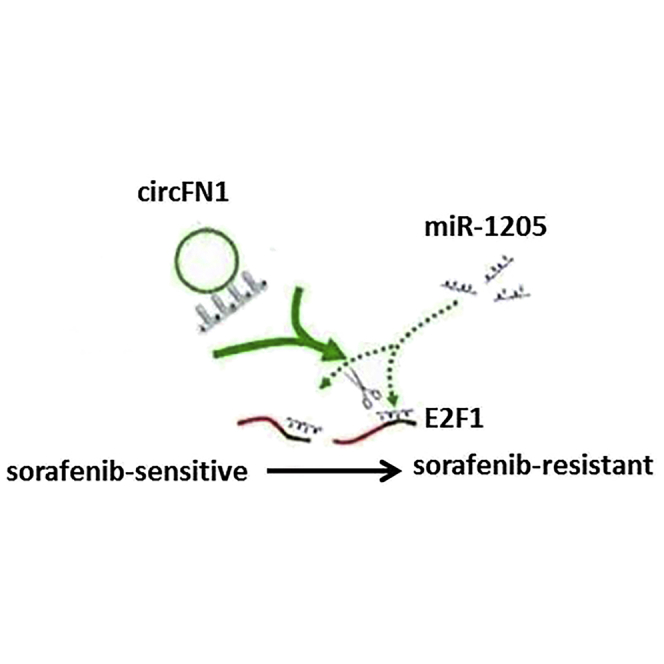
Yang et al. demonstrated that circFN1 contributes to sorafenib resistance by regulating the miR-1205/E2F1 signaling pathway. These results indicate that circFN1 may represent a potentially valuable target for overcoming sorafenib resistance for HCC.
Introduction
Hepatocellular carcinoma (HCC) is a prevalent malignancy worldwide with a high recurrence rate and poor prognosis.1 This malignancy contributes to a great proportion of cancer-related deaths each year, especially in China.2 Due to the late-stage detection and lack of effective therapies, patients with advanced-stage HCC lose the opportunity for surgery. As a result, the prognosis of HCC patients is still very poor, and the 5-year survival rate is lower than 25%.3 Sorafenib, a multi-kinase inhibitor, is the only US Food and Drug Administration (FDA)-approved proven effective molecular drug for treatment of advanced HCC, which can significantly prolong the survival of patients.4,5 Unfortunately, many patients may develop acquired resistance to sorafenib.6 Evidence has shown that sorafenib resistance is a process with multifactorial participation that may originate through a series of modifications; however, the mechanism responsible for sorafenib resistance in HCC remains little understood.
Circular RNAs (circRNAs) represent a typical class generated by backsplicing and characterized by covalently closed loop structures that lack both 5′ to 3′ polarity and a polyadenylated tail. Accumulating studies have found that circRNAs are involved in various physiological and pathophysiological processes, for instance, modulating alternative splicing,7 sponging microRNA (miRNA),8 and regulating protein-RNA interactions and genes expression.9 Due to their closed structure, circRNAs have a high level of stability and resistance to RNA degradation. More recently, a novel mechanism of post-transcriptional regulation has been proposed, in which circRNAs interact with miRNAs as competing endogenous RNAs (ceRNAs).10 In addition, aberrant expression of circRNAs has been verified in multiple malignancies, including HCC. In HCC, some studies also revealed the existence of numerous circRNAs, such as circMTO1 and circARSP91.11,12 However, the function and mechanism of circRNAs in sorafenib resistance in HCC need to be further explored.
In the present study, we detected the differential expression of hundreds of circRNAs in sorafenib-resistant HCC tissues by circRNA arrays and identified circFN1 (hsa_circ_0058124) as a conserved and significantly upregulated circRNA in sorafenib-resistant HCC tissues and cell lines. Loss- and gain-of functions investigations showed that circFN1 promoted cancer cell growth in vivo and in vitro. Mechanistically, we revealed that inhibition of circFN1 could sensitize HCC cells to sorafenib in part through serving as a RNA to modulate miRNA-1205 and its target gene, E2F1, expression. Our findings will provide new insights into the regulatory mechanisms of circFN1 in tumorigenesis and sorafenib resistance in HCC.
Results
circRNA Profiling in Sorafenib-Resistant HCC Cells and hsa_circ_0058124 Characterization
To clarify the relationship between circRNAs and sorafenib resistance in HCC cells, sorafenib-resistant cell lines (SR-HepG2 and SR-Huh7) were constructed according to an established protocol. As illustrated in Figure 1A, the half-maximal inhibitory concentration (IC50) value ranged from 9.42 μmol/L in Huh7 cells to 27.41 μmol/L in SR-Huh7 cells, and 12.37 μmol/L in HepG2 cells to 30.92 μmol/L in SR-HepG2 cells, respectively. Cells that exhibited higher IC50 values were defined as resistant. Using a circRNA microarray assay, we analyzed aberrantly-expressed circRNAs between SR-HepG2 and HepG2 cells. After screening of differentially expressed circRNAs by fold change (FC) filtering (|log2FC| > 1) and Student’s t testing (p < 0.05), 748 differentially expressed circRNAs were identified. Compared with the HepG2 cells, there were 416 significantly upregulated and 332 significantly downregulated circRNAs in SR-HepG2 cells. Among the 748 differentially expressed circRNAs, 176, including 84 upregulated ones and 92 downregulated ones, were verified as novel circRNAs; 572 circRNAs, including 332 upregulated ones and 240 downregulated ones, had been identified beforehand and listed in the circRNA database (circBase; http://www.circbase.org) (Figure 1B). The 748 identified circRNAs were divided into five different categories on the basis of the way they were produced. Exonic circRNAs consisting of the protein-encoding exons accounted for 73.80% (505/748), intronic circRNAs from intron lariats comprised 8.96% (67/748), sense overlapping circRNAs that originated from exon and other sequence circRNAs comprised 14.84% (111/748), and intergenic circRNAs composed of unannotated sequences of the gene and antisense circRNAs originating from antisense regions equally comprised 2.41% (18/748) (Figure 1C).
Figure 1.

circRNA Profiling in Sorafenib-Resistant HCC Cells and hsa_circ_0058124 Characterization
(A) The half-maximal inhibitory concentration (IC50) value. (B) Among the 748 differentially expressed circRNAs, 176 circRNAs were verified as novel circRNAs; 572 circRNAs were identified beforehand and are listed in the circRNA database. (C) The number of upregulated (red) and downregulated (green) circRNAs according to their categories of formation mode. (D) The heatmap shows that the top five most upregulated circRNAs were distinguishable between the SR-HepG2 cells and the parent HepG2 cells. (E) The level of hsa_circ_0058124 was significantly increased in SR-HepG2 cells compared with the parent HepG2 cells. (F) Overexpression of hsa_circ_0058124 promoted sorafenib resistance in both SR-Huh7 and SR-HepG2 cell lines. All tests were performed at least three times. Data are expressed as mean ± SD. ∗p < 0.05, ∗∗p < 0.01, ∗∗∗p < 0.001.
The results of hierarchical clustering suggested that the five most upregulated circRNAs were distinguishable between the SR-HepG2 cells and the parent HepG2 cells (Figure 1D), which were then subjected to validation by quantitative real-time PCR. Among the differentially expressed circRNAs, hsa_circ_0058124 was the most upregulated circRNA in SR-HepG2 cells compared with the parent HepG2 cells (Figure 1E). Moreover, we found that overexpression of hsa_circ_0058124 promoted sorafenib resistance in both SR-Huh7 and SR-HepG2 cell lines, while other circRNAs showed little effect (Figure 1F). According to the human reference genome, we further termed hsa_circ_0058124 (located at chr2:216270960–216274462 and derived from gene FN1 exons 15–19, with a spliced mature sequence length of 864 bp) as “circFN1.” We verified its existence in many circRNA databases. According to the circBase database, circFN1 is detected in normal human lung fibroblasts (http://www.circbase.org/cgi-bin/singlerecord.cgi?id=hsa_circ_0058124). The circNet database also supported the existence of circFN1 (http://circnet.mbc.nctu.edu.tw/, by searching circFN1).
circFN1 Was Upregulated in HCC Tissues and Cell Lines
Moreover, the expression level of circFN1 was examined by quantitative real-time PCR analysis in HCC samples and paired adjacent normal tissues (ANTs) collected from 64 HCC patients. The results suggested that circFN1 was found to be significantly upregulated in 64 HCC tissues compared to ANTs (p < 0.01, Figure 2A). We used the receiver operating characteristic (ROC) curve to examine the diagnostic value of circFN1 in HCC tissues compared with ANTs, and found the area under the ROC curve (AUC) to be 0.878 (95% confidence interval [CI] = 0.794–0.963, p < 0.0001; Figure 2B). We also investigated the clinical significance of circFN1 by analyzing the correlations between its expression level and clinicopathological characteristics. Using the median expression level of circFN1 as the cutoff value, we divided the 64 HCC patients into low and high expression groups. As listed in Table 1, high circFN1 expression in HCC tissues was closely associated with tumor size (p = 0.002), tumor, node, and metastasis (TNM) stage (p = 0.027), and vascular invasion (p = 0.031) of HCC patients. Furthermore, HCC patients with low expression of circFN1 displayed clearly longer overall survival times than did those with high expression of circFN1 according to Kaplan-Meier survival curve analysis (p = 0.001) (Figure 2C). Then, experiments were performed at the cellular level. circFN1 expression was distinctively higher in SR-HepG2 and SR-Huh7 cells, and clearly lower in the normal human liver cell line LO2 (Figure 2D; p < 0.01). These data indicated that circFN1 might be a participant in tumorigenesis in HCC.
Figure 2.

circFN1 Was Upregulated in HCC Tissues and Cell Lines
(A) circFN1 was found to be significantly upregulated in 64 HCC tissues compared to paired adjacent normal tissues (ANTs). (B) The area under the ROC curve was 0.878 (95% CI = 0.794–0.963, p < 0.0001). (C) Kaplan-Meier survival curve of patients with low and high expression of circFN1. (D) CircFN1 expression was distinctly higher in SR-HepG2 and SR-Huh7 cells. All tests were performed at least three times. Data are expressed as mean ± SD. ∗∗p < 0.01, ∗∗∗p < 0.001.
Table 1.
Association of circFN1 Expression with Clinicopathological Features of HCC Patients
| Characteristics | circFN1 Low (n = 32) | Expression High (n = 32) | p |
|---|---|---|---|
| Age (years) | |||
| <55 | 11 | 16 | 0.311 |
| ≥55 | 21 | 16 | |
| Sex | |||
| Female | 15 | 12 | 0.613 |
| Male | 17 | 20 | |
| HBsAg status | |||
| Positive | 14 | 17 | 0.617 |
| Negative | 18 | 15 | |
| Liver cirrhosis | |||
| Yes | 10 | 15 | 0.305 |
| No | 22 | 17 | |
| Tumor size (cm) | |||
| <5 | 24 | 11 | 0.002 |
| ≥5 | 8 | 21 | |
| Tumor number | |||
| Single | 28 | 26 | 0.732 |
| Multiple | 4 | 6 | |
| TNM stage | |||
| I–II | 27 | 18 | 0.027 |
| III–IV | 5 | 14 | |
| Tumor differentiation | 0.302 | ||
| Well moderate | 29 | 25 | |
| Poor | 3 | 7 | |
| Vascular invasion | |||
| Yes | 3 | 11 | 0.031 |
| No | 29 | 21 |
HBsAg, hepatitis B surface antigen.
Confirmation of Subcellular Localization of circFN1
We investigated the stability and localization of circFN1 in SR-HepG2 and SR-Huh7 cells. Total RNAs from SR-HepG2 and SR-Huh7 cells were isolated at the indicated time points after treatment with actinomycin D, an inhibitor of transcription. Analysis for stability of circFN1 and FN1 in SR-HepG2 and SR-Huh7 cells treated with actinomycin D revealed that the half-life of circFN1 transcript exceeded 24 h, with more stability than FN1 (Figures 3A and 3B). RNase R is an exoribonuclease that can degrade RNA from its 3′ to 5′ end but does not act on circRNA. In contrast to the linear FN1 mRNA, circFN1 was resistant to RNase R (Figures 3C and 3D). A nuclear and cytoplasmic protein extraction assay was performed to examine the subcellular localization of circFN1 in SR-HepG2 and SR-Huh7 cells. It was found that circFN1 was predominantly localized in the cytoplasm of SR-HepG2 and SR-Huh7 cells (Figures 3E and 3F). These data indicated that circFN1 harbored a loop structure and was predominantly localized in the cytoplasm.
Figure 3.

Confirmation of Subcellular Localization of circFN1
(A) Quantitative real-time PCR for the abundance of circFN1 and FN1 in SR-Huh7 cells treated with actinomycin D at the indicated time point. (B) Quantitative real-time PCR for the abundance of circFN1 and FN1 in SR-HepG2 cells treated with actinomycin D at the indicated time point. (C) Quantitative real-time PCR for the expression of circFN1 and FN1 mRNA in SR-Huh7 cells treated with or without RNase R. (D) Quantitative real-time PCR for the expression of circFN1 and FN1 mRNA in SR-HepG2 cells treated with or without RNase R. (E) Levels of circFN1 in the nuclear and cytoplasmic fractions of SR-Huh7 cells. (F) Levels of circFN1 in the nuclear and cytoplasmic fractions of SR-HepG2 cells. Data are listed as means ± SD of at least three independent experiments. ∗∗p < 0.01.
Inhibition of circFN1 Enhances the Sorafenib Sensitivity of HCC via Regulating Akt Activation In Vitro
To further validate the expression level of circFN1 on sorafenib resistance, circFN1 small interfering RNA (siRNA) and circFN1 overexpression vector were constructed, and we performed loss- and gain-of-function studies by knocking down or overexpressing circFN1 in HCC cells. First, we knocked down the expression of both circFN1 and FN1 mRNA. We designed circFN1-specific siRNAs targeting the backsplice sequence (respectively si-circFN1#1, si-circFN1#2, or si-circFN1#3) or the sequence only in the linear transcript (si-FN1). Some circRNAs regulate the expression and function of the corresponding linear transcripts. Therefore, the regulatory relationship between circFN1 and its linear transcript (FN1) was investigated in this study. As expected, siRNA directed against the backsplice sequence knocked down only the circular transcript and did not affect the expression of linear species, and siRNA targeting the sequence in the linear transcript knocked down only the linear transcript and did not affect the expression of the circular transcript in SR-HepG2 and SR-Huh7 cells (Figures 4A and 4B; Figures S1A and S1B; p < 0.01). These data indicated that FN1 is not the target gene of circFN1. We chose si-circFN1#3 for the subsequent experiments due to its higher efficiency of interference. Meanwhile, we induced ectopic overexpression of circFN1 by transfecting HepG2 and Huh7 cells with the pcDNA-circFN1 expression vector. Also, the expression vector markedly increased the expression of circFN1 compared with the empty vector (Figure 4C; p < 0.01).
Figure 4.

Inhibition of circFN1 Enhances the Sorafenib Sensitivity of HCC In Vitro
(A) The quantitative real-time PCR assay indicated the expression level of circFN1 in SR-HepG2 and SR-Huh7 cells treated with si-circFN1. (B) The quantitative real-time PCR assay indicated the expression level of FN1 in SR-HepG2 and SR-Huh7 cells treated with si-circFN1. (C) The quantitative real-time PCR assay indicated the expression level of circFN1 in HepG2 and Huh7 cells infected with circFN1 overexpression plasmid. (D) CCK-8 assay showing circFN1 silencing suppressed the proliferation of SR-HepG2 cells in the presence of sorafenib (3 μM). (E) CCK-8 assay showing that overexpression of circFN1 promoted the proliferation of HepG2 cells. (F) Silencing of circFN1 promoted sorafenib-induced cell apoptosis of SR-HepG2 and SR-Huh7 cells after exposure to sorafenib (3 μM). Data are listed as means ± SD of at least three independent experiments. ∗p < 0.05, ∗∗p < 0.01.
Results of a Cell Counting Kit-8 (CCK-8) assay showed that circFN1 silencing suppressed the proliferation of SR-HepG2 and SR-Huh7 cells after exposure to sorafenib (3 μM) (Figure 4D; Figure S1C; p < 0.01). However, after overexpression of circFN1, the growth rates of HepG2 and Huh7 cells were significantly increased compared to the control group (Figure 4E; Figure S1D; p < 0.01). To further confirm the effect of circFN1 on sorafenib resistance, we analyzed the rate of apoptosis using annexin V-allophycocyanin (APC)/DAPI double staining and flow cytometry. Silencing of circFN1 promoted the sorafenib-induced cell apoptosis of SR-HepG2 and SR-Huh7 cells after exposure to sorafenib (3 μM) (Figure 4F; p < 0.01). However, cell apoptosis assays revealed that overexpression of circFN1 significantly decreased the apoptosis of HepG2 and Huh7 cells after exposure to sorafenib (3 μM) compared to the control group (Figure S1E; p < 0.01). We next examined whether changing circFN1 by exogenous transfection could lead to the change of phosphatase and tensin homolog (PTEN) protein expression and the activation of Akt, which is negatively regulated by PTEN. Inhibition of circFN1 significantly increased the expression of PTEN protein and decreased the activation of Akt in sorafenib-resistant HCC cells (Figure S1F).
circFN1 Facilitates Sorafenib Resistance of HCC In Vivo
To investigate the biological function of circFN1 on the sensitivity of HCC cells to sorafenib in vivo, we established a xenograft tumor model in nude mice. SR-HepG2 cells transfected with si-circFN1 or a control siRNA were subcutaneously injected into nude mice, followed by administration with sorafenib. According to the treatment, the tumors in the mice were actually assigned to the following groups: group 1, si-circFN1-transfected cells + sorafenib; group 2, si-circFN1-transfected cells + Normal Saline (NS); group 3, si-negative control (NC)-transfected cells + sorafenib; and group 4, si-NC-transfected cells + NS. The results showed that sorafenib treatment significantly inhibited the growth of tumor cells when compared with control groups (group 1 versus group 2, p < 0.01; group 3 versus group 4, p < 0.01). More importantly, with sorafenib treatment, tumor cells infected with sh-circFN1 grew at lower levels than in controls (group 1 versus group 3, p < 0.01), suggesting that circFN1 knockdown enhances the sorafenib sensitivity in vivo (Figure 5A). Tendencies in tumor weight were consistent with those in tumor volume (Figure 5B, group 1 versus group 2, p < 0.05; group 3 versus group 4, p < 0.05; group 1 versus group 3, p < 0.01). Moreover, an immunohistochemistry assay showed that the tumors treated with sh-circFN1 plus sorafenib displayed an increased proliferation percentage of Ki-67-positive tumor cells compared with the control group (Figures 5C and 5D; group 1 versus group 3, p < 0.01). Collectively, these results implicated that circFN1 knockdown displayed a synergic effect with sorafenib in suppressing HCC cell growth in vivo.
Figure 5.

circFN1 Facilitates Sorafenib Resistance of HCC In Vivo
(A) circFN1 knockdown enhances the sorafenib sensitivity in vivo. (B) Weights of tumors that developed in xenografts from different groups. (C) The percentage of Ki-67-positive cells in xenografts from different groups. (D) Immunohistochemistry (IHC) analysis of expression levels of Ki-67 in xenografts from different groups. All tests were at least performed three times. Data are expressed as mean ± SD. ∗∗p < 0.01.
circFN1 May Function as a Sponge for miR-1205
Given that many circRNAs can function as miRNA sponges in the cytoplasm, we determined whether circFN1 may also bind to miRNAs as a sponge and regulate targets via the ceRNA mechanism. We therefore analyzed the sequence of circFN1 using the miRanda algorithm (http://microrna.org/) and identified 36 miRNA-binding sites; however, four miRNAs (miR-23a-3p, miR-1205, miRNA-1231, and miR-224-5p) were finally selected because they ranked highly in correspondence with the positions of the putative binding sites in the 3′ untranslated region (UTR) of circFN1 (Table S1).
First, we conducted an RNA immunoprecipitation (RIP) assay with an antibody against AGO2 in SR-HepG2 cells. The results showed that circFN1, but not circANRIL (a circRNA reported not to bind to AGO2), was significantly enriched by the AGO2 antibody (Figure 6A), suggesting that circFN1 may act as a binding platform for AGO2 and miRNAs. To further detect whether circFN1 could sponge miRNAs, we performed a miRNA pull-down assay using biotin-coupled miRNA mimics (miR-23a-3p, miR-1205, miRNA-1231, and miR-224-5p). Interestingly, circFN1 was only efficiently enriched by miR-1205, but not by the other three miRNAs (Figure 6B). In order to further validate the interaction, the circFN1 sequence containing the putative or mutated miR-1205 binding site was cloned into the downstream of the luciferase reporter gene, generating wild-type (WT)-circFN1 or mutant (MUT)-circFN1 luciferase reporter plasmids. Then, the effect of miR-1205 on WT-circFN1 or MUT-circFN1 luciferase reporter systems was determined. The results showed that the miR-1205 mimic considerably reduced the luciferase activity of the WT-circFN1 luciferase reporter vector compared with the NC, while the miR-1205 mimic did not pose any impact on the luciferase activity of MUT-circFN1-transfected SR-HepG2 and SR-Huh7 cells (Figure 6C; p < 0.01). Furthermore, the results of a pull-down assay using biotin-labeled miR-1205 mimics showed obvious enrichment of circFN1 compared with that of the NC (Figure 6D). Furthermore, silencing of circFN1 did not affect the expression of miR-1205, and transfection of miR-1205 mimics did not affect the expression of circFN1 in SR-HepG2 and SR-Huh7 cells (Figures 6E and 6F), which indicated that circFN1 functions as a miRNA sponge without affecting the expression of sponged miRNAs.
Figure 6.

circFN1 May Function as a Sponge for miR-1205
(A) Endogenous circFN1 was efficiently pulled down by anti-Ago2. (B) miRNA pull-down assay showed that circFN1 was only efficiently enriched by miR-1205. (C) The luciferase reporter systems showed that the miR-1205 mimic considerably reduced the luciferase activity of the WT-circFN1 luciferase reporter vector compared with negative control, while the miR-1205 mimic did not pose any impact on the luciferase activity of MUT-circFN1-transfected SR-HepG2 and SR-Huh7 cells. (D) circFN1 and miR-1205 simultaneously existed in the production precipitated by anti-Ago2. (E) Silencing of circFN1 did not affect the expression of miR-1205. (F) Transfection of miR-1205 mimics did not affect the expression of circFN1. All tests were performed at least three times. Data are expressed as mean ± SD. ∗∗p < 0.01.
miR-1205 Suppressed Sorafenib Resistance and Inhibited the Tumorigenesis of HCC Cells
The quantitative real-time PCR analysis indicated that there was a decreasing trend in miR-1205 levels from normal tissues to HCC tissues, and the differences between the two groups were significant (Figure 7A; p < 0.01). We also confirmed that the expression of miR-1205 was clearly decreased in sorafenib-resistant cells than that in sorafenib-sensitive cells, indicating the opposite result to circFN1 expression (Figure 7B; p < 0.01). To gain insight into whether circFN1 affected sorafenib resistance of HCC cells via modulation of miR-1205, we further performed rescue assays to confirm how miR-1205 modulated sorafenib resistance. We transfected miR-1205 inhibitors into HepG2 cells or mimics into SR-HepG2 cells and proliferation curves were performed. Our results showed that HepG2 cells transfected with miR-1205 inhibitors grew at a dramatically higher rate as compared with controls (Figure 7C; p < 0.01), whereas miR-1205 mimics markedly inhibits the cell growth in SR-HepG2 cells when compared with cells transfected with miR-NC (Figure 7D; p < 0.01). Moreover, a CCK-8 assay proved that downregulation of circFN1 markedly inhibits the cell growth in sorafenib-resistant cells, whereas the si-circFN1#3-induced decrease of cell growth was partially restored by miR-1205 inhibition (Figure 7E; p < 0.01). Furthermore, flow cytometry analysis indicated that miR-1205 overexpression or circFN1 knockdown dramatically aggravated sorafenib-induced apoptosis of SR-HepG2 and SR-Huh7 cells; however, si-circFN1#3-triggered apoptosis was attenuated after cotransfection with the miR-1205 inhibitor (Figure 7F; p < 0.01). Taken together, these data hinted that inhibition of miR-1205 could significantly reverse circFN1-mediated sorafenib resistance in HCC cells.
Figure 7.

miR-1205 Suppressed Sorafenib Resistance and Inhibited the Tumorigenesis of HCC Cells
(A) Relative expression of miR-1205 in HCC tissues. (B) Relative expression of miR-1205 in sorafenib-resistant cells. (C) CCK-8 assay showed that miR-1205 mimics markedly inhibit the cell growth in SR-HepG2 cells when compared with cells transfected with miR-NC. (D) CCK-8 assay showed that HepG2 cells transfected with miR-1205 inhibitors grew at a dramatically higher rate as compared with controls. (E) CCK-8 assay showed that downregulation of circFN1-induced decrease of cell growth was partially restored by the miR-1205 inhibitor in SR-HepG2 cells. (F) Flow cytometry analysis indicated that downregulation of circFN1-triggered apoptosis was attenuated by the miR-1205 inhibitor in sorafenib-resistant cells. All tests were at least performed three times. Data are expressed as mean ± SD. ∗∗p < 0.01.
circFN1 Upregulates E2F1 Expression via Sponging miR-1205
Previous studies have reported that several genes are directly targeted by miR-1205 in human cancers, including E2F1, TIMP3, SATB1, and DIECR1. According to the ceRNA theory, circFN1 expression is positively correlated with its target genes. To further verify the downstream targets of circFN1, mRNA levels of four candidate target genes were detected after silencing circFN1, and we found that only E2F1 was downregulated (Figure 8A). To verify whether E2F1 was the direct target of miR-1205, we first performed a miRNA biotin pull-down assay. We found that miR-1205 could significantly enrich the 3′ UTR of E2F1 mRNA (Figure 8B). To verify whether the 3′ UTR of E2F1 mRNA was a target of miR-1205 in HCC cells, a luciferase reporter gene assay was used. The WT 3′ UTR sequence or MUT 3′ UTR sequence of E2F1 was cloned into a luciferase reporter vector. The luciferase activity was significantly inhibited by the miR-1205 mimics in WT 3′ UTR sequence-transfected cells. Conversely, the luciferase activity was not inhibited by the miR-1205 mimics in MUT 3′ UTR sequence-transfected cells (Figures 8C and 8D). These results suggested that miR-1205 binds to the 3′ UTR of E2F1 and directly downregulates E2F1 expression.
Figure 8.

circFN1 Upregulates E2F1 Expression via Sponging miR-1205
(A) Silencing of circFN1 downregulated the expression of E2F1. (B) miR-1205 could significantly enrich the 3′ UTR of E2F1 mRNA. (C) Bioinformatics analysis revealed the predicted binding sites between E2F1 and miR-1205. (D) Luciferase reporter assay demonstrated that miR-1205 mimics significantly decreased the luciferase activity of E2F1-WT in HCC cells. (E) Inhibition of circFN1-mediated decrease of E2F1 protein expression was significantly recuperated following miR-1205 inhibitors. (F) TCGA database showed that the level of E2F1 was significantly upregulated in HCC tissue compared with normal liver tissue. (G) Kaplan-Meier survival analysis from TCGA HCC datasets suggested that high E2F1 expression in HCC tissues is significantly associated with worse overall survival (OS). (H) Kaplan-Meier survival analysis from TCGA HCC datasets suggested that high E2F1 expression in HCC tissues is significantly associated with worse disease-free survival (DFS). All tests were performed at least three times. Data are expressed as mean ± SD. ∗∗p < 0.01.
To further confirm the effects of circFN1 on E2F1 expression, HCC cells were transfected with the circFN1 siRNA, and the E2F1 protein levels were detected using western blotting. The results showed that knockdown of circFN1 expression significantly reduced the E2F1 protein levels in SR-HepG2 cells (Figure 8E). Moreover, inhibition of the circFN1-mediated decrease of E2F1 protein expression was significantly recuperated following miR-1205 inhibitors (Figure 8E). To determine the expression levels of E2F1 in HCC, we analyzed the HCC dataset from The Cancer Genome Atlas (TCGA) database and found that the level of E2F1 was significantly upregulated in HCC tissue compared with normal liver tissue (Figure 8F). Subsequently, Kaplan-Meier survival analysis from TCGA HCC datasets suggested that high E2F1 expression in HCC tissues is significantly associated with worse overall survival (OS) (log-rank test, p = 0.0025, Figure 8G) and worse disease-free survival (DFS) (log-rank test, p = 0.0023, Figure 8H). All of these data made us draw a conclusion that circFN1 positively regulated E2F1 expression by interacting with miR-1205 in sorafenib-resistant HCC cells.
Discussion
In this study, we explored the effect of circRNA circFN1 on the sorafenib chemosensitivity of HCC and demonstrate the regulatory mechanism of the miR-1205/E2F1 signaling pathway. Our results indicate that upregulated circFN1 could increase the sorafenib resistance of HCC cells. circFN1 can function as a molecular sponge of miR-1205, which weakens the inhibitory effect of miRNA on the downstream target gene E2F1. Moreover, the dual-luciferase reporter system and RIP assay validated the direct interaction of circFN1, miR-1205, and E2F1. These results suggested that circFN1 may have the potential to regulate the sorafenib resistance of HCC, in turn promoting the progression of HCC.
In the last decade, improved drug therapy agents have significantly prolonged the survival of HCC patients with advanced diseases. Sorafenib, an oral multikinase inhibitor, was initially demonstrated to suppress proliferation and angiogenesis by targeting BRAF, Raf-1, Flt3, VEGFR-2/3, and PDGFR-β.13,14 As an FDA-approved standard targeted therapy agent for HCC, sorafenib showed survival benefits in advanced HCC patients worldwide.15 However, most patients eventually progressed to drug-resistant diseases and may result in a poor prognosis. The mechanisms involved in sorafenib resistance of HCC are complex. Until now, however, the precise mechanisms underlying HCC drug resistance remained to be investigated.
circRNA together with miRNA and long noncoding RNA (lncRNA) are the most explored noncoding RNAs (ncRNAs) in the past years.16 circRNA is characterized by a covalently closed loop and has no capacity to code protein.17 Recent studies have proven that circRNA participates in various physiological and pathological processes, including cellular differentiation, proliferation, death, angiogenesis, and metabolic stress responses.18 Dysregulated circRNAs act as oncogenes or tumor suppressors in the development and progression of many cancers, including HCC.19, 20, 21 Emerging evidence indicates that multiple miRNAs and lncRNAs are involved in sorafenib resistance.22,23 In contrast, few circRNAs have been found to be participants in sorafenib resistance of HCC. Interestingly, significantly altered expressions of circRNAs have been found in a variety of drug-resistant HCC cells compared to those in drug-sensitive cells, suggesting that prediction of efficacy of different drugs using various circRNAs may promote individualized HCC therapy.24
In recent years, the growing popularity of high-throughput sequencing technology has enabled researchers to further investigate the expression and action mechanism of circRNA. Using a circRNA microarray assay, we analyzed aberrantly expressed circRNAs between a sorafenib-resistant cell line (SR-HepG2) and the parent HepG2 cells. Results showed that 416 circRNAs were significantly upregulated and 332 circRNAs were significantly downregulated between sorafenib-sensitive and sorafenib-resistant cells of HCC. Then, we demonstrated that circFN1 was upregulated in HCC tissues and associated with sorafenib resistance in HCC. To further validate whether circFN1 was functionally required for sorafenib resistance, we performed loss-of-function studies by knockdown of circFN1 in two sorafenib-resistant cell lines (SR-HepG2 and SR-Huh7). Meanwhile, we overexpressed circFN1 in sorafenib-sensitive HCC cells. Loss-of-function experiments revealed that knockdown of circFN1 promoted sorafenib-induced cell apoptosis and inhibited cell proliferation of sorafenib-resistant cells under sorafenib treatment. Gain-of-function experiments revealed that ectopic expression of circFN1 promoted proliferation and inhibited apoptosis of sorafenib-sensitive cells, compared with NC-transfected cells. In addition, xenograft experiments revealed that inhibition of circFN1 sensitized HCC cells to sorafenib in vivo.
It is well established that circRNA could act as a ceRNA to inhibit the miRNA biological functions by interfering with the binding of miRNA to target mRNA.25,26 In this study, we identified circFN1 as a new interactive molecule of miR-1205, and we also confirmed that E2F1 was the downstream target of miR-1205. In addition, a review of the literature suggested that E2F1 is closely involved in tumorigenesis; we therefore reasoned that E2F1 may be a downstream target of circFN1. To explore miRNAs targeted by circFN1, we used the miRanda analysis results and applied circRNAs in dual-luciferase reporter and RIP assays; ultimately, we found that circFN1 enhances the sorafenib resistance, mainly through interaction with miR-1205. We also confirmed that the expression of miR-1205 was obviously decreased in sorafenib-resistant cells than that in sorafenib-sensitive cells, indicating the opposite result to circFN1 expression. Next, we verified that circFN1 had an endogenous sponge-like effect on miR-1205 in HCC. First, bioinformatics prediction and a luciferase reporter assay showed that circFN1 and the E2F1 3ʹ UTR share identical miR-1205 response elements and might therefore bind competitively to miR-1205. Second, circFN1 could bind directly to miR-1205 in an AGO2-dependent manner. Third, knockdown or overexpression of circFN1 did not significantly affect miR-1205 expression, and miR-1025 mimics reversed circFN1-mediated sorafenib-resistant effects. Finally, circFN1 could control the E2F1 level by provoking miR-1205. However, the miRNAs investigated in this study were predicted and selected by computational algorithms, which may be incomplete and require further investigation.
Taken together, circFN1 is a novel key regulator of the miR-1205/E2F1 pathway and mediates sorafenib resistance in HCC cells. circFN1 competes with the 3′ UTR of E2F1 for binding with miR-1205, and it mediates sorafenib resistance in HCC cells. The finding that the circFN1/miR-1205/E2F1 signaling pathway is involved in sorafenib resistance may provide novel strategies to overcome sorafenib resistance in HCC.
Materials and Methods
HCC Samples
We obtained 64 paired HCC tissues and ANTs from the Department of Special Treatment I and Liver Transplantation, Shanghai Eastern Hepatobiliary Surgery Hospital. Samples from patients who had received chemotherapy or radiotherapy before collection were excluded. Written consent approving the use of HCC tissues in our study were obtained from each patient. The histopathological diagnosis was based on the World Health Organization (WHO) criteria. Ethical approval was obtained from the Shanghai Eastern Hepatobiliary Surgery Hospital Research Ethics Committee, and written informed consent was obtained from each patient. Consent forms will be provided upon request.
Cell Lines
HCC cell lines HepG2, Huh-7, and the normal human liver cell line LO2 were purchased from the Chinese Academy of Sciences Cell Bank Type Culture Collection. The cells were cultured with DMEM and RPMI 1640 (Gibco, Carlsbad, CA, USA) together with 10% fetal bovine serum (Gibco) at 37°C in an atmosphere containing 5% CO2. SR-HepG2 and SR-Huh7 cells were prepared according to the method previously described.27
Microarray Analysis
Total RNA was extracted from HepG2 and SR-HepG2 cell samples using an RNeasy mini kit (Qiagen, Hilden, Germany) according to the manufacturer’s instructions. Purified total RNA was quantified using the NanoDrop 2000 spectrophotometer. The total RNA was sent to Aksomics (Shanghai, China) to analyze circRNA expression profiles. Differentially expressed circRNAs were identified as FC >2 and an adjusted p value <0.05.
RNA Preparation and Quantitative Real-Time PCR
Total RNA extraction and quantification, RNA purification, and cDNA synthesis were conducted as described previously. For RNase R treatment, 2 μg of total RNA was incubated for 15 min at 37°C with or without 3 U/μg RNase R (Epicenter Technologies, WI, USA). To detect RNA expression, quantitative real-time PCR was performed with PowerUp SYBR Green master mix (Thermo Fisher Scientific, MA, USA) and the Applied Biosystems StepOnePlus real-time PCR detection system (Life Technologies, CA, USA). The relative gene expression was calculated using the 2−ΔCT method normalized to GAPDH, and the FC of gene expression was calculated by the 2−ΔΔCT method. Bulge-Loop miRNA quantitative real-time PCR primer sets (one reverse transcriptase [RT] primer and a pair of qPCR primers for each set) specific for miR-1205 were designed by RiboBio (Guangzhou, China). The relative expression of miR-1205 was normalized to human U6 small nuclear RNA (snRNA).
siRNA and Plasmid Construction and Cell Transfection
The siRNAs were provided by Life Technologies. The miRNA mimics and primers were provided by RiboBio. The full-length cDNA of human circFN1 was synthesized by Invitrogen and cloned into the expression vector pCDNA3.1 (Clontech Laboratories). The final construct was verified by sequencing. Plasmid vectors for transfection were prepared using DNA midi-prep kits (E.Z.N.A Endo-Free Plasmid Mini Kit II) and transfected into cells using Lipofectamine 3000 (Invitrogen). The siRNAs and miRNA mimic were transfected into cells using RNAiMAX (Invitrogen) according to the manufacturer’s instructions.
Actinomycin D and RNase R treatment
To block transcription, 2 mg/mL actinomycin D or dimethyl sulfoxide (Sigma-Aldrich, St. Louis, MO, USA) as an NC was added into the cell culture medium. For RNase R treatment, total RNA (2 μg) was incubated for 30 min at 37°C with or without 3 U/μg of RNase R (Epicenter Technologies, Madison, WI, USA). After treatment with actinomycin D and RNase R, quantitative real-time PCR was performed to determine the expression levels of circFN1 and FN1 mRNA.
Cell Fractionation Assay
Cytoplasmic and nuclear RNA was acquired using a cytoplasmic and nuclear RNA purification kit (Invitrogen, CA, USA). Briefly, the cells were harvested and incubated for 10 min with lysis solution on ice. The cells were then centrifuged for 3 min at 12,000 × g. The supernatant was collected for cytoplasmic RNA and the nuclear pellet was used for nuclear RNA extraction. GAPDH was used as the cytoplasmic endogenous control. The U6 small nuclear RNA was used as the nuclear endogenous control.
Cell Viability Assay
Cells were seeded at a density of 2 × 10³ cells per well (100 μL) in a 96-well plate. Cell viability was evaluated with the CCK-8 (Bimake, Shanghai, China) after 0, 24, 48, 72, and 96 h of transfection. The absorbance was determined with a BioTek Synergy HTX multi-mode reader at 450 nm.
Flow Cytometry Assay
After transfection for 48 h, the cells were collected for apoptosis assays. The apoptosis assays were performed with an apoptosis detection kit (BD Pharmingen, CA, USA) by suspending the cells in 100 μL of binding buffer containing 5 μL of phycoerythrin (PE) and 5 μL of 7-aminoactinomycin D (7-ADD), incubating them in the dark for 15 min, and adding 400 μL of binding buffer to resuspend the cells. The cells were divided into viable cells, dead cells, early apoptotic cells, and late apoptotic cells. The early and late apoptotic cells were measured. The cells were analyzed by flow cytometry (FACSCalibur flow cytometer, BD Biosciences, USA) to quantify the cell apoptosis. All experiments were performed independently in triplicate.
Tumor Xenograft Model
Six-week-old male BALB/c athymic nude mice (n = 5 per group) were purchased from the Shanghai Experimental Animal Center (Shanghai, China). Mice were subcutaneously injected into the back with 1 × 10⁶ SR-HepG2 cells transfected with si-circFN1 or si-NC suspended in 100 μL of Hanks’ balanced salt solution. After 6 days of injection, mice were intraperitoneally administered phosphate-buffered solution (PBS) or 20 mg/kg sorafenib once daily for 4 weeks. According to the treatment, the tumors on the mice were actually assigned to the following groups: group 1, si-circFN1-transfected cells + sorafenib; group 2, si-circFN1-transfected cells + NS; group 3, si-NC-transfected cells + sorafenib; and group 4, si-NC-transfected cells + NS. The tumor size was measured every 3 days with a caliper, and tumor volume was calculated according to the following formula: volume = (length × width2)/2. All mice were sacrificed on day 21 after inoculation. The resected tumor masses were harvested for subsequent weight and quantitative real-time PCR analyses. The animal experiments were approved by the Animal Care and Use Committee of Shanghai Eastern Hepatobiliary Surgery Hospital and were performed in accordance with the Institutional Guide for the Care and Use of Laboratory Animals.
Ki-67 Staining
The excised tumor tissue specimens were put in formalin, fixed, and paraffin-embedded. After deparaffinization and rehydration, tissues were incubated with antibody against Ki-67 (Santa Cruz Biotechnology, Dallas, TX, USA) at 4°C all night. Tissues were stained with diaminobenzidine (DAB) and observed under light microscopy.
Biotin-Coupled miRNA Capture
Briefly, the 30 end biotinylated miR-RNA mimic or control biotin-RNA (RiboBio) was transfected into SPC-A1 cells at a final concentration of 20 nmol/L for 1 day. The biotin-coupled RNA complex was pulled down by incubating the cell lysate with streptavidin-coated magnetic beads (Ambion, Life Technologies). The abundance of circFN1 and E2F7 in bound fractions was evaluated by quantitative real-time PCR analysis.
Dual-Luciferase Assay
To construct luciferase reporter vectors, the full length of circFN1 or the 3′ UTR fragment of E2F1 were cloned into the dual-luciferase reporter vector psiCHECK-2 (Promega, WI, USA), and the potential binding sites of miR-1205 were mutated. The above WT or MUT plasmids were co-transfected with miR-1205 mimics or miR-NC into cells. Luciferase assays were performed 48 h after transfection using a Dual-Luciferase reporter gene assay kit (Promega, Madison, WI, USA). The firefly luciferase activity was normalized to Renilla luciferase activity, and the relative luciferase activity in each group was obtained by normalizing the value of firefly luciferase activity/Renilla luciferase activity to that of the NC-transfected group.
RIP Assay
Briefly, cells were fixed with formaldehyde, lysed with lysis buffer, and sonicated. The supernatant was collected and incubated with a circRNA-specific probes Dynabeads (Invitrogen) mixture overnight at 30°C. On the next day, the Dynabeads was washed and incubated with 200 μL of lysis buffer. Finally, RNA was extracted from these complexes and used for qPCR.
In Vivo Precipitation of circRNAs
circFN1-overexpressing cells were washed with ice-cold PBS, fixed with 1% formaldehyde, lysed in 500 μL of coimmunoprecipitation (coIP) buffer, sonicated, and centrifuged. The supernatant was then added to a probes-M280 streptavidin Dynabeads (Invitrogen) mixture and further incubated at 30°C for 12 h. After that, to reverse the formaldehyde crosslinking, the probes-Dynabeads-circRNAs mixture was washed and incubated with 200 μL of lysis buffer and proteinase K. Subsequently, the RNA was extracted from the mixture using TRIzol reagent (Invitrogen).
Western Blotting
The proteins were extracted using a total protein extraction kit (Thermo Fisher Scientific, MA, USA). The protein extracts (30–40 μg) were separated on 12% sodium dodecyl sulfate-polyacrylamide gel electrophoresis gels and then electrophoretically transferred to polyvinylidene fluoride membranes (Millipore, USA). After blocking in 5% non-fat milk for 2 h, the membranes were incubated overnight at 4°C with primary antibodies recognizing PTEN (1:1,000 dilution; Cell Signaling Technology), AKT (1:1,000 dilution; Cell Signaling Technology), phosphorylated Akt (p-Akt, 1:1,000 dilution; Cell Signaling Technology), E2F1 (1:1,000 dilution; Abcam, UK), and GAPDH (1:10,000 dilution; Proteintech, USA). After incubation with secondary antibodies (1:5,000 dilution; Jackson ImmunoResearch, PA, USA), the protein bands were visualized by chemiluminescence using a GE Amersham Imager 600 (GE Healthcare, USA).
TCGA Dataset Analysis
The data and the corresponding clinical information of patients were collected from TCGA database (https://www.cancer.gov/about-nci/organization/ccg/research/structural-genomics/tcga). We used the edgeR package of R packages to perform the difference analysis (https://bioconductor.org/packages/release/bioc/html/edgeR.html) and used the pheatmap package of R packages to perform the cluster analysis (https://cran.r-project.org/web/packages/pheatmap/index.html). The Sva R package was used to remove the batch effect. Genes with adjusted p values <0.05 and absolute FCs >1.5 were considered differentially expressed genes. Kaplan-Meier survival curves were drawn to analyze the relationships between genes and overall survival in the survival package. The corresponding statistical analysis and graphics were performed in R software (R version 3.3.2).
Statistical Analysis
All data were processed by GraphPad Prism version 5 software (GraphPad, San Diego, CA, USA). All experiments were performed in triplicate, and the results are presented as the mean value ± standard deviation. Differences between groups were determined by a paired two-tailed t test. One-way ANOVA or the nonparametric Kruskal-Wallis test was used to evaluate the relationship between circFN1 levels and other features.
Author Contributions
C.Y. and M.X. designed primers and performed experiments. Z.D. and H.H. contributed to the flow cytometry assay and animal experiments. B.D. and F.S. collected and classified the human tissue samples. L.G., J.L., and J.Y. contributed to real-time PCR and quantitative real-time PCR. C.Y. and C.S. analyzed the data. C.S. and M.X. wrote the paper. All authors read and approved the final manuscript.
Conflicts of Interest
The authors declare no competing interests.
Acknowledgments
This work was supported by the Natural Science Foundation of Shanghai (17ZR1438000).
Footnotes
Supplemental Information can be found online at https://doi.org/10.1016/j.omtn.2020.08.039.
Contributor Information
Chengjun Sui, Email: suichengjun1978@163.com.
Minhui Xu, Email: shanxijunli@163.com.
Supplemental Information
References
- 1.Lim I.I., Farber B.A., LaQuaglia M.P. Advances in fibrolamellar hepatocellular carcinoma: a review. Eur. J. Pediatr. Surg. 2014;24:461–466. doi: 10.1055/s-0034-1396420. [DOI] [PubMed] [Google Scholar]
- 2.Clark T., Maximin S., Meier J., Pokharel S., Bhargava P. Hepatocellular carcinoma: review of epidemiology, screening, imaging diagnosis, response assessment, and treatment. Curr. Probl. Diagn. Radiol. 2015;44:479–486. doi: 10.1067/j.cpradiol.2015.04.004. [DOI] [PubMed] [Google Scholar]
- 3.Torre L.A., Bray F., Siegel R.L., Ferlay J., Lortet-Tieulent J., Jemal A. Global cancer statistics, 2012. CA Cancer J. Clin. 2015;65:87–108. doi: 10.3322/caac.21262. [DOI] [PubMed] [Google Scholar]
- 4.Harding J.J., El Dika I., Abou-Alfa G.K. Immunotherapy in hepatocellular carcinoma: primed to make a difference? Cancer. 2016;122:367–377. doi: 10.1002/cncr.29769. [DOI] [PubMed] [Google Scholar]
- 5.Chen K.F., Chen H.L., Tai W.T., Feng W.C., Hsu C.H., Chen P.J., Cheng A.L. Activation of phosphatidylinositol 3-kinase/Akt signaling pathway mediates acquired resistance to sorafenib in hepatocellular carcinoma cells. J. Pharmacol. Exp. Ther. 2011;337:155–161. doi: 10.1124/jpet.110.175786. [DOI] [PubMed] [Google Scholar]
- 6.Cheng A.L., Kang Y.K., Chen Z., Tsao C.J., Qin S., Kim J.S., Luo R., Feng J., Ye S., Yang T.S. Efficacy and safety of sorafenib in patients in the Asia-Pacific region with advanced hepatocellular carcinoma: a phase III randomised, double-blind, placebo-controlled trial. Lancet Oncol. 2009;10:25–34. doi: 10.1016/S1470-2045(08)70285-7. [DOI] [PubMed] [Google Scholar]
- 7.Ashwal-Fluss R., Meyer M., Pamudurti N.R., Ivanov A., Bartok O., Hanan M., Evantal N., Memczak S., Rajewsky N., Kadener S. circRNA biogenesis competes with pre-mRNA splicing. Mol. Cell. 2014;56:55–66. doi: 10.1016/j.molcel.2014.08.019. [DOI] [PubMed] [Google Scholar]
- 8.Qu S., Yang X., Li X., Wang J., Gao Y., Shang R., Sun W., Dou K., Li H. Circular RNA: a new star of noncoding RNAs. Cancer Lett. 2015;365:141–148. doi: 10.1016/j.canlet.2015.06.003. [DOI] [PubMed] [Google Scholar]
- 9.Hansen T.B., Kjems J., Damgaard C.K. Circular RNA and miR-7 in cancer. Cancer Res. 2013;73:5609–5612. doi: 10.1158/0008-5472.CAN-13-1568. [DOI] [PubMed] [Google Scholar]
- 10.Zheng Q., Bao C., Guo W., Li S., Chen J., Chen B., Luo Y., Lyu D., Li Y., Shi G. Circular RNA profiling reveals an abundant circHIPK3 that regulates cell growth by sponging multiple miRNAs. Nat. Commun. 2016;7:11215. doi: 10.1038/ncomms11215. [DOI] [PMC free article] [PubMed] [Google Scholar]
- 11.Han D., Li J., Wang H., Su X., Hou J., Gu Y., Qian C., Lin Y., Liu X., Huang M. Circular RNA circMTO1 acts as the sponge of microRNA-9 to suppress hepatocellular carcinoma progression. Hepatology. 2017;66:1151–1164. doi: 10.1002/hep.29270. [DOI] [PubMed] [Google Scholar]
- 12.Yu L., Gong X., Sun L., Zhou Q., Lu B., Zhu L. The circular RNA Cdr1as act as an oncogene in hepatocellular carcinoma through targeting miR-7 expression. PLoS ONE. 2016;11:e0158347. doi: 10.1371/journal.pone.0158347. [DOI] [PMC free article] [PubMed] [Google Scholar] [Retracted]
- 13.Yu C., Bruzek L.M., Meng X.W., Gores G.J., Carter C.A., Kaufmann S.H., Adjei A.A. The role of Mcl-1 downregulation in the proapoptotic activity of the multikinase inhibitor BAY 43-9006. Oncogene. 2005;24:6861–6869. doi: 10.1038/sj.onc.1208841. [DOI] [PubMed] [Google Scholar]
- 14.Sonntag R., Gassler N., Bangen J.M., Trautwein C., Liedtke C. Pro-apoptotic sorafenib signaling in murine hepatocytes depends on malignancy and is associated with PUMA expression in vitro and in vivo. Cell Death Dis. 2014;5:e1030. doi: 10.1038/cddis.2013.557. [DOI] [PMC free article] [PubMed] [Google Scholar]
- 15.Shen Y.C., Lin Z.Z., Hsu C.H., Hsu C., Shao Y.Y., Cheng A.L. Clinical trials in hepatocellular carcinoma: an update. Liver Cancer. 2013;2:345–364. doi: 10.1159/000343850. [DOI] [PMC free article] [PubMed] [Google Scholar]
- 16.Memczak S., Jens M., Elefsinioti A., Torti F., Krueger J., Rybak A., Maier L., Mackowiak S.D., Gregersen L.H., Munschauer M. Circular RNAs are a large class of animal RNAs with regulatory potency. Nature. 2013;495:333–338. doi: 10.1038/nature11928. [DOI] [PubMed] [Google Scholar]
- 17.Li Y., Hu J., Li L., Cai S., Zhang H., Zhu X., Guan G., Dong X. Upregulated circular RNA circ_0016760 indicates unfavorable prognosis in NSCLC and promotes cell progression through miR-1287/GAGE1 axis. Biochem. Biophys. Res. Commun. 2018;503:2089–2094. doi: 10.1016/j.bbrc.2018.07.164. [DOI] [PubMed] [Google Scholar]
- 18.Xu N., Chen S., Liu Y., Li W., Liu Z., Bian X., Ling C., Jiang M. Profiles and bioinformatics analysis of differentially expressed Circrnas in Taxol-resistant non-small cell lung cancer cells. Cell. Physiol. Biochem. 2018;48:2046–2060. doi: 10.1159/000492543. [DOI] [PubMed] [Google Scholar]
- 19.Lin T., Dai Y., Guo X., Chen W., Zhao J., Cao L., Wu Z. Silencing of hsa_circ_0008450 represses hepatocellular carcinoma progression through regulation of microRNA-214-3p/EZH2 axis. Cancer Manag. Res. 2019;11:9133–9143. doi: 10.2147/CMAR.S222716. [DOI] [PMC free article] [PubMed] [Google Scholar]
- 20.Liu L., Yang X., Li N.F., Lin L., Luo H. circ_0015756 promotes proliferation, invasion and migration by microRNA-7-dependent inhibition of FAK in hepatocellular carcinoma. Cell Cycle. 2019;18:2939–2953. doi: 10.1080/15384101.2019.1664223. [DOI] [PMC free article] [PubMed] [Google Scholar]
- 21.Qiao G.L., Chen L., Jiang W.H., Yang C., Yang C.M., Song L.N., Chen Y., Yan H.L., Ma L.J. hsa_circ_0003998 may be used as a new biomarker for the diagnosis and prognosis of hepatocellular carcinoma. OncoTargets Ther. 2019;12:5849–5860. doi: 10.2147/OTT.S210363. [DOI] [PMC free article] [PubMed] [Google Scholar]
- 22.Wei L., Wang X., Lv L., Liu J., Xing H., Song Y., Xie M., Lei T., Zhang N., Yang M. The emerging role of microRNAs and long noncoding RNAs in drug resistance of hepatocellular carcinoma. Mol. Cancer. 2019;18:147. doi: 10.1186/s12943-019-1086-z. [DOI] [PMC free article] [PubMed] [Google Scholar]
- 23.Ding B., Lou W., Xu L., Fan W. Non-coding RNA in drug resistance of hepatocellular carcinoma. Biosci. Rep. 2018;38 doi: 10.1042/BSR20180915. BSR20180915. [DOI] [PMC free article] [PubMed] [Google Scholar]
- 24.Luo Y., Fu Y., Huang R., Gao M., Liu F., Gui R., Nie X. circRNA_101505 sensitizes hepatocellular carcinoma cells to cisplatin by sponging miR-103 and promotes oxidored-nitro domain-containing protein 1 expression. Cell Death Discov. 2019;5:121. doi: 10.1038/s41420-019-0202-6. [DOI] [PMC free article] [PubMed] [Google Scholar]
- 25.Cheng Z., Yu C., Cui S., Wang H., Jin H., Wang C., Li B., Qin M., Yang C., He J. circTP63 functions as a ceRNA to promote lung squamous cell carcinoma progression by upregulating FOXM1. Nat. Commun. 2019;10:3200. doi: 10.1038/s41467-019-11162-4. [DOI] [PMC free article] [PubMed] [Google Scholar]
- 26.Zhang J., Liu H., Hou L., Wang G., Zhang R., Huang Y., Chen X., Zhu J. Circular RNA_LARP4 inhibits cell proliferation and invasion of gastric cancer by sponging miR-424-5p and regulating LATS1 expression. Mol. Cancer. 2017;16:151. doi: 10.1186/s12943-017-0719-3. [DOI] [PMC free article] [PubMed] [Google Scholar]
- 27.Pogribny I.P., Rusyn I. Role of epigenetic aberrations in the development and progression of human hepatocellular carcinoma. Cancer Lett. 2014;342:223–230. doi: 10.1016/j.canlet.2012.01.038. [DOI] [PMC free article] [PubMed] [Google Scholar]
Associated Data
This section collects any data citations, data availability statements, or supplementary materials included in this article.