Abstract
Purpose
To provide a detailed characterization of choroideremia (CHM) using fluorescence lifetime imaging ophthalmoscopy (FLIO) and to provide a deeper understanding of disease-related changes and progression.
Methods
Twenty-eight eyes of 14 patients with genetically confirmed CHM (mean age, 28 ± 14 years) and 14 age-matched healthy subjects were investigated in this study. FLIO images of a 30° retinal field were collected at the Moran Eye Center using a Heidelberg Engineering FLIO device. FLIO lifetimes were recorded in short spectral channels (SSC; 498–560 nm) and long spectral channels (LSC; 560–720 nm), and mean autofluorescence lifetimes (τm) were calculated. Optical coherence tomography (OCT) scans were recorded for each patient. Three patients were re-imaged after a year.
Results
Patients with CHM exhibit specific FLIO lifetime patterns. Prolonged FLIO lifetimes (around 600–700 ps) were found in the peripheral macula corresponding to atrophy in OCT imaging. In the central macula, τm was unrelated to autofluorescence intensity. Some areas of persistent retinal pigment epithelial islands had prolonged FLIO lifetimes, whereas other areas of hypofluorescence had short FLIO lifetimes. At 1-year follow-up, FLIO lifetimes were significantly prolonged within atrophic areas (P < 0.05).
Conclusions
FLIO shows distinct patterns in patients with CHM, indicating lesions of atrophy and areas of preserved function in the presence or absence of findings in fundus autofluorescence intensity images. FLIO may provide differentiated knowledge about pathophysiology and atrophy progression in CHM compared to conventional imaging modalities.
Translational Relevance
FLIO shows distinctive lifetime patterns that potentially identify areas of function, atrophy, and disease progression in patients with CHM.
Keywords: FLIO, fluorescence lifetime imaging, choroideremia, inherited retinal diseases
Introduction
Choroideremia (CHM) is a rare progressive retinal dystrophy that causes night blindness, peripheral vision loss, and diminished central vision later in life as peripheral atrophy widens.1 CHM is characterized by atrophy of the retinal pigment epithelium (RPE), choroid, and photoreceptor layers. The disease predominantly affects males due to its recessive X-linked inheritance pattern, with an estimated prevalence of 1:50,000.1
The CHM gene, localized on chromosome Xq21.2, encodes for the ubiquitously expressed Rab escort protein 1 (REP1).2 REP1 falls under a class of guanosine triphosphate-binding proteins that are necessary for membrane association and target protein recognition.3 In addition, REP1 is heavily involved in intracellular trafficking of proteins, small substrates, and various organelles.4 Mutations in the CHM gene subsequently alter the function of REP1, causing degeneration in cellular structure, transport, and stability. The mechanism of disease pathophysiology remains unclear, as it is uncertain whether the RPE, choroid, or photoreceptor layers are affected first or simultaneously; however, it has been suggested that the RPE may be affected first, leading to retinal disturbances and to the formation of retinal tubulations.5 Studies have suggested that the severity of the CHM phenotype may be due to the level of disruption in REP1 intracellular trafficking, such as phagocytosis, secretion, vesicle transport, and neurotransmission.6 However, a genotype–phenotype correlation has not been found, despite extensive research on large cohorts.7,8
A range of multimodal imaging techniques, including optical coherence tomography (OCT), optical coherence tomography angiography (OCT-A), fundus autofluorescence (FAF) intensity imaging, color fundus photography, and fluorescein angiography, have been utilized to assess structural, functional, and visual damage of individuals affected with CHM. FAF intensity imaging provides information on the distribution of lipofuscin, which is predominantly localized in the RPE. A buildup of lipofuscin and other visual cycle byproducts typically leads to cell death and atrophy, which can be seen as demarcated hypofluorescent lesions within the peripheral retina. In contrast, hyperfluorescent areas may indicate preserved retinal tissue, also known as RPE islands. These islands in the temporal and central macular area are likely due to a difference in rod–cone ratios.9 Color fundus photography highlights peripapillary and peripheral pigmentary changes in patients with CHM, whereas OCT imaging describes retinal thinning and structural changes. In addition, progressive ellipsoid zone and RPE loss in conjunction with a decrease in choroidal thickness is a common finding in CHM disease progression. OCT-A shows an association of choriocapillaris atrophy with RPE degeneration,10 and fluorescein angiography highlights large irregular patches of RPE atrophy.11
Fluorescence lifetime imaging ophthalmoscopy (FLIO) was developed in 2002 by Schweitzer and coworkers12,13 and is based on the technique of fluorescence lifetime imaging microscopy (FLIM), which is used for investigating metabolic changes in biological tissue.14–16 FLIO is the first application of in vivo ophthalmic fluorescence lifetime imaging, and it may potentially show metabolic and nutritional changes in the human retina.17–19 FLIO may also indicate areas of disease localization even before irreversible damage manifests. Early FLIO lifeetime changes have been detected in Stargardt disease, patients with macular telangiectasia type 2 (MacTel), and patients who may develop retinal toxicity due to hydroxychloroquine (Plaquenil) supplementation.20–24 Recently, early retinal changes in family members of patients with MacTel were found with FLIO.24 Several other diseases, such as age-related macular degeneration (AMD), diabetic retinopathy, and Alzheimer disease, similarly exhibit altered FLIO lifetimes in early disease stages.20,25–31
Using FLIO to investigate CHM may enhance the understanding of the disease and aid in explaining molecular processes in the retina and choroid. Although conventional fluoresence imaging techniques are efffective for describing specific changes in the retina of patients with CHM, they often capture only the altered fluoresence of lipofuscin due to its high fluoresence. FLIO may increase the knowledge about whether distinct retinal areas are affected differently and may reveal new ways to approach and target the disease. This knowledge may help us to understand early changes and disease progression, which may be of great importance in the diagnosis and management of CHM. This study seeks to provide a more detailed characterization of CHM using FLIO, as well as a deeper understanding of disease changes and progression.
Methods
This cross-sectional and, in part, longitudinal study was conducted at the John A. Moran Eye Center of the University of Utah in Salt Lake City. It was approved by the University of Utah Institutional Review Board and adheres to the tenets of the Declaration of Helsinki. Patients were examined and diagnosed with CHM by a retinal specialist and also met with a genetic counselor. Genetic testing by Clinical Laboratory Improvement Amendments (CLIA)-approved clinical testing laboratories was performed on all patients to confirm the diagnosis of CHM. All patients were referred from the retina clinic, and informed written consent was obtained prior to any investigations. All measurements were performed between June 2017 and January 2020.
Study Protocol and Image Acquisition
Intraocular pressure was measured with a Tono-Pen (Reichert Technologies, Depew, NY), and pupils were dilated. FLIO and Spectralis OCT (Heidelberg Engineering, Heidelberg, Germany) measurements were performed on each patient. The principles of image acquisition and laser safety of FLIO have been described elsewhere.12,18,32,33 Briefly, FLIO relies on the principle of time-correlated single photon counting.12,34 A 30° field centered at the fovea was imaged, where fluorescence was excited using a 473-nm pulsed laser with a repetition rate of 80 MHz. Photons were detected in two separate spectral wavelength ranges, a short spectral channel (SSC; 498–560 nm) and a long spectral channel (LSC; 560–720 nm). A minimal signal threshold of 1000 photons per pixel was set to ensure sufficient image quality. Fluorescence data were analyzed using the software SPCImage 4.4.2 (Becker & Hickl GmbH, Berlin, Germany). The amplitude-weighted mean autofluorescence lifetime (τm) was used for further analysis. Additional details may be found elsewhere.18,34 SPCImage and FLIMX were used to analyze and illustrate FLIO lifetimes.35 The FLIMX software is documented and freely available for download online under the open source BSD license (http://www.flimx.de).
Areas of Interest
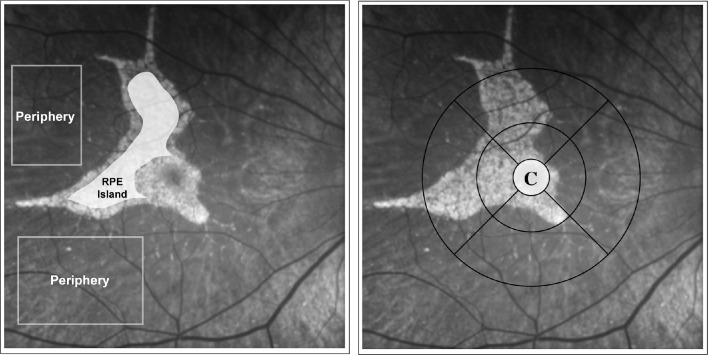
Different areas of interest were defined by manually drawing masks on areas of hyperfluoresence and hypofluorescence in FAF intensity images. Atrophic areas were outlined and manually masked by referring to areas of hypertransluminance on OCT B-scans. These areas, as well as other areas of interest, were demarcated within the en face infrared reflectance image that is routinely obtained with the Spectralis OCT. All areas were created as masks on the autofluorescence intensity images, which were superimposed on the FLIO measurements. FLIO was not used to make any segmentation. The Early Treatment Diabetic Retinopathy Study (ETDRS) grid was used to delineate the central and peripheral areas for macular pigment and peripheral fluoresence lifetime signal detection. Figure 2 shows the peripheral and central RPE island regions of interest used for quantifying mean lifetimes in CHM patients.
Figure 2.
Peripheral and central RPE island regions of interest used for quantifying mean lifetimes in CHM patients. Area C of the standard ETDRS grid was used to quantify mean fluoresence lifetimes of the cental area that is influnced by macular pigment.
En Face OCT for Outer Retinal Tubulation Distribution Mapping
En face OCT images were created to highlight the location of outer retinal tubulations (ORTs) in patients with CHM. OCTs of each patient, which consisted of 19 frames, were individually examined to manually mark the presence of ORTs. This resulting map of ORT distributions was subsequently overlayed onto FAF intensity and FLIO images.
Statistical Analysis
SPSS Statistics 21 (IBM, Armonk, NY) was used for all statistical analyses. To test for significant τm differences between regions in one eye, a t-test for paired samples was used. To compare FLIO lifetimes between CHM patients and healthy controls, a t-test for independent samples was used. A Pearson correlation was used to correlate FLIO lifetimes from the fovea with best-corrected visual acuity (BCVA). As the disease is bilateral, only the left eye of each patient was included for statistical analysis. Our data followed a normal distribution (checked with the Kolmogorov–Smirnov test), and all results are provided as means ± standard deviation (SD).
Results
Subjects
Twenty-eight eyes of 14 subjects with CHM (mean age, 28 ± 14 years; range, 10–54 years) and 14 eyes from 14 age-matched healthy subjects (mean age, 28 ± 14 years; range, 10–54 years) were imaged. All patients with CHM were male, and all eyes had clear natural lenses. The age-matched healthy controls included five female and nine male subjects; sex does not influence FLIO lifetimes.36 All patients received genetic testing from CLIA-certified labs, using either Sanger sequencing or array comparative genomic hybridization. Further patient characteristics including genotypes can be found in Table 1.
Table 1.
Patient Characteristics
| Patient Number | Age (y) | Age of Onset (y) | Best-Corrected Visual Acuity | Gene Mutation |
|---|---|---|---|---|
| 1 | 17 | 12 | 20/20 (OD); 20/25 (OS) | 1 path variant: c.1138C>T, p.Gln380* |
| 2 | 30 | 21 | 20/20 (OD); 20/25 (OS) | 1 path variant: c.819G>T, p.Gln273His |
| 3 | 34 | 19 | 20/30 (OD); 20/25 (OS) | 1 path variant: c.1511-1G>A |
| 4 | 17 | 17 | 20/15 (OU) | 1 path variant: Gln3800*C>T |
| 5 | 19 | 18 | 20/15 (OD); 20/20 (OS) | 1 path variant: c.889A>T |
| 6 | 11 | 10 | 20/30 (OD); 20/50 (OS) | 1 path variant: c.799C>T, p.Arg267* |
| 7 | 45 | 30 | 20/50 (OU) | 1 path variant: c.116+1G>A |
| 8 | 32 | 25 | 20/20 (OU) | CHM deletion |
| 9 | 54 | 29 | 20/25 (OD); 20/150 (OS) | 1 path variant: c.1138C>T, p.Gln380* |
| 10 | 34 | 33 | 20/25 (OD); 20/20 (OS) | 1 path variant: Ser233Ter |
| 11 | 31 | 29 | 20/15 (OD); 20/25 (OS) | CHM deletion |
| 12 | 17 | 10 | 20/40 (OU) | 1 path variant: c.1138C>T, p.Gln380* |
| 13 | 10 | 10 | 20/20 (OU) | 1 path variant: c.1138C>T, p.Gln380* |
| 14 | 44 | 10 | 20/30 OU | 1 path variant: c.116+1G>A |
Patient characteristics of our patients with choroideremia, including genetic mutations within the CHM gene. Patients 1, 9, 12, and 13 were distantly related; the rest were unrelated. OD, right eye; OS, left eye; OU, both eyes.
FLIO Lifetimes in Patients with CHM
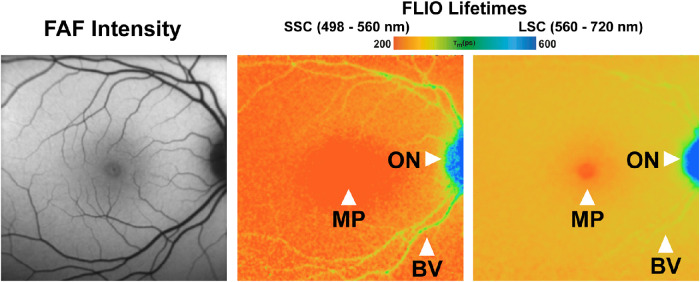
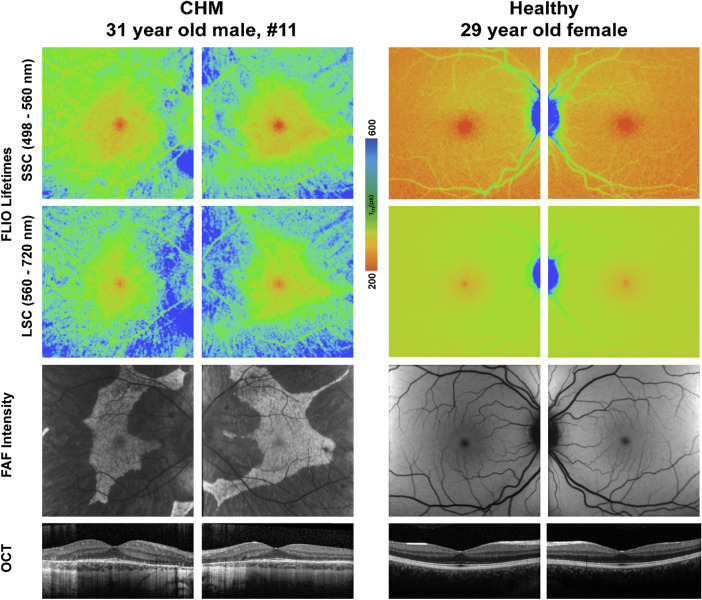
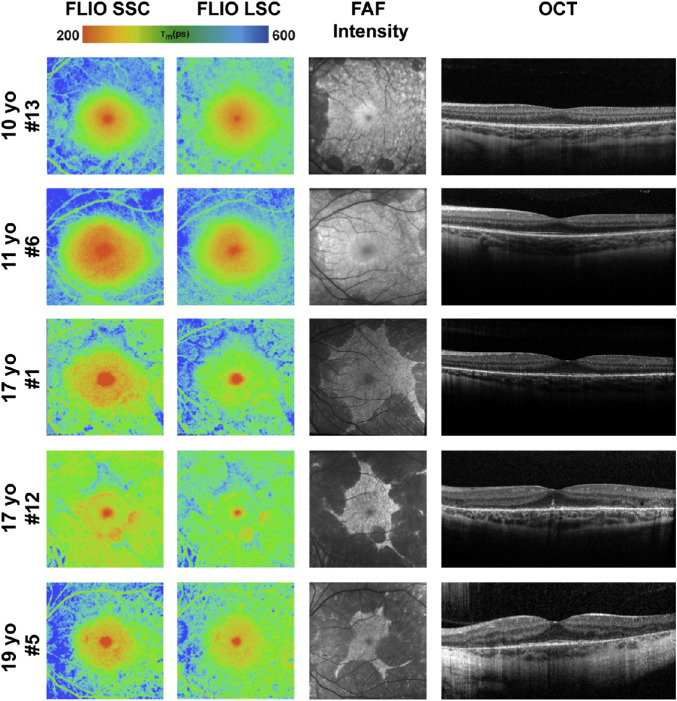
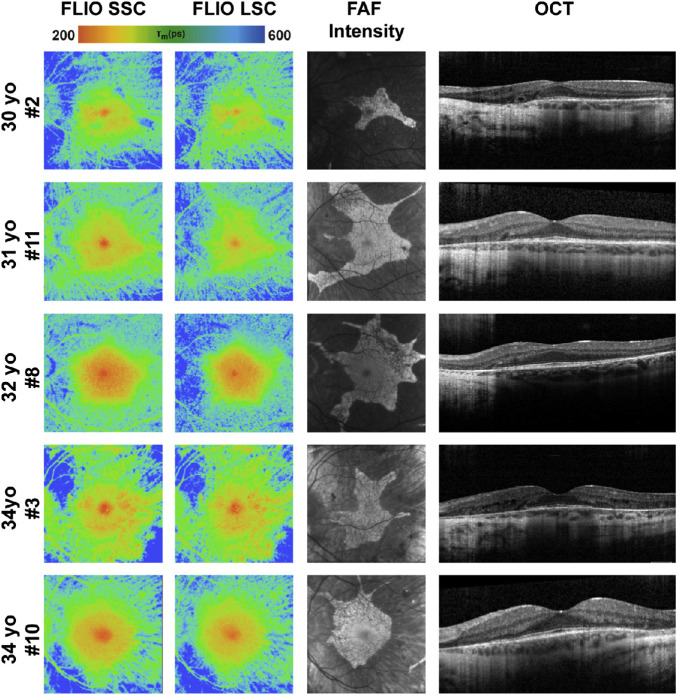
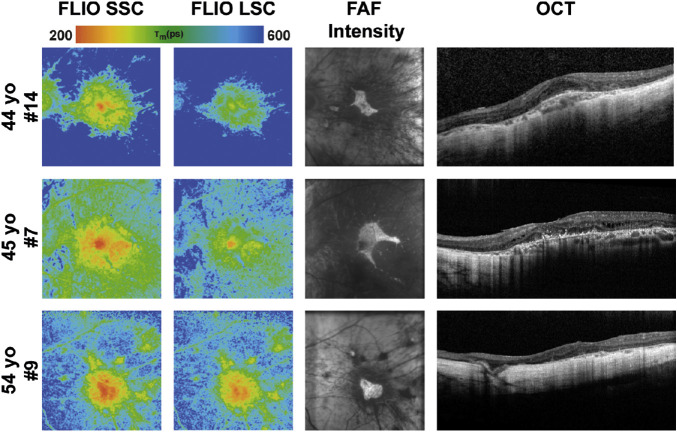
Patients with CHM show distinct FLIO patterns that can easily be distinguished from other retinal diseases, as well as healthy eyes. Figure 1 shows a typical FLIO pattern observed in heathy eyes with the shortest FLIO lifetimes in the fovea, corresponding to macular pigment, and longest lifetimes at the area of the optic disc. Figure 3 shows a typical eye from a patient with CHM compared to a healthy control. Phenotypically, the prolongation of FLIO lifetimes can be described as streaky. Figures 4, 5, and 6 illustrate how the FLIO lifetimes changed with advancing age. Overall, the FLIO lifetimes were significantly longer in patients with CHM compared to healthy subjects in all areas but the fovea. Full statistical analysis can be found in Table 2. In patients with CHM, areas of atrophy had the longest mean autofluorescence lifetimes (between 600 and 700 ps in both spectral channels) compared to a range of 150 to 250 ps in healthy control eyes (P < 0.001).
Figure 1.
FLIO of a healthy patient. Arrows indicate standard mean lifetimes that are influenced by macular pigment localization (MP), the optic nerve (ON), and retinal blood vessels (BV).
Figure 3.
FLIO lifetime, FAF intensity, and OCT images from one patient with CHM and one healthy subject. FLIO lifetimes are shown for the SSC and LSC.
Figure 4.
FLIO lifetime, FAF intensity, and OCT images from the left eyes of patients with CHM between the ages of 10 and 20 years. One additional patient, 17 years old, is shown in Figure 9, as he presented with a normal macula examination. FLIO lifetimes are shown for the SSC and LSC.
Figure 5.
FLIO lifetime, FAF intensity, and OCT images from the left eyes of all patients with CHM between the ages 20 and 40 years. FLIO lifetimes are shown for the SSC and LSC.
Figure 6.
FLIO lifetime, FAF intensity, and OCT images from the left eyes of all patients with CHM older than 40 years. FLIO lifetimes are shown for the SSC and LSC.
Table 2.
FLIO Lifetimes in Patients with CHM
| Variable | Healthy Controls (n = 14 Eyes) | CHM Patients (n = 14 Eyes) | P |
|---|---|---|---|
| Age (y), mean ± SD | 28 ± 14 | 28 ± 14 | 0.989 |
| Lifetimes (ps), mean ± SD | |||
| Fovea (area C) | |||
| SSC | 96 ± 32 | 153 ± 74 | <0.05* |
| LSC | 173 ± 39 | 222 ± 90 | 0.075 |
| Hyperfluorescent area (CHM)/IR (healthy) | |||
| SSC | 157 ± 42 | 283 ± 55 | <0.001* |
| LSC | 212 ± 38 | 349 ± 50 | <0.001* |
| Hypofluorescent area (CHM)/OR (healthy) | |||
| SSC | 183 ± 40 | 362 ± 84 | <0.001* |
| LSC | 232 ± 40 | 419 ± 64 | <0.001* |
| Atrophic area (CHM)/OR (healthy) | |||
| SSC | 183 ± 39 | 632 ± 209 | <0.001* |
| LSC | 232 ± 40 | 680 ± 198 | <0.001* |
Statistical analysis of FLIO lifetimes in patients with CHM compared to healthy controls. Areas C, IR, and OR correspond to the central circle, inner macular ring, and outer macular ring on the standardized ETDRS grid, respectively.
*Indicates significance. P < 0.05 was considered significant.
FLIO Lifetimes Compared to FAF Intensity Images
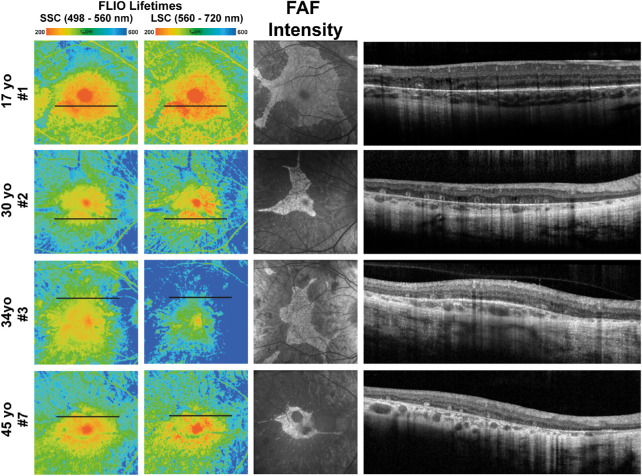
In most patients, FLIO lifetime patterns differed from the fluorescence patterns obtained with FAF intensity imaging. In areas where FAF intensity imaging highlighted hypofluorescent patches, FLIO lifetimes were not homogeneously prolonged but rather showed a mixture of both short and long FLIO lifetimes. Areas of short lifetimes were associated with retinal tubulations, degenerating photoreceptors, and cellular debris that oriented in a tubular fashion, whereas long FLIO lifetimes could be associated with areas of photoreceptor loss. This finding was especially notable in patients 1, 2, 3, 5, 7, and 12. Figure 7 further highlights these findings for patients 1, 2, 3, and 7.
Figure 7.
FLIO lifetime, FAF intensity, and OCT images from eyes of patients with CHM that showed short and long FLIO lifetimes in areas of hypofluorescence. Short and long FLIO lifetimes corresponded to areas of outer retinal tubulations in OCT imaging. FLIO lifetimes are shown for the SSC and LSC.
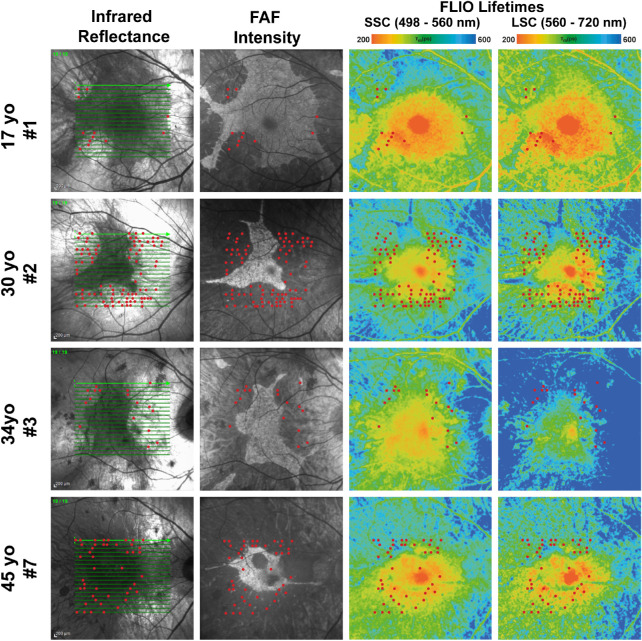
Within hyperfluorescent RPE islands, some areas had FLIO lifetimes comparable to those of healthy eyes, whereas other areas showed prolonged lifetimes. The difference in FLIO lifetimes between CHM eyes and healthy eyes in these areas was not as large as in the peripheral regions. In areas of prolonged FLIO lifetimes, FAF intensity imaging and OCT analysis showed hypoautofluorescence and hypertransluminence, respectively. Together, these modalities indicate areas of retinal atrophy. Longitudinal data will help confirm if the prolonged lifetimes may indicate future atrophy progression. Figure 8 describes these findings, as well.
Figure 8.
Infrared reflectance, FAF intensity, and FLIO lifetime images from eyes of patients with CHM who showed ORT localization in areas of hypo- and hyperautofluorescence. Short and long FLIO lifetimes corresponded to areas of outer retinal tubulations (red dots). FLIO lifetimes are shown for the SSC and LSC.
Correlation of FLIO Patterns, Genotype, Age, and Functional Measures
There was no apparent correlation of genotype with FLIO phenotype. Patient 4, who was 17 years old, had a mild CHM mutation but no visual complaints and a normal electroretinogram and visual fields. Although this patient presented with a peripheral pigmentary retinopathy in both eyes, a 30° field of view in both FLIO imaging and FAF intensity did not reveal any disease-related changes in the macula. His imaging is presented in Figure 9. Overall, his FLIO image is comparable to the images of healthy eyes. Except for this patient, the FLIO phenotypes seemed to correlate with age, as the area of preserved RPE shrank and the area of atrophy enlarged with increasing age. A strong correlation of FLIO lifetimes from the foveal center with visual acuity is present in our data (SSC: r = 0.743, P < 0.01; LSC: r = 0.588, P < 0.05). This correlation remained significant at the P < 0.05 level when correcting for age.
Figure 9.
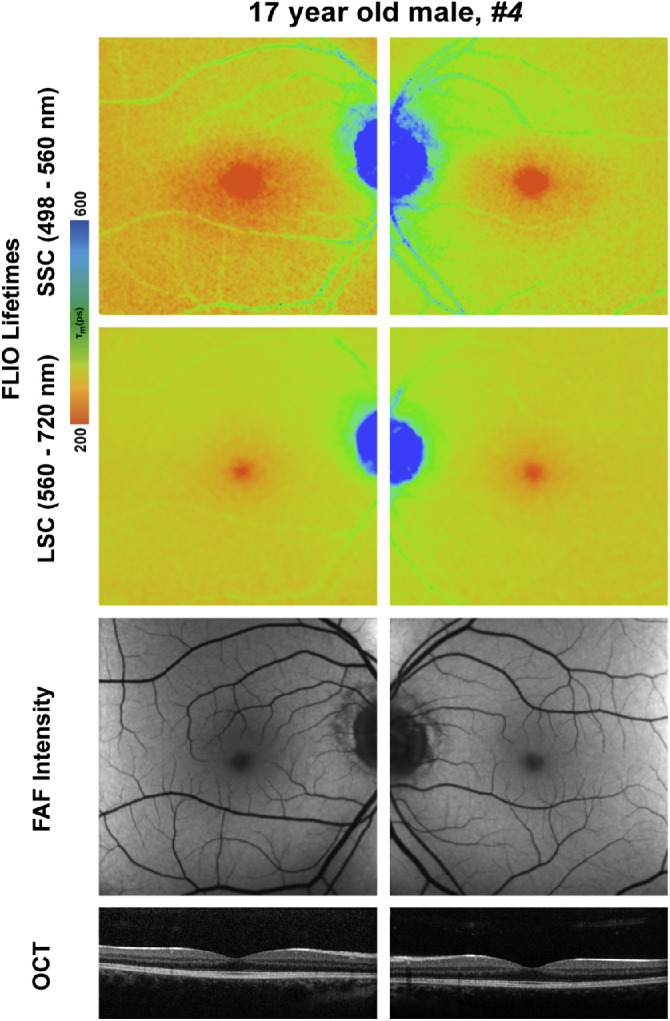
FLIO lifetime, FAF intensity, and OCT images for patient 4, who had a nonsense mutation in the CHM gene that phenotypically showed a healthy macula. This single nucleotide variant (Gln3800*C>T) generates a stop codon late in the gene that produces a relatively benign phenotype.
Evaluation of Short FLIO Lifetimes in Blood Vessels
On average, mean FLIO lifetimes for CHM blood vessels were around 300 ps in the SSC. In comparison, the 14 age-matched controls had lifetimes of around 330 ps in the SSC. This trend, powered with a 95% confidence interval, was not significant in the SSC (0.522) but was significant in the LSC (0.032). The significant prolongation of lifetimes in the LSC may be due to the already prolonged background in areas of retinal atrophy in patients with CHM.
Follow-Up Examinations
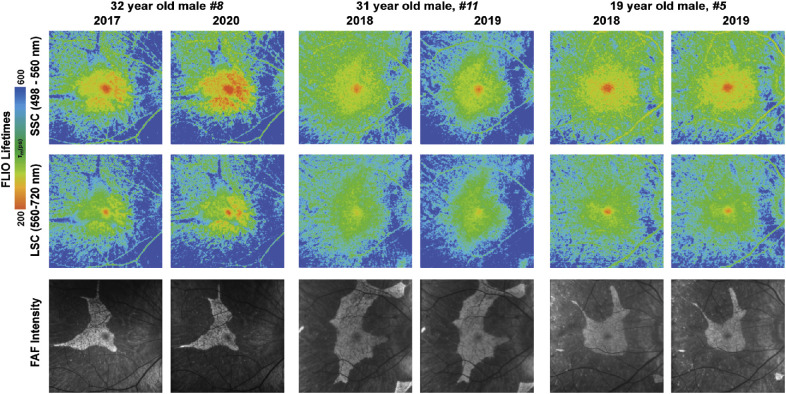
Out of the 14 patients enrolled, two were examined a year after their initial visit and one was examined 2.5 years after his initial visit. In comparison to their first visit, expansions of prolonged lifetimes in areas of previously normal retinal FLIO signals were seen in all of the follow-up patients. This finding occurred in conjunction with increased areas of hypofluorescence in FAF intensity imaging. Overall, these changes were very small. FLIO lifetimes at baseline and follow-up can be found in Table 3. In comparison to the patients’ baseline visits, FLIO lifetimes were prolonged significantly in peripheral and atrophic areas. All other areas showed no significant differences between baseline and follow-up. In the patient who received the 2.5-year follow-up examination, there was a notable increase of short lifetimes in the parafoveal area compared to his initial visit. Figure 10 highlights these findings.
Table 3.
Follow-Up Investigation of Six Eyes
| Mean ± SD (ps) | ||||
|---|---|---|---|---|
| Area | Channel | Baseline | Follow-Up | P |
| Fovea | SSC | 171 ± 25 | 180 ± 23 | 0.275 |
| LSC | 252 ± 17 | 259 ± 14 | 0.058 | |
| Hyperfluorescent | SSC | 295 ± 28 | 301 ± 32 | 0.310 |
| LSC | 358 ± 18 | 362 ± 18 | 0.325 | |
| Periphery | SSC | 295 ± 28 | 301 ± 32 | <0.05 |
| LSC | 491 ± 35 | 536 ± 46 | <0.05 | |
Baseline and follow-up FLIO lifetimes in three patients with CHM (patients 5, 8, and 11). P < 0.05 indicates significance.
Figure 10.
Follow-up FLIO lifetime and FAF intensity images from patient 8 (32 years old), patient 11 (31 years old), and patient 5 (19 years old). FLIO lifetimes are shown in short (498–560 nm) and long (560–720 nm) spectral channels. FLIO lifetimes were prolonged in both SSC and LSC, whereas hyperautofluorescence areas in FAF intensity decreased in size over the course of 1 year. The patient who received a 2.5-year follow-up additionally showed a notable increase of short lifetimes in the parafoveal area.
Discussion
FLIO is a novel imaging tool that has proven to be useful in detecting changes in early stages of different retinal diseases.20,24–27,29,37,38 In healthy FLIO images, the longest mean lifetimes, depicted in a blue color, can be found in areas of the optic nerve head, as well as blood vessels, likely due to dense connective tissue such as collagen or elastin.25,33 The shortest FLIO lifetimes, which are typically depicted in a red color, can be found in the fovea, and they correlate with macular pigment levels.17,18 Intermediate FLIO lifetimes, often described by a yellow to green color range, are believed to reflect retinal lipofuscin.33,39 Figure 1 depicts a healthy FLIO image. FLIO lifetimes in healthy subjects slowly prolong with age,33,36 but FLIO lifetimes prolong much more in patients with CHM compared to healthy controls. FLIO shows specific patterns of FLIO lifetimes in AMD, MacTel, hydroxychloroquine toxicity, Stargardt disease, and other inherited retinal diseases, and it is capable of distinguishing one disease from another.20–22,24–27,29,37,38,40,41 Changes in FLIO lifetimes can present before any structural, anatomical, or autofluorescence intensity changes appear in conventional imaging techniques.20,23,24,42 For example, eyes of patients with AMD display a ring-shaped pattern of prolonged FLIO lifetimes in the macular area, which is not seen in FAF intensity images.26 Patients with MacTel also express prolonged lifetimes in parafoveal temporal crescent or ring-like patterns that cannot be seen in FAF intensity images.23,24 FLIO has the potential to become a useful tool in diagnosing patients in earlier stages of diseases, which could help to prevent progression while vision is still intact.
In CHM, FLIO may be useful in providing additional information on pathophysiological processes. One of the most distinctive findings in FLIO images of patients with CHM is a disparity between FLIO lifetime patterns and FAF intensity patterns. This has been found in a previous FLIO study.38 Areas of hypo- as well as hyperfluorescence in FAF intensity imaging did not have homogeneous FLIO lifetimes.
Different areas of the retina show diverse FLIO lifetimes in CHM. The area of the fovea, if unaffected, has FLIO lifetimes similar to those of healthy eyes. In our study, there was no significant difference between healthy and CHM patients within the central area C of the ETDRS grid in the LSC (P = 0.075). However, we did find a significant prolongation of FLIO lifetimes in the SSC (P < 0.05) in the central area in affected patients compared to controls. We also found that FLIO lifetime patterns in CHM appeared more pronounced in the SSC. Compared to controls, FLIO lifetimes from the area of hyperfluorescent RPE islands in CHM patients were significantly prolonged (P < 0.001) (Table 2). Prolonged lifetimes in these areas may indicate early degeneration in CHM. Atrophic areas in the retina of CHM patients present the greatest increase in FLIO lifetimes compared to controls, with FLIO lifetimes between 600 and 700 ps in either spectral channel compared to 150 to 250 ps in controls. Atrophic areas show the greatest degree of retinal degeneration. This is observed in FAF intensity imaging as hypofluorescent regions of end-stage choroidal loss, mirrored by significantly prolonged lifetimes of these regions in FLIO imaging.
Hypofluorescence in FAF intensity images likely indicates RPE cell death with decreased lipofuscin fluorescence.38 However, previous FLIO studies in inherited retinal diseases have suggested that the remaining outer retinal layers may cause short to normal FLIO lifetimes in the absence of RPE.38 With this, FLIO may give further information on the functioning of retinal photoreceptors. Short to normal FLIO lifetimes in areas of RPE atrophy may therefore support theories of the RPE being affected first in the course of CHM.5
As an addition to the previous study, we describe shortened FLIO lifetimes within hypofluorescent areas that correlate with ORTs. ORTs typically represent final stages of advanced retinal diseases such as AMD, cone dystrophy, Stargardt disease, pattern dystrophy, CHM, and other inherited retinal diseases.43,44 ORTs accumulate as a result of retinal deterioration, where cellular debris aggregates in a tubular fashion to protect the RPE from further atrophy.43,45,46 It has been reported that ORT formation occurs due to insufficient structural support of the RPE and choroid, with highly atrophic areas having numerous and longer ORTs and RPE islands having distinctly smaller and stabilized ORTs.10 Previous studies have suggested that ORTs function in providing structural trophic support and replacement in areas with absent RPE tissue.47 Although the cellular and metabolic nature of ORTs is not well understood, they are thought to be composed of degenerating photoreceptors, RPE cells, and glial elements.48 In OCT imaging, ORTs are round, hyporeflective spaces with hyperreflective borders located in the outer nuclear layer, as seen in Figure 7.44 We found that ORTs were most prevalent in hypofluorescent areas in FAF intensity and had both short and long FLIO lifetimes; however, ORTs also localized in hyperfluorescent areas. Examples of these findings can be seen in Figure 8. It would be interesting to investigate if RPE tissue may still be partially functional in these atrophic regions with the presence of ORTs. Follow-up studies of larger patient populations with these retinal areas would provide more information on the capacity of FLIO to monitor the progression of CHM.
Hyperfluorescent areas in patients with CHM did not show homogeneous lifetimes in FLIO images, either. The borders of preserved RPE islands in FAF intensity imaging did not correlate with borders found in FLIO lifetime imaging. This finding has been reported previously, describing areas of short FLIO lifetimes that correlate with areas of residual photoreceptor layer, independent of the presence or absence of remaining RPE.38 In addition, prolonged FLIO lifetimes were found beyond areas of hypofluorescence, indicating affected tissue even in areas of hyperfluorescence. We found that, in some of these cases, the prolonged FLIO lifetimes were associated with signs of early atrophy. This suggests that hyperautofluorescence in conventional FAF intensity does not necessarily exclude early retinal changes. It has been suggested that an accumulation of lipofuscin derivatives and other visual cycle byproducts, as well as the loss of photoreceptors may lead to longer FLIO lifetimes in patients with CHM.38 Additionally, retinal deterioration through the choroid could potentially cause prolonged lifetimes, as well.49 FLIO may possess the ability to provide information on the functionality of retinal layers independent of RPE atrophy. This knowledge may also be important to understanding disease mechanisms in CHM.
New therapeutic approaches for treating CHM have been on the rise in recent years. This includes stem cell therapy, small molecule subretinal injections, gene therapy, and retinal implants.47,50 Because CHM is a slowly progressive monogenic disease, this allows potential gene therapy initiatives a window of intervention to target the many pathological effects of disease. One study employed by Fischer and coworkers51 was a phase 2 randomized clinical trial that included six patients with CHM. This study used an adeno-associated virus vector (AAV2) to deliver a functional version of CHM to affected patients (AAV2-REP1).51 Patients who received treatment showed general improvement of visual acuity with a mean gain of 3.7 letters on the BCVA ETDRS score and a significant reduction in the rate of retinal degeneration compared to untreated controls. Employing gene therapy approaches in conjunction with FLIO imaging in patients with CHM could show great potential. Examining CHM patients before, during, and after gene therapy trials in comparison with age-matched controls may provide new information about how the retina responds to such therapies. Additionally, in conjunction with FLIO imaging, measuring retinal function with high-resolution adaptive optics microperimety would help in understanding whether experimental gene therapies could provide functional benefits in patients with CHM.47
A previous study using FLIO imaging in patients with CHM conducted by Dysli and coworkers38 described similar findings of prolonged FLIO lifetimes in areas of diseased retina. Specifically, the authors observed short FLIO lifetimes in areas surrounding the fovea where macular pigment localizes and in RPE islands, which are defined by areas of hyperautofluorescence on FAF intensity imaging. FLIO lifetimes were prolonged in all patients who received follow-up examinations. Dysli and coworkers38 also reported that RPE islands in FAF intensity images shrank from the baseline visit, indicating progression of disease. Although our current study shares similar findings in lifetime changes, there are differences in data analysis techniques, as well as in the ages of patients enrolled. Dysli et al.38 reported a mean age of 55 ± 17 years (range, 32–70 years), whereas this study reports a mean age of 28 ± 14 years (range, 10–54 years). Finally, the focus of analysis also differs between both studies. Dysli and coworkers38 focused on analyzing FLIO images in the LSC in a range of 200 to 1000 ps. In contrast, this study included the analysis of both spectral channels at a different lifetime range of 100 to 600 ps. Furthermore, we focused on using the SSC (498–560 nm) in our analysis, as we believe that it provides valuable additional information on the disease.
Unlike the long FLIO lifetimes in the blood vessels seen in healthy controls, we found short lifetimes in blood vessels in all patients included in this study, a finding that has been described in previous FLIO studies of AMD and CHM.38,40 We postulate that, because the FLIO lifetimes in the periphery were significantly prolonged, this caused the highly atrophic environment to possess a longer lifetime signal than that of blood vessels, making blood vessels in this area appear to have shorter FLIO lifetimes than normal. This finding provides a possible explanation for the shorter lifetimes found in CHM patients’ blood vessels compared to the longer lifetimes found in healthy individuals’ blood vessels.
Previous research has shown that CHM phenotypes cannot be explained by genotype alone and instead are likely to be affected by environmental factors and unknown genetic modifiers.8 Similarly, we did not find strong evidence for a genotype–phenotype correlation. The strongest association that we found was phenotype severity with advancing age. As areas of persisting RPE islands shrink, areas of atrophy subsequently enlarge with advancing age and disease progression. Phenotypically, our patients’ FLIO and FAF intensity images looked very similar. It would be interesting to investigate FLIO lifetimes from a larger cohort of genotyped patients to truly understand these lifetime changes and to analyze if there might be a connection with genotypes. One choroideremia patient had only a peripheral pigmentary retinopathy. His CHM mutation was a single nucleotide variant (Gln3800*C>T), and his macular imaging including FLIO showed no abnormalities. This mutation produces a stop codon late in the gene that could result in a relatively benign phenotype or late-onset disease pathology.7
Two patients received follow-up FLIO measurements after 12 months and one after 30 months. Changes in hyperfluorescent areas were very small, but an enlargement of the atrophic area was found. This is in accordance with a previous FLIO study.38 We also observed a prolongation of lifetimes in the corresponding areas of extended atrophy, as well as the foveal areas where macular pigment localizes. However, an increase of short lifetimes in the parafoveal area was observed at the 30-month follow up in one patient. OCT findings revealed an increase of ORTs at this patient's 30-month follow up compared to the initial visit. FLIO lifetimes between baseline and follow-up in atrophic areas were significantly different, at the P < 0.05 level. Other areas, especially hyperfluorescent areas, did not show significant differences. This may be due to a combination of prolonged lifetimes in healthy areas, which may indicate progression of disease, and shortened lifetimes in areas of atrophy due to an increased abundance of ORTs. Further follow-up analysis will be needed in order to reaffirm these findings.
This study has some limitations, including a small sample size. Of the included 28 eyes, individual genotypes had small numbers, making it difficult to establish general statements. Including patients from other retinal centers would be helpful to further understand specific FLIO changes. Furthermore, all fluorescence-based imaging modalities are influenced by the autofluorescence of the lens. With this study cohort having a mean age of 28 ± 14 years, the lens influence is assumed to be small. Previous studies with patients around 60 years old did not find strong influences of the lens24,39; however, studies that included older patients showed an impact of the lens.26,33,36 We included only young patients with clear natural lenses. As FLIO uses a confocal aperture, this influence should be minimal; therefore, we do not think that the lens influences our study results to a significant degree. En face OCT imaging was not in the scope of this study, thus limiting our ability to provide more detailed information on the co-localization of ORTs and FLIO lifetimes. This modality will be applied to future studies in order to further describe CHM findings in FLIO. Finally, we were able to include only a small number of follow-up investigations. More long-term follow-up examinations are needed to truly understand FLIO changes over time in patients with CHM.
Overall, FLIO is a very promising tool for imaging patients with CHM and may hold the potential to identify potential functioning areas, as well areas at risk for disease progression. It may be helpful for understanding and monitoring changes in the disease over time.
Acknowledgments
The authors gratefully thank Heidelberg Engineering for providing the FLIO at no cost to the University of Utah, and we especially thank Yoshihiko Katayama, PhD, for his technical assistance. In addition, the authors also thank all coworkers at the John A. Moran Eye Center who helped recruit and image patients, especially the clinical studies team. The authors greatly thank clinical coordinator Kelliann Ordonez, who majorly contributed to the recruitment of all CHM patients.
Supported by Grants from the National Institutes of Health (EY11600, EY14800) and Research to Prevent Blindness. FLIO is approved for clinical research use only.
Disclosure: A.S. Vitale, Tesseract (C); L. Sauer, Tesseract (C); N.K. Modersitzki, None; P.S. Bernstein, Tesseract (C)
References
- 1. MacDonald IM, Hume S, Chan S, Seabra MC. Choroideremia. In: Adam MP, Ardinger HH, Pagon RA, et al. (eds.), GeneReviews . Seattle, WA: University of Washington, Seattle; 1993. [Google Scholar]
- 2. Sanchez-Alcudia R, Garcia-Hoyos M, Lopez-Martinez MA, et al.. A comprehensive analysis of choroideremia: from genetic characterization to clinical practice. PLoS One. 2016; 11: e0151943. [DOI] [PMC free article] [PubMed] [Google Scholar]
- 3. Preising M, Ayuso C. Rab escort protein 1 (REP1) in intracellular traffic: a functional and pathophysiological overview. Ophthalmic Genet. 2004; 25: 101–110. [DOI] [PubMed] [Google Scholar]
- 4. Mitsios A, Dubis AM, Moosajee M. Choroideremia: from genetic and clinical phenotyping to gene therapy and future treatments. Ther Adv Ophthalmol. 2018; 10: 2515841418817490. [DOI] [PMC free article] [PubMed] [Google Scholar]
- 5. Xue K, Oldani M, Jolly JK, et al.. Correlation of optical coherence tomography and autofluorescence in the outer retina and choroid of patients with choroideremia. Invest Ophthalmol Vis Sci. 2016; 57: 3674–3684. [DOI] [PMC free article] [PubMed] [Google Scholar]
- 6. Dimopoulos IS, Chan S, MacLaren RE, MacDonald IM. Pathogenic mechanisms and the prospect of gene therapy for choroideremia. Expert Opin Orphan Drugs. 2015; 3: 787–798. [DOI] [PMC free article] [PubMed] [Google Scholar]
- 7. Simunovic MP, Jolly JK, Xue K, et al.. The spectrum of CHM gene mutations in choroideremia and their relationship to clinical phenotype. Invest Ophthalmol Vis Sci. 2016; 57: 6033–6039. [DOI] [PMC free article] [PubMed] [Google Scholar]
- 8. Freund PR, Sergeev YV, MacDonald IM. Analysis of a large choroideremia dataset does not suggest a preference for inclusion of certain genotypes in future trials of gene therapy. Mol Genet Genomic Med. 2016; 4: 344–358. [DOI] [PMC free article] [PubMed] [Google Scholar]
- 9. Jolly JK, Edwards TL, Moules J, Groppe M, Downes SM, MacLaren RE. A qualitative and quantitative assessment of fundus autofluorescence patterns in patients with choroideremia. Invest Ophthalmol Vis Sci. 2016; 57: 4498–4503. [DOI] [PMC free article] [PubMed] [Google Scholar]
- 10. Jain N, Jia Y, Gao SS, et al.. Optical coherence tomography angiography in choroideremia: correlating choriocapillaris loss with overlying degeneration. JAMA Ophthalmol. 2016; 134: 697–702. [DOI] [PMC free article] [PubMed] [Google Scholar]
- 11. Dugel PU, Zimmer CN, Shahidi AM. A case study of choroideremia carrier - use of multi-spectral imaging in highlighting clinical features. Am J Ophthalmol Case Rep. 2016; 2: 18–22. [DOI] [PMC free article] [PubMed] [Google Scholar]
- 12. Schweitzer D, Hammer M, Schweitzer F, et al.. In vivo measurement of time-resolved autofluorescence at the human fundus. J Biomed Opt. 2004; 9: 1214–1222. [DOI] [PubMed] [Google Scholar]
- 13. Schweitzer D, Kolb A, Hammer M, Anders R. Time-correlated measurement of autofluorescence. A method to detect metabolic changes in the fundus [in German]. Ophthalmologe. 2002; 99: 774–779. [DOI] [PubMed] [Google Scholar]
- 14. Walsh AJ, Cook RS, Manning HC, et al.. Optical metabolic imaging identifies glycolytic levels, subtypes, and early-treatment response in breast cancer. Cancer Res. 2013; 73: 6164–6174. [DOI] [PMC free article] [PubMed] [Google Scholar]
- 15. Walsh AJ, Cook RS, Sanders ME, et al.. Quantitative optical imaging of primary tumor organoid metabolism predicts drug response in breast cancer. Cancer Res. 2014; 74: 5184–5194. [DOI] [PMC free article] [PubMed] [Google Scholar]
- 16. Skala MC, Riching KM, Gendron-Fitzpatrick A, et al.. In vivo multiphoton microscopy of NADH and FAD redox states, fluorescence lifetimes, and cellular morphology in precancerous epithelia. Proc Natl Acad Sci USA. 2007; 104: 19494–19499. [DOI] [PMC free article] [PubMed] [Google Scholar]
- 17. Sauer L, Andersen KM, Li B, Gensure RH, Hammer M, Bernstein PS. Fluorescence lifetime imaging ophthalmoscopy (FLIO) of macular pigment. Invest Ophthalmol Vis Sci. 2018; 59: 3094–3103. [DOI] [PMC free article] [PubMed] [Google Scholar]
- 18. Sauer L, Schweitzer D, Ramm L, Augsten R, Hammer M, Peters S. Impact of macular pigment on fundus autofluorescence lifetimes. Invest Ophthalmol Vis Sci. 2015; 56: 4668–4679. [DOI] [PubMed] [Google Scholar]
- 19. Jaggi D, Solberg Y, Dysli C, Wolf S, Zinkernagel M. Fluorescence lifetime imaging ophthalmoscopy and the influence of oral lutein supplementation on macular pigment: a preliminary study report. In: 19th EURetina Congress Proceedings. Dublin, Ireland: European Society of Retina Specialists; 2019. [Google Scholar]
- 20. Dysli C, Wolf S, Hatz K, Zinkernagel MS. Fluorescence lifetime imaging in Stargardt disease: potential marker for disease progression. Invest Ophthalmol Vis Sci. 2016; 57: 832–841. [DOI] [PubMed] [Google Scholar]
- 21. Solberg Y, Dysli C, Wolf S, Zinkernagel MS. Fluorescence lifetime patterns in macular telangiectasia type 2. Retina. 2020; 40: 99–108. [DOI] [PMC free article] [PubMed] [Google Scholar]
- 22. Sauer L, Calvo CM, Vitale AS, Henrie N, Milliken CM, Bernstein PS. Imaging of hydroxychloroquine toxicity with fluorescence lifetime imaging ophthalmoscopy. Ophthalmol Retina. 2019; 3: 814–825 [DOI] [PubMed] [Google Scholar]
- 23. Sauer L, Vitale AS, Andersen KM, Hart B, Bernstein PS. Fluorescence lifetime imaging ophthalmoscopy (FLIO) patterns in clinically unaffected children of macular telangiectasia type 2 (MacTel) patients. Retina. 2020; 40: 695–704 [DOI] [PMC free article] [PubMed] [Google Scholar]
- 24. Sauer L, Gensure RH, Hammer M, Bernstein PS. Fluorescence lifetime imaging ophthalmoscopy: a novel way to assess macular telangiectasia type 2. Ophthalmol Retina. 2018; 2: 587–598. [DOI] [PMC free article] [PubMed] [Google Scholar]
- 25. Sauer L, Andersen KM, Dysli C, Zinkernagel MS, Bernstein PS, Hammer M. Review of clinical approaches in fluorescence lifetime imaging ophthalmoscopy. J Biomed Opt. 2018; 23: 1–20. [DOI] [PMC free article] [PubMed] [Google Scholar]
- 26. Sauer L, Gensure RH, Andersen KM, et al.. Patterns of fundus autofluorescence lifetimes in eyes of individuals with nonexudative age-related macular degeneration. Invest Ophthalmol Vis Sci. 2018; 59: AMD65–AMD77. [DOI] [PMC free article] [PubMed] [Google Scholar]
- 27. Andersen KM, Sauer L, Gensure RH, Hammer M, Bernstein PS. Characterization of retinitis pigmentosa using fluorescence lifetime imaging ophthalmoscopy (FLIO). Transl Vis Sci Technol. 2018; 7: 20. [DOI] [PMC free article] [PubMed] [Google Scholar]
- 28. Schmidt J, Peters S, Sauer L, et al.. Fundus autofluorescence lifetimes are increased in non-proliferative diabetic retinopathy. Acta Ophthalmol. 2017; 95: 33–40. [DOI] [PubMed] [Google Scholar]
- 29. Dysli C, Schurch K, Pascal E, Wolf S, Zinkernagel MS. Fundus autofluorescence lifetime patterns in retinitis pigmentosa. Invest Ophthalmol Vis Sci. 2018; 59: 1769–1778. [DOI] [PubMed] [Google Scholar]
- 30. Schweitzer D, Deutsch L, Klemm M, et al.. Fluorescence lifetime imaging ophthalmoscopy in type 2 diabetic patients who have no signs of diabetic retinopathy. J Biomed Opt. 2015; 20: 61106. [DOI] [PubMed] [Google Scholar]
- 31. Kwon S, Fang W, Borreli E, et al.. Fluorescence lifetime imaging ophthalmoscopy in early Alzheimer's disease. In: ARVO Annual Meeting 2018 Proceedings. Rockville, MD: Association for Research in Vision and Ophthalmology; 2018. [Google Scholar]
- 32. Sauer L, Peters S, Schmidt J, et al.. Monitoring macular pigment changes in macular holes using fluorescence lifetime imaging ophthalmoscopy (FLIO). Acta Ophthalmol. 2017; 95: 481–492. [DOI] [PubMed] [Google Scholar]
- 33. Dysli C, Quellec G, Abegg M, et al.. Quantitative analysis of fluorescence lifetime measurements of the macula using the fluorescence lifetime imaging ophthalmoscope in healthy subjects. Invest Ophthalmol Vis Sci. 2014; 55: 2106–2113. [DOI] [PubMed] [Google Scholar]
- 34. Becker W. The bh TCSPC Handbook. 6th ed. Berlin, Germany: Becker & Hickl GmbH; 2014. [Google Scholar]
- 35. Klemm M, Schweitzer D, Peters S, Sauer L, Hammer M, Haueisen J. FLIMX: a software package to determine and analyze the fluorescence lifetime in time-resolved fluorescence data from the human eye. PLoS One. 2015; 10: e0131640. [DOI] [PMC free article] [PubMed] [Google Scholar]
- 36. Sauer L, Vitale AS, Milliken CM, Modersitzki NK, Blount JD, Bernstein PS. Autofluorescence lifetimes measured with fluorescence lifetime imaging ophthalmoscopy (FLIO) are affected by age, but not by pigmentation or gender. Transl Vis Sci Technol. 2020; 9: 2. [DOI] [PMC free article] [PubMed] [Google Scholar]
- 37. Dysli C, Wolf S, Berezin MY, Sauer L, Hammer M, Zinkernagel MS. Fluorescence lifetime imaging ophthalmoscopy. Prog Retin Eye Res. 2017; 60: 120–143. [DOI] [PMC free article] [PubMed] [Google Scholar]
- 38. Dysli C, Wolf S, Tran HV, Zinkernagel MS. Autofluorescence lifetimes in patients with choroideremia identify photoreceptors in areas with retinal pigment epithelium atrophy. Invest Ophthalmol Vis Sci. 2016; 57: 6714–6721. [DOI] [PubMed] [Google Scholar]
- 39. Sauer L, Peters S, Schmidt J, et al.. Monitoring macular pigment changes in macular holes using fluorescence lifetime imaging ophthalmoscopy. Acta Ophthalmol. 2017; 95: 481–492. [DOI] [PubMed] [Google Scholar]
- 40. Sauer L, Komanski CB, Vitale AS, Hansen ED, Bernstein PS. Fluorescence lifetime imaging ophthalmoscopy (FLIO) in eyes with pigment epithelial detachments due to age-related macular degeneration. Invest Ophthalmol Vis Sci. 2019; 60: 3054–3063. [DOI] [PMC free article] [PubMed] [Google Scholar]
- 41. Dysli C, Berger L, Wolf S, Zinkernagel MS. Fundus autofluorescence lifetimes and central serous chorioretinopathy. Retina. 2017; 37: 2151–2161. [DOI] [PMC free article] [PubMed] [Google Scholar]
- 42. Gantner ML, Eade K, Wallace M, et al.. Serine and lipid metabolism in macular disease and peripheral neuropathy. N Engl J Med. 2019; 381: 1422–1433. [DOI] [PMC free article] [PubMed] [Google Scholar]
- 43. Zweifel SA, Engelbert M, Laud K, Margolis R, Spaide RF, Freund KB. Outer retinal tubulation: a novel optical coherence tomography finding. Arch Ophthalmol. 2009; 127: 1596–1602. [DOI] [PubMed] [Google Scholar]
- 44. Filho RGG, Zacharias LC, Monteiro TV, Preti RC, Pimentel SG. Prevalence of outer retinal tubulation in eyes with choroidal neovascularization. Int J Retina Vitreous. 2016; 2: 6. [DOI] [PMC free article] [PubMed] [Google Scholar]
- 45. Heon E, Alabduljalil T, McGuigan ID, et al.. Visual function and central retinal structure in choroideremia. Invest Ophthalmol Vis Sci. 2016; 57: OCT377–OCT387. [DOI] [PubMed] [Google Scholar]
- 46. Sun LW, Johnson RD, Williams V, et al.. Multimodal imaging of photoreceptor structure in choroideremia. PLoS One. 2016; 11: e0167526. [DOI] [PMC free article] [PubMed] [Google Scholar]
- 47. Tuten WS, Vergilio GK, Young GJ, et al.. Visual function at the atrophic border in choroideremia assessed with adaptive optics microperimetry. Ophthalmol Retina. 2019; 3: 888–899. [DOI] [PMC free article] [PubMed] [Google Scholar]
- 48. Fonio A. On the retraction process in blood plasma coagulation [in German]. Acta Haematol. 1966; 36: 371–385. [DOI] [PubMed] [Google Scholar]
- 49. Stevanovic M, Cehajic Kapetanovic J, Jolly JK, MacLaren RE. A distinct retinal pigment epithelial cell autofluorescence pattern in choroideremia predicts early involvement of overlying photoreceptors. Acta Ophthalmol. 2020; 98: e322–e327. [DOI] [PubMed] [Google Scholar]
- 50. Brambati M, Borrelli E, Sacconi R, Bandello F, Querques G. Choroideremia: update on clinical features and emerging treatments. Clin Ophthalmol. 2019; 13: 2225–2231. [DOI] [PMC free article] [PubMed] [Google Scholar]
- 51. Fischer MD, Ochakovski GA, Beier B, et al.. Efficacy and safety of retinal gene therapy using adeno-associated virus vector for patients with choroideremia: a randomized clinical trial. JAMA Ophthalmol. 2019; 137: 1247–1254. [DOI] [PMC free article] [PubMed] [Google Scholar]


