Figure 4.

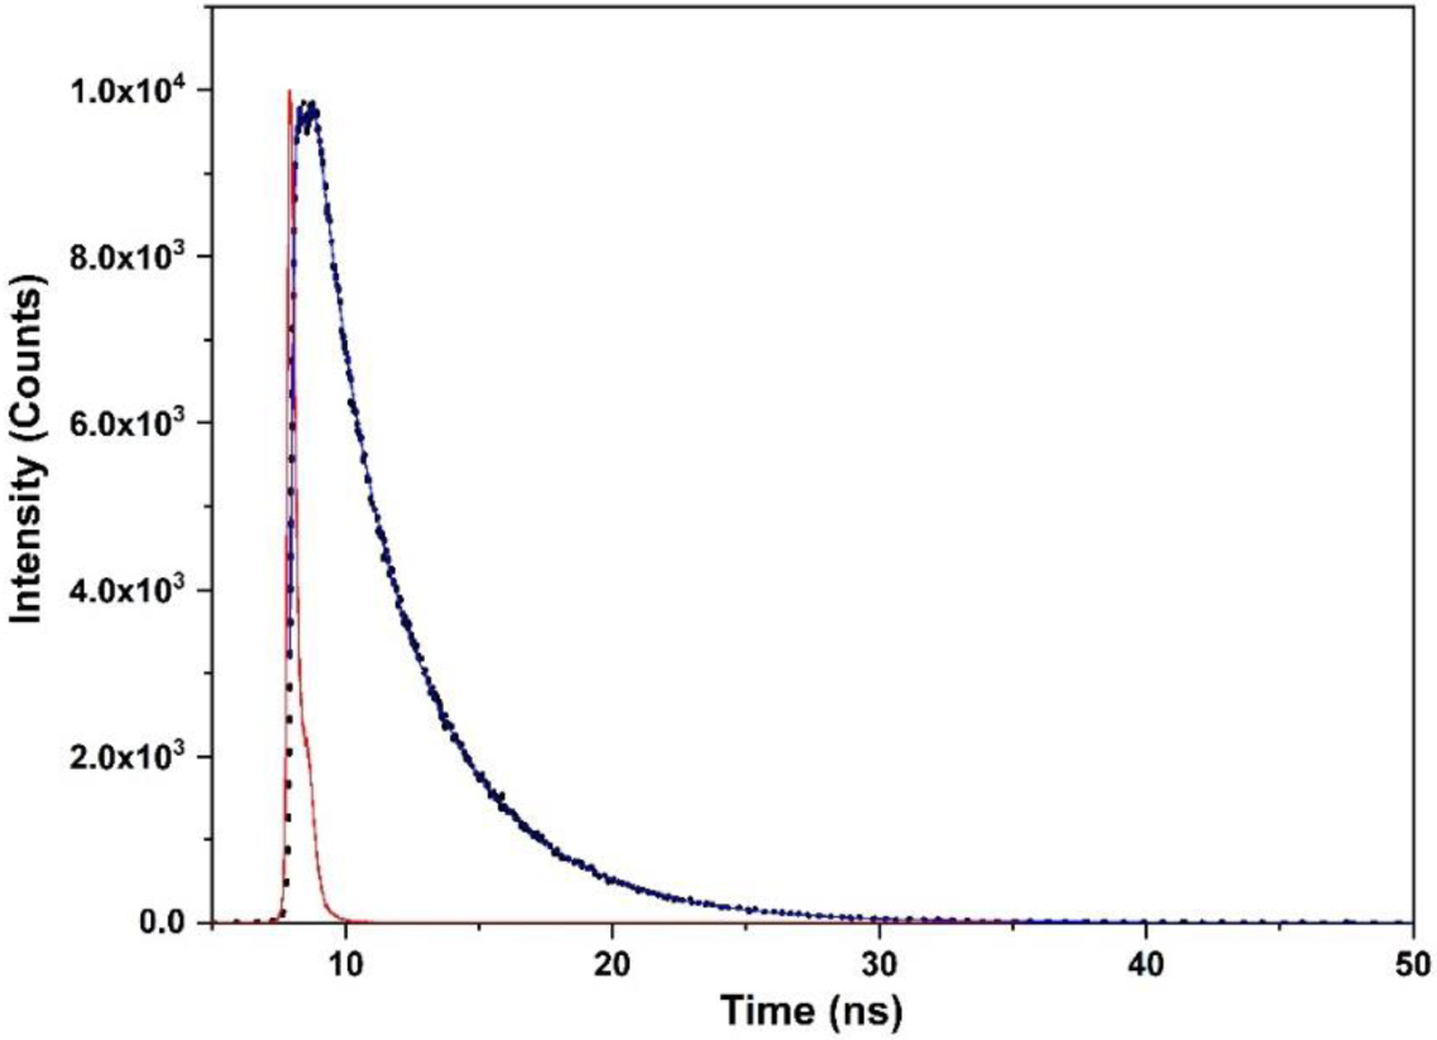
Plot of time-resolved fluorescence intensity decay of human iNOS oxyFMN with added14% (w/v) Ficoll 70. The fluorescence raw data are shown in dots, the multiexponential fit is a blue line, and the instrument response (IR) is shown in red.

Plot of time-resolved fluorescence intensity decay of human iNOS oxyFMN with added14% (w/v) Ficoll 70. The fluorescence raw data are shown in dots, the multiexponential fit is a blue line, and the instrument response (IR) is shown in red.