This study quantifies the wide-ranging health care costs affecting patients living with IBD, including the annualized direct and indirect costs of care for patients with IBD, the longitudinal drivers of these costs, and the cost of care for newly diagnosed patients.
Keywords: Costs of care, Crohn’s disease, ulcerative colitis, inflammatory bowel diseases, biologics, opioids, narcotics, steroids, mental health, anemia, emergency room use, direct costs, indirect costs
Abstract
Background
The Crohn’s & Colitis Foundation’s Cost of Inflammatory Bowel Disease (IBD) Care Initiative seeks to quantify the wide-ranging health care costs affecting patients living with IBD. We aimed to (1) describe the annualized direct and indirect costs of care for patients with Crohn’s disease (CD) or ulcerative colitis (UC), (2) determine the longitudinal drivers of these costs, and (3) characterize the cost of care for newly diagnosed patients.
Methods
We analyzed the Optum Research Database from the years 2007 to 2016, representing commercially insured and Medicare Advantage–insured patients in the United States. Inclusion for the study was limited to those who had continuous enrollment with medical and pharmacy benefit coverage for at least 24 months (12 months before through 12 months after the index date of diagnosis). The value of patient time spent on health care was calculated as number of workplace hours lost due to health care encounters multiplied by the patients’ estimated average wage derived from the Bureau of Labor Statistics. Comparisons between IBD patients and non-IBD patients were analyzed based on demographics, health plan type, and length of follow-up. We used generalized linear models to estimate the association between total annual costs and various patient variables.
Results
There were 52,782 IBD patients (29,062 UC; 23,720 CD) included in the analysis (54.1% females). On a per-annual basis, patients with IBD incurred a greater than 3-fold higher direct cost of care compared with non-IBD controls ($22,987 vs $6956 per-member per-year paid claims) and more than twice the out-of-pocket costs ($2213 vs $979 per-year reported costs), with all-cause IBD costs rising after 2013. Patients with IBD also experienced significantly higher costs associated with time spent on health care as compared with controls. The burden of costs was most notable in the first year after initial IBD diagnosis (mean = $26,555). The study identified several key drivers of cost for IBD patients: treatment with specific therapeutics (biologics, opioids, or steroids); ED use; and health care services associated with relapsing disease, anemia, or mental health comorbidity.
Conclusion
The costs of care for IBD have increased in the last 5 years and are driven by specific therapeutics and disease features. In addition, compared with non-IBD controls, IBD patients are increasingly incurring higher costs associated with health care utilization, out-of-pocket expenditures, and workplace productivity losses. There is a pressing need for cost-effective strategies to address these burdens on patients and families affected by IBD.
INTRODUCTION
Crohn’s disease (CD) and ulcerative colitis (UC) are inflammatory bowel diseases (IBD) with a progressive chronic relapsing and remitting disease course, affecting an increasing number of children and adults in the United States (US).1 Inflammatory bowel disease affects both women and men equally,2 and the global disease burden of both CD and UC is increasing rapidly.3 As in most chronic conditions, the costs of care for IBD are primarily allocated to acute care services, including hospitalizations, emergency department (ED) visits and services, surgeries, and pharmacotherapies.4–8
Recent studies have found several key factors associated with or predictive of high health care costs and resource utilization. These factors include comorbidities including anemia or psychiatric illness; therapeutics such as opioids, steroids, or biologics use; and disease severity as manifested by IBD-associated hospitalizations or ED use.9–11
Stakeholders in the health care system have placed increasing urgency on the development of strategies to deliver cost-effective IBD care in light of the costs of effective and expensive medications, increasing incidence and burden of disease, and overall rising costs of US health care, including IBD-attributable costs.12 In addition, payer reimbursements are moving increasingly to risk-sharing models.13, 14 Risk-sharing contracts can include models where set amounts are paid to a provider organization for a risk-stratified population of patients. For a health system to find financial success within this framework, it must control unnecessary costs, especially for patients with chronic or relapsing conditions such as IBD. Thus, studies that can highlight interventions that might prevent costly imaging studies15 or ED use and improve patient quality of care and outcomes will be important for providers to gain knowledge about value-based care.
In 2016, the Crohn’s & Colitis Foundation launched the “Cost of IBD Initiative” with a goal of understanding IBD costs of care at both the system and individual patient levels. The Foundation sought to quantify the wide-ranging costs of IBD and explore key cost drivers that might be addressed through quality improvement or patient or professional educational efforts.
The proper groundwork for the initiative’s success was set into motion with the establishment of a dedicated Cost of IBD Task Force: a 20-member, multi-disciplinary group composed of diverse stakeholders and experts in academic research, industry, and government and payers, patients, and Foundation staff. The role of the Cost of IBD Task Force was to provide different stakeholder perspectives in advising, informing, and guiding cost of IBD studies and the overall initiative as it relates to population-level impact.
In this first article of the Cost of IBD series, we aimed to (1) describe the annualized direct and indirect costs of care for patients with IBD, (2) describe the longitudinal drivers of costs after initial diagnosis of IBD over a 10-year period, and (3) characterize the cost of care for patients with a newly diagnosed IBD (within 1 year).
METHODS
Data Source
We performed a longitudinal retrospective cohort analysis of Crohn’s disease (CD) and ulcerative colitis (UC) patients in the Optum Research Database from 2007 through 2016 using pharmacy and administrative claims data. Commercial and Medicare Advantage enrollees with evidence of either CD or UC were matched to non-IBD controls based on age, geographic region, baseline comorbidities, index year, and enrollment period. Descriptive and multivariable statistical methodologies were used. The Optum database contained de-identified data from inpatient admissions, ambulatory visits, ED visits, pharmaceutical claims, and laboratory data from approximately 12 to 14 million privately or Medicare Advantage–insured patients per year across 50 states. The database included demographic and socioeconomic characteristics (age, sex, geographic region, race, household income), encounter data (hospital admissions, outpatient visits, and associated procedures), pharmaceutical data (filled pharmaceutical claims, days supplied, dose dispensed, strength, administration method), financial data (total cost, copayment, deductibles), and lab results for a subsample of tests (test description, result number, and unit). Confidentiality was maintained with no subject’s identity or medical records being disclosed.
Patient Identification and Classification
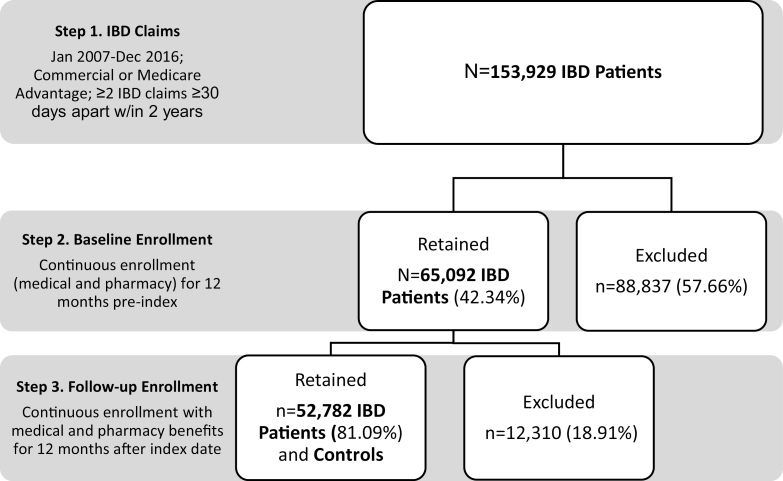
Inflammatory bowel disease cohort identification and inclusion for patients is shown in Figure 1. Based on selection criteria, we identified IBD patients based on at least 2 IBD diagnoses based on CD (ICD-9-CM/ICD-10-CM diagnosis code: 555.x, K50.0, K50.1, K50.9) or UC (ICD-9-CM/ICD-10-CM diagnosis code: 556.x, K51.9, K51.8, K51.0) in any position, on 2 separate encounter dates at least 30 days apart within a 2-year period between January 1, 2007, and December 31, 2015. The date of the first claim with a diagnosis for CD or UC was set as the index date. Inclusion also required continuous enrollment with medical and pharmacy benefit coverage for at least 24 months (12 months before through 12 months after the index date). For determination of diagnosis of CD or UC, claims with evidence of diagnostic laboratory or radiology services were excluded, based upon the following criteria: laboratory/imaging/diagnostic radiology service site or provider specialty or one of the following CPT/HCPCS codes: 36400–36425 (venipuncture), 70010–76999 (radiological imaging), 78000–78799 (nuclear imaging), 80000–89999 (laboratory and pathology), or S9529 (routine venipuncture to collect specimen). A subset of patients was identified as new IBD patients based on the absence of IBD diagnoses in claims during the 12 months before the index date.
FIGURE 1.
Cost of IBD care cohort identification flow diagram.
Non-IBD patients (with no diagnosis of either UC or CD during the study period from January 2007 to September 2016) were selected from the general population health plan members in the research database as controls based on 1:1 matching to each IBD patient on age, gender, health plan type (commercial or Medicare Advantage), index (calendar) year, and length of follow-up.
A random index date was assigned to each of the control patients based on the date of service for an observed claim; for patients without observed claims, an index date was randomly selected matched by month in index year to the IBD patient. For all patients included in the study, the Charlson comorbidity score16 was calculated using inpatient and outpatient claims during the 12 months before the index date (baseline period).1
Primary Outcome Measure, PMPY
The primary outcome measure for the analysis was the paid costs per member per year (PMPY, $). Annual paid costs equaled the total reimbursed costs for all health services rendered for the patient’s health care in any given year; year was assigned based on the start date for the individual patients, and patients were included in all years for which they were enrolled for the full year (ie, 365 days after the index date/start of the patient’s year). Mean PMPY was calculated by averaging the total health care costs per patient per year for medical care (includes costs related to laboratory, facility, and other care-related costs) and pharmaceutical claims. Costs were adjusted using the annual medical care component of the Consumer Price Index (CPI) to reflect inflation between 2007 and 2016.
Health Care Costs. Patient-level Costs and Indirect Costs
Health care costs were assessed through health plan paid amounts, patient paid amounts (combined deductible, copays, and co-insurance), and combined total costs. Total cost of care was evaluated through several cost driver categories, including but not restricted to inpatient hospital, outpatient hospital, MD office visits, ED visits, ambulatory procedures and surgeries, pharmaceutical, and so forth. Paid amounts for biological injection/infusion agents were captured using the Healthcare Common Procedure Coding System (eg, infliximab code J1745) or National Drug Code (infliximab code 57894003001). Each biological agent used to treat IBD was captured in the same approach as described. Patient-level co-existing conditions were captured using diagnostic codes and followed longitudinally. Costs were defined as attributable to IBD if the claim had a diagnosis for IBD in the primary position, had a code for IBD-related surgery, or was a pharmacy claim for drugs used for IBD. Similarly, total costs related attributable to IBD-related surgery were captured for costs between 7 days before through 30 days after the date of the first claim with code for the surgery.
Time lost due to medically related health care encounter(s) was used as a proxy to estimate patient-level costs and indirect costs. The assumptions of time spent on health care were as follows: office-related visits as 3 hours, outpatient visits as 4 hours, ED visits as 8 hours, and inpatient stays as 24 hours per day, hospitalized starting on admission day. The costs for time lost were calculated as the number of hours lost due to health care encounters multiplied by the patients’ estimated average wage derived from the Bureau of Labor Statistics (BLS). In the May 2016 estimates, mean hourly wage across all occupations was $23.86. Patients’ employment status was not available in administrative claims data. To test the sensitivity of the estimates to the wage used, an alternative measure of patient time cost was created using the federal minimum wage as of 2016 ($7.25 per hour).
Statistical Analysis
All statistical analyses were performed on SAS (version 9; SAS Institute, Cary, NC). The means and standard deviations for costs (PMPY) were calculated. All study variables, including pre-index and outcome measures, were analyzed descriptively. Comparability of baseline characteristics between matched groups was assessed using appropriate statistical tests (ie, t test, Mann-Whitney U test, χ2 test, McNemar tests, and paired t tests). Statistical significance was assessed at the level of α = 0.05. All analyses were adjusted for clustering due to multiple observations. Generalized linear models (GLM) were used to estimate the association between total annual costs and the predictor variables. Costs were analyzed using GLM with a gamma distribution and log link. Because health care costs are often skewed, estimated cost measures were modeled using Manning and Mullahy’s formulation. This method avoids potential difficulties introduced by transformation and retransformation of the dependent variable. The GLM estimation allowed for adjustment for the calendar year or study year, as well as for within-person correlation due to multiple observations per person. Predictor variables in the GLM were selected a priori.
RESULTS
Summary of Patients
Table 1 shows the summary of included patients. The study cohort consisted of 52,782 patients (29,062 UC; 23,720 CD), consisting of 45.9% males and 54.1% females. Approximately 48% of the cohort had an index date in either 2007 or 2008 and were followed in subsequent years until end of 2015. The average age of the cohort was 48. Demographics, such as race and education, and insurance plan types are shown in Table 1. Charlson comorbidity score for most patients was zero, although a higher percentage of IBD patients compared with non-IBD control patients had a score ≥1 (P < 0.001), indicating a higher risk of death.
TABLE 1.
Cost of IBD Care Study Population Summary
| Total IBD | Total Controls | |
|---|---|---|
| N = 52,782 | N = 52,782 | |
| Age, years (mean ± SD) | 48.32 ± 17.8 | 48.32 ± 17.8 |
| Female, n (%) | 28,582 (54.2) | 28,582 (54.2) |
| Region | ||
| Northeast | 7439 (14.1) | 7439 (14.1) |
| Midwest | 15,216 (28.8) | 15,216 (28.8) |
| South | 22,947 (43.5) | 22,947 (43.5) |
| West | 7180 (13.6) | 7180 (13.6) |
| Other | 0 | 0 |
| Rurality | ||
| Urban | 44,117 (83.6) | 43,739 (82.9) |
| Rural | 1413 (2.7) | 1158 (2.2) |
| Missing | 7252 (13.7) | 7885 (14.9) |
| Charlson, (mean ± SD) | 0.6 ± 1.2 | 0.3 ± 0.8 |
| Race | ||
| White | 37,853 (71.7) | 34,564 (65.5) |
| African American/Black | 2622 (5.0) | 2998 (5.7) |
| Hispanic | 2466 (4.7) | 3652 (6.9) |
| Asian | 599 (1.1) | 1035 (2.0) |
| Other | 624 (1.2) | 605 (1.2) |
| Unknown | 8618 (16.3) | 9928 (18.8) |
| Education | ||
| Less than 12th grade | 346 (0.7) | 516 (1.0) |
| High School diploma | 13,646 (25.9) | 13,213 (25.0) |
| Some college/ Associates degree | 23,200 (44.0) | 22,493 (42.6) |
| Bachelor’s or more | 9247 (17.5) | 8792 (16.7) |
| Unknown | 6343 (12.0) | 7768 (14.7) |
| Net worth | ||
| Under $25,000 | 5210 (9.9) | 5315 (10.1) |
| $25K-$149K | 9607 (18.2) | 9560 (18.1) |
| $150K-$249K | 6780 (12.9) | 6556 (12.4) |
| $250K-$499K | 11,660 (22.1) | 11,159 (21.1) |
| $500K+ | 9879 (18.7) | 9110 (17.3) |
| Unknown | 9646 (18.3) | 11,082 (21.0) |
| Insurance Type | ||
| Commercial | 44,672 (84.6) | 44,672 (84.6) |
| Medicare Advantage | 8110 (15.4) | 8110 (15.4) |
| Plan Type | ||
| EPO | 5643 (10.7) | 5424 (10.3) |
| PPO | 4938 (9.4) | 3700 (7.0) |
| IND | 1237 (2.3) | 1387 (2.6) |
| POS | 28,245 (53.5) | 25,986 (49.2) |
| HMO | 9300 (17.6) | 6100 (11.6) |
| Other | 3419 (6.5) | 10,185 (19.3) |
Controls were selected matched to IBD patients on age, gender, geographic region, insurance type, and enrollment in the IBD patient’s index year.
Total Direct and Indirect Annual Costs per Patient
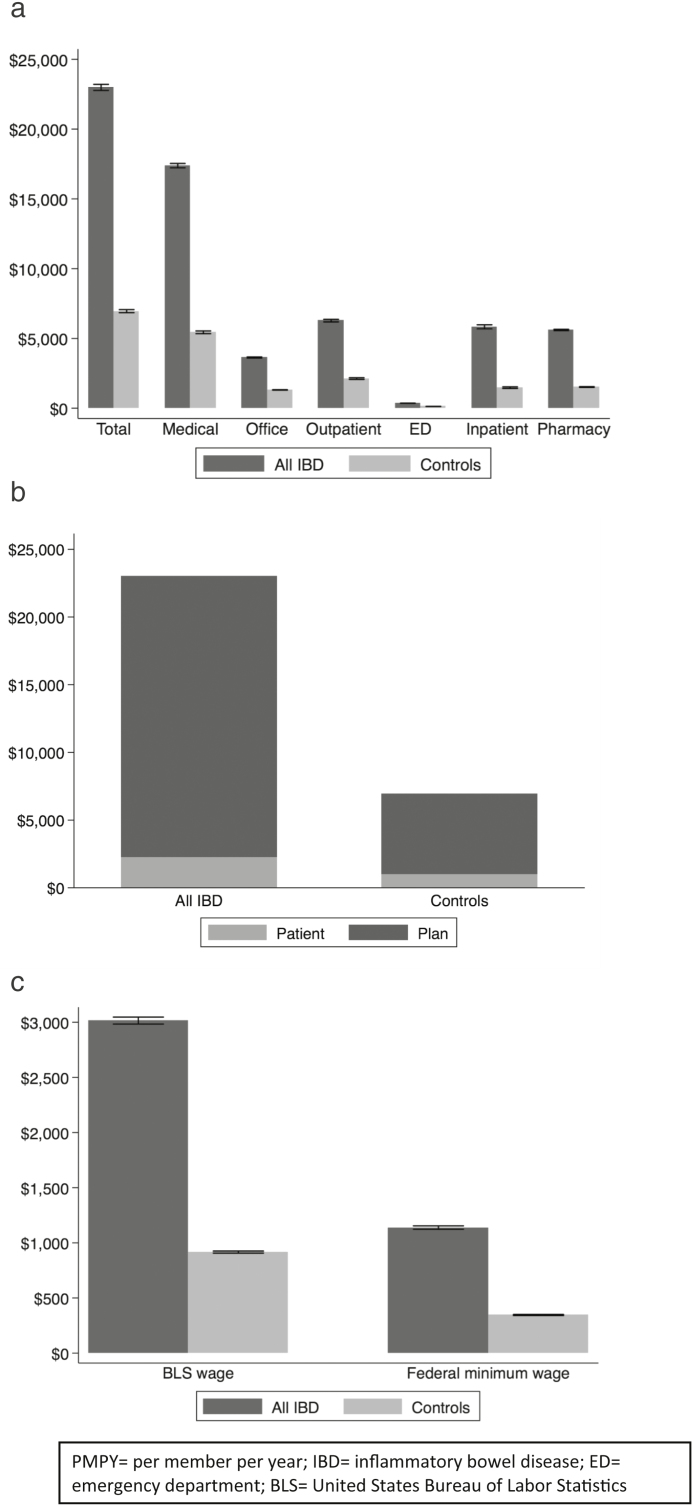
Total mean direct costs per patient per year are shown as PMPY by setting of health care service for IBD patients and non-IBD controls in Figure 2A. Patients with IBD incurred over 3-fold higher costs than their matched non-IBD counterparts ($22,987 vs $6956 PMPY). Most of the costs were from medical claims. Compared with non-IBD patients, IBD patients absorbed more than twice the out-of-pocket costs per year ($2213 vs $979), as shown in Figure 2B. Of note, this statistic does not include costs that IBD patients paid for insurance premiums (data not available) and thus likely represents an underestimate of the patient-responsible costs for health care (including IBD care). Patients with IBD also absorbed significantly higher wage-related opportunity loss based on yearly patient time costs, as shown in Figure 2C. Using the median wage, IBD patients’ lost wages were higher than the actual out-of-pocket costs on a per-year basis. See online supplementary material for a breakdown of costs based on disease state (Crohn’s disease and ulcerative colitis).
FIGURE 2.
A, Total direct annual costs per patient (PMPY) (IBD and non-IBD Controls). B, Total estimated out-of-pocket annual costs per patient (PMPY) (IBD and non-IBD Controls). C, Total annual estimated lost wages per patient (PMPY) (IBD and non-IBD Controls). Abbreviations: BLS = United States Bureau of Labor Statistics
All-cause Costs of Care
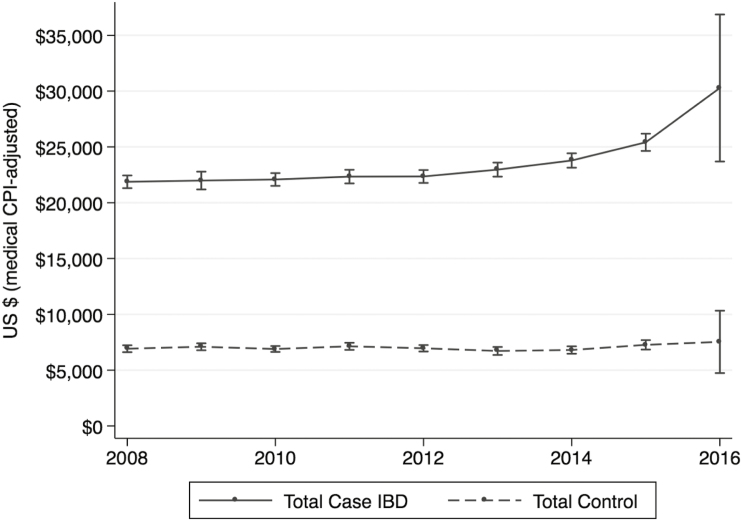
Unadjusted all-cause total costs of IBD were trended from 2007 to 2016, as shown in Figure 3. On average, CD patients had higher costs of IBD care than UC patients throughout the study period. As shown, although mean all-cause costs of IBD were stable from year to year before 2012, costs have been rising for CD and UC, particularly after 2013. This trend is not seen in non-IBD matched control patients.
FIGURE 3.
Longitudinal trends in all-cause costs of IBD.
Adjusted Costs by Age
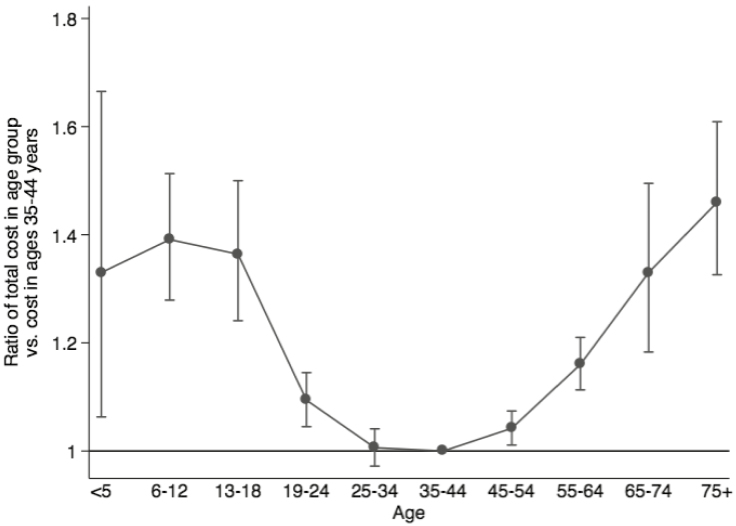
Adjusted costs were analyzed using the GLM multivariate model as previously described. Ratios of total costs for patient in assigned age groups (reference age 35 to 44) are plotted in Figure 4. A ratio of 1.0 indicates equal adjusted costs of IBD. Pediatric patients and elderly populations were noted to have up to 46% higher costs of care than IBD patients in the 35 to 44 age group (P < −0.001 for all groups vs ages 35 to 44 except for ages 24 to 34).
FIGURE 4.
Adjusted cost ratio comparison by age.
Cost of New Diagnosis
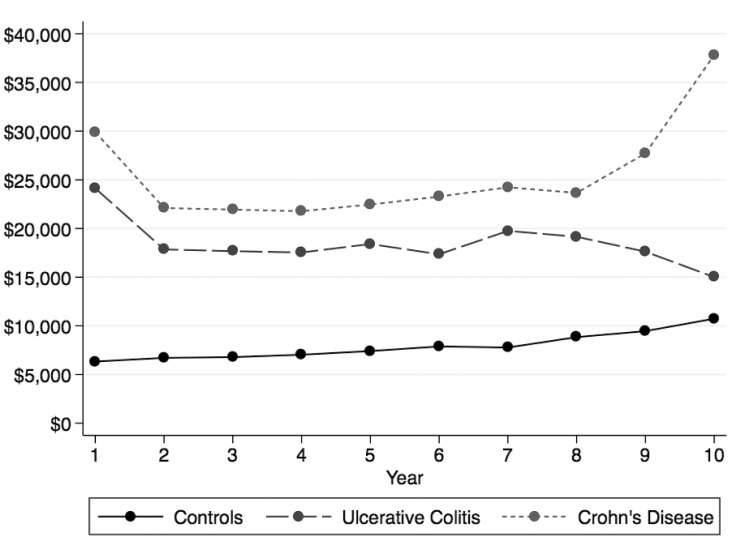
Annual costs of IBD were substantially higher in the year of the initial diagnosis (>$25,000), as shown in Figure 5. In subsequent years after diagnosis, the annual costs of IBD stabilized to around $20,000. Seven to 8 years after diagnosis, the annual costs of IBD increased again to approximately $25,000. Although the rate of increase in annual costs was higher among IBD patients compared with non-IBD matched controls (P < 0.001 IBD vs controls in each year with the exception of year 10), the increasing trend in both groups may reflect increasing costs of age-related or health system–related factors.
FIGURE 5.
Cost of New diagnosis of IBD compared with non-IBD controls.
Cost Drivers
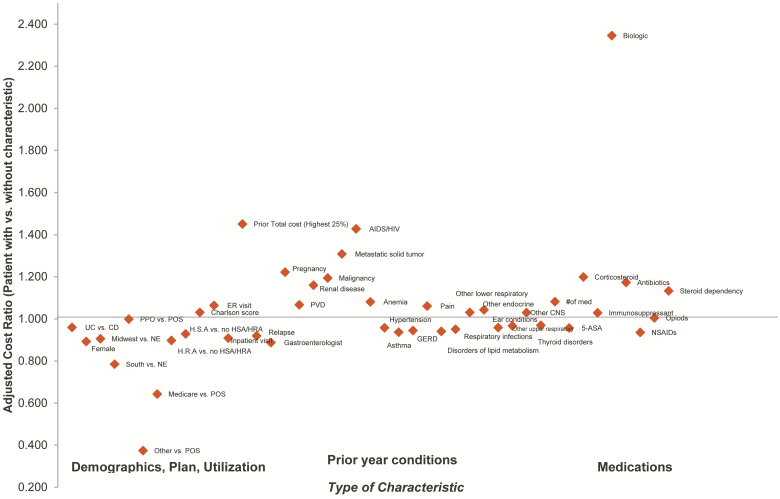
Costs were analyzed based on the identified key cost drivers related to comorbidities including anemia or psychiatric illness; therapeutics, such as opioids, steroids, or biologics use; and disease severity as manifested in IBD hospitalizations or ED use. Results from a GLM analysis showing the drivers of costs are shown in Figure 6. Adjusted costs for IBD patients were analyzed using the GLM multivariate model as previously described.
FIGURE 6.
Drivers of IBD costs of care.
Comorbidities
The presence of anemia was associated with higher resource utilization, particularly hospitalization. After adjusting for other characteristics, patients with previous diagnosis of anemia had costs that were 8% higher compared with patients without anemia (cost ratio 1.081, P < 0.001). Patients with mental health diagnoses had average costs that were roughly twice that of patients without mental health diagnoses ($35,740 vs $18,520). Patients with prior treatment by mental health specialists had higher costs (cost ratio 1.058). This analysis will be described further in a forthcoming publication.
Therapeutics
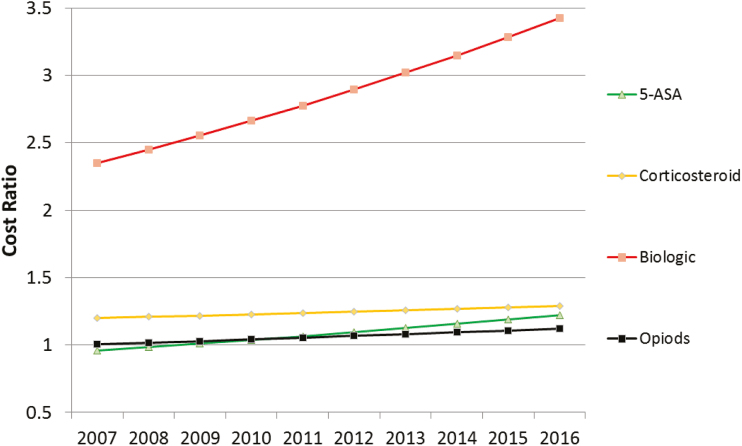
Adjusted costs of IBD pharmacotherapy were analyzed using the GLM multivariate model as previously described. Ratios of total costs for certain classes of IBD medications are plotted in Figure 7. Patients with more medications had higher costs, and this effect became larger over time. Patients treated with biologics had higher costs, an effect that increased over time. Patients using 5-ASAs or using NSAIDs had lower costs in year 1, with increased costs in later years. Patients treated with antibiotics had higher costs in year 1, with costs decreasing over time. Costs were higher for patients treated with corticosteroids, steroid dependency, or opioids. Opioid-using patients had higher use of ED and inpatient hospital stays compared with those not receiving opioids. The treatment-specific analyses will be described further in forthcoming publications.
FIGURE 7.
Cost ratios of pharmacotherapy for IBD patients. Cost ratios from generalized linear models, with ratio of cost for patients treated with the medication vs untreated with that medication in each calendar year. P < 0.05 for main effects for medications, calendar year (vs 2007) and for medicationXyear interaction term.
Emergency Department
Patients with at least 1 emergency room visit had costs that were more than twice as high as patients without ED visits ($37,759 vs $15,237). The multivariate analysis found that patients with an ED visit in the previous year had costs that were 6.4% higher compared with patients without an ED visit (cost ratio 1.064, P < 0.001).
DISCUSSION
We present an overview analysis on the cost of IBD care using administrative claims data from commercially and Medicare Advantage–insured patients from a representative US population. From this comprehensive evaluation, we observed that annual mean health care costs for patients with IBD were over 3-fold higher than patients without IBD (approximately $23,000 vs $7000). Highest costs of care were seen within the first year after the onset of the IBD diagnosis. In general, compared with control patients without IBD, patients with IBD had higher out-of-pocket costs of care and absorbed ongoing indirect costs related to caring for the disease. Out-of-pocket and indirect costs of care reported in our analysis were likely substantial underestimates due to the data sets utilized in the analysis because the data did not include insurance premiums or other indirect costs such as actual wages lost, time for caregivers, or transportation required for health care services. However, the data sets do use true paid costs, including copayments and deductibles.
While the findings of higher age-related costs of care corroborated results from previous US studies using claims data,17 we quantified that pediatric and elderly patients with IBD had nearly 50% increased costs attributable to IBD. This difference may be related to higher disease-related burden in the patients with earlier onset of IBD, but this was not explored in this analysis (see limitations). In addition, anemia, mental health disorders, chronic corticosteroid or opioid use, and ED visits were found to be cost drivers, as corroborated in other notable studies.5, 9–11, 15 Patients treated with biologics incurred higher costs of care as mentioned previously, but the analysis did not account for differences in native disease severity.
Finally, we found that while fewer than 20% of patients with IBD in general were receiving biologic therapies, this subset of the population incurred 2 to 3 times the total costs of care per year compared with patients not receiving biologic therapies. Although outside the scope of this analysis, we posit that patients on biologic therapy had higher disease severity and were subject to increased acute care costs. (A detailed analysis of costs related to biologics will be addressed in a forthcoming article in the Cost of Care Initiative series by the Foundation.)
In today’s era of effective but costly pharmacotherapies, one driver of the cost of care for patients with IBD appeared to be in outpatient pharmacy utilization. Based on preliminary data here and in other research,10, 18, 19 supported by the overall cost trends in prescription drugs in the United States,20, 21 the Foundation identified the cost of biologics as a key strategic area for improved cost-effectiveness, patient advocacy, and patient-centeredness. Facilitating better access to appropriate medications and minimizing transference of drug costs from payers to patients are 2 integral components of improved patient-centered care as identified by the IBD Cost of Care Task Force.
The importance of identifying specific cost drivers within the IBD population cannot be overstated. As payers increasingly emphasize risk-sharing contracts, provider organizations need to understand what modifiable cost drivers exist within populations of patients with chronic and relapsing diseases such as IBD. If such factors can be identified, using administrative data or information derived from an electronic medical record, interventions can be developed to target patients who are at risk for disease deterioration or health system resource use and mitigate costs while delivering better care. In this study, we identified several key variables that might be amenable to such interventions including anemia, behavioral comorbidities, recent ED use and treatment with biologic agents.
Once modifiable factors are identified, studies focused on the effectiveness of early intervention could be conducted to see whether a favorable health and economic outcome could be achieved.9 For example, identifying and treating mental and psychological factors that complicate a patient’s journey is shown to effectively lower health system resources, improve the overall health of a patient, and reduce costs.22
Inherent to analysis of large administrative claims data, patients on Medicaid, standard Medicare, or those who are uninsured were not captured in Optum, limiting the generalizability of these results to excluded subpopulations with IBD. Additional limitations to the study are that only patients who were continually enrolled were eligible for inclusion. Applying strict enrollment criteria strengthened our ability to capture the care continuum and variability of individual patients managing their disease over a longer time horizon. Also, although it could be inferred that patients treated with biologic therapies had a higher disease severity than patients not on biologics, data were not able to ascertain disease severity endpoints (eg, disease severity scores, endoscopic subscores). Additionally, although diagnostic codes represented real-life data from clinical encounters, they were subject to coding errors dependent on clinicians’ assignment at the time of billing. Finally, it was not possible to evaluate individual lost earnings, productivity, or leisure time lost in administrative claims data.
In summary, our analysis explored the cost of care for IBD patients compared with non-IBD patients over a 10-year time period. The findings from this first of a series of reports from the Crohn’s & Colitis Foundation examined the increasingly costly nature of managing IBD and reiterated the ongoing need to develop patient-centered approaches to deliver cost-effective care. The Foundation and the Cost of IBD Task Force emphasized the call to work collaboratively—including stakeholders from academia, industry, government, payers, and patient and caregiver partners—to address the increasing direct and indirect cost burden to patients and families, and developing programs to address the management of cost drivers, such as psychiatric comorbidities, treatable anemias, corticosteroids, and opioids.
Supplementary Material
ACKNOWLEDGMENTS
The authors would like to thank Optum for project support, particularly Erin Buysman MS, and Lisa Le, MS, for statistical analyses; Mary Ducharme, MLIS, Bret Gitar, MA, Jeffrey McPheeters, and Julian Tong, PhD, for statistical analysis verification; Amy Anderson, MS, Randall Gerdes, James Hartje, MS, Thomas Hortman, Eleena Koep, MS, Priyanka Koka, MSc, Vincent Peichel, Lynn Wacha, Annikka Wilson, MPH, for programming and verifying the analytic dataset; Lee Brekke, PhD, and Timothy Bancroft, PhD, for statistical consulting; Jerry Seare, MD, for consulting on codes; and Susan Peckous, MA, and Sharanya Murali, MS, for project management. The authors would also like to thank the Cost of IBD Task Force, particularly Adam Cook, Shawn Davis, Jason Gehlen, Miranda Gold, Kevin Harlen, Larry Mimms, Fred Princen, Amitabh Singh, Glen Stettin, Eric Stone, Leah Stone, Ronnie Tepp, Thomas Ullman, and Kelsei Wharton. The authors also thank the Foundation staff who were involved in this effort, particularly Savannah Bachman, Marie Granieri, Judy Hoffstein, Jeanine Kober, Sheri Markus-Kennell, Michael Osso, Alandra Weaver, and Laura Wingate. Additional thanks to Niketa Sheth (consultant for Crohn’s & Colitis Foundation) for project management support and Melody Dehghan for graphic support.
Supported by: Funding for this initiative is made possible through a grant from the Leona M. and Harry B. Helmsley Charitable Trust and United Health Group.
Conflicts of Interest:
At the time of study analysis and manuscript development, KTP had no conflicts relevant to this manuscript; at time of publication, KTP is an employee at Genentech, Inc. and shareholder in the Roche Group. SMM is a consultant for Sandoz, unrelated to this article. MR has received research support from AbbVie, Janssen, and Takeda and unrestricted educational grants from AbbVie, Janssen, UCB, Pfizer, Takeda, Salix, Shire; he has served on advisory boards and as a consultant for AbbVie, Janssen, UCB, Takeda, Pfizer, Miraca Labs, Amgen, Celgene, Seres, and Allergan. DR has received research support from AbbVie, Janssen, and Takeda and unrestricted educational grants (investigator or institutional) from AbbVie, Janssen, Takeda, and Shire; he has served on advisory boards and as a consultant for Abbvie, Janssen, UCB, Takeda, Pfizer, Amgen, Celgene, Seres, Abgenomics, Genentech/Roche, Bristol Meyers Squibb, and Merck.
NMEN is an employee of Optum and shareholder in UnitedHealth Group. Optum received funding for this study. OE, JA, PM, ES, KH, SK, RL, and CH have no conflicts.
REFERENCES
- 1. Dahlhamer JM, Zammitti EP, Ward BW, et al. . Prevalence of inflammatory bowel disease among adults aged ≥18 years—United States, 2015. MMWR Morb Mortal Wkly Rep. 2016;65(42):1166–1169. [DOI] [PubMed] [Google Scholar]
- 2. Sonnenberg A. Demographic characteristics of hospitalized IBD patients. Dig Dis Sci. 2009;54:2449–2455. [DOI] [PubMed] [Google Scholar]
- 3. Kaplan GG. The global burden of IBD: from 2015 to 2025. Nat Rev Gastroenterol Hepatol. 2015;12:720–727. [DOI] [PubMed] [Google Scholar]
- 4. Gibson TB, Ng E, Ozminkowski RJ, et al. . The direct and indirect cost burden of Crohn’s disease and ulcerative colitis. J Occup Environ Med. 2008;50:1261–1272. [DOI] [PubMed] [Google Scholar]
- 5. Park KT, Colletti RB, Rubin DT, et al. . Health insurance paid costs and drivers of costs for patients with Crohn’s disease in the United States. Am J Gastroenterol. 2016;111:15–23. [DOI] [PubMed] [Google Scholar]
- 6. Cohen RD, Larson LR, Roth JM, et al. . The cost of hospitalization in Crohn’s disease. Am J Gastroenterol. 2000;95:524–530. [DOI] [PubMed] [Google Scholar]
- 7. Rubin DT, Mody R, Davis KL, et al. . Real-world assessment of therapy changes, suboptimal treatment and associated costs in patients with ulcerative colitis or Crohn’s disease. Aliment Pharmacol Ther. 2014;39:1143–1155. [DOI] [PubMed] [Google Scholar]
- 8. Gunnarsson C, Chen J, Rizzo JA, et al. . Direct health care insurer and out-of-pocket expenditures of inflammatory bowel disease: evidence from a US national survey. Dig Dis Sci. 2012;57:3080–3091. [DOI] [PubMed] [Google Scholar]
- 9. Limsrivilai J, Stidham RW, Govani SM, et al. . Factors that predict high health care utilization and costs for patients with inflammatory bowel diseases. Clin Gastroenterol Hepatol. 2017;15:385–392.e2. [DOI] [PMC free article] [PubMed] [Google Scholar]
- 10. Rao BB, Click BH, Koutroubakis IE, et al. . The cost of Crohn’s disease: varied health care expenditure patterns across distinct disease trajectories. Inflamm Bowel Dis. 2017;23:107–115. [DOI] [PMC free article] [PubMed] [Google Scholar]
- 11. Yu H, MacIsaac D, Wong JJ, et al. . Market share and costs of biologic therapies for inflammatory bowel disease in the USA. Aliment Pharmacol Ther. 2018;47:364–370. [DOI] [PMC free article] [PubMed] [Google Scholar]
- 12. Park KT, Bass D. Inflammatory bowel disease-attributable costs and cost-effective strategies in the United States: a review. Inflamm Bowel Dis. 2011;17:1603–1609. [DOI] [PubMed] [Google Scholar]
- 13. Levy S, Bagley N, Rajkumar R. Reform at risk - mandating participation in alternative payment plans. N Engl J Med. 2018;378:1663–1665. [DOI] [PubMed] [Google Scholar]
- 14. Smith KW, Bir A, Freeman NL, et al. . Impact of health care delivery system innovations on total cost of care. Health Aff (Millwood). 2017;36:509–515. [DOI] [PubMed] [Google Scholar]
- 15. Wong JJ, Sceats L, Dehghan M, et al. . Depression and healthcare utilization in patients with inflammatory bowel disease. J Crohns Colitis. 2018;13:19–2. [DOI] [PubMed] [Google Scholar]
- 16. Charlson M, Szatrowski TP, Peterson J, et al. . Validation of a combined comorbidity index. J Clin Epidemiol. 1994;47:1245–1251. [DOI] [PubMed] [Google Scholar]
- 17. Kappelman MD, Rifas-Shiman SL, Porter CQ, et al. . Direct health care costs of Crohn’s disease and ulcerative colitis in US children and adults. Gastroenterology. 2008;135:1907–1913. [DOI] [PMC free article] [PubMed] [Google Scholar]
- 18. van der Valk ME, Mangen MJ, Leenders M, et al. . Healthcare costs of inflamatory bowel disease have shift ed from hospitalisation and surgery towards anti-TNFα therapy: results from the COIN study. Gut. 2014;63:72–9. [DOI] [PubMed] [Google Scholar]
- 19. van der Valk ME, Mangen MJ, Severs M, et al. ; COIN study group and the Dutch Initiative on Crohn and Colitis. Evolution of costs of inflammatory bowel disease over two years of follow-up. Plos One. 2016;11:e0142481. [DOI] [PMC free article] [PubMed] [Google Scholar]
- 20. Kesselheim AS, Avorn J, Sarpatwari A. The high cost of prescription drugs in the United States: origins and prospects for reform. JAMA. 2016;316:858–871. [DOI] [PubMed] [Google Scholar]
- 21. Health Care Cost Institute (HCCI). Changes in health care spending in 2012. A summary of HCCI’s Health Care Cost and Utilization Report, Issue Brief #3 September 2012. https://www.healthcostinstitute.org/research/annual-reports/entry/2017-health-care-cost-and-utilization-report [Google Scholar]
- 22. Szigethy EM, Allen JI, Reiss M, et al. . White paper AGA: the impact of mental and psychosocial factors on the care of patients with inflammatory bowel disease. Clin Gastroenterol Hepatol. 2017;15:986–997. [DOI] [PubMed] [Google Scholar]
Associated Data
This section collects any data citations, data availability statements, or supplementary materials included in this article.


