Abstract
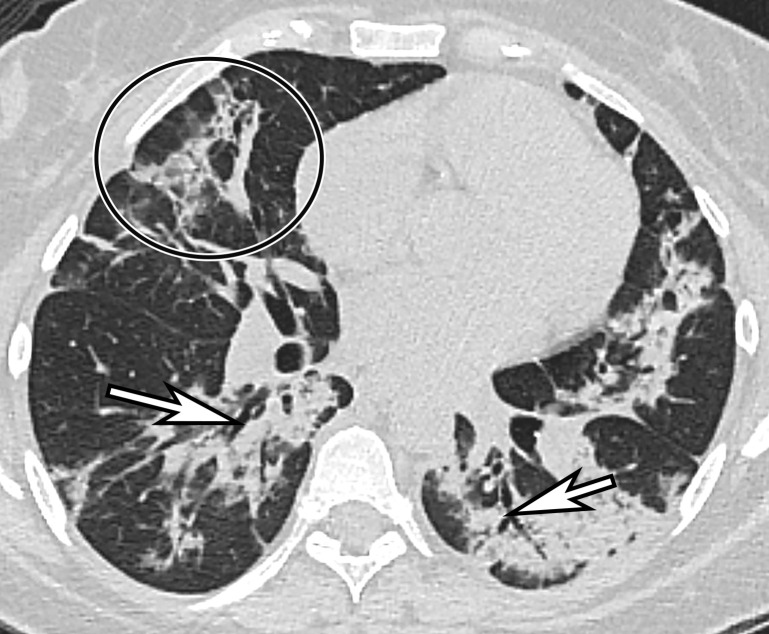
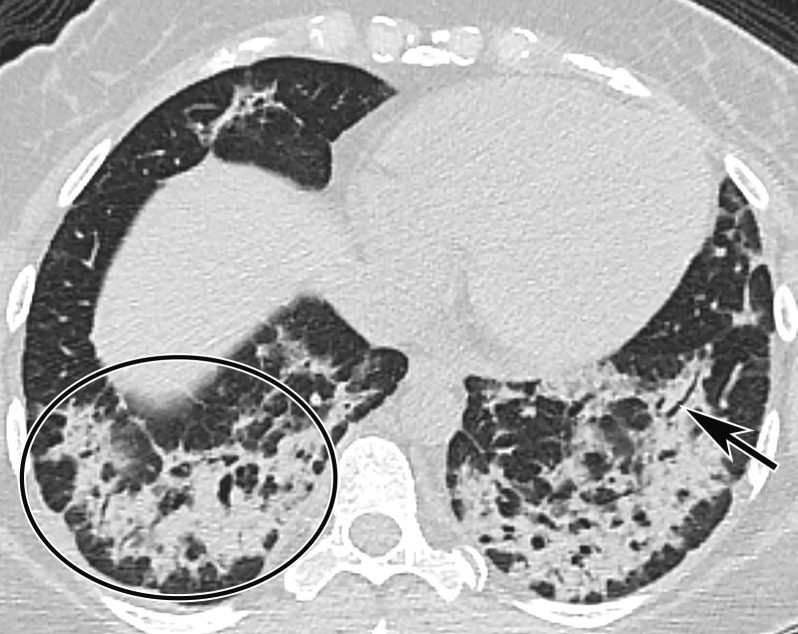
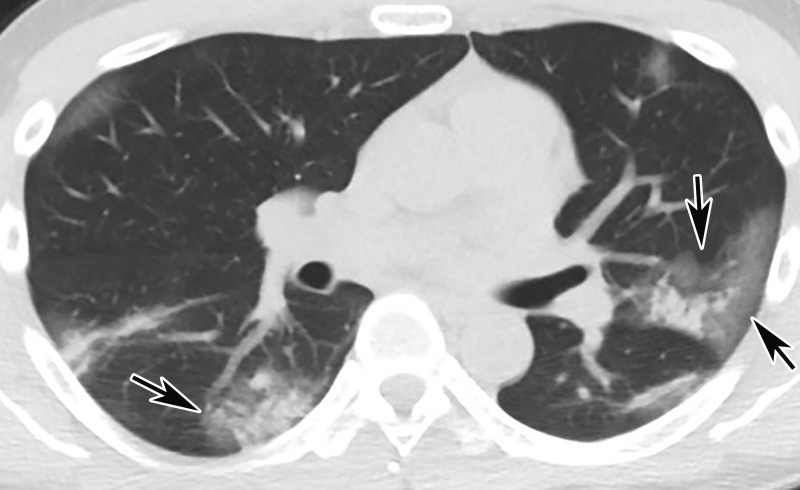
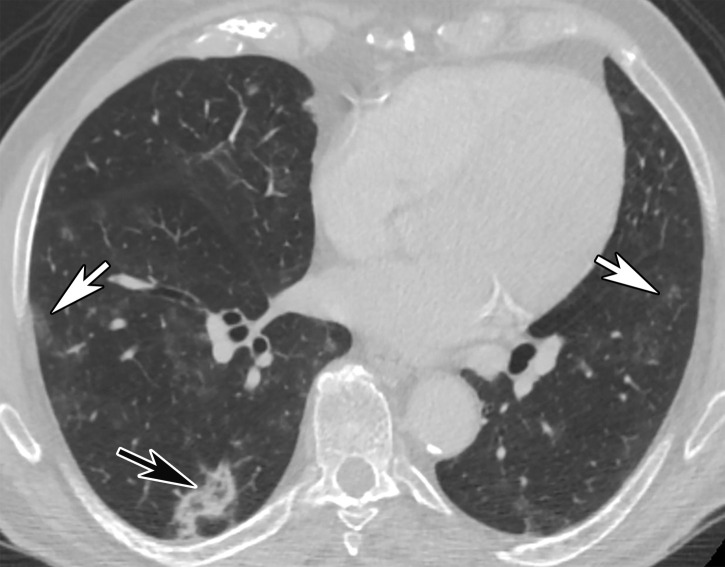
Infection with severe acute respiratory syndrome coronavirus 2 (SARS-CoV-2) results in coronavirus disease 2019 (COVID-19), which was declared an official pandemic by the World Health Organization on March 11, 2020. The infection has been reported in most countries around the world. As of August 2020, there have been over 21 million cases of COVID-19 reported worldwide, with over 800 000 COVID-19–associated deaths. It has become apparent that although COVID-19 predominantly affects the respiratory system, many other organ systems can also be involved. Imaging plays an essential role in the diagnosis of all manifestations of the disease, as well as its related complications, and proper utilization and interpretation of imaging examinations is crucial. With the growing global COVID-19 outbreak, a comprehensive understanding of the diagnostic imaging hallmarks, imaging features, multisystemic involvement, and evolution of imaging findings is essential for effective patient management and treatment. To date, only a few articles have been published that comprehensively describe the multisystemic imaging manifestations of COVID-19. The authors provide an inclusive system-by-system image-based review of this life-threatening and rapidly spreading infection. In part 1 of this article, the authors discuss general aspects of the disease, with an emphasis on virology, the pathophysiology of the virus, and clinical presentation of the disease. The key imaging features of the varied pathologic manifestations of this infection that involve the pulmonary and peripheral and central vascular systems are also described. Part 2 will focus on key imaging features of COVID-19 that involve the cardiac, neurologic, abdominal, dermatologic and ocular, and musculoskeletal systems, as well as pediatric and pregnancy-related manifestations of the virus. Vascular complications pertinent to each system will be also be discussed in part 2.
Online supplemental material is available for this article.
©RSNA, 2020
SA-CME LEARNING OBJECTIVES
After completing this journal-based SA-CME activity, participants will be able to:
■ Describe the pathophysiology and clinical presentation of SARS-CoV-2, as well as its effects on the immune system and coagulatory pathway.
■ Discuss the most appropriate imaging modalities and current radiologic recommendations for the diagnosis of pulmonary and vascular manifestations of COVID-19 and their related complications.
■ Recognize key imaging features of the pulmonary and peripheral and central vascular manifestations of COVID-19, as well as their complications.
Introduction
In December 2019, a novel coronavirus, severe acute respiratory syndrome coronavirus 2 (SARS-CoV-2), was identified as the cause of a cluster of pneumonia cases in Wuhan, a city in the Hubei province of China. In the first few months of 2020, infection with this novel coronavirus led to a global pandemic that has now affected almost every country in the world, and, by August 2020, over 21 million cases had been documented (1,2). Although SARS-CoV-2 disease (or coronavirus disease 2019 [COVID-19]) primarily manifests as a lung infection, with symptoms ranging from those of a mild upper respiratory infection to severe pneumonia and acute respiratory distress syndrome (ARDS), other multisystemic manifestations of this disease and related complications are becoming more commonly recognized (3).
In this article, we provide an inclusive review of this potentially life-threatening and highly contagious infection, with emphasis on clinical presentation, the pathophysiology of the virus, and the role of imaging in diagnosing and monitoring the viral infection and its related complications. We provide a system-by-system review of the key imaging features of the various pathologic manifestations known to date, as well as offer relevant prognostic information that can be inferred from imaging findings. In part 1 of this article, we discuss general aspects of the disease, with an emphasis on virology, the pathophysiology of the virus, and clinical presentation of the disease. In addition, we describe in detail the key imaging features of the varied pathologic manifestations of this infection that involve the pulmonary and peripheral and central vascular systems.
All medical professionals, including radiologists, have been given the daunting task of recognizing the varied presentations and complications of COVID-19 to ensure prompt diagnosis and thereby limit viral spread, as well as provide appropriate care to patients with the goal of improving recovery.
Background
Virology
Coronaviruses are nonsegmented enveloped RNA viruses with a single-strand linear positive-sense RNA (4,5). Six types of coronavirus have been identified that cause human disease. Four of these cause mild respiratory symptoms whereas the other two, Middle East respiratory syndrome (MERS-CoV) coronavirus and severe acute respiratory syndrome coronavirus (SARS-CoV-1), have previously resulted in epidemics with high mortality rates (6). Although the genome of SARS-CoV-2 is 80% identical to that of SARS-CoV-1, it is more similar to the genome of bat coronaviruses (96% identical) (7). Both SARS-CoV-1 and SARS-CoV-2 have similar receptor-binding gene regions, thus for cell entry both viruses use the same angiotensin-converting enzyme 2 (ACE2) receptor (7). Currently, two different types of SARS-CoV-2 have been identified. However, the implications of this finding are uncertain (8).
Diagnosis
COVID-19 is generally diagnosed with the results of a real-time reverse transcription–polymerase chain reaction (RT-PCR) test of a nasopharyngeal specimen obtained with a swab. However, this test may obtain false-negative results owing to a variety of factors, including insufficient viral load, improper collection of viral samples, and technical errors during the swabbing procedure (9,10).
Epidemiology
More than 21 million confirmed cases of COVID-19 have been reported to date around the world, within all continents except for Antarctica, and the incidence has been steadily rising (11). In the United States, COVID-19 has been reported in all 50 states, the District of Columbia, and at least four territories (12). The cumulative incidence varies by state and is likely dependent on a number of factors, including population density and demographics, the extent of testing and reporting, and the initiation of mitigation strategies.
In the United States, outbreaks in long-term care facilities and homeless shelters have underscored the risk of exposure and infection in group settings (13). The main mode of transmission is person to person. However, other sources of transmission have also been implicated (14–16). Person-to-person transmission is thought to occur mainly through respiratory droplets that are released in a cough or sneeze or during conversation. Droplets typically do not travel more than 6 ft (about 2 m) and are not thought to linger in the air, although this notion has been challenged (14–16).
Environmental contamination also plays a role in viral transmission and occurs through droplet accumulation on frequently touched surfaces, with subsequent spread to susceptible mucous membranes within the mouth, nose, and eyes (14–16). Men are disproportionately more commonly affected by an infection with SARS-CoV-2, and the in-hospital mortality rate among male patients is significantly higher compared with that of female patients (17).
Viral Shedding and Infectivity
There is uncertainty regarding the time interval during which an individual with COVID-19 is infectious. It appears that the virus can be transmitted before the development of symptoms and throughout the course of illness. However, definitive data are not yet available, as most information on this subject comes from studies that evaluated the presence of viral RNA in respiratory and other specimens, which may not correlate with infectivity.
Transmission of SARS-CoV-2 from asymptomatic individuals (or individuals within the incubation period) has been well documented (18–22). However, the extent to which asymptomatic and presymptomatic transmission occurs and their relative contribution to the spread of the pandemic remain unknown. The length of time an individual remains infectious is also uncertain. The duration of viral shedding is variable, and there appears to be a wide range, which may be dependent on the severity of illness (23–25).
Mechanism of SARS-CoV-2 Invasion into Host Cells
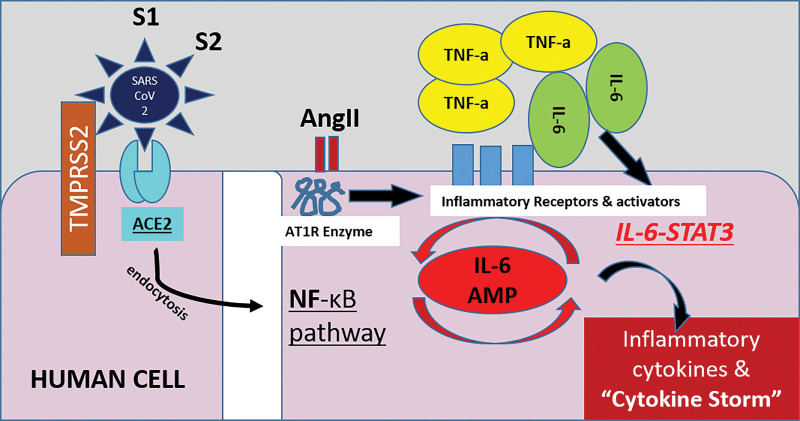
The life cycle of the virus within the host consists of the following five steps: (a) attachment, (b) pen-etration (viral entry to the cell), (c) biosynthesis (viral replication), (d) maturation (assembly and accumulation), and (e) release (through cell destruction). ACE2 has been identified as a functional receptor for SARS-CoV-2 (26). In the human body, ACE2 expression is high in the lung (expressed on lung epithelial cells), heart, gastrointestinal system, kidney, pancreas, spleen, bladder, cornea, and blood vessels (27,28). SARS-CoV-2 enters a human cell by binding its spike or S protein to the ACE2 receptor of the host, with subsequent fusion of the viral and cell membranes (endocytosis), resulting in viral cell entry and depletion of ACE2 receptors on the cell surface (29). Once within a cell, the virus activates the intracellular immune system, which causes immune and nonimmune cells to release large amounts of proinflammatory cytokines that activate a cytokine storm and result in damage to the host (30) (Fig 1).
Figure 1.
Illustration shows the proposed mechanism of SARS-CoV-2 cell entry and activation of the immune system. SARS-CoV-2 enters human cells by attaching to a cell surface receptor (ACE2) and by utilizing a human enzyme called transmembrane serine protease 2 (TMPRSS2). Once bound to the receptor, SARS-CoV-2 undergoes endocytosis and enters into the cell, along with the ACE2 receptor. This process reduces the number of ACE2 receptors on cells, leading to an increase of angiotensin II (AngII) levels in the blood. Angiotensin II triggers an inflammatory pathway involving NF-κB and interleukin 6–signal transducer and activator of transcription 3 protein (IL-6-STAT3), particularly in nonimmune cells including endothelial and epithelial cells. This pathway forms a positive feedback cycle, named IL-6 amplifier (IL-6 AMP), resulting in its excessive activation and therefore the cytokine storm and ARDS. Part of this pathway involving NF-κB, IL-6-STAT3, or both is enhanced with age, which could be the reason why older patients are more at risk for death following COVID-19 diagnosis compared with other age groups. S1 = viral spike protein subunit 1, S2 = viral spike protein subunit 2,TNF-a = tumor necrosis factor-α.
Immunity
Antibodies to the virus are induced in those patients with SARS-CoV-2 infection. However, it is unknown whether all patients with SARS-CoV-2 infection mount a protective immune response and how long any protective effect will last. Preliminary data on protective immunity are beginning to emerge (31,32).
Clinical Features
The incubation period for COVID-19 is believed to be less than 14 days following exposure, with most cases manifesting 4–5 days after exposure (19,33–35). The clinical presentation spectrum varies and includes mild to moderate symptoms (80%), severe symptoms (14%–15%), and critical illness (5%). There is increasing evidence that many patients with COVID-19 are asymptomatic yet are able to transmit the virus to others. On the basis of data from several most recent meta-analyses, it has been estimated that approximately 15%–45% of patients with confirmed COVID-19 are asymptomatic. However, it is important to recognize that a large percentage of patients with no symptoms at the time of detection will become symptomatic later. For a more accurate estimation of patients with confirmed COVID-19 who remain asymptomatic throughout the disease course, longitudinal data must be collected over a sufficient period of time to allow distinction between asymptomatic and presymptomatic cases (36,37).
In addition, various studies have reported that children are likely to have a higher proportion of asymptomatic infection than adults. However, the largest meta-analysis and systematic review studies to date report that only approximately 17%–27.7% of confirmed pediatric cases are asymptomatic (37,38). As with the adult population, the accuracy of this reported data remains unclear, as there are significant concerns regarding potential selection bias and testing error.
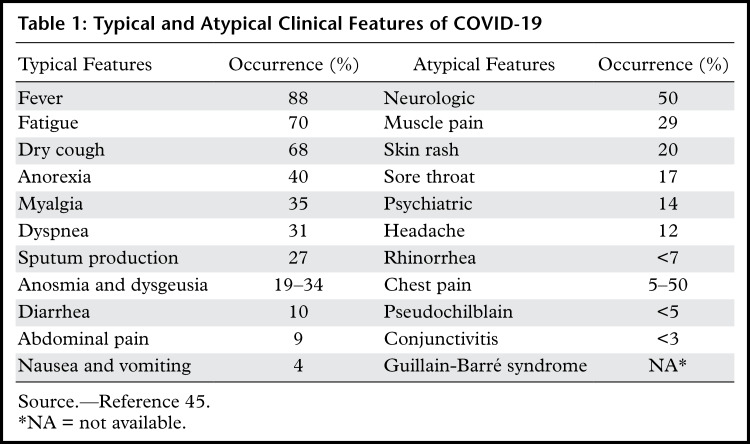
The most common symptoms at presentation are fever, cough, and shortness of breath. Mild to moderate disease is generally characterized by constitutional symptoms and the possible development of mild pneumonia, while symptoms of severe disease include dyspnea and hypoxia, as well as more than 50% lung involvement at imaging within 24–48 hours of symptom onset. Critically ill patients are diagnosed with respiratory failure, shock, or multiorgan dysfunction (39–44). Although most symptoms are respiratory in nature, clinical features of the disease may vary, with both typical and atypical presentations (Table 1). Recovery time appears to be around 2 weeks for mild infections and 3–6 weeks for severe disease (46).
Table 1:
Typical and Atypical Clinical Features of COVID-19
Complications
The SARS-CoV-2 virus has the potential to cause complications in every body system. ARDS is a major complication of severe COVID-19, seen in 20%–40% of patients with severe symptoms, and typically develops within 6–8 days after the onset of dyspnea. Up to 12% of patients with ARDS will require mechanical ventilation (47,48). ARDS is usually seen in patients greater than 65 years of age and/or those with risk factors (discussed in the following section) (48).
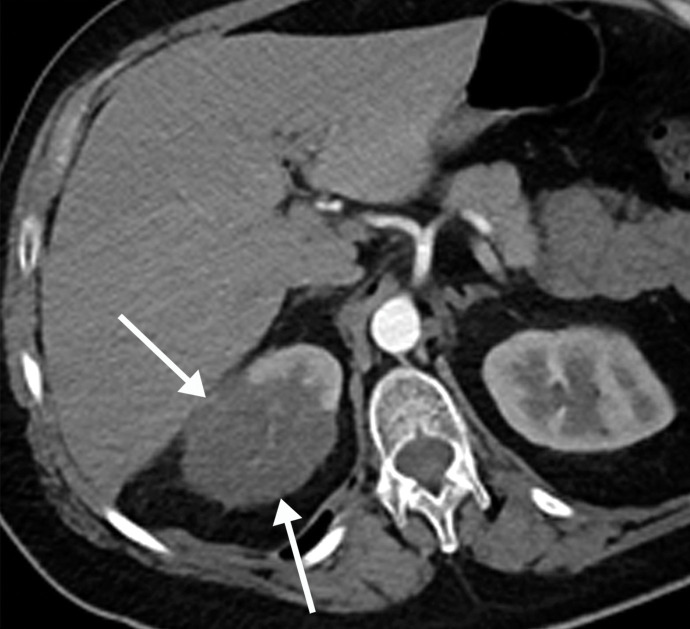
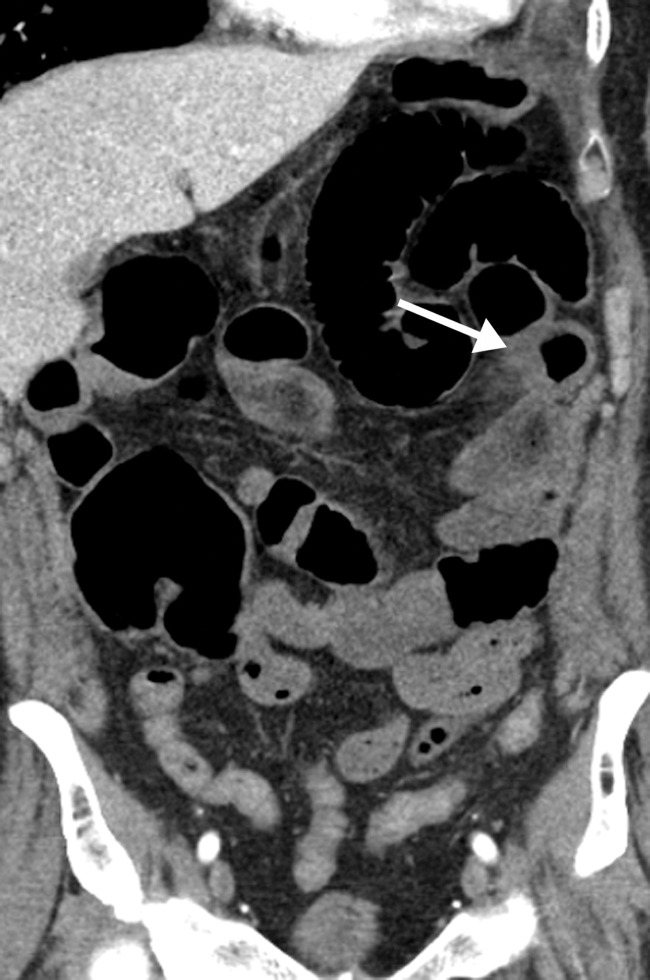
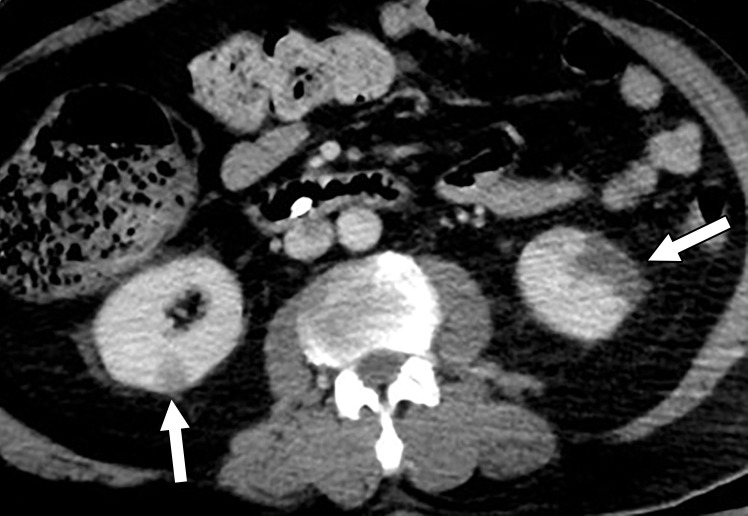
Cardiac complications include arrhythmias (including atrial fibrillation), acute myocarditis, cardiomyopathy, and shock (47,49). Abdominal and/or pelvic solid organ injury is also commonly seen. Thromboembolic complications, including pulmonary embolism (PE), peripheral venous and arterial thrombosis, and acute stroke (seen also in patients older than 50 years without risk factors) have all been reported (50–57).
Impact of Age and Underlying Conditions
Individuals of any age can acquire SARS-CoV-2 infection, although adults middle-aged and older are most commonly affected, and older adults are more likely to experience severe disease (41,42,58). Older age is also associated with increased mortality (41,42,58). Eighty-seven percent of patients diagnosed with COVID-19 are 30–79 years of age (41), and 80% percent of reported deaths have occurred in those aged greater than or equal to 65 years. Children are significantly less affected and exhibit a milder spectrum of disease.
An increased risk of developing severe illness and increased mortality have been reported in patients with underlying cardiovascular disease, diabetes mellitus, hypertension, chronic lung disease, cancer (particularly hematologic malignancies, lung cancer, and metastatic disease), obesity, and chronic kidney disease (44,59–61). The Centers for Disease Control and Prevention also includes immunocompromised status and liver disease as potential risk factors for severe illness, although specific data regarding risks associated with these conditions are limited.
Laboratory Test Findings
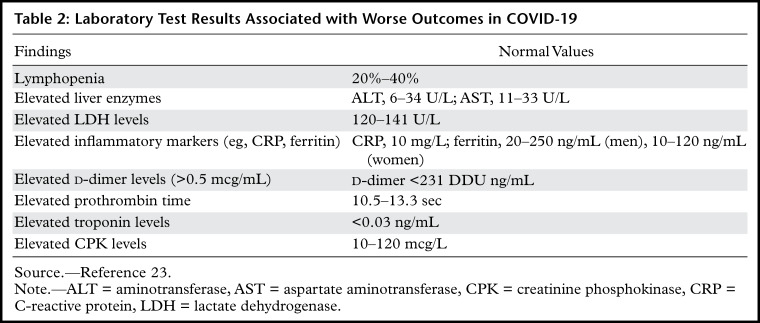
Common laboratory test findings in those patients admitted to the hospital with COVID-19 include lymphopenia and elevated aminotransaminase, lactate dehydrogenase, and inflammatory marker levels (eg, ferritin, C-reactive protein, and erythrocyte sedimentation rate) (34,62,63). Lymphopenia is particularly common and is characterized by a lymphocyte count less than 1500/microL. Up to 13% of patients have leukocytosis (>10 000/microL) and 15% of patients have leukopenia (<4000/microL) (63). In those patients who require treatment in the intensive care unit (ICU) for pneumonia and/or other multisystem manifestations, serum procalcitonin levels are more likely to be elevated (41,62). Several laboratory test features, including elevated d-dimer levels (>2.0 mg/mL) and severe lymphopenia, have been associated with higher mortality rates (Table 2) (41,45).
Table 2:
Laboratory Test Results Associated with Worse Outcomes in COVID-19
Pulmonary Manifestations of COVID-19
Respiratory illness is the most commonly associated manifestation of SARS-CoV-2. This is due to abundant ACE2 receptor expression in the lung parenchyma, specifically on the acinar side of lung epithelial cells (pneumocytes) within the alveolar spaces, allowing virus entry (Fig 1) (5). This correlates with the observation that the earliest lung injury is often seen in the distal airways (64). As discussed previously, alveolar damage is also attributable to the release of cytokines and chemokines that allow fluids to fill the pulmonary interstitium and acini, and the hypercoagulable state associated with COVID-19 that results in micro- and macrothrombosis of the pulmonary vasculature (65).
Role of Imaging
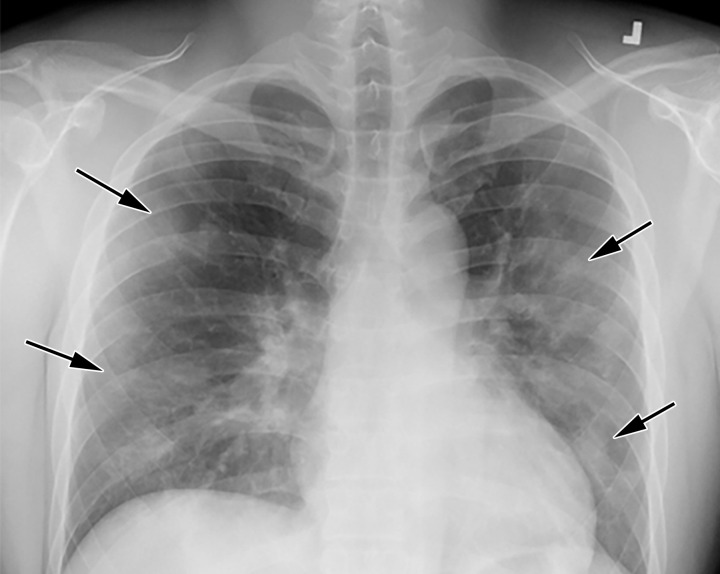
Chest radiography is typically the first-line imaging modality performed in patients with suspected COVID-19 infection. At patient admission, initial posteroranterior or anteroposterior (AP) chest radiographs are obtained, usually with the use of an intervening glass door to minimize exposure to the technologist (this technique provides adequate quality for chest radiograph acquisition when compared with that of conventional methods) (66). Pulmonary consolidations and other pneumonia-related changes may be diagnosed when interpreting images obtained using this technique, as well as changes related to ARDS in patients who are critically ill. At early stages of disease and in mild cases, findings at chest radiography may be normal. Wong et al (64) found that initial chest radiography findings were abnormal in 69% of patients who required hospital admission, and in 80% of patients who had already been hospitalized (64).
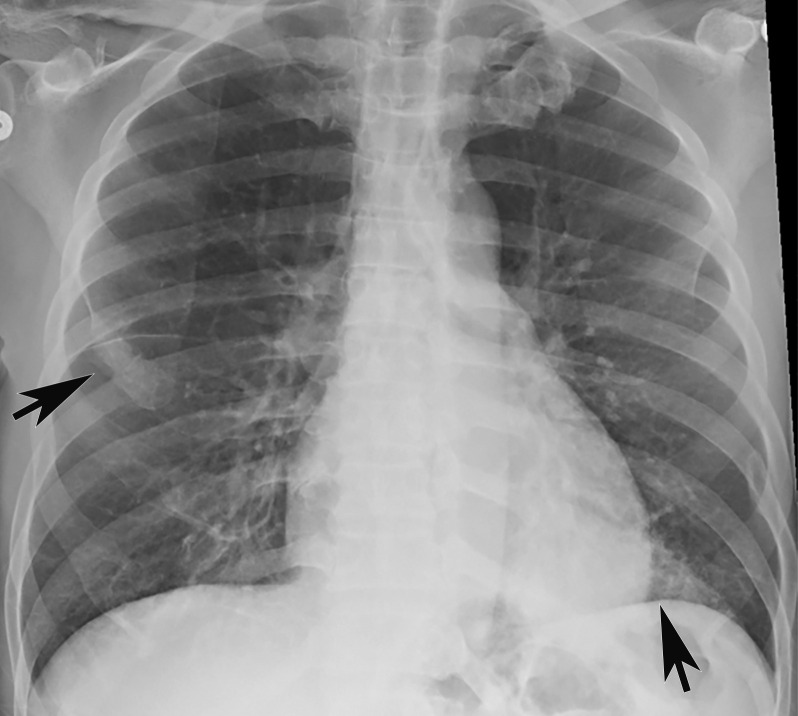
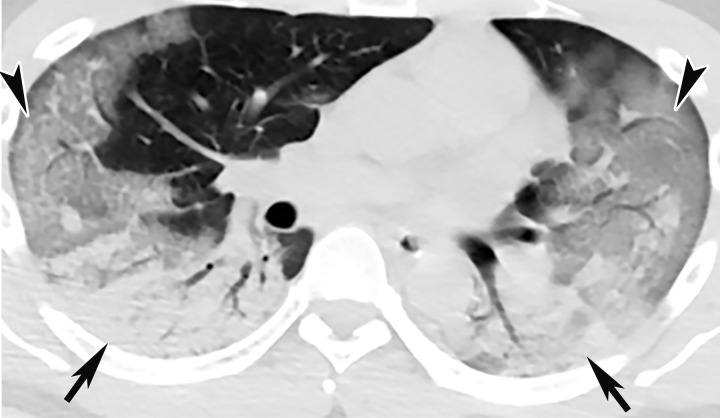
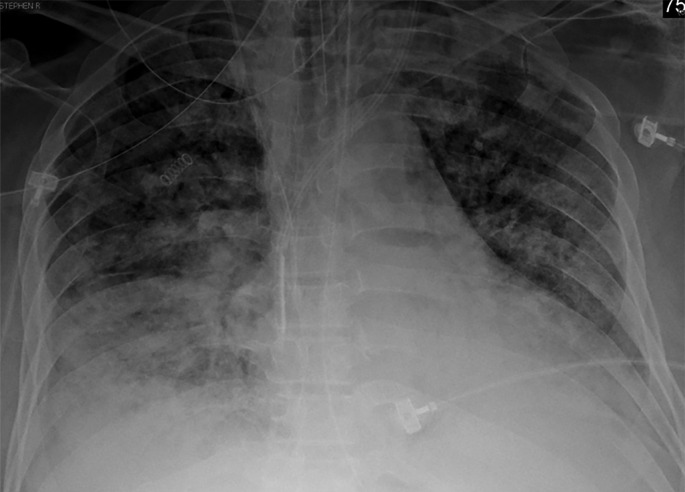
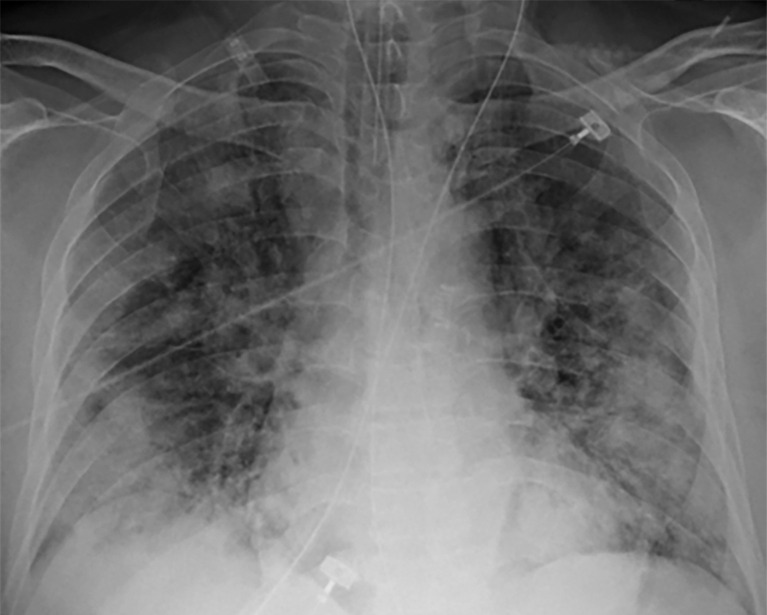
Chest Radiography and CT.—The most commonly reported findings of COVID-19 at chest radiography include lung consolidation and ground-glass opacities (GGOs)(67). Reticular opacities may accompany areas of GGOs and can be well depicted on standard chest radiographs. Viral pneumonias, including COVID-19, typically produce lung opacities in more than one lobe. Additionally, evidence of multifocal air-space disease on chest radiographs can be indicative of COVID-19 pneumonia, most frequently in a lower lung distribution and bilateral (Fig 2). Peripheral lung involvement is one of the most specific features of this infection, although it may resemble other inflammatory processes with multifocal, patchy, or confluent distribution of findings, such as organizing pneumonia (Fig 3).
Figure 2a.
COVID-19 progression over 4 days in a 28-year-old man. (a) Posteroranterior chest radiograph shows bilateral multiple peripheral and lower lobe GGOs (arrows). (b) Axial non–contrast material–enhanced CT image obtained 4 days later shows progression of the typical appearance of COVID pneumonia, manifesting with bilateral GGOs (arrowheads), peripheral on the right and diffuse on the left. In addition, there is rapid worsening of the lung pneumonia, with development of bilateral lower lobe airspace consolidations (arrows).
Figure 3a.
Longitudinal assessment of COVID-19 pneumonia progression in a 56-year-old man who presented to the emergency department with dyspnea and dry cough. (a) AP chest radiograph obtained at hospital admission at the time of symptom onset shows bilateral pulmonary opacities (arrows) at the periphery of the right mid lung and at the left lung base. (b) AP chest radiograph obtained on day 8 of hospitalization shows progression of multifocal opacities bilaterally, which now involve more than two lobes, and interval development of bibasilar consolidations. These findings correspond to a higher severity score and carry a worse prognosis. In addition, there is mild pulmonary edema, suggestive of fluid overload. Note that the patient had undergone intubation. (c) AP chest radiograph obtained on day 14 of hospitalization shows progression of the multifocal bilateral peripheral opacities.
Figure 2b.
COVID-19 progression over 4 days in a 28-year-old man. (a) Posteroranterior chest radiograph shows bilateral multiple peripheral and lower lobe GGOs (arrows). (b) Axial non–contrast material–enhanced CT image obtained 4 days later shows progression of the typical appearance of COVID pneumonia, manifesting with bilateral GGOs (arrowheads), peripheral on the right and diffuse on the left. In addition, there is rapid worsening of the lung pneumonia, with development of bilateral lower lobe airspace consolidations (arrows).
Figure 3b.
Longitudinal assessment of COVID-19 pneumonia progression in a 56-year-old man who presented to the emergency department with dyspnea and dry cough. (a) AP chest radiograph obtained at hospital admission at the time of symptom onset shows bilateral pulmonary opacities (arrows) at the periphery of the right mid lung and at the left lung base. (b) AP chest radiograph obtained on day 8 of hospitalization shows progression of multifocal opacities bilaterally, which now involve more than two lobes, and interval development of bibasilar consolidations. These findings correspond to a higher severity score and carry a worse prognosis. In addition, there is mild pulmonary edema, suggestive of fluid overload. Note that the patient had undergone intubation. (c) AP chest radiograph obtained on day 14 of hospitalization shows progression of the multifocal bilateral peripheral opacities.
Figure 3c.
Longitudinal assessment of COVID-19 pneumonia progression in a 56-year-old man who presented to the emergency department with dyspnea and dry cough. (a) AP chest radiograph obtained at hospital admission at the time of symptom onset shows bilateral pulmonary opacities (arrows) at the periphery of the right mid lung and at the left lung base. (b) AP chest radiograph obtained on day 8 of hospitalization shows progression of multifocal opacities bilaterally, which now involve more than two lobes, and interval development of bibasilar consolidations. These findings correspond to a higher severity score and carry a worse prognosis. In addition, there is mild pulmonary edema, suggestive of fluid overload. Note that the patient had undergone intubation. (c) AP chest radiograph obtained on day 14 of hospitalization shows progression of the multifocal bilateral peripheral opacities.
A pattern of diffuse lung opacities may also be seen with COVID-19 infection, as well as a number of other infectious and/or inflammatory processes, such as ARDS. During the disease course, lung opacities may rapidly evolve into a diffuse coalescent or consolidative pattern within 1–3 weeks after symptom onset, often peaking around 6–12 days after initial clinical presentation (Fig 3) (68,69). Pleural effusions, lung cavitation, and pneumothorax are rare findings in COVID-19 and, when depicted on chest radiographs, should raise suspicion for other potential causes (70–72). In young and middle-aged patients, the extent of GGOs at chest radiography have been shown to correlate with the need for hospitalization and performing intubation. Toussie et al (73) reported that patients with GGOs depicted in at least two lung zones are more likely to require hospitalization and those with GGOs in three zones were more likely undergo intubation (73). On the basis of the pattern and distribution of the opacities and the presence or absence of certain clinical signs (such as obesity), the authors developed a chest radiography severity scoring system that could be used as a prognostic factor of outcomes in young adult patients with COVID-19 (Fig 3).
Advancements in new technologies such as artificial intelligence have allowed the utilization of automated assessment and tracking of COVID-19 pulmonary disease severity on chest radiographs. The results of this artificial intelligence–based longitudinal assessment could potentially be used for the prediction of patient prognosis (with respect to the likelihood of requiring intubation or death) (74).
Chest radiography and chest CT may be performed as adjuncts in cases of an initial negative RT-PCR test with persistent high clinical suspicion for disease. The American College of Radiology advises against using CT as a first-line tool in the diagnosis of COVID-19, recommending that it be used sparingly and reserved for symptomatic hospitalized patients with specific clinical indications, such as assessment of complications (75,76).
Chest radiography is a less sensitive modality for the detection of COVID-19 lung disease when compared with that CT, with a reported baseline chest radiography sensitivity of 69% (64). The true sensitivity and specificity of CT for detection of COVID-19 remains relatively unknown. One study showed that radiologists identified cases of COVID-19 versus other viral pneumonias correctly 60%–83% of the time on the basis of typical CT features (77). However, the results of this study should be treated with caution, as the control and COVID-19–positive groups evaluated in this study came from two different institutions (the cases of COVID-19 came from China and control cases from the United States) (78).
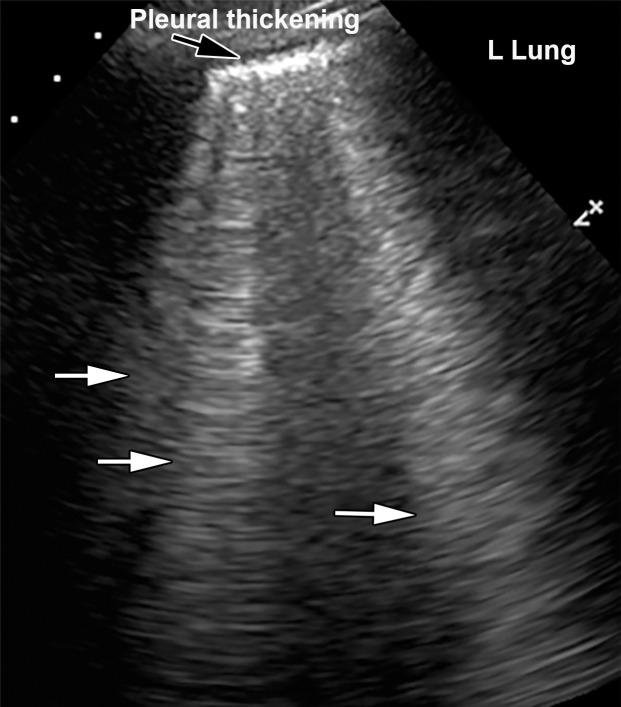
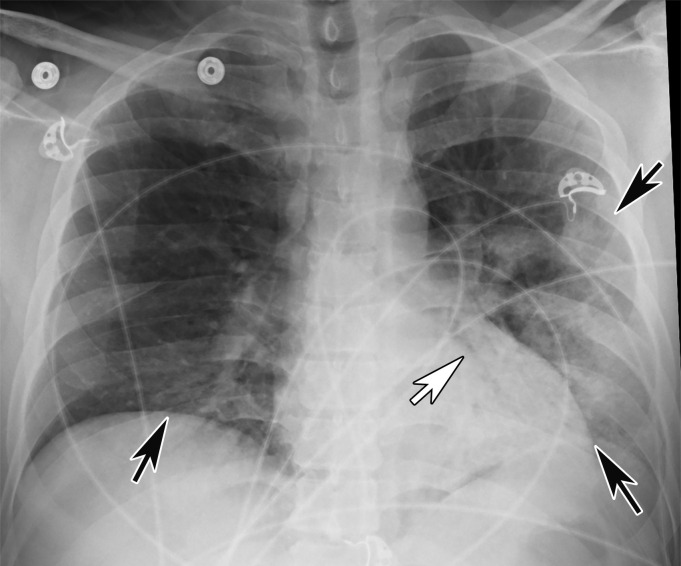
Pulmonary US.—Pulmonary US is another imaging modality that has been shown to be useful in the evaluation of critically ill patients with COVID-19, as it can be performed at the bedside and allows detection of pneumonia (79). The most commonly depicted features of lung involvement at US include the presence of B-line artifacts, an irregular thickened pleura, and subpleural consolidations (Fig 4, Movies 1, 2) (80). B-line artifact distribution corresponds to subpleural thickened interlobular septa, as demonstrated at CT. B-line artifacts are vertically oriented, highly dynamic, and hyperechoic artifacts that originate from the pleura or from areas of consolidation that usually manifest in patients with alveolar-interstitial syndrome (80–82). These lines indicate accumulation of fluid in the pulmonary interstitial space (lung rockets) or alveoli (ground glass). When multiple, they are associated with pulmonary edema of cardiogenic, noncardiogenic, or mixed origin and are indicative of lung interstitial syndrome. B-line artifacts usually move with lung sliding. Absence of lung sliding should raise concern that the lung is not inflated or that there may be a pneumothorax.
Figure 4a.
Interstitial edema and pleural thickening in a 40-year-old man with COVID-19 who presented to the emergency department with hypoxia and dyspnea. (a) Gray-scale lung US image obtained in the longitudinal plane over the left lower lobe shows multiple (more than three) vertical echogenic bands (white arrows) extending from the pleural surface to the deeper portions of the lung, consistent with B-line artifacts, indicating subpleural interstitial edema. Note that the lung pleura is thickened and irregular (black arrow). (b) Corresponding AP chest radiograph shows multifocal bilateral patchy peripheral opacities (black arrows), with an area of consolidation (white arrow) in the left lower lobe with air bronchograms, which is indicative of organizing pneumonia.
Figure 4b.
Interstitial edema and pleural thickening in a 40-year-old man with COVID-19 who presented to the emergency department with hypoxia and dyspnea. (a) Gray-scale lung US image obtained in the longitudinal plane over the left lower lobe shows multiple (more than three) vertical echogenic bands (white arrows) extending from the pleural surface to the deeper portions of the lung, consistent with B-line artifacts, indicating subpleural interstitial edema. Note that the lung pleura is thickened and irregular (black arrow). (b) Corresponding AP chest radiograph shows multifocal bilateral patchy peripheral opacities (black arrows), with an area of consolidation (white arrow) in the left lower lobe with air bronchograms, which is indicative of organizing pneumonia.
Movie 1.
Interstitial edema and pleural thickening in a critically ill 75-year- old man who was admitted to the hospital for COVID-19. Gray-scale lung US cine clip shows multiple echogenic vertical lines, B-line artifacts (yellow arrows), which are indicative of interstitial edema and irregular thickening of the pleura (red arrow). These findings are seen COVID-19 pneumonia.
Movie 2.
Lung consolidation in a critically ill 69-year old man who was admitted to the hospital for COVID-19 pneumonia. Gray-scale lung US cine clip shows left lower lobe consolidation (yellow annotation), with multiple echogenic foci within compatible with air-bronchograms (orange arrows). Findings are indicative of consolidating COVID-19 pneumonia.
CT Pulmonary Angiography.—Contrast-enhanced CT pulmonary angiography is performed to assess for possible PE in patients who develop acute dyspnea or acute deterioration of respiratory symptoms, or those in whom d-dimer markers are significantly elevated. The utilization of pulmonary scintigraphy (ventilation–perfusion scanning) in patients with suspected COVID-19 pneumonia should be limited, unless deemed essential for medical management. If ventilation–perfusion scanning is deemed necessary, the ventilatory phase of the examination should be eliminated and only the perfusion phase should be performed (83). Dual-energy CT has also been shown to be helpful for the evaluation of lung perfusion abnormalities (84).
Chest CT and Reporting.—The role of chest CT in COVID-19 is constantly evolving, with respect to clinical evaluation and treatment decisions. Whereas the 7th Chinese Novel Coronavirus Pneumonia Diagnosis and Treatment Plan incorporates CT into the criteria that clinically define COVID-19, the American College of Radiology and the Society of Thoracic Radiology, among others, advocate its use only in cases that require problem solving (75,85,86). The suitability of chest CT has also been assessed in various scenarios by the Fleischner Society, which deemed CT a major tool for diagnosis in patients with worsening symptoms or those in an environment that is resource constrained, with respect to RT-PCR testing availability (87).
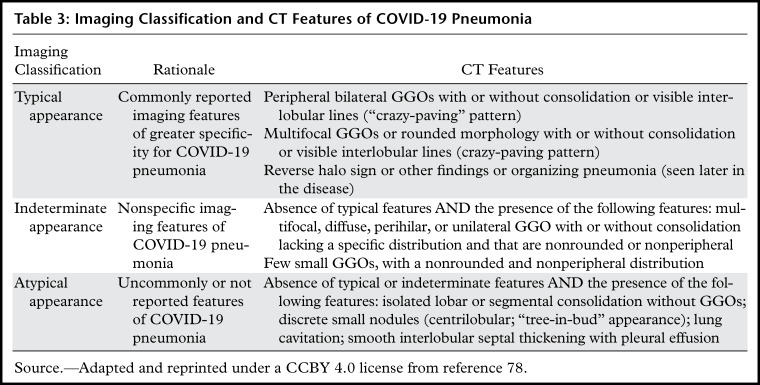
The recent Radiological Society of North American expert consensus statement on reporting proposed standardized nomenclature and an imaging classification for COVID-19 pneumonia that involves four categories: typical appearance, indeterminate appearance, atypical appearance, and negative for pneumonia (Table 3) (78).
Table 3:
Imaging Classification and CT Features of COVID-19 Pneumonia
In an attempt to pursue standardized reporting, a COVID-19 Reporting and Data System (CO-RAD) based on a five-point scale of suspicion for pulmonary involvement of COVID-19 at chest CT, was introduced (85). The CO-RAD score is based on the features depicted on nonenhanced chest CT images, with level of suspicion ranging from very low (CO-RADS 1) to very high (CO-RADS 5). Two additional categories were also created to account for a technically insufficient examination (CO-RADS 0) and RT-PCR–proven SARS-CoV-2 infection at the time of examination (CO-RADS 6).
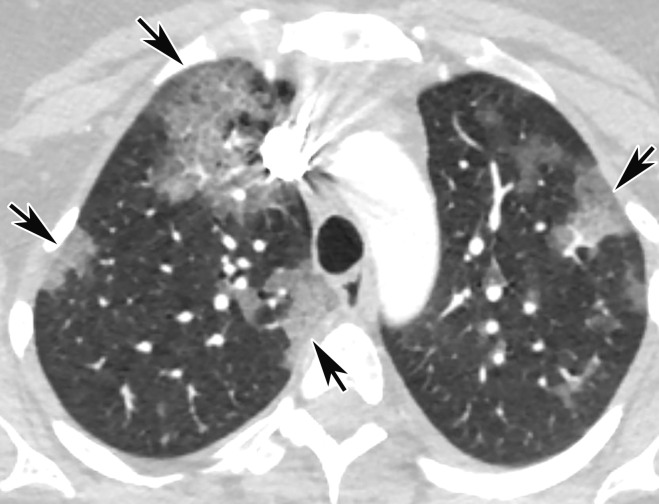
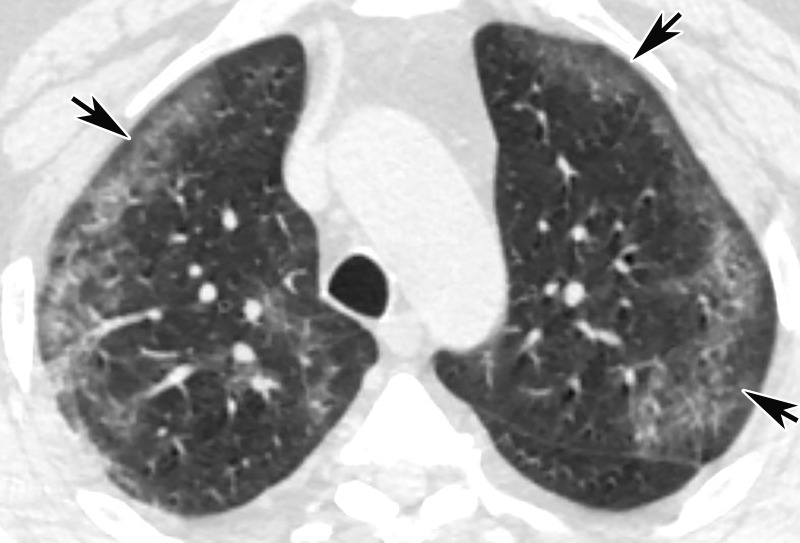
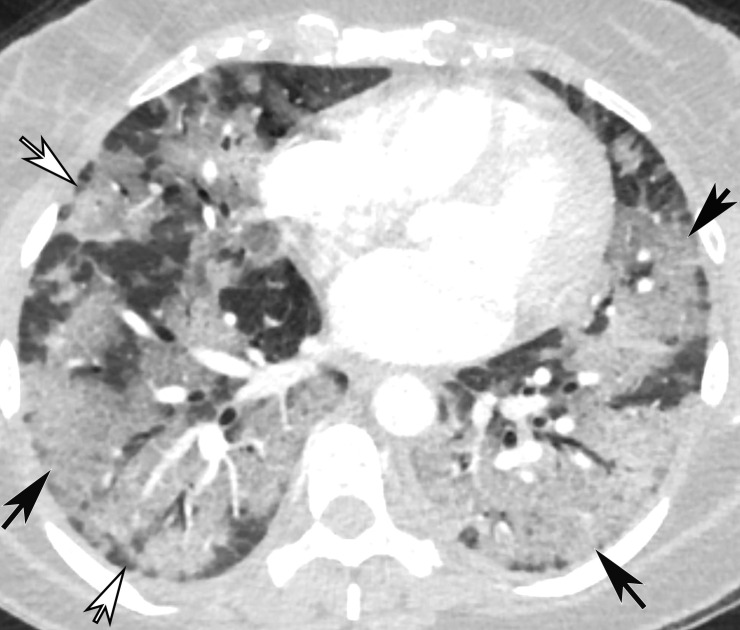
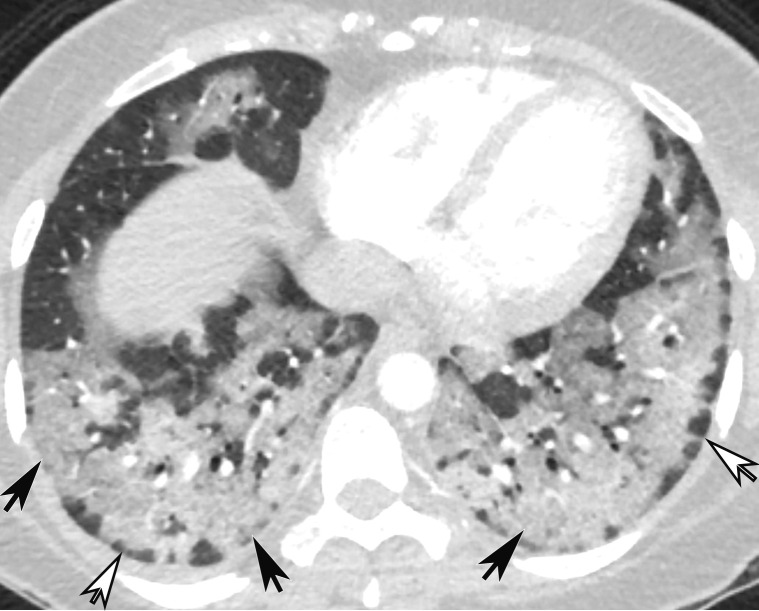
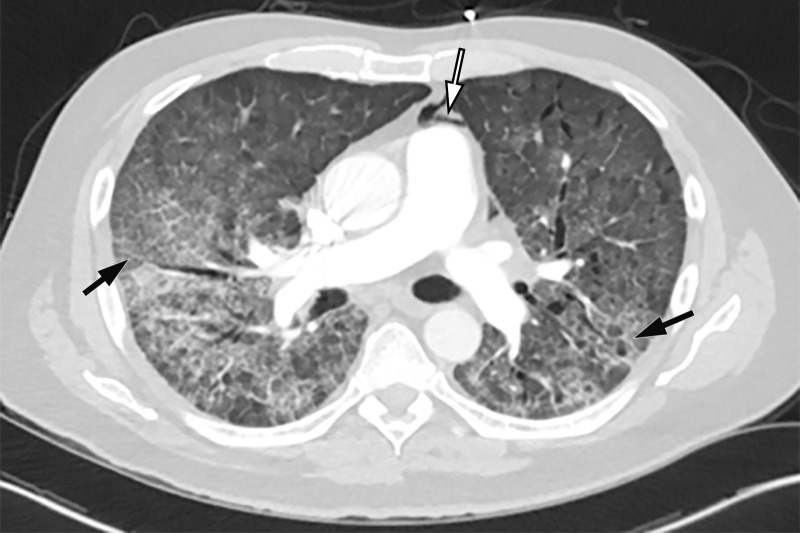
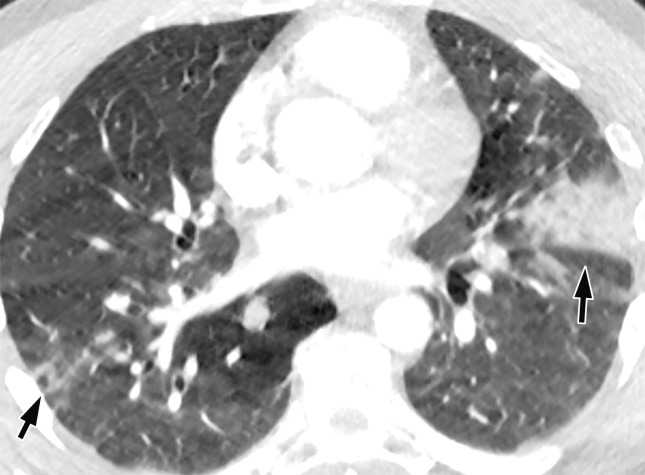
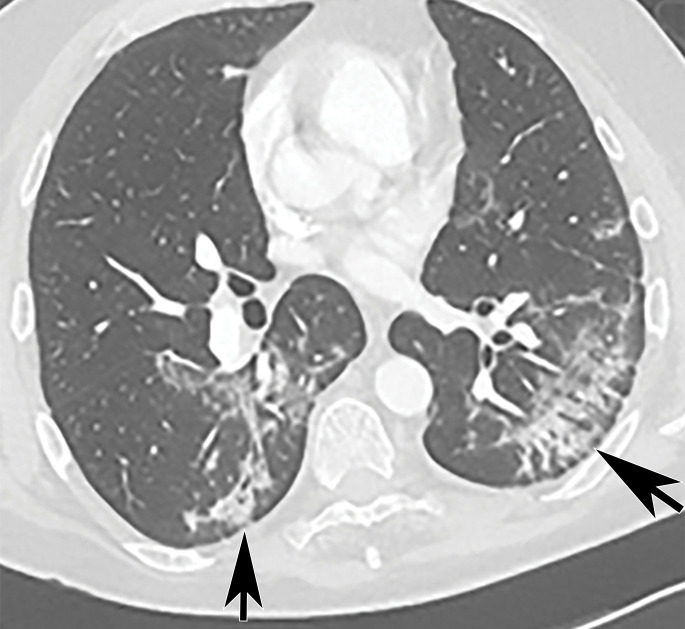
CT Findings.—Similar to those at chest radiography, the most suspicious CT features for COVID-19 infection in the lungs include multifocal bilateral peripheral GGOs, with or without focal consolidations, in lung regions close to pleural surfaces, including the fissures (Figs 2, 5). Although subpleural involvement has been frequently documented, subpleural sparing may also be present (Fig 6) (85). There are two types of GGOs that have been described: pure type and a mixed pattern, which is characterized by the presence of both GGOs and areas of consolidation (Fig 5). At CT, GGOs with or without consolidation are typically depicted in a peripheral, posterior, and diffuse or lower–lung zone distribution (67,78). Pure-type GGOs, the most commonly observed pattern, usually develop between days 0 and 4 after symptom onset, peaking at 6–13 days (69,88–90). Therefore, a negative chest CT examination should not be used to exclude the possibility of COVID-19, particularly early in the disease process (78).
Figure 5a.
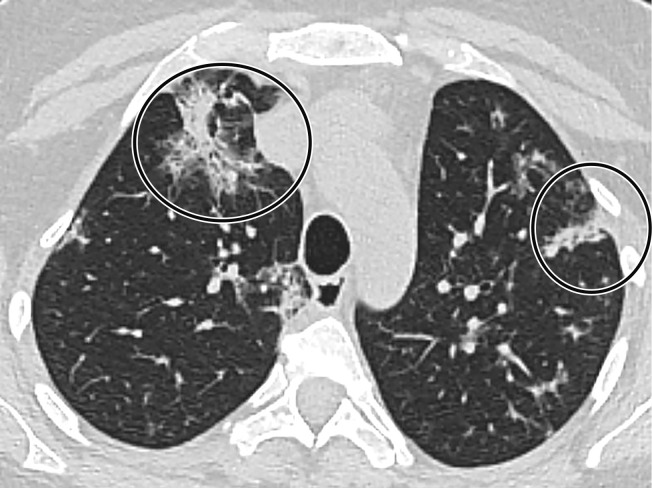
Temporal pulmonary changes of COVID-19 pneumonia at CT in a 36-year-old woman. (a–c) Axial contrast-enhanced CT images obtained at hospital admission show patchy bilateral GGOs and interlobular septal thickening (black arrows), with lower lobe predominance and subpleural involvement. Note also some immediate subpleural sparing of the GGOs (white arrows in b and c). (d–f) Follow-up corresponding axial contrast-enhanced CT images show evolving consolidative changes with volume loss, architectural distortion (ovals), and bronchiectasis (arrows in e and f).
Figure 6.
GGOs and subpleural sparing in a 68-year-old man with COVID-19 and difficulty breathing. Axial contrast-enhanced CT image shows bilateral diffuse peripheral GGOs with subpleural sparing (arrows).
Figure 5b.
Temporal pulmonary changes of COVID-19 pneumonia at CT in a 36-year-old woman. (a–c) Axial contrast-enhanced CT images obtained at hospital admission show patchy bilateral GGOs and interlobular septal thickening (black arrows), with lower lobe predominance and subpleural involvement. Note also some immediate subpleural sparing of the GGOs (white arrows in b and c). (d–f) Follow-up corresponding axial contrast-enhanced CT images show evolving consolidative changes with volume loss, architectural distortion (ovals), and bronchiectasis (arrows in e and f).
Figure 5c.
Temporal pulmonary changes of COVID-19 pneumonia at CT in a 36-year-old woman. (a–c) Axial contrast-enhanced CT images obtained at hospital admission show patchy bilateral GGOs and interlobular septal thickening (black arrows), with lower lobe predominance and subpleural involvement. Note also some immediate subpleural sparing of the GGOs (white arrows in b and c). (d–f) Follow-up corresponding axial contrast-enhanced CT images show evolving consolidative changes with volume loss, architectural distortion (ovals), and bronchiectasis (arrows in e and f).
Figure 5d.
Temporal pulmonary changes of COVID-19 pneumonia at CT in a 36-year-old woman. (a–c) Axial contrast-enhanced CT images obtained at hospital admission show patchy bilateral GGOs and interlobular septal thickening (black arrows), with lower lobe predominance and subpleural involvement. Note also some immediate subpleural sparing of the GGOs (white arrows in b and c). (d–f) Follow-up corresponding axial contrast-enhanced CT images show evolving consolidative changes with volume loss, architectural distortion (ovals), and bronchiectasis (arrows in e and f).
Figure 5e.
Temporal pulmonary changes of COVID-19 pneumonia at CT in a 36-year-old woman. (a–c) Axial contrast-enhanced CT images obtained at hospital admission show patchy bilateral GGOs and interlobular septal thickening (black arrows), with lower lobe predominance and subpleural involvement. Note also some immediate subpleural sparing of the GGOs (white arrows in b and c). (d–f) Follow-up corresponding axial contrast-enhanced CT images show evolving consolidative changes with volume loss, architectural distortion (ovals), and bronchiectasis (arrows in e and f).
Figure 5f.
Temporal pulmonary changes of COVID-19 pneumonia at CT in a 36-year-old woman. (a–c) Axial contrast-enhanced CT images obtained at hospital admission show patchy bilateral GGOs and interlobular septal thickening (black arrows), with lower lobe predominance and subpleural involvement. Note also some immediate subpleural sparing of the GGOs (white arrows in b and c). (d–f) Follow-up corresponding axial contrast-enhanced CT images show evolving consolidative changes with volume loss, architectural distortion (ovals), and bronchiectasis (arrows in e and f).
Later in the disease course, the frequency of consolidation increases (Fig 5). In fact, Wang et al (89) noted that after symptom onset, the predominant imaging abnormality becomes a mixed pattern of GGOs, which typically peaks during days 12–17 of the illness and has been shown to be the second most prevalent pattern thereafter. As discussed previously, similar temporal changes have been observed on plain radiographs (Fig 3) (89).
Pulmonary vascular abnormalities such as vessel enlargement and regional mosaic perfusion patterns are also commonly found in COVID-19 pneumonia (84). Other more atypical or infrequent signs described in patients with COVID-19, such as the halo and reverse halo (or atoll) sign, usually manifest later in the disease course and are often absent at the time of symptom onset (Figs 7, 8) (78). The halo sign describes a nodule or mass surrounded by ground glass opacification, while the reverse halo (or atoll) sign is defined as a crescent or complete ring of consolidation that surrounds a focal area of GGO (Figs 7, 8) (91). Both appearances may be embedded within an area of consolidation. However, it is important to note that these findings are not specific, as they have been previously described in early stages of opportunistic invasive fungal infections in immunocompromised patients (eg, aspergillosis, mucormycosis), as well as in immunocompetent patients diagnosed with nonfungal endemic infections, cryptogenic organizing pneumonia, vasculitis, neoplasm, and inflammatory diseases (91).
Figure 7.
Halo sign in a 19-year-old man who presented with persistent fever and cough for 9 days and with positive test results for COVID-19. Axial nonenhanced CT chest image shows multifocal bilateral areas of mixed GGOs, with central nodular masslike opacities surrounded by ground-glass attenuation (arrows), a characteristic finding of a halo sign. Note that the opacities are located at the lung periphery.
Figure 8a.
Reverse halo sign in a 76-year-old man with COVID-19 and a history of pancreatic cancer. (a, b) Axial (a) and coronal (b) contrast-enhanced CT images show a nodular opacity (black arrow) in the right lower lobe, with central GGOs and peripheral solid consolidation, consistent with a reverse halo sign. Note the subtle bilateral peripheral GGOs (white arrows). (c) Axial contrast-enhanced CT image obtained 3 weeks after diagnosis shows subsequent resolution of the reverse halo sign, with vague residual opacity (circle).
Figure 8b.
Reverse halo sign in a 76-year-old man with COVID-19 and a history of pancreatic cancer. (a, b) Axial (a) and coronal (b) contrast-enhanced CT images show a nodular opacity (black arrow) in the right lower lobe, with central GGOs and peripheral solid consolidation, consistent with a reverse halo sign. Note the subtle bilateral peripheral GGOs (white arrows). (c) Axial contrast-enhanced CT image obtained 3 weeks after diagnosis shows subsequent resolution of the reverse halo sign, with vague residual opacity (circle).
Figure 8c.
Reverse halo sign in a 76-year-old man with COVID-19 and a history of pancreatic cancer. (a, b) Axial (a) and coronal (b) contrast-enhanced CT images show a nodular opacity (black arrow) in the right lower lobe, with central GGOs and peripheral solid consolidation, consistent with a reverse halo sign. Note the subtle bilateral peripheral GGOs (white arrows). (c) Axial contrast-enhanced CT image obtained 3 weeks after diagnosis shows subsequent resolution of the reverse halo sign, with vague residual opacity (circle).
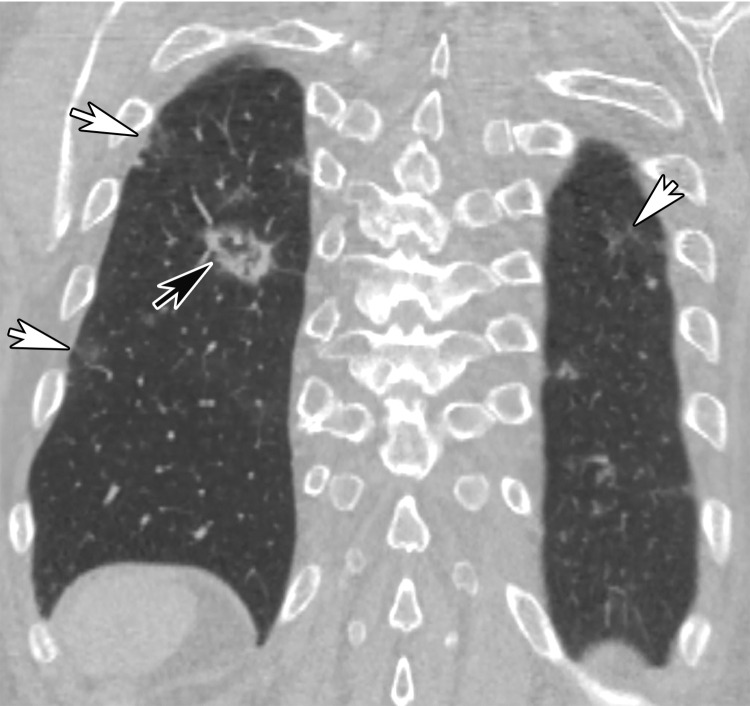
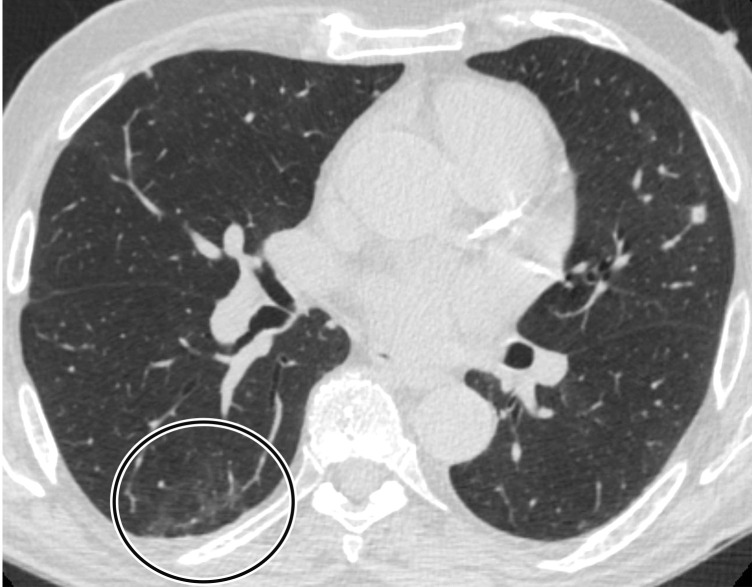
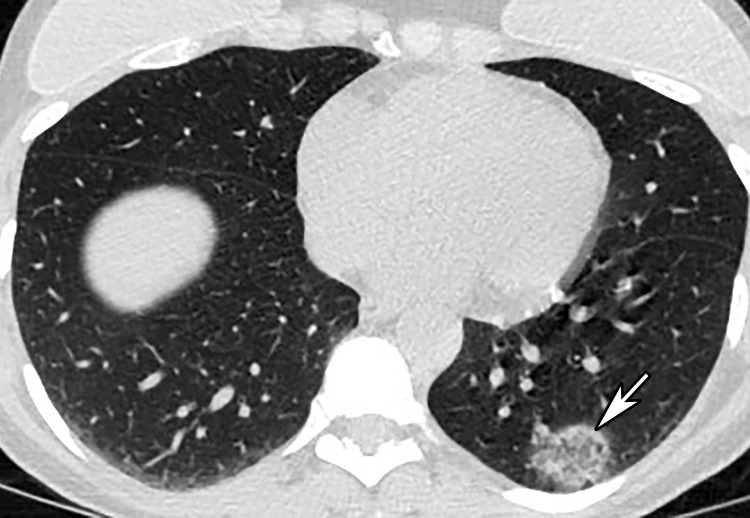
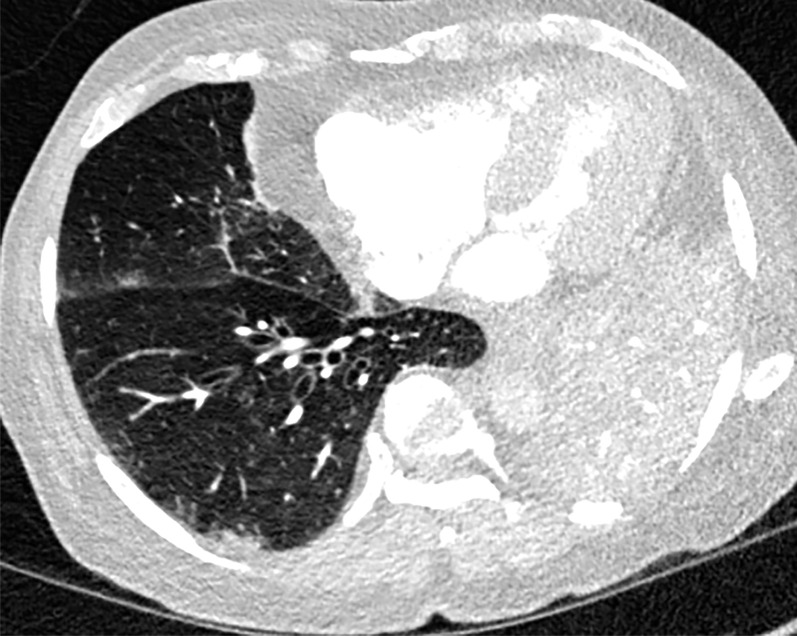
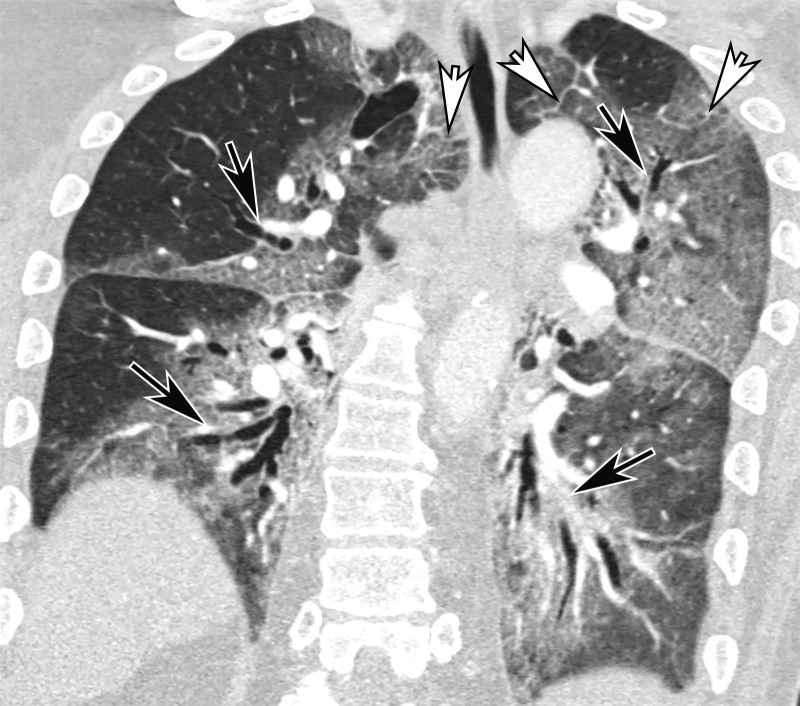
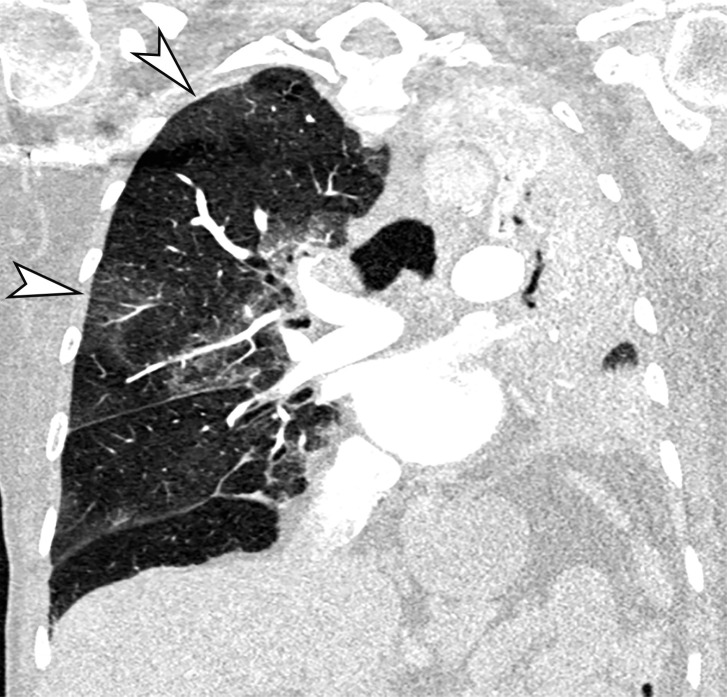
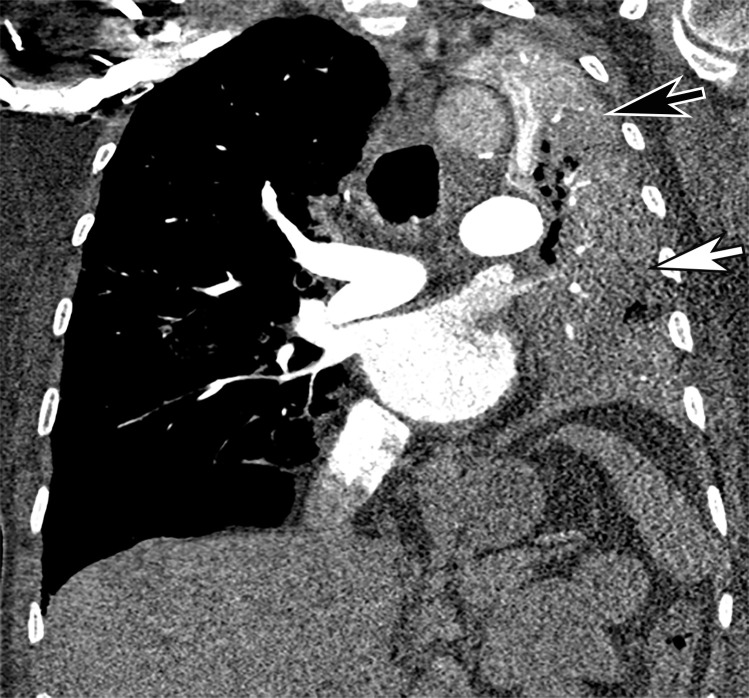
Unifocal unilateral lesions are uncommon and found only in 2% of patients with COVID-19 (Fig 9) (92). The development of gelatinous mucus secretions may be responsible for lung collapse that can coexist with adjacent areas of consolidation. Contrast-enhanced CT aids in the differentiation of collapsed atelectatic lung from pneumonia by demonstrating parenchymal lung enhancement within atelectatic lung and absent or markedly diminished lung enhancement in the setting of pneumonia (Fig 10). Bronchial wall thickening was described in 10%–20% of patients with COVID-19 (Fig 11) (93). Pleural effusion, cavitation, pulmonary nodules, tree-in-bud opacities, and lymphadenopathy have not been reported in patients with COVID-19 and can be useful in differentiating COVID-19 pneumonia from other conditions (94).
Figure 9.
Focal unilateral opacity in a 52-year-old woman who presented with persistent cough and positive COVID-19 RT-PCR and immunoglobulin G antibody test results. Axial nonenhanced chest CT image shows a focal unilateral 3-cm rounded peripheral GGO (arrow).
Figure 10a.
COVID-19 pneumonia complicated by mucus plugging and lung collapse in a 78-year-old man who presented with shortness of breath and suspicion of PE. Axial (a) and coronal (b, c) chest CT angiographic images show patchy GGOs (arrowheads in b) on the right and left lung opacification with volume loss in the left upper lobe due to atelectasis. Adjacent atelectasis and pneumonia in the left upper and lower lobes are evidenced by enhancement of the atelectatic lung (black arrow in c) and absence of enhancement within the pneumonic consolidation (white arrow in c). Atelectasis was caused by the presence of thick mucus that resulted in bronchial obstruction and subsequent collapse.
Figure 11.
Bronchial dilatation in an 83-year-old man with COVID-19 with persistent hypoxia and a sudden increase in d-dimer levels, findings concerning for PE. Coronal CT angiographic image shows extensive bilateral bronchial dilatation with bronchial wall thickening (black arrows) and bilateral diffuse posterior lung GGOs, as well as interlobular septal thickening (white arrows), greater on the left than on the right, consistent with the later stages of COVID-19 pneumonia.
Figure 10b.
COVID-19 pneumonia complicated by mucus plugging and lung collapse in a 78-year-old man who presented with shortness of breath and suspicion of PE. Axial (a) and coronal (b, c) chest CT angiographic images show patchy GGOs (arrowheads in b) on the right and left lung opacification with volume loss in the left upper lobe due to atelectasis. Adjacent atelectasis and pneumonia in the left upper and lower lobes are evidenced by enhancement of the atelectatic lung (black arrow in c) and absence of enhancement within the pneumonic consolidation (white arrow in c). Atelectasis was caused by the presence of thick mucus that resulted in bronchial obstruction and subsequent collapse.
Figure 10c.
COVID-19 pneumonia complicated by mucus plugging and lung collapse in a 78-year-old man who presented with shortness of breath and suspicion of PE. Axial (a) and coronal (b, c) chest CT angiographic images show patchy GGOs (arrowheads in b) on the right and left lung opacification with volume loss in the left upper lobe due to atelectasis. Adjacent atelectasis and pneumonia in the left upper and lower lobes are evidenced by enhancement of the atelectatic lung (black arrow in c) and absence of enhancement within the pneumonic consolidation (white arrow in c). Atelectasis was caused by the presence of thick mucus that resulted in bronchial obstruction and subsequent collapse.
In normal lung, subsegmental vessels are usually inconspicuous within the subpleural regions. However, it has been shown that many patients with COVID-19 exhibit tortuous and dilated distal vessels in the subpleural lung (84). These findings should not be confused with pulmonary vascular thickening (or thick vessel sign) within pulmonary opacities in COVID-19 pneumonia, which has been reported to range from 59% to 82% in patients with COVID-19 (77,95,96). Pulmonary vascular thickening is a nonspecific sign and can be seen in other conditions, including pulmonary hypertension, pulmonary veno-occlusive disease, hepatopulmonary syndrome, and portopulmonary hypertension (97).
Acute Respiratory Disease Syndrome
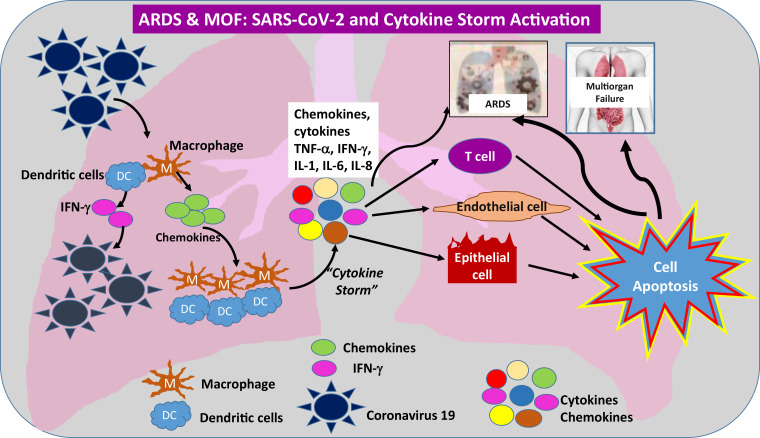
One of the most common respiratory complications of COVID-19 infection is ARDS (Fig 12). While ARDS is a clinical diagnosis that has a grading system based on the degree of hypoxia, imaging plays a supportive role in its diagnosis and management. It has been suggested that abnormal pulmonary vasoregulation may play a large role in patients with COVID-19 infection before the onset of radiologic or clinical manifestations that would suggest ARDS, and may be even more pronounced when ARDS does occur (84,98). The presence of disordered vasoregulation is supported by the frequency of pronounced dilatation of vasculature within regions of diseased lung, leading to significant ventilation and perfusion mismatches early in the disease. Perfusion abnormalities in the setting of COVID-19 pneumonia, most optimally assessed at dual-energy CT, may suggest an underlying vascular process.
Figure 12.
Schematic illustration of the effects of SARS-CoV-2 virus and virus-activated cytokine storm and their role in the development of ARDS and multiorgan failure (MOF). Note that a similar mechanism can be applied to any solid or hollow organ in the body that expresses ACE2 receptors on its surface. IFN-γ = interferon γ, IL-1 = interleukin-1, IL- 6 = interleukin-6, IL-8 = interleukin-8, TNF-α = tumor necrosis factor-α.
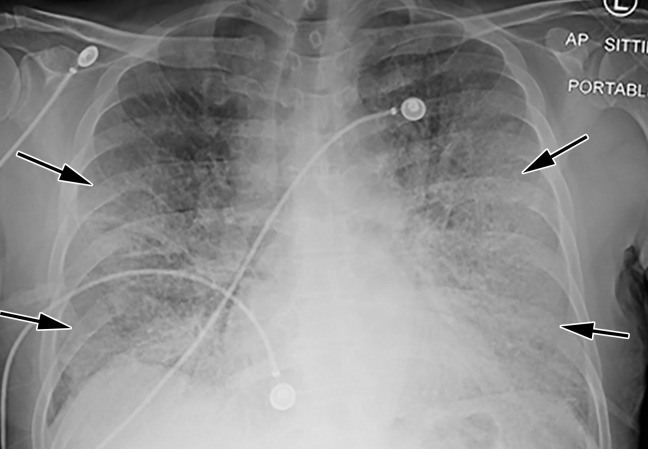
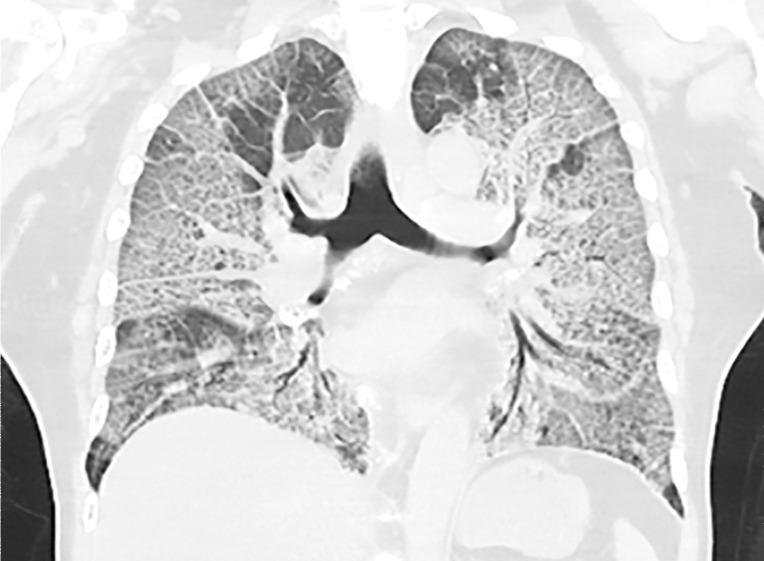
Chest radiography and CT can aid in the identification of additional underlying causes of ARDS symptoms, such as superimposed bacterial pneumonia or congestive heart failure, although findings are frequently nonspecific. In the acute phase of ARDS, chest radiography may demonstrate bilateral airspace opacities with air bronchograms (Fig 13). Unless pulmonary edema is also present, septal lines and pleural effusions are not expected findings. In the acute exudative phase of ARDS, within the first week, CT demonstrates diffuse GGOs in a posterior and basal predominance, and a crazy-paving pattern may also be depicted (Fig 13). The crazy-paving appearance is thought to be attributable to superimposition of thick interlobular septa on GGOs and was detected in 36% of patients with COVID-19 (69). In the subsequent subacute phase of ARDS, consolidations may develop posteriorly or anteriorly if the patient is prone, with reversible bronchiectasis (Figs 11, 14). In the late phase of ARDS, more than 2 weeks after onset, CT images can show signs of fibrosis, with architectural distortion, reticulation, and traction bronchiectasis (Figs 5, 13, 14) (99).
Figure 13a.
COVID-19 pneumonia with superimposed ARDS in a 61-year-old man who presented to the emergency department with hypoxia and subsequently underwent intubation. (a) AP chest radiograph shows bilateral diffuse lower-lobe predominant opacities (arrows), compatible with COVID pneumonia. (b) Coronal nonenhanced chest CT image shows “crazy-paving” pattern, with diffuse bilateral GGOs, interlobular septal thickening, and intralobular lines, a typical appearance of COVID-19 pneumonia.
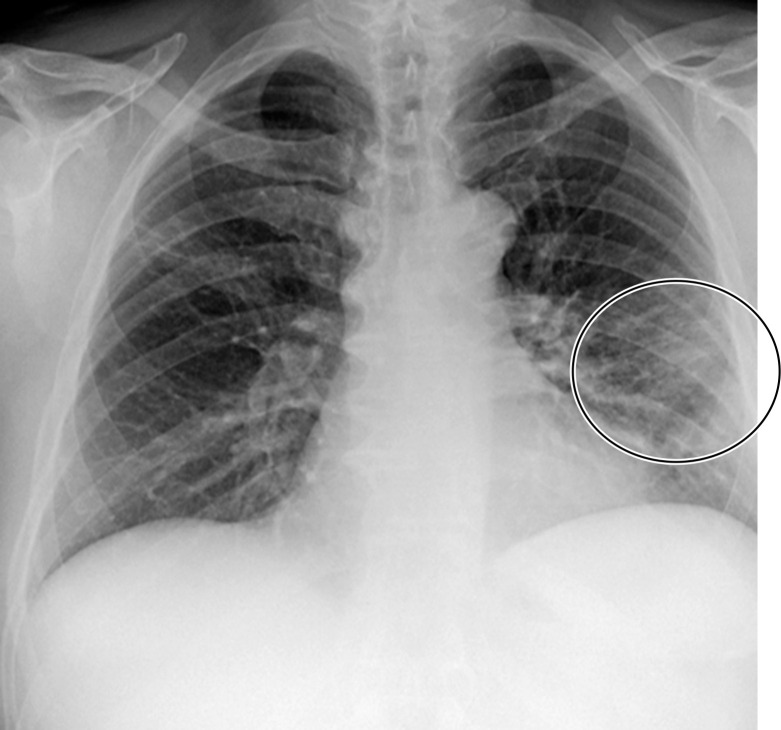
Figure 14a.
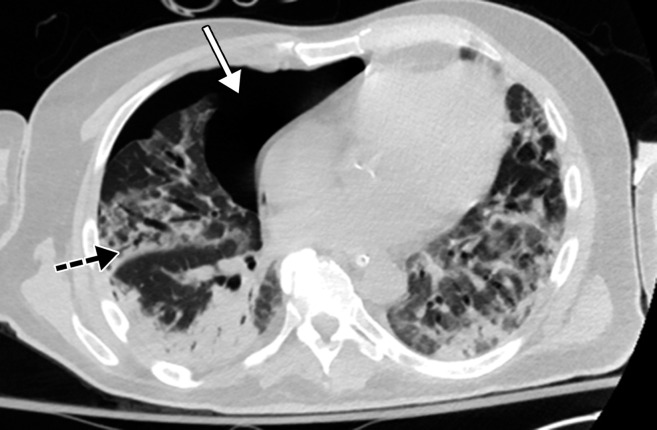
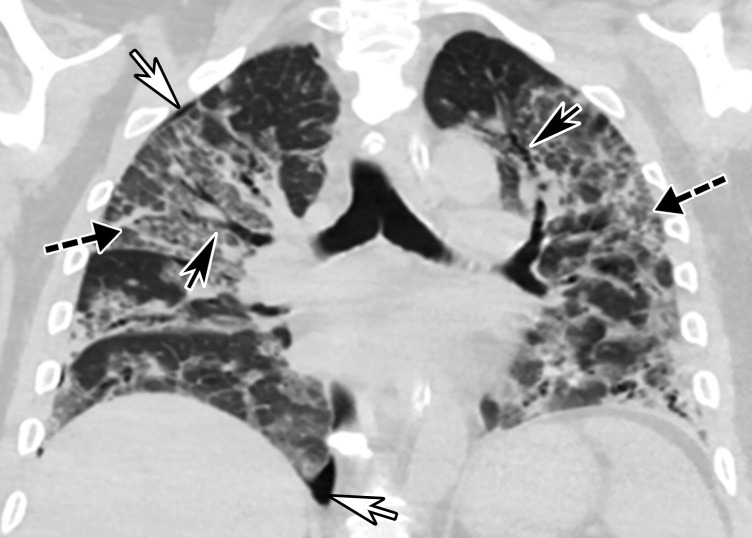
Time course of lung changes in a 59-year-old man with COVID-19 pneumonia evaluated at chest radiography and CT over a 2-month period, which was complicated by development of a pneumothorax. (a–c) AP chest radiographs obtained at hospital admission (a), 4 days later (b), and 1 month later (c) show a peripheral patchy opacity in the left mid lung (oval in a) at the initial assessment, with substantial progression of lung disease on day 4 (b), with development of multiple bilateral peripheral areas of consolidation. The radiograph obtained 1 month later (c) shows interval improvement of the bilateral areas of consolidation and an increase in reticular opacities (dashed arrows in c), with the development of bronchial dilatation (solid arrow in c). Note that at this time the patient had undergone tracheostomy. (d, e) Axial (d) and coronal (e) contrast-enhanced chest CT images, obtained at the same time as c for worsening shortness of breath, show diffuse GGOs associated with superimposed interlobular reticulations, resulting in a crazy-paving pattern (dashed black arrows) and bronchial dilatation (black solid arrows in e). The findings were complicated by the presence of a moderate-sized anterior pneumothorax (white arrows), which was not well appreciated on the plain radiograph (c).
Figure 13b.
COVID-19 pneumonia with superimposed ARDS in a 61-year-old man who presented to the emergency department with hypoxia and subsequently underwent intubation. (a) AP chest radiograph shows bilateral diffuse lower-lobe predominant opacities (arrows), compatible with COVID pneumonia. (b) Coronal nonenhanced chest CT image shows “crazy-paving” pattern, with diffuse bilateral GGOs, interlobular septal thickening, and intralobular lines, a typical appearance of COVID-19 pneumonia.
Figure 14b.
Time course of lung changes in a 59-year-old man with COVID-19 pneumonia evaluated at chest radiography and CT over a 2-month period, which was complicated by development of a pneumothorax. (a–c) AP chest radiographs obtained at hospital admission (a), 4 days later (b), and 1 month later (c) show a peripheral patchy opacity in the left mid lung (oval in a) at the initial assessment, with substantial progression of lung disease on day 4 (b), with development of multiple bilateral peripheral areas of consolidation. The radiograph obtained 1 month later (c) shows interval improvement of the bilateral areas of consolidation and an increase in reticular opacities (dashed arrows in c), with the development of bronchial dilatation (solid arrow in c). Note that at this time the patient had undergone tracheostomy. (d, e) Axial (d) and coronal (e) contrast-enhanced chest CT images, obtained at the same time as c for worsening shortness of breath, show diffuse GGOs associated with superimposed interlobular reticulations, resulting in a crazy-paving pattern (dashed black arrows) and bronchial dilatation (black solid arrows in e). The findings were complicated by the presence of a moderate-sized anterior pneumothorax (white arrows), which was not well appreciated on the plain radiograph (c).
Figure 14c.
Time course of lung changes in a 59-year-old man with COVID-19 pneumonia evaluated at chest radiography and CT over a 2-month period, which was complicated by development of a pneumothorax. (a–c) AP chest radiographs obtained at hospital admission (a), 4 days later (b), and 1 month later (c) show a peripheral patchy opacity in the left mid lung (oval in a) at the initial assessment, with substantial progression of lung disease on day 4 (b), with development of multiple bilateral peripheral areas of consolidation. The radiograph obtained 1 month later (c) shows interval improvement of the bilateral areas of consolidation and an increase in reticular opacities (dashed arrows in c), with the development of bronchial dilatation (solid arrow in c). Note that at this time the patient had undergone tracheostomy. (d, e) Axial (d) and coronal (e) contrast-enhanced chest CT images, obtained at the same time as c for worsening shortness of breath, show diffuse GGOs associated with superimposed interlobular reticulations, resulting in a crazy-paving pattern (dashed black arrows) and bronchial dilatation (black solid arrows in e). The findings were complicated by the presence of a moderate-sized anterior pneumothorax (white arrows), which was not well appreciated on the plain radiograph (c).
Figure 14d.
Time course of lung changes in a 59-year-old man with COVID-19 pneumonia evaluated at chest radiography and CT over a 2-month period, which was complicated by development of a pneumothorax. (a–c) AP chest radiographs obtained at hospital admission (a), 4 days later (b), and 1 month later (c) show a peripheral patchy opacity in the left mid lung (oval in a) at the initial assessment, with substantial progression of lung disease on day 4 (b), with development of multiple bilateral peripheral areas of consolidation. The radiograph obtained 1 month later (c) shows interval improvement of the bilateral areas of consolidation and an increase in reticular opacities (dashed arrows in c), with the development of bronchial dilatation (solid arrow in c). Note that at this time the patient had undergone tracheostomy. (d, e) Axial (d) and coronal (e) contrast-enhanced chest CT images, obtained at the same time as c for worsening shortness of breath, show diffuse GGOs associated with superimposed interlobular reticulations, resulting in a crazy-paving pattern (dashed black arrows) and bronchial dilatation (black solid arrows in e). The findings were complicated by the presence of a moderate-sized anterior pneumothorax (white arrows), which was not well appreciated on the plain radiograph (c).
Figure 14e.
Time course of lung changes in a 59-year-old man with COVID-19 pneumonia evaluated at chest radiography and CT over a 2-month period, which was complicated by development of a pneumothorax. (a–c) AP chest radiographs obtained at hospital admission (a), 4 days later (b), and 1 month later (c) show a peripheral patchy opacity in the left mid lung (oval in a) at the initial assessment, with substantial progression of lung disease on day 4 (b), with development of multiple bilateral peripheral areas of consolidation. The radiograph obtained 1 month later (c) shows interval improvement of the bilateral areas of consolidation and an increase in reticular opacities (dashed arrows in c), with the development of bronchial dilatation (solid arrow in c). Note that at this time the patient had undergone tracheostomy. (d, e) Axial (d) and coronal (e) contrast-enhanced chest CT images, obtained at the same time as c for worsening shortness of breath, show diffuse GGOs associated with superimposed interlobular reticulations, resulting in a crazy-paving pattern (dashed black arrows) and bronchial dilatation (black solid arrows in e). The findings were complicated by the presence of a moderate-sized anterior pneumothorax (white arrows), which was not well appreciated on the plain radiograph (c).
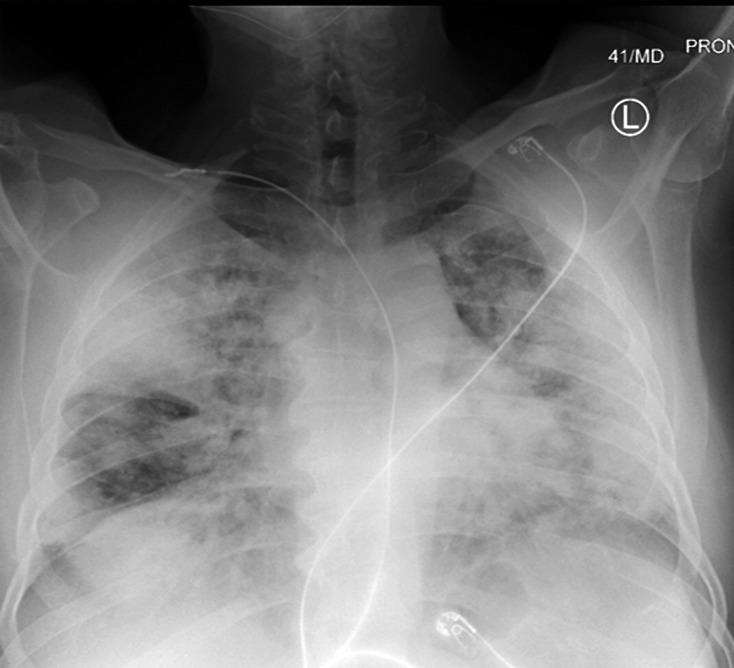
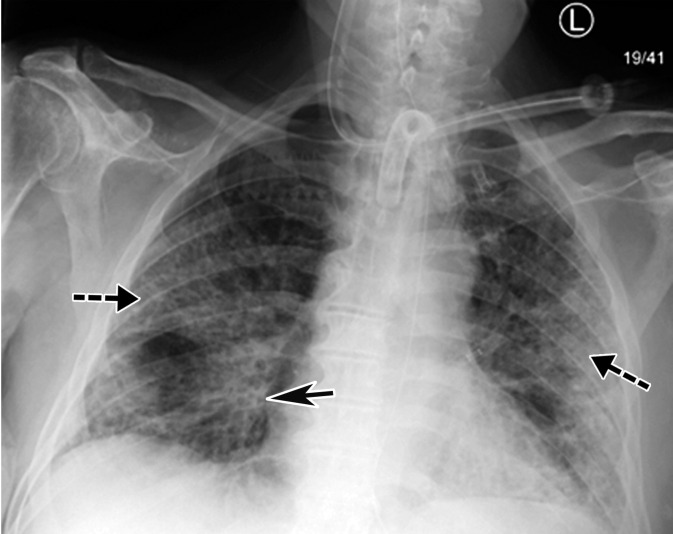
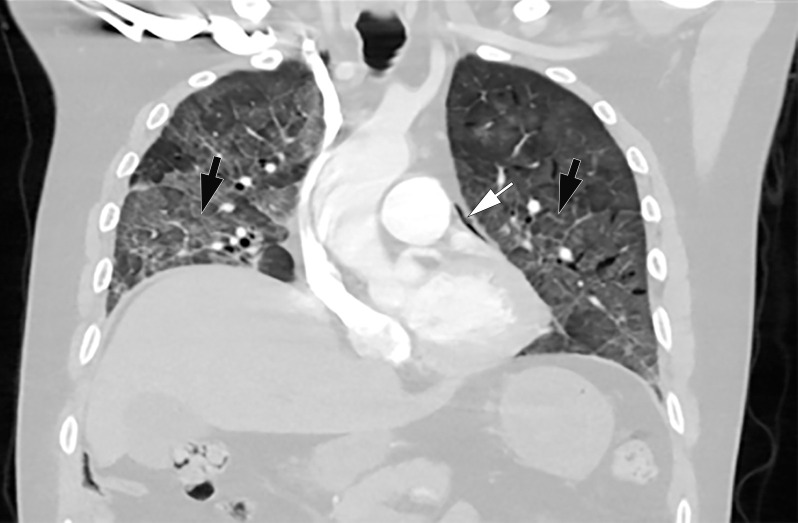
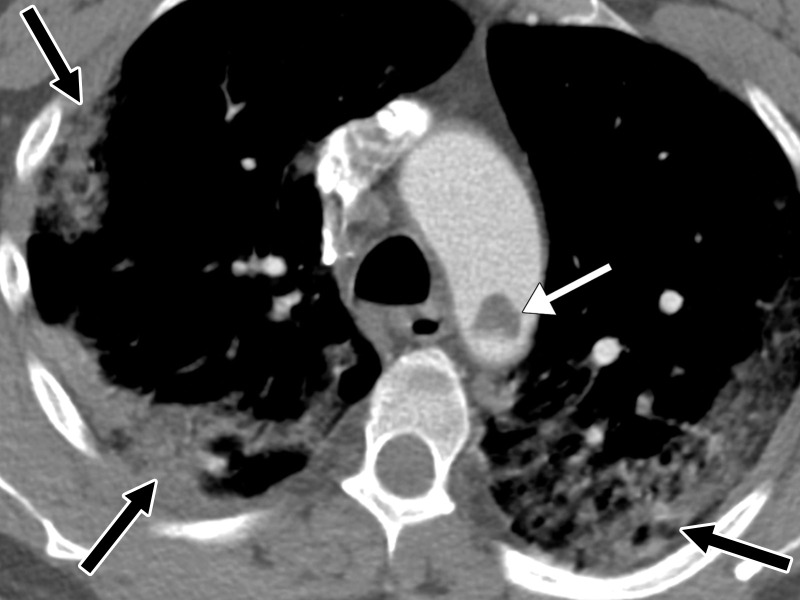
Patients admitted to the ICU with barotrauma as a result of intubation or as a complication of ARDS may develop pneumothoraces or pneumomediastinum, further complicating the pulmonary manifestations of COVID-19 infection (Figs 14–16). In fact, patients with COVID-19 who require mechanical ventilation were found to be at increased risk of barotrauma when compared with patients with ARDS alone and patients without COVID-19. Barotrauma was associated with a longer length of hospital stay and was an independent risk factor for death in patients with COVID-19 (100).
Figure 16a.
COVID-19 complicated by pneumomediastinum in a 61-year-old man. Axial (a) and coronal (b) chest CT angiographic images show a typical appearance of COVID-19 pneumonia, including diffuse GGOs and interlobular septal thickening (black arrows). Air is depicted anterior to the pulmonary artery (white arrow in a) and adjacent to the main pulmonary artery and left atrial appendage (white arrow in b), indicative of pneumomediastinum.
Figure 15.
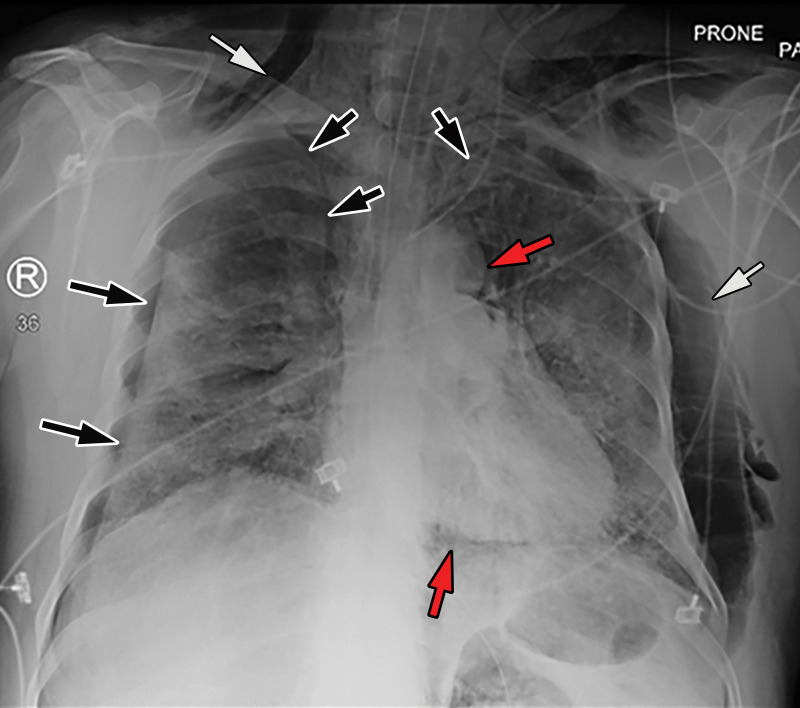
COVID-19 complicated by pneumothorax and pneumomediastinum in a 59-year-old man who underwent intubation with increased oxygen requirements. Posteroranterior chest radiograph obtained in the prone position shows moderate-size right pneumothorax and small left apical pneumothorax (black arrows). Pneumomediastinum is evident by the presence of air around the aortic arch and beneath the heart (red arrows). The endotracheal tube and feeding tube are in place. A large amount of subcutaneous emphysema is depicted bilaterally (white arrows). The patchy bilateral hazy opacities are compatible with COVID-19 pneumonia.
Figure 16b.
COVID-19 complicated by pneumomediastinum in a 61-year-old man. Axial (a) and coronal (b) chest CT angiographic images show a typical appearance of COVID-19 pneumonia, including diffuse GGOs and interlobular septal thickening (black arrows). Air is depicted anterior to the pulmonary artery (white arrow in a) and adjacent to the main pulmonary artery and left atrial appendage (white arrow in b), indicative of pneumomediastinum.
Pulmonary Embolism
PE is another complication of COVID-19 infection, described in further detail in the “Peripheral and Central Vascular Manifestations of COVID-19” section. In recently published studies, the incidence of PE in patients with COVID-19 who underwent pulmonary CT angiography was reported to be between 23% and 30% (50,101,102). Currently, there are conflicting results as to whether there is increased probability of PE in patients with COVID-19 who are receiving intensive care or require mechanical ventilation when compared with those who are not admitted to the ICU (50,102).
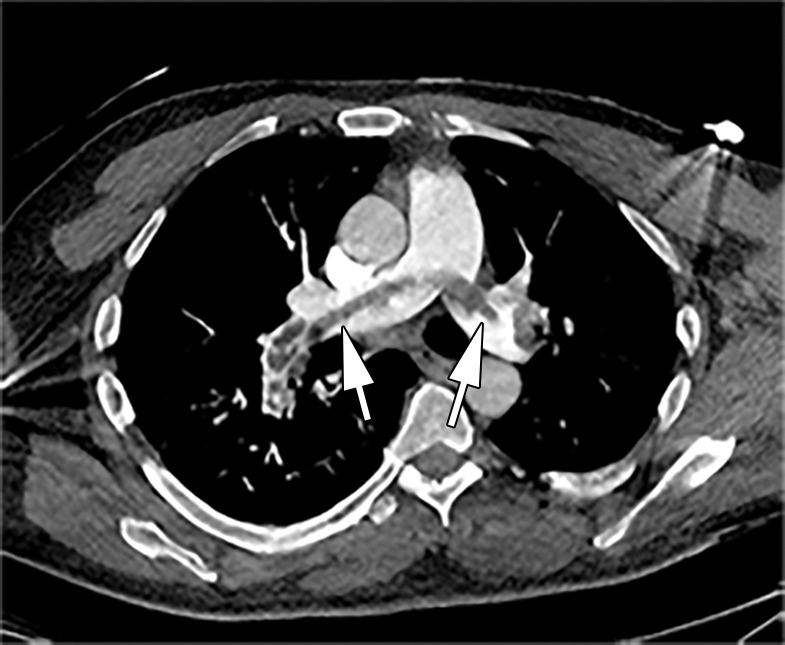
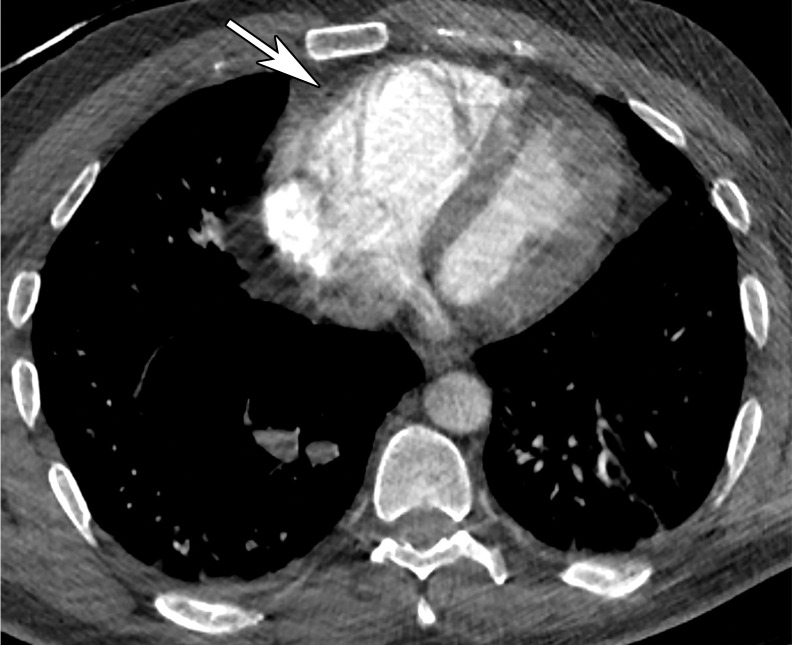
A notable risk factor for the development of PE is obesity, with recent data showing that patients with a body mass index greater than 30 kg/m2 are 2.7 times more likely to develop PE. Additionally, African American patients are at higher risk of developing PE when compared with other ethnic groups (102). With respect to the location and distribution of thrombi, PE is more commonly found in the segmental and lobar branches and less commonly in the central pulmonary arteries (Fig 17) (102).
Figure 17a.
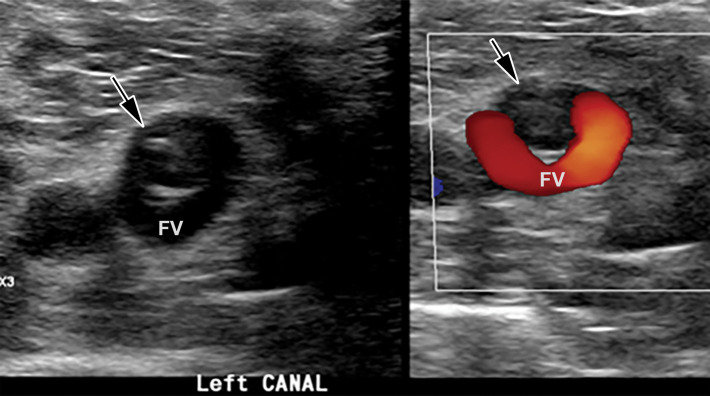
Saddle embolus in a 52-year-old man who presented to the emergency department with hypoxia and tachycardia and received positive test results for COVID-19. (a–c) Axial chest CT angiographic images show a saddle embolus (arrows in a), extending into the lobar and segmental pulmonary artery branches bilaterally, and associated dilatation of the right ventricle, suggestive of right heart strain (arrow in b). Patchy peripheral GGOs on the right and a nodular area of consolidation (arrows in c) on the left are typical findings of COVID-19 pneumonia. (d) Gray-scale (left) and corresponding color Doppler (right) US images of the left femoral vein (FV) obtained in the transverse plane show a partially occlusive thrombus (arrows). The vein was not compressible at manual compression (not shown).
Figure 17b.
Saddle embolus in a 52-year-old man who presented to the emergency department with hypoxia and tachycardia and received positive test results for COVID-19. (a–c) Axial chest CT angiographic images show a saddle embolus (arrows in a), extending into the lobar and segmental pulmonary artery branches bilaterally, and associated dilatation of the right ventricle, suggestive of right heart strain (arrow in b). Patchy peripheral GGOs on the right and a nodular area of consolidation (arrows in c) on the left are typical findings of COVID-19 pneumonia. (d) Gray-scale (left) and corresponding color Doppler (right) US images of the left femoral vein (FV) obtained in the transverse plane show a partially occlusive thrombus (arrows). The vein was not compressible at manual compression (not shown).
Figure 17c.
Saddle embolus in a 52-year-old man who presented to the emergency department with hypoxia and tachycardia and received positive test results for COVID-19. (a–c) Axial chest CT angiographic images show a saddle embolus (arrows in a), extending into the lobar and segmental pulmonary artery branches bilaterally, and associated dilatation of the right ventricle, suggestive of right heart strain (arrow in b). Patchy peripheral GGOs on the right and a nodular area of consolidation (arrows in c) on the left are typical findings of COVID-19 pneumonia. (d) Gray-scale (left) and corresponding color Doppler (right) US images of the left femoral vein (FV) obtained in the transverse plane show a partially occlusive thrombus (arrows). The vein was not compressible at manual compression (not shown).
Figure 17d.
Saddle embolus in a 52-year-old man who presented to the emergency department with hypoxia and tachycardia and received positive test results for COVID-19. (a–c) Axial chest CT angiographic images show a saddle embolus (arrows in a), extending into the lobar and segmental pulmonary artery branches bilaterally, and associated dilatation of the right ventricle, suggestive of right heart strain (arrow in b). Patchy peripheral GGOs on the right and a nodular area of consolidation (arrows in c) on the left are typical findings of COVID-19 pneumonia. (d) Gray-scale (left) and corresponding color Doppler (right) US images of the left femoral vein (FV) obtained in the transverse plane show a partially occlusive thrombus (arrows). The vein was not compressible at manual compression (not shown).
Long-term effects of the disease and follow-up long-term imaging sequelae have not been well established at this point and are still under investigation. Organ-specific vascular manifestations and complications will be discussed in the corresponding part 2 article in a future issue of RadioGraphics.
Peripheral and Central Vascular Manifestations of COVID-19
Pathophysiology of Vascular Thrombosis
There is growing evidence of coagulopathy related to COVID-19, which may predispose patients to both venous and arterial thromboembolism and result in deep venous thrombosis (DVT), PE, limb ischemia, stroke, and myocardial infarction (103–105). Although the pathogenesis and incidence of thrombotic complications are not clearly understood, coagulopathy has been noted to be a poor prognostic indicator and is associated with higher mortality (60,103,106,107).
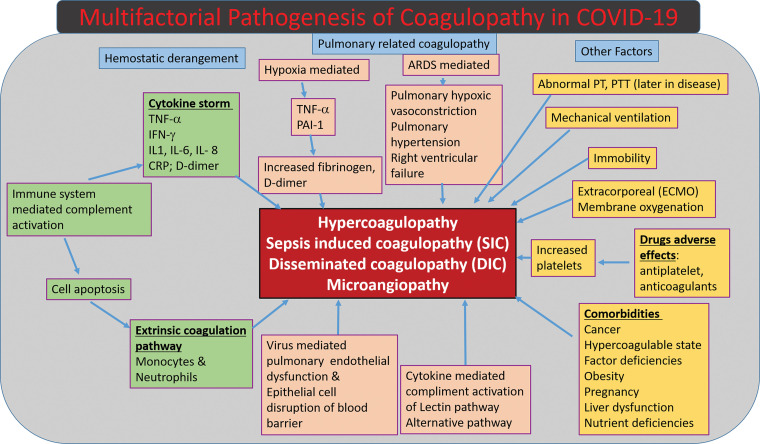
The most common pattern of coagulopathy observed in patients hospitalized with COVID-19 is characterized by elevated d-dimer and fibrinogen levels (108) and correlates with a parallel rise in inflammatory marker levels, including but not limited to levels of C-reactive protein, tumor necrosis factor-α, and various interleukins (Fig 18) (54,107–109).
Figure 18.
Diagram shows the multifactorial mechanisms of coagulopathy related to COVID-19. CRP = C-reactive protein, IFN-γ = interferon γ, IL-1 = interleukin-1, IL- 6 = interleukin-6, IL-8 = interleukin-8, PAI-1 = pasminogen activator inhibitor-1, PT = prothrombin time, PTT = partial thromboplastin time, TNF-α = tumor necrosis factor-α.
Initial data have demonstrated that COVID-19–associated coagulopathy manifests with features of both sepsis-induced coagulopathy and thrombotic microangiopathy (54,107–109). Multiple factors, including inflammatory cytokine release, critical illness, platelet activation, and endothelial dysfunction, play a role. This is further evidenced by recent histologic data that have demonstrated diffuse alveolar damage, microthrombi formation, and occlusion of small pulmonary vessels (65). However, it is still uncertain whether COVID-19 has other unique characteristics that result in direct activation of coagulation.
As seen in other infections that result in sepsis-induced coagulopathy, the primary infection of COVID-19 initiates cellular injury and results in an inflammatory response, which includes production of inflammatory cytokines, endothelial activation, and recruitment of neutrophils and mononuclear cells. The activation of coagulation is a host immune response that contributes to the compartmentalization of pathogens in an attempt to prevent dissemination. However, endothelial cell dysfunction results in excess thrombin production and disrupted fibrinolysis, which results in a hypercoagulable state. Following cellular injury, tissue factor, which is a critical initiator of the extrinsic coagulation pathway, is expressed on macrophages, monocytes, and endothelial cells and plays a central role in the development of coagulopathy and disseminated intravascular coagulation. Additionally, fibrinolysis is suppressed in sepsis (110,111).
Compared with the typical pattern of sepsis-induced coagulopathy, patients with COVID-19 are diagnosed with less prominent thrombocytopenia (111). Additionally, prothrombin time and partial thromboplastin time remain near normal and fibrinogen levels are elevated until later in the disease process when they decrease and patients subsequently develop disseminated intravascular coagulation (57,107–109).
Additionally, authors of a recent study have suggested that a small subset of severe COVID-19 cases demonstrate complement-mediated microvascular injury and thrombosis, consistent with activation of the alternative pathway and lectin pathway cascades (112).
It is also important to note that hypoxia itself can stimulate thrombosis through an increase in blood viscosity and a hypoxia-inducible transcription factor–dependent signaling pathway. Additionally, ARDS may be a potential cause for hypoxic pulmonary vasoconstriction, pulmonary hypertension, and right ventricular failure (104).
Aside from hemostatic derangements, underlying comorbidities (cancer, obesity, etc) and immobility and the use of mechanical ventilation, central venous catheters, and extracorporeal circuits contribute to thrombotic risk. In addition, current investigational medications for treating COVID-19 may have adverse drug-drug interactions with antiplatelet agents and anticoagulation therapy (113).
To summarize, the pathophysiology of the hypercoagulable state found in association with COVID-19 disease is extremely complex and multifactorial in nature, with many varied factors playing a role in its occurrence (Fig 18).
It is important to note that the existing evidence is primarily derived from a few small retrospective analyses, and further evaluation with large prospective cohort studies must be conducted to better understand this illness.
Role of Imaging
Duplex US, MR angiography, and CT angiography, as well as MR and indirect or combined CT venography are the primary noninvasive modalities for the diagnosis of arterial and venous thrombosis and thromboembolism in patients with COVID-19 (114,115). However, it is important to note that these disease processes may also be detected at routine contrast-enhanced CT performed in the portal venous phase, particularly when the main or large branch vessels are affected. Taking into consideration that many multiorgan and multisystem complications of COVID-19 are caused by or directly associated with vascular thrombotic events, careful assessment of the vasculature is essential in the evaluation of all imaging examinations performed in patients with COVID-19.
Venous Thromboembolism
The risk of venous thromboembolism (VTE), which is already greater in all critically ill patients, is higher in those with critical illness due to SARS-CoV-2 infection (116). An ever-increasing number of published studies have assessed the risk of VTE in patients with COVID-19, with reported incidences of DVT ranging from 25% to 49% (54,116–118). The incidence was found to be much higher if both symptomatic and asymptomatic patients were assessed and in patients with prolonged hospital stays in the ICU (cumulative incidence rates were as high as 59% at 21 days of hospitalization) (118). The wide range of reported incidences can be explained by the fact that VTE remains largely underdiagnosed in patients with severe COVID-19, as only symptomatic patients generally undergo imaging. This is in part due to the contagious nature of COVID-19, as its high transmissibility rate complicates the workup of patients with infection. In an attempt to minimize exposure to radiologic technologists and transport personnel, only symptomatic patients are typically eligible to undergo imaging, often using abbreviated protocols and portable machines that may result in a limited evaluation.
Additionally, the concern over shortages of personal protective equipment (PPE) influenced the number and types of examinations that were offered to this group of patients. Underdiagnosis of complications of VTE in patients with COVID-19 is a significant issue, as many of these patients who are severely ill already have ARDS and its complications (including hypoxic pulmonary vasoconstriction, pulmonary hypertension, and right ventricular failure), and further insult from a PE may be fatal. It is important to note that veins of any caliber may be affected, and therefore all vessels should be scrutinized for potential thrombus.
Elevated d-dimer levels, commonly found in patients with COVID-19, do not currently warrant routine investigation for acute VTE in the absence of clinical manifestations or other supporting information (119). However, in patients with high clinical suspicion for VTE, there should be a low threshold for ordering diagnostic tests to evaluate for DVT and/or PE.
The imaging examinations performed to diagnose DVT or PE in patients with COVID-19 may not be requested or performed, potentially owing to patient instability. Moreover, performing imaging examinations may be challenging in patients with severe ARDS who require prone positioning. Investigating for PE as well as lower and upper extremity DVT may not always be feasible owing to these clinical and positioning issues. Although deterioration of right ventricular function in this setting may be a critical finding that justifies the need for establishing a diagnosis of PE, it could also be argued that the prognosis of patients with ARDS who require prone positioning is so grave that investigation for an underlying VTE may not alter the clinical course. Preventive and therapeutic use of antithrombotic agents is helpful toward mitigating the occurrence thrombotic and hemorrhagic events in these high-risk patients (104).
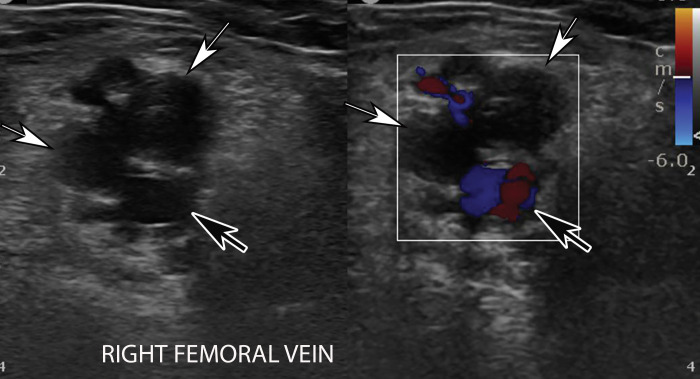
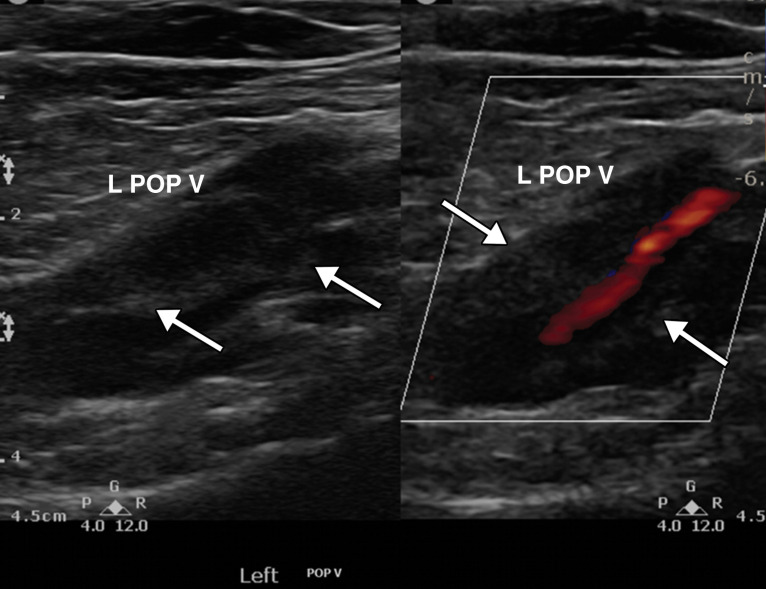
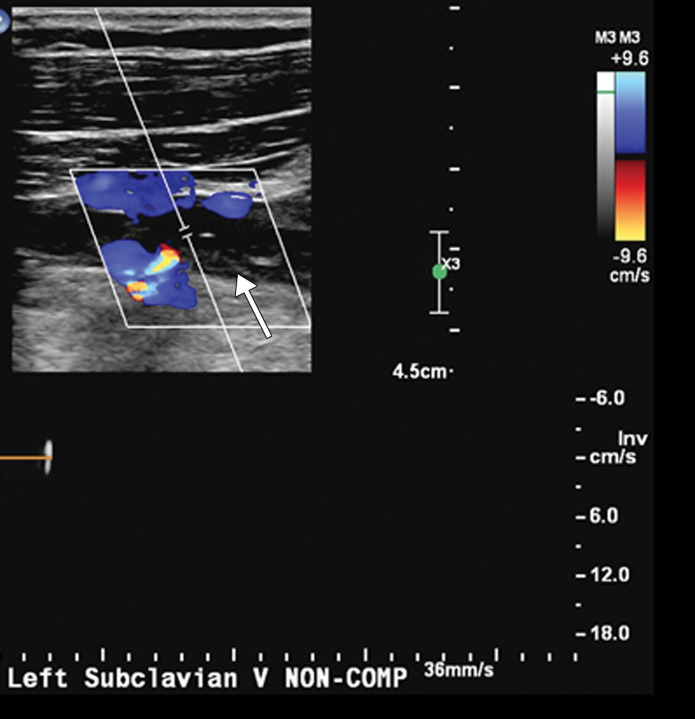
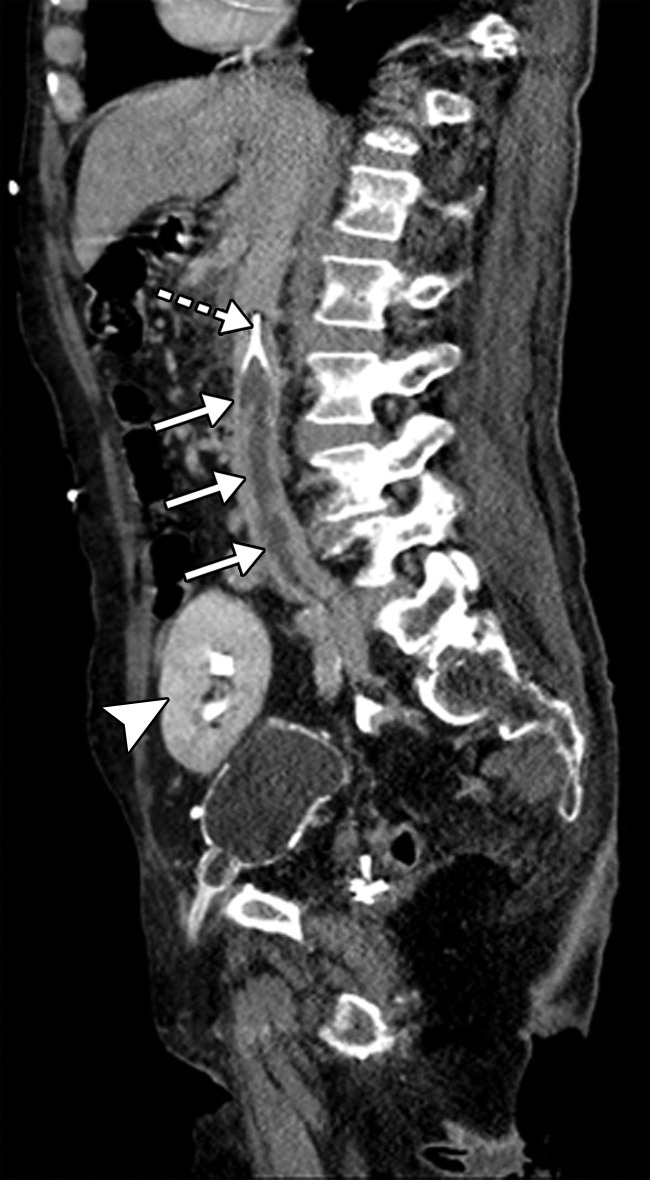
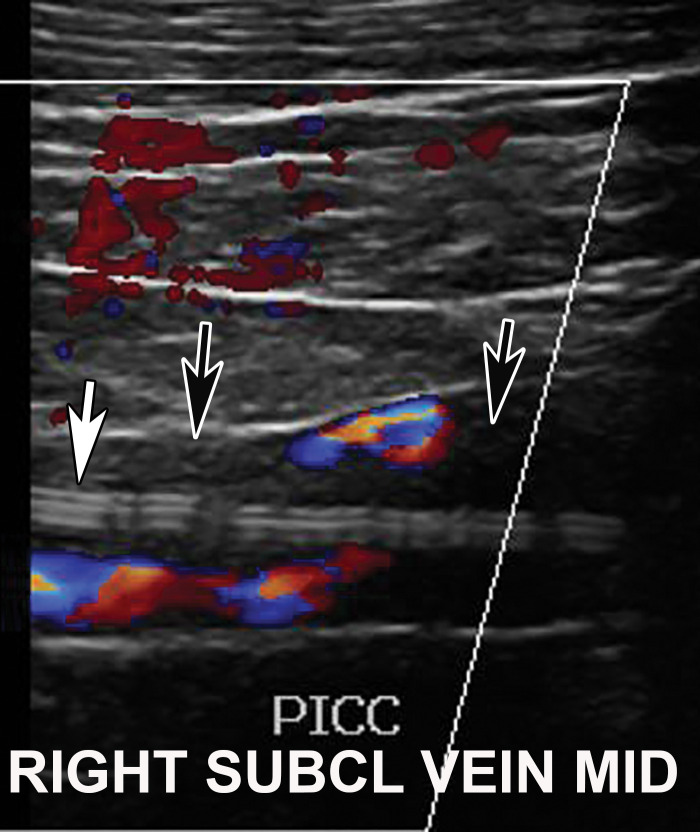
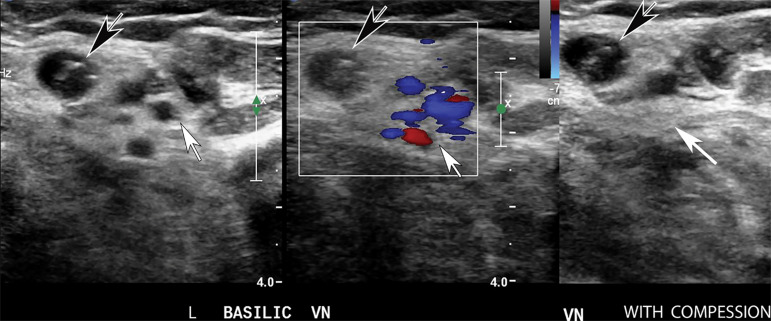
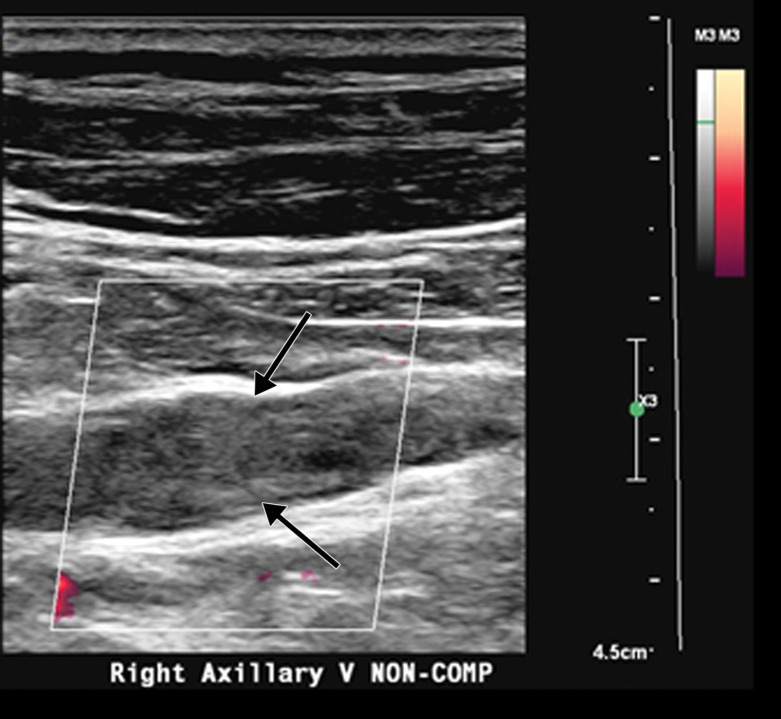
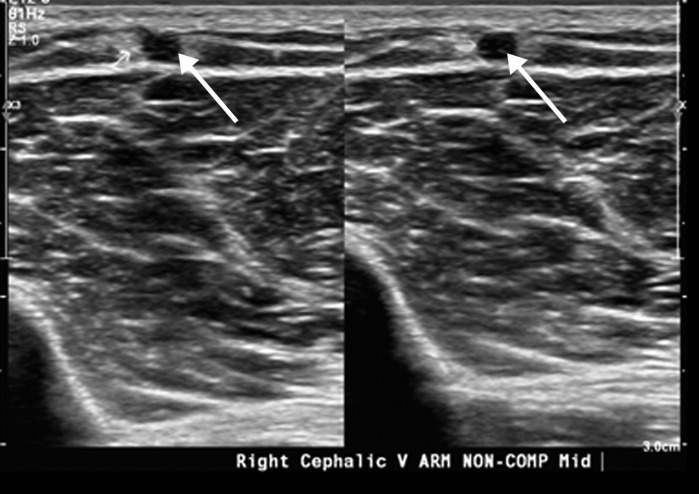
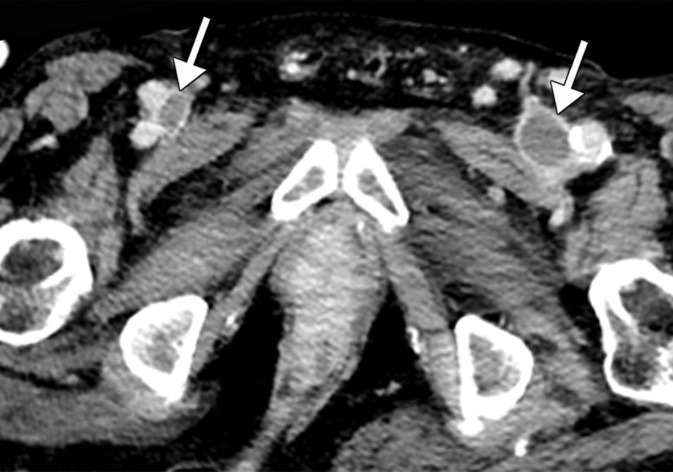
Lower and upper extremity Doppler US is the first-line imaging modality for diagnosis of peripheral venous thrombosis and can be performed at the bedside. Occlusive and partially occlusive thrombi and their potential associations with central lines can be readily diagnosed (Figs 19–21). Noncompressible veins, echogenic clot, and minimal or absent flow within a distended vein are the US hallmarks of acute or subacute DVT (Figs 21–23). Superinfection may result in thrombophlebitis and can be diagnosed by the demonstration of hyperemia in the wall of an otherwise thrombotic vessel at color Doppler US. In cases of incomplete and/or inadequate thrombus evaluation or extension of thrombus into a more central vessel, CT and MR venography can be employed (Fig 24). The presence of a filling defect within a vessel, with or without occlusion, is the characteristic finding of venous thrombosis.
Figure 19.
Occlusive DVT of the femoral vein in an 88-year-old man who had been hospitalized with COVID-19. Gray-scale (left) and color Doppler (right) US images obtained in the transverse plane show dilated femoral veins (white arrows), with internal heterogeneous echogenic material and absence of flow on the color Doppler US image, findings compatible with occlusion. The veins were noncompressible (not shown). Note that the femoral artery is filled with color, indicative of patency (black arrows).
Figure 21.
Partially occlusive thrombus in the left popliteal vein (L POP V) in a critically ill 64-year-old man with COVID-19 who acutely developed left leg swelling. Laboratory test results confirmed elevated d-dimer levels. Gray-scale (left) and power Doppler (right) US images show a dilated left popliteal vein with echogenic thrombus (arrows) within, best visualized on the gray-scale US image. Power Doppler image US (right) shows absence of flow within the distended vein except for a small amount of flow within the lumen of the vessel, indicative of a partially occlusive thrombus.
Figure 23a.
Extensive bilateral upper extremity DVT in a critically ill 77-year-old man with COVID-19 who developed bilateral upper extremity swelling, with markedly elevated d-dimer levels (31 447 ng/mL). (a, b) Sagittal color (a) and power (b) Doppler US images show absent flow in the distended vein, with echogenic material in the left subclavian vein (arrow in a) and the right axillary vein (arrows in b), compatible with bilateral occlusive thrombi. Additional occlusive and nonocclusive thrombi were also seen (not shown). (c) Gray-scale US images without (left) and with (right) compression show a thrombus (arrows) in the right cephalic vein, which demonstrates no vascular compression (arrows).
Figure 24a.
Inferior vena cava (IVC) and peripheral deep vein thrombosis in a 78-year-old man with COVID-19 with leg swelling and abdominal pain. Sagittal (a) and axial (b) contrast-enhanced CT images show filling defects in the bilateral common femoral veins (solid arrows). Near complete occlusion of the IVC (solid arrows in a) to the level of an IVC filter (dashed arrow in a) was present. Note the renal transplant (arrowhead in a). Both central and peripheral venous thrombosis were not depicted at prior imaging examinations (not shown).
Figure 20.
DVT associated with a peripherally inserted central catheter (PICC) line in a 54-year-old man with COVID-19. Sagittal color Doppler US image shows an echogenic thrombus (black arrows) in the right subclavian vein, associated with the PICC line (white arrow).
Figures 22.
Superficial vein thrombosis in a 72-year-old woman hospitalized with COVID-19. Transverse gray-scale (left) and color Doppler (middle) US images without compression and gray-scale US image with compression (right) show an occlusive thrombus in the dilated basilic vein (black arrows). Note the absence of flow within the vein on the color Doppler US image (middle) and noncompressibility of the vein (left). The brachial veins (white arrows) are compressible (right) and demonstrate patency on the color Doppler US image (middle).
Figure 23b.
Extensive bilateral upper extremity DVT in a critically ill 77-year-old man with COVID-19 who developed bilateral upper extremity swelling, with markedly elevated d-dimer levels (31 447 ng/mL). (a, b) Sagittal color (a) and power (b) Doppler US images show absent flow in the distended vein, with echogenic material in the left subclavian vein (arrow in a) and the right axillary vein (arrows in b), compatible with bilateral occlusive thrombi. Additional occlusive and nonocclusive thrombi were also seen (not shown). (c) Gray-scale US images without (left) and with (right) compression show a thrombus (arrows) in the right cephalic vein, which demonstrates no vascular compression (arrows).
Figure 23c.
Extensive bilateral upper extremity DVT in a critically ill 77-year-old man with COVID-19 who developed bilateral upper extremity swelling, with markedly elevated d-dimer levels (31 447 ng/mL). (a, b) Sagittal color (a) and power (b) Doppler US images show absent flow in the distended vein, with echogenic material in the left subclavian vein (arrow in a) and the right axillary vein (arrows in b), compatible with bilateral occlusive thrombi. Additional occlusive and nonocclusive thrombi were also seen (not shown). (c) Gray-scale US images without (left) and with (right) compression show a thrombus (arrows) in the right cephalic vein, which demonstrates no vascular compression (arrows).
Figure 24b.
Inferior vena cava (IVC) and peripheral deep vein thrombosis in a 78-year-old man with COVID-19 with leg swelling and abdominal pain. Sagittal (a) and axial (b) contrast-enhanced CT images show filling defects in the bilateral common femoral veins (solid arrows). Near complete occlusion of the IVC (solid arrows in a) to the level of an IVC filter (dashed arrow in a) was present. Note the renal transplant (arrowhead in a). Both central and peripheral venous thrombosis were not depicted at prior imaging examinations (not shown).
Arterial Thrombosis
The authors of only a few studies to date have evaluated the frequency of peripheral arterial thrombosis in patients with COVID, with a reported incidence of 3.7% (116). The authors of a few reported cases of lower extremity arterial thrombosis have suggested a link between preexisting peripheral arterial disease and the development of arterial thromboembolism. It has been hypothesized that acute and progressive thrombosis may be attributable to a combination of the hyperinflammatory state induced by COVID-19 superimposed on a preexisting condition (120,121).
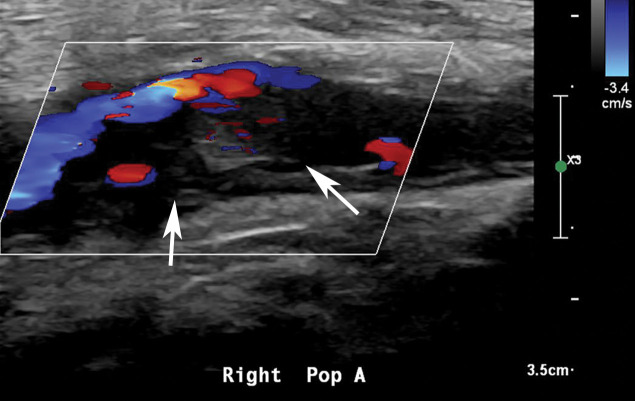
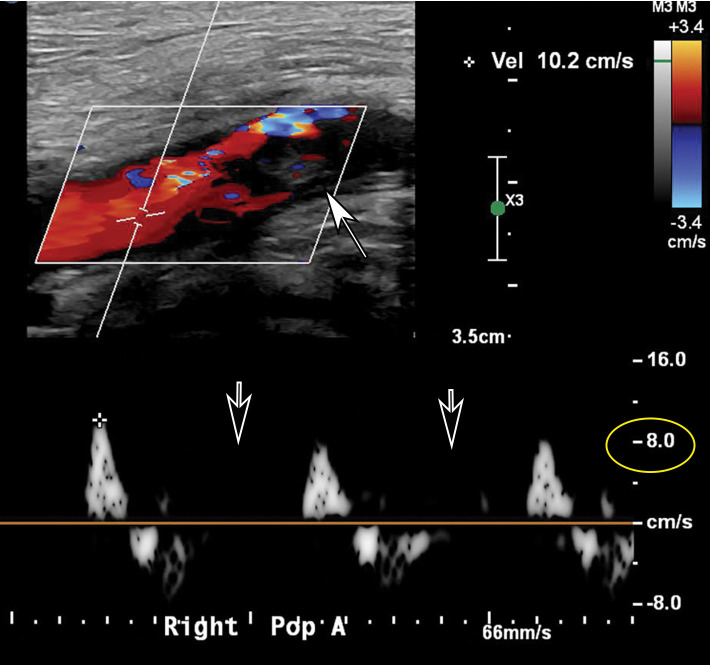
Doppler US and CT angiography of the extremity vessels are both instrumental in the evaluation of peripheral arterial thrombosis. At US, absence of flow within an arterial segment is diagnostic of an occlusive thrombus. Abnormal waveforms (stump waveforms), characterized by a low amplitude and high-resistance pattern with absence of diastolic flow, can aid in identification of a more distal occlusion. Alternatively, tardus parvus waveforms within more distally recanalized vessels are findings suggestive of a more proximal significant stenosis or occlusion (Fig 25). Reconstituted flow, sometimes with collateralization, may be depicted distal to an occlusion. Peripheral and central arterial thromboembolism may also be the result of atrial fibrillation.
Figure 25a.
Popliteal and posterior tibial artery thrombosis in a 58-year-old woman with COVID-19 in the ICU. (a, b) Sagittal color (a) and spectral (b) Doppler US images show an echogenic heterogeneous thrombus (white arrows) distending the right popliteal artery. The characteristic knocking or “stump-thump” waveform with absence of diastolic flow (black arrows in b) and low amplitude (yellow circle in b) imply the presence of occlusion just distal to the area of interrogation. (c) Sagittal power Doppler US image shows no flow in the occluded right posterior tibial artery (black arrows). (d) Corresponding sagittal CT angiographic reconstruction shows abrupt cutoff of the popliteal artery by a thrombus (solid arrow). Note the opacified popliteal artery (Rt POP A) proximal to the thrombus (dashed arrow). The patient also had a liver infarct and bowel ischemia (not shown).
Figure 25b.
Popliteal and posterior tibial artery thrombosis in a 58-year-old woman with COVID-19 in the ICU. (a, b) Sagittal color (a) and spectral (b) Doppler US images show an echogenic heterogeneous thrombus (white arrows) distending the right popliteal artery. The characteristic knocking or “stump-thump” waveform with absence of diastolic flow (black arrows in b) and low amplitude (yellow circle in b) imply the presence of occlusion just distal to the area of interrogation. (c) Sagittal power Doppler US image shows no flow in the occluded right posterior tibial artery (black arrows). (d) Corresponding sagittal CT angiographic reconstruction shows abrupt cutoff of the popliteal artery by a thrombus (solid arrow). Note the opacified popliteal artery (Rt POP A) proximal to the thrombus (dashed arrow). The patient also had a liver infarct and bowel ischemia (not shown).
Figure 25c.
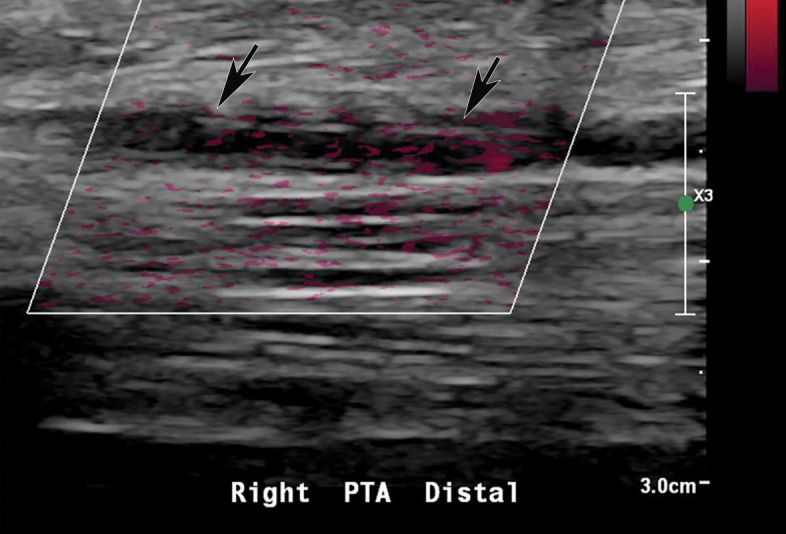
Popliteal and posterior tibial artery thrombosis in a 58-year-old woman with COVID-19 in the ICU. (a, b) Sagittal color (a) and spectral (b) Doppler US images show an echogenic heterogeneous thrombus (white arrows) distending the right popliteal artery. The characteristic knocking or “stump-thump” waveform with absence of diastolic flow (black arrows in b) and low amplitude (yellow circle in b) imply the presence of occlusion just distal to the area of interrogation. (c) Sagittal power Doppler US image shows no flow in the occluded right posterior tibial artery (black arrows). (d) Corresponding sagittal CT angiographic reconstruction shows abrupt cutoff of the popliteal artery by a thrombus (solid arrow). Note the opacified popliteal artery (Rt POP A) proximal to the thrombus (dashed arrow). The patient also had a liver infarct and bowel ischemia (not shown).
Figure 25d.
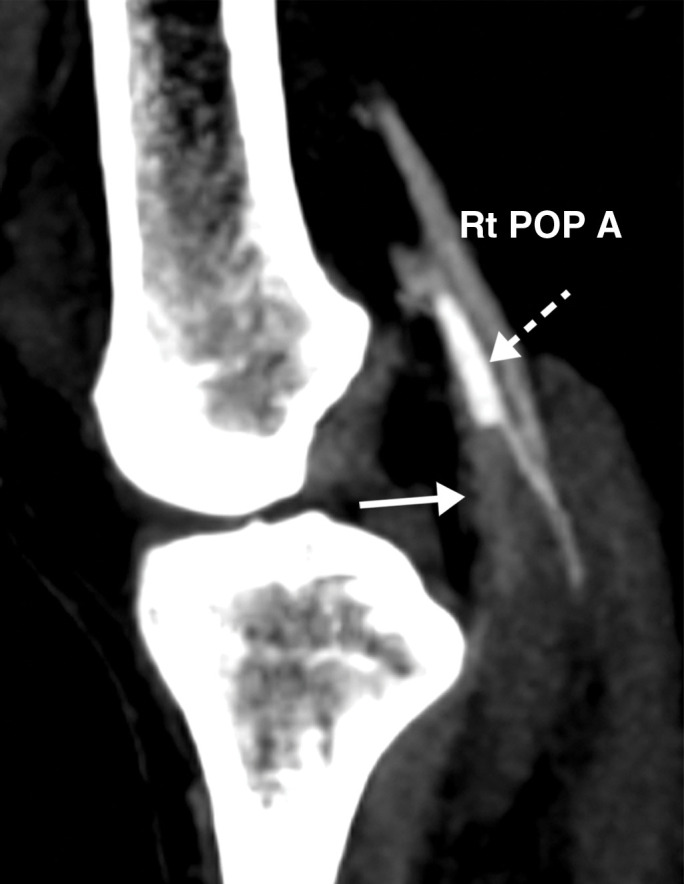
Popliteal and posterior tibial artery thrombosis in a 58-year-old woman with COVID-19 in the ICU. (a, b) Sagittal color (a) and spectral (b) Doppler US images show an echogenic heterogeneous thrombus (white arrows) distending the right popliteal artery. The characteristic knocking or “stump-thump” waveform with absence of diastolic flow (black arrows in b) and low amplitude (yellow circle in b) imply the presence of occlusion just distal to the area of interrogation. (c) Sagittal power Doppler US image shows no flow in the occluded right posterior tibial artery (black arrows). (d) Corresponding sagittal CT angiographic reconstruction shows abrupt cutoff of the popliteal artery by a thrombus (solid arrow). Note the opacified popliteal artery (Rt POP A) proximal to the thrombus (dashed arrow). The patient also had a liver infarct and bowel ischemia (not shown).
CT angiography aids in the assessment of the extent of thrombosis and its potential complications such as ischemia to a related structure or organ. An abrupt cutoff of the affected vessel may be readily detected at CT angiography (Figs 25–28, Movie 3). The few reported cases (122) of peripheral arterial thromboembolism associated with COVID-19 have involved both upper and lower extremity arteries, and carotid and vertebral artery involvement have been described as well. The larger central arterial system may also be involved (eg, floating thrombi may be visualized in the aorta and aortic arch) (Fig 29) (122). It is important to keep in mind that COVID-19 can affect more than one organ or structure, and every organ and vessel should be scrutinized when assessing for complications (Figs 27–29).
Figure 28a.
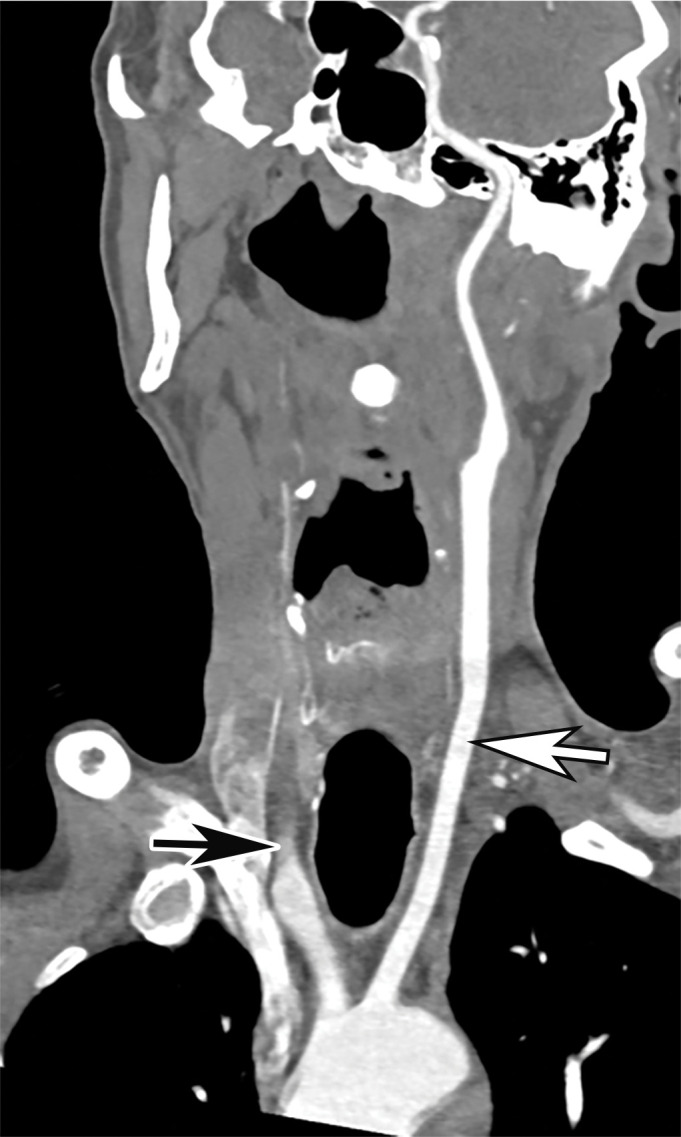
Common carotid artery (CCA) occlusion in a 56-year-old woman with neurologic deficits who had been hospitalized with COVID-19. (a, b) Coronal three-dimensional maximum intensity projection reformatted image (a) and axial CT angiographic image (b) of the head and neck show an abrupt cutoff at the origin of the CCA (black arrow in a). Note the absence of opacification of the right CCA, as well as internal and external carotid arteries (arrows in b). The left carotid vasculature is well opacified with intravenous contrast material (white arrow in a). (c) Axial nonenhanced head CT image shows wedge-shaped areas of hypoattenuation (arrows) in a watershed distribution, consistent with acute infarcts related to carotid occlusion.
Figure 29a.
Central and peripheral arterial thrombosis in a severely ill 46-year-old man with COVID-19 in the ICU. (a, b) Axial (a) and sagittal (b) chest CT angiographic images show bibasilar areas of consolidation (black arrows in a), indicative of COVID-19 pneumonia, and a central aortic thrombosis with a thrombus attached to the wall of the aortic arch (white arrow in a and b). (c–f) Sagittal (c), coronal (d), and axial (e, f) CT angiographic images show a large thrombus extending from the abdominal aorta into the superior mesenteric artery origin (arrow in c), which resulted in bowel ischemia, evidenced by thickening of the watershed splenic flexure of the large bowel (arrow in d). Note the multifocal bilateral wedge-shaped renal cortical infarcts (arrows in e). Note also a nonocclusive thrombus in the left profunda femoris artery (white arrow in f), indicative of a concurrent presence of a peripheral thrombosis. There is normal opacification of the patent right profunda femoris artery (black arrow in f). This case demonstrates multifocal multisystem manifestations of COVID-19 complicated by coagulopathy that resulted in injury to various organs and systems. It is an example of the need for increased awareness among radiologists to thoroughly evaluate all covered anatomy for COVID-related complications.
Figure 27a.
Brachial artery thrombosis and renal infarct in a 51-year-old man who presented to the emergency department with acute left upper extremity pain and numbness. The patient had a 2-week history of cough and fever and was confirmed to be COVID-19 positive. (a) Coronal left upper extremity CT angiographic image shows an abrupt segmental occlusion (arrow) of the distal left brachial artery, indicative of peripheral arterial thromboembolization. The left subclavian and axillary arteries were otherwise unremarkable, with good opacification of the arteries. (b) Coronal three-dimensional maximum intensity projection shows abrupt cutoff (arrow) of the left brachial artery. (c, d) Axial chest CT angiographic images show the typical appearance of lung changes in COVID-19 pneumonia (arrows in c). Note the incidentally found sharp well-defined area of nonenhancement in the partially imaged upper pole of the right kidney, a finding indicative of a renal infarct (arrows in d).
Figure 26.
Popliteal artery occlusion in a severely ill 65-year-old man with COVID-19 with bilateral diminished dorsalis pedis pulses. Coronal three-dimensional volume-rendered run-off CT angiographic image shows abrupt cutoff (arrows) of the bilateral popliteal arteries (PA), compatible with bilateral occlusion. Note that distally run-off calf arteries have been reconstituted through collateral arteries. R LE = right lower extremity, L LE = left lower extremity.
Figure 27b.
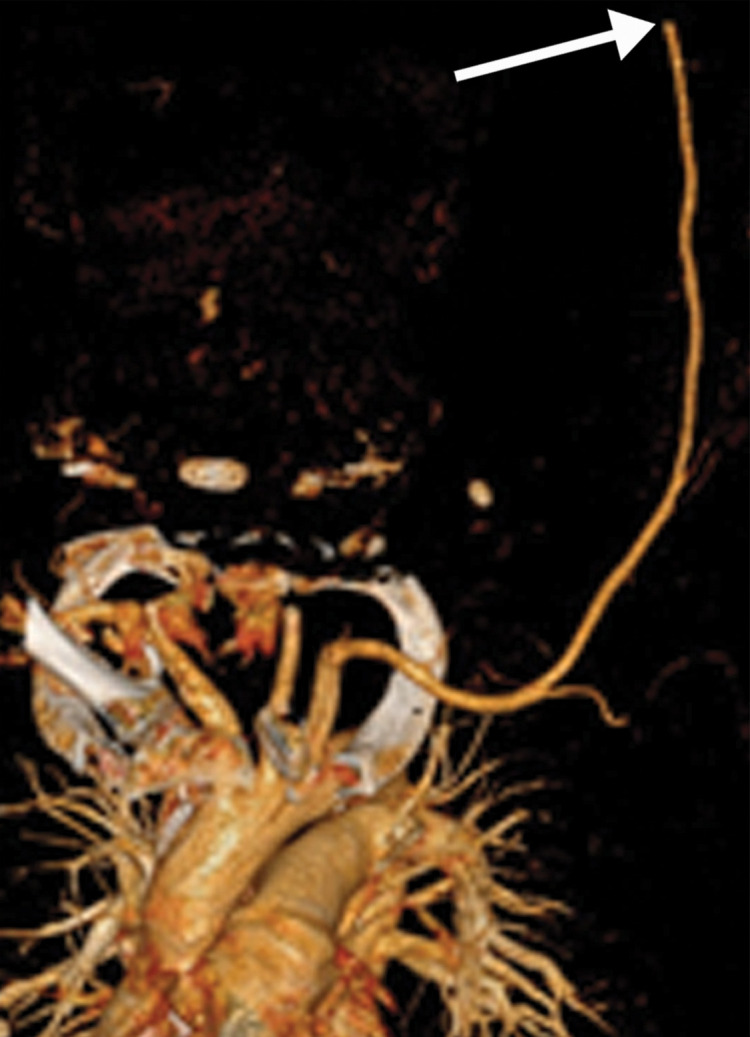
Brachial artery thrombosis and renal infarct in a 51-year-old man who presented to the emergency department with acute left upper extremity pain and numbness. The patient had a 2-week history of cough and fever and was confirmed to be COVID-19 positive. (a) Coronal left upper extremity CT angiographic image shows an abrupt segmental occlusion (arrow) of the distal left brachial artery, indicative of peripheral arterial thromboembolization. The left subclavian and axillary arteries were otherwise unremarkable, with good opacification of the arteries. (b) Coronal three-dimensional maximum intensity projection shows abrupt cutoff (arrow) of the left brachial artery. (c, d) Axial chest CT angiographic images show the typical appearance of lung changes in COVID-19 pneumonia (arrows in c). Note the incidentally found sharp well-defined area of nonenhancement in the partially imaged upper pole of the right kidney, a finding indicative of a renal infarct (arrows in d).
Figure 27c.
Brachial artery thrombosis and renal infarct in a 51-year-old man who presented to the emergency department with acute left upper extremity pain and numbness. The patient had a 2-week history of cough and fever and was confirmed to be COVID-19 positive. (a) Coronal left upper extremity CT angiographic image shows an abrupt segmental occlusion (arrow) of the distal left brachial artery, indicative of peripheral arterial thromboembolization. The left subclavian and axillary arteries were otherwise unremarkable, with good opacification of the arteries. (b) Coronal three-dimensional maximum intensity projection shows abrupt cutoff (arrow) of the left brachial artery. (c, d) Axial chest CT angiographic images show the typical appearance of lung changes in COVID-19 pneumonia (arrows in c). Note the incidentally found sharp well-defined area of nonenhancement in the partially imaged upper pole of the right kidney, a finding indicative of a renal infarct (arrows in d).
Figure 27d.
Brachial artery thrombosis and renal infarct in a 51-year-old man who presented to the emergency department with acute left upper extremity pain and numbness. The patient had a 2-week history of cough and fever and was confirmed to be COVID-19 positive. (a) Coronal left upper extremity CT angiographic image shows an abrupt segmental occlusion (arrow) of the distal left brachial artery, indicative of peripheral arterial thromboembolization. The left subclavian and axillary arteries were otherwise unremarkable, with good opacification of the arteries. (b) Coronal three-dimensional maximum intensity projection shows abrupt cutoff (arrow) of the left brachial artery. (c, d) Axial chest CT angiographic images show the typical appearance of lung changes in COVID-19 pneumonia (arrows in c). Note the incidentally found sharp well-defined area of nonenhancement in the partially imaged upper pole of the right kidney, a finding indicative of a renal infarct (arrows in d).
Figure 28b.
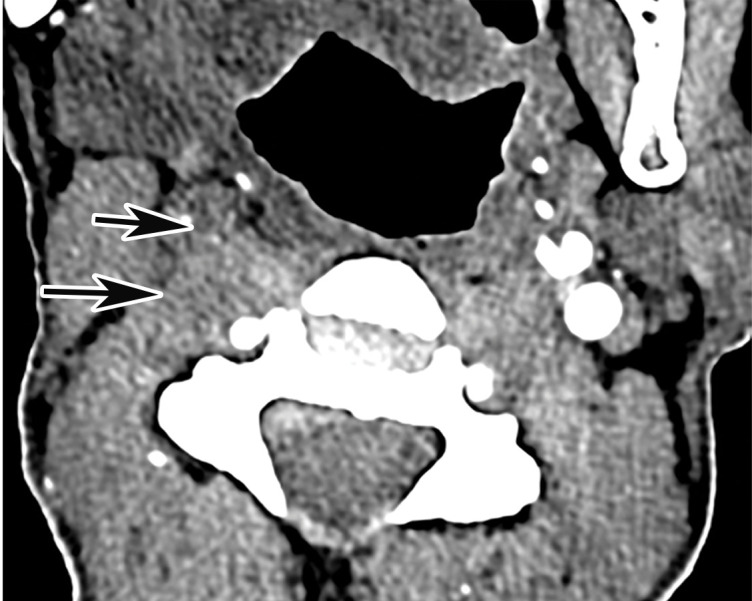
Common carotid artery (CCA) occlusion in a 56-year-old woman with neurologic deficits who had been hospitalized with COVID-19. (a, b) Coronal three-dimensional maximum intensity projection reformatted image (a) and axial CT angiographic image (b) of the head and neck show an abrupt cutoff at the origin of the CCA (black arrow in a). Note the absence of opacification of the right CCA, as well as internal and external carotid arteries (arrows in b). The left carotid vasculature is well opacified with intravenous contrast material (white arrow in a). (c) Axial nonenhanced head CT image shows wedge-shaped areas of hypoattenuation (arrows) in a watershed distribution, consistent with acute infarcts related to carotid occlusion.
Figure 28c.
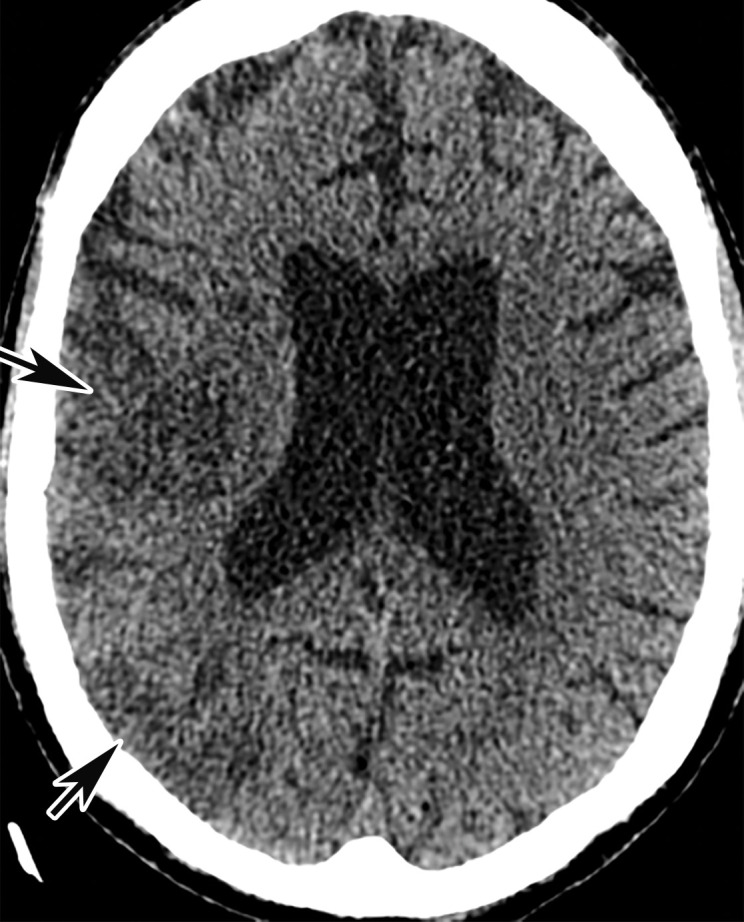
Common carotid artery (CCA) occlusion in a 56-year-old woman with neurologic deficits who had been hospitalized with COVID-19. (a, b) Coronal three-dimensional maximum intensity projection reformatted image (a) and axial CT angiographic image (b) of the head and neck show an abrupt cutoff at the origin of the CCA (black arrow in a). Note the absence of opacification of the right CCA, as well as internal and external carotid arteries (arrows in b). The left carotid vasculature is well opacified with intravenous contrast material (white arrow in a). (c) Axial nonenhanced head CT image shows wedge-shaped areas of hypoattenuation (arrows) in a watershed distribution, consistent with acute infarcts related to carotid occlusion.
Movie 3.
Popliteal artery thrombosis in a 58-year-old woman with COVID-19 in the ICU. Sagittal color Doppler US cine clip shows echogenic heterogeneous thrombus (yellow arrows) distending and occluding the right popliteal artery.
Figure 29b.
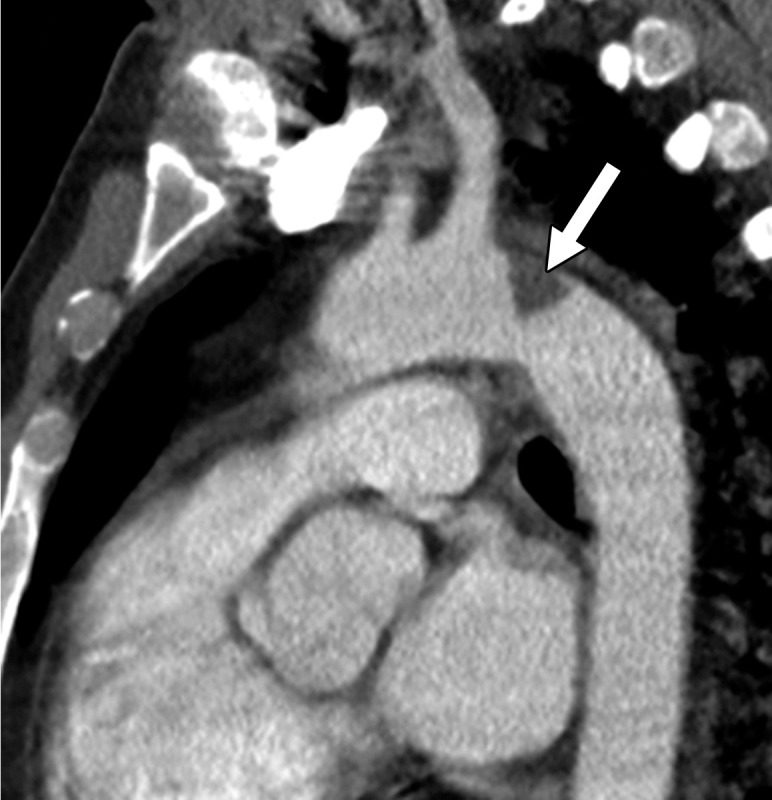
Central and peripheral arterial thrombosis in a severely ill 46-year-old man with COVID-19 in the ICU. (a, b) Axial (a) and sagittal (b) chest CT angiographic images show bibasilar areas of consolidation (black arrows in a), indicative of COVID-19 pneumonia, and a central aortic thrombosis with a thrombus attached to the wall of the aortic arch (white arrow in a and b). (c–f) Sagittal (c), coronal (d), and axial (e, f) CT angiographic images show a large thrombus extending from the abdominal aorta into the superior mesenteric artery origin (arrow in c), which resulted in bowel ischemia, evidenced by thickening of the watershed splenic flexure of the large bowel (arrow in d). Note the multifocal bilateral wedge-shaped renal cortical infarcts (arrows in e). Note also a nonocclusive thrombus in the left profunda femoris artery (white arrow in f), indicative of a concurrent presence of a peripheral thrombosis. There is normal opacification of the patent right profunda femoris artery (black arrow in f). This case demonstrates multifocal multisystem manifestations of COVID-19 complicated by coagulopathy that resulted in injury to various organs and systems. It is an example of the need for increased awareness among radiologists to thoroughly evaluate all covered anatomy for COVID-related complications.
Figure 29c.
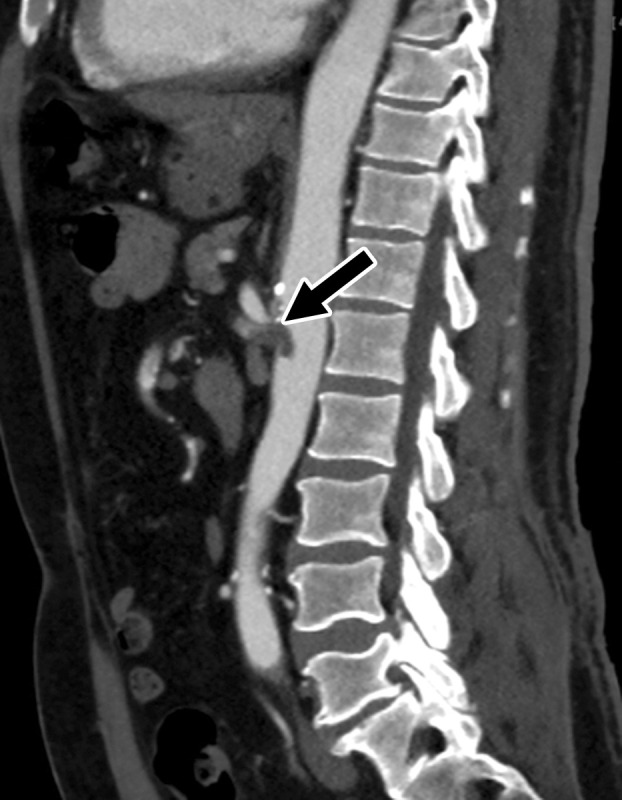
Central and peripheral arterial thrombosis in a severely ill 46-year-old man with COVID-19 in the ICU. (a, b) Axial (a) and sagittal (b) chest CT angiographic images show bibasilar areas of consolidation (black arrows in a), indicative of COVID-19 pneumonia, and a central aortic thrombosis with a thrombus attached to the wall of the aortic arch (white arrow in a and b). (c–f) Sagittal (c), coronal (d), and axial (e, f) CT angiographic images show a large thrombus extending from the abdominal aorta into the superior mesenteric artery origin (arrow in c), which resulted in bowel ischemia, evidenced by thickening of the watershed splenic flexure of the large bowel (arrow in d). Note the multifocal bilateral wedge-shaped renal cortical infarcts (arrows in e). Note also a nonocclusive thrombus in the left profunda femoris artery (white arrow in f), indicative of a concurrent presence of a peripheral thrombosis. There is normal opacification of the patent right profunda femoris artery (black arrow in f). This case demonstrates multifocal multisystem manifestations of COVID-19 complicated by coagulopathy that resulted in injury to various organs and systems. It is an example of the need for increased awareness among radiologists to thoroughly evaluate all covered anatomy for COVID-related complications.
Figure 29d.
Central and peripheral arterial thrombosis in a severely ill 46-year-old man with COVID-19 in the ICU. (a, b) Axial (a) and sagittal (b) chest CT angiographic images show bibasilar areas of consolidation (black arrows in a), indicative of COVID-19 pneumonia, and a central aortic thrombosis with a thrombus attached to the wall of the aortic arch (white arrow in a and b). (c–f) Sagittal (c), coronal (d), and axial (e, f) CT angiographic images show a large thrombus extending from the abdominal aorta into the superior mesenteric artery origin (arrow in c), which resulted in bowel ischemia, evidenced by thickening of the watershed splenic flexure of the large bowel (arrow in d). Note the multifocal bilateral wedge-shaped renal cortical infarcts (arrows in e). Note also a nonocclusive thrombus in the left profunda femoris artery (white arrow in f), indicative of a concurrent presence of a peripheral thrombosis. There is normal opacification of the patent right profunda femoris artery (black arrow in f). This case demonstrates multifocal multisystem manifestations of COVID-19 complicated by coagulopathy that resulted in injury to various organs and systems. It is an example of the need for increased awareness among radiologists to thoroughly evaluate all covered anatomy for COVID-related complications.
Figure 29e.
Central and peripheral arterial thrombosis in a severely ill 46-year-old man with COVID-19 in the ICU. (a, b) Axial (a) and sagittal (b) chest CT angiographic images show bibasilar areas of consolidation (black arrows in a), indicative of COVID-19 pneumonia, and a central aortic thrombosis with a thrombus attached to the wall of the aortic arch (white arrow in a and b). (c–f) Sagittal (c), coronal (d), and axial (e, f) CT angiographic images show a large thrombus extending from the abdominal aorta into the superior mesenteric artery origin (arrow in c), which resulted in bowel ischemia, evidenced by thickening of the watershed splenic flexure of the large bowel (arrow in d). Note the multifocal bilateral wedge-shaped renal cortical infarcts (arrows in e). Note also a nonocclusive thrombus in the left profunda femoris artery (white arrow in f), indicative of a concurrent presence of a peripheral thrombosis. There is normal opacification of the patent right profunda femoris artery (black arrow in f). This case demonstrates multifocal multisystem manifestations of COVID-19 complicated by coagulopathy that resulted in injury to various organs and systems. It is an example of the need for increased awareness among radiologists to thoroughly evaluate all covered anatomy for COVID-related complications.
Figure 29f.
Central and peripheral arterial thrombosis in a severely ill 46-year-old man with COVID-19 in the ICU. (a, b) Axial (a) and sagittal (b) chest CT angiographic images show bibasilar areas of consolidation (black arrows in a), indicative of COVID-19 pneumonia, and a central aortic thrombosis with a thrombus attached to the wall of the aortic arch (white arrow in a and b). (c–f) Sagittal (c), coronal (d), and axial (e, f) CT angiographic images show a large thrombus extending from the abdominal aorta into the superior mesenteric artery origin (arrow in c), which resulted in bowel ischemia, evidenced by thickening of the watershed splenic flexure of the large bowel (arrow in d). Note the multifocal bilateral wedge-shaped renal cortical infarcts (arrows in e). Note also a nonocclusive thrombus in the left profunda femoris artery (white arrow in f), indicative of a concurrent presence of a peripheral thrombosis. There is normal opacification of the patent right profunda femoris artery (black arrow in f). This case demonstrates multifocal multisystem manifestations of COVID-19 complicated by coagulopathy that resulted in injury to various organs and systems. It is an example of the need for increased awareness among radiologists to thoroughly evaluate all covered anatomy for COVID-related complications.
It is also essential to recognize that patients with COVID-19 may develop thrombosis of various vascular systems, and there could be concomitant involvement of one or more venous or arterial vascular beds. Therefore, if evidence of thrombosis is detected, careful assessment of the entire imaged vascular system, as well as correlated organ or structure, is essential.
Conclusion
SARS-CoV-2 is a novel coronavirus that has rapidly resulted in a worldwide pandemic and has been the cause of extreme morbidity and mortality. It primarily affects the respiratory system but may also impact a multitude of other systems in the human body, resulting in multiorgan injury and, in some cases, failure. Imaging plays a significant role in the detection, diagnosis, and assessment of virus-induced injury, as well as its associated complications. A recognition and understanding of the pathophysiology of the virus and its effects on the immune system and coagulation is paramount toward improving radiologists’ ability to accurately identify key imaging findings and promptly recognize possible complications, specifically those affecting the pulmonary and vascular systems, thereby minimizing the number of diagnostic misses and misinterpretations.
Appropriate application of the described chest radiography and CT scoring systems in the evaluation of lung involvement, including automated assessment, may increase the consistency of reported findings and aid in risk stratification, as well as offer prognostic information. Owing to the complexity of the viral pathophysiology and its targeting of multiple organ systems, the recognition of one complication should prompt intense scrutiny for others, particularly if the patient is critically ill. A thorough knowledge of diagnostic imaging hallmarks, atypical imaging features, multisystem manifestations, and evolution of imaging findings is essential to optimize patient care.
Acknowledgments
Acknowledgments
The authors thank Christine O. (Cooky) Menias, MD, for her valuable guidance and recommendations; Misra Nilanjana, MD, Northwell Health, and Henry Douglas for their help with images; and Alexandria Brackett for the assistance with literature searches and references.
For this journal-based SA-CME activity, the authors, editor, and reviewers have disclosed no relevant relationships.
Abbreviations:
- ACE2
- angiotensin-converting enzyme 2
- AP
- anteroposterior
- ARDS
- acute respiratory disease syndrome
- COVID-19
- coronavirus disease 2019
- DVT
- deep vein thrombosis
- GGO
- ground-glass opacity
- ICU
- intensive care unit
- PE
- pulmonary embolism
- RT-PCR
- reverse transcription–polymerase chain reaction
- SARS-CoV-2
- severe acute respiratory syndrome coronavirus 2
- VTE
- venous thromboembolism
References
- 1.COVID-19 Coronavirus Pandemic. https://www.worldometers.info/coronavirus/. Accessed August 1, 2020. [Google Scholar]
- 2.Cantwell R, Clutton-Brock T, Cooper G, et al. Saving Mothers’ Lives: Reviewing maternal deaths to make motherhood safer: 2006-2008—The Eighth Report of the Confidential Enquiries into Maternal Deaths in the United Kingdom. BJOG 2011;118(suppl 1):1–203 [Published correction appears in BJOG 2015;122(5):e1.]. [DOI] [PubMed] [Google Scholar]
- 3.Wang T, Du Z, Zhu F, et al. Comorbidities and multi-organ injuries in the treatment of COVID-19. Lancet 2020;395(10228):e52. [DOI] [PMC free article] [PubMed] [Google Scholar]
- 4.Mahajan A, Hirsch JA. Novel Coronavirus: What Neuroradiologists as Citizens of the World Need to Know. AJNR Am J Neuroradiol 2020;41(4):552–554. [DOI] [PMC free article] [PubMed] [Google Scholar]
- 5.Hamming I, Timens W, Bulthuis ML, Lely AT, Navis G, van Goor H. Tissue distribution of ACE2 protein, the functional receptor for SARS coronavirus: A first step in understanding SARS pathogenesis. J Pathol 2004;203(2):631–637. [DOI] [PMC free article] [PubMed] [Google Scholar]
- 6.Kooraki S, Hosseiny M, Myers L, Gholamrezanezhad A. Coronavirus (COVID-19) Outbreak: What the Department of Radiology Should Know. J Am Coll Radiol 2020;17(4):447–451. [DOI] [PMC free article] [PubMed] [Google Scholar]
- 7.Zhou P, Yang XL, Wang XG, et al. A pneumonia outbreak associated with a new coronavirus of probable bat origin. Nature 2020;579(7798):270–273. [DOI] [PMC free article] [PubMed] [Google Scholar]
- 8.Wang H, Li X, Li T, et al. The genetic sequence, origin, and diagnosis of SARS-CoV-2. Eur J Clin Microbiol Infect Dis 2020;39(9):1629–1635. [DOI] [PMC free article] [PubMed] [Google Scholar]
- 9.Corman VM, Eckerle I, Bleicker T, et al. Detection of a novel human coronavirus by real-time reverse-transcription polymerase chain reaction. Euro Surveill 2012;17(39):20285. [DOI] [PubMed] [Google Scholar]
- 10.Zou L, Ruan F, Huang M, et al. SARS-CoV-2 Viral Load in Upper Respiratory Specimens of Infected Patients. N Engl J Med 2020;382(12):1177–1179. [DOI] [PMC free article] [PubMed] [Google Scholar]
- 11.Varma R, Gupta J. Tubal ectopic pregnancy. BMJ Clin Evid 2009;2009:1406. [PMC free article] [PubMed] [Google Scholar]
- 12.Bowen V. Geographic Differences in COVID-19 Cases, Deaths, and Incidence: United States, February 12–April 7, 2020. Atlanta, Ga: Centers for Disease Control and Prevention, 2020. [DOI] [PMC free article] [PubMed] [Google Scholar]
- 13.Baggett TP, Keyes H, Sporn N, Gaeta JM. Prevalence of SARS-CoV-2 Infection in Residents of a Large Homeless Shelter in Boston. JAMA 2020;323(21):2191. [DOI] [PMC free article] [PubMed] [Google Scholar]
- 14.Ong SWX, Tan YK, Chia PY, et al. Air, Surface Environmental, and Personal Protective Equipment Contamination by Severe Acute Respiratory Syndrome Coronavirus 2 (SARS-CoV-2) From a Symptomatic Patient. JAMA 2020;323(16):1610. [DOI] [PMC free article] [PubMed] [Google Scholar]
- 15.van Doremalen N, Bushmaker T, Morris DH, et al. Aerosol and Surface Stability of SARS-CoV-2 as Compared with SARS-CoV-1. N Engl J Med 2020;382(16):1564–1567. [DOI] [PMC free article] [PubMed] [Google Scholar]
- 16.Rabenau HF, Cinatl J, Morgenstern B, Bauer G, Preiser W, Doerr HW. Stability and inactivation of SARS coronavirus. Med Microbiol Immunol (Berl) 2005;194(1-2):1–6. [DOI] [PMC free article] [PubMed] [Google Scholar]
- 17.Jutzeler CR, Bourguignon L, Weis CV, et al. Comorbidities, clinical signs and symptoms, laboratory findings, imaging features, treatment strategies, and outcomes in adult and pediatric patients with COVID-19: a systematic review and meta-analysis. Travel Med Infect Dis 2020;37:101825. [DOI] [PMC free article] [PubMed] [Google Scholar]
- 18.Rothe C, Schunk M, Sothmann P, et al. Transmission of 2019-nCoV Infection from an Asymptomatic Contact in Germany. N Engl J Med 2020;382(10):970–971. [DOI] [PMC free article] [PubMed] [Google Scholar]
- 19.Yu P, Zhu J, Zhang Z, Han Y. A Familial Cluster of Infection Associated With the 2019 Novel Coronavirus Indicating Possible Person-to-Person Transmission During the Incubation Period. J Infect Dis 2020;221(11):1757–1761. [DOI] [PMC free article] [PubMed] [Google Scholar]
- 20.Bai Y, Yao L, Wei T, et al. Presumed Asymptomatic Carrier Transmission of COVID-19. JAMA 2020;323(14):1406. [DOI] [PMC free article] [PubMed] [Google Scholar]
- 21.Hu Z, Song C, Xu C, et al. Clinical characteristics of 24 asymptomatic infections with COVID-19 screened among close contacts in Nanjing, China. Sci China Life Sci 2020;63(5):706–711. [DOI] [PMC free article] [PubMed] [Google Scholar]
- 22.Qian G, Yang N, Ma AHY, et al. COVID-19 Transmission Within a Family Cluster by Presymptomatic Carriers in China. Clin Infect Dis 2020;71(15):861–862. [DOI] [PMC free article] [PubMed] [Google Scholar]
- 23.Liu Y, Yan LM, Wan L, et al. Viral dynamics in mild and severe cases of COVID-19. Lancet Infect Dis 2020;20(6):656–657. [DOI] [PMC free article] [PubMed] [Google Scholar]
- 24.Zheng S, Fan J, Yu F, et al. Viral load dynamics and disease severity in patients infected with SARS-CoV-2 in Zhejiang province, China, January-March 2020: retrospective cohort study. BMJ 2020;369:m1443. [DOI] [PMC free article] [PubMed] [Google Scholar]
- 25.Xu K, Chen Y, Yuan J, et al. Factors Associated With Prolonged Viral RNA Shedding in Patients with Coronavirus Disease 2019 (COVID-19). Clin Infect Dis 2020;71(15):799–806. [DOI] [PMC free article] [PubMed] [Google Scholar]
- 26.Letko M, Marzi A, Munster V. Functional assessment of cell entry and receptor usage for SARS-CoV-2 and other lineage B betacoronaviruses. Nat Microbiol 2020;5(4):562–569. [DOI] [PMC free article] [PubMed] [Google Scholar]
- 27.Zou X, Chen K, Zou J, Han P, Hao J, Han Z. Single-cell RNA-seq data analysis on the receptor ACE2 expression reveals the potential risk of different human organs vulnerable to 2019-nCoV infection. Front Med 2020;14(2):185–192. [DOI] [PMC free article] [PubMed] [Google Scholar]
- 28.Ma D, Chen CB, Jhanji V, et al. Expression of SARS-CoV-2 receptor ACE2 and TMPRSS2 in human primary conjunctival and pterygium cell lines and in mouse cornea. Eye (Lond) 2020;34(7):1212–1219. [DOI] [PMC free article] [PubMed] [Google Scholar]
- 29.Shang J, Ye G, Shi K, et al. Structural basis of receptor recognition by SARS-CoV-2. Nature 2020;581(7807):221–224. [DOI] [PMC free article] [PubMed] [Google Scholar]
- 30.Hirano T, Murakami M. COVID-19: A New Virus, but a Familiar Receptor and Cytokine Release Syndrome. Immunity 2020;52(5):731–733. [DOI] [PMC free article] [PubMed] [Google Scholar]
- 31.Wölfel R, Corman VM, Guggemos W, et al. Virological assessment of hospitalized patients with COVID-2019. Nature 2020;581(7809):465–469. [DOI] [PubMed] [Google Scholar]
- 32.Shen C, Wang Z, Zhao F, et al. Treatment of 5 Critically Ill Patients With COVID-19 With Convalescent Plasma. JAMA 2020;323(16):1582. [DOI] [PMC free article] [PubMed] [Google Scholar]
- 33.Li Q, Guan X, Wu P, et al. Early Transmission Dynamics in Wuhan, China, of Novel Coronavirus-Infected Pneumonia. N Engl J Med 2020;382(13):1199–1207. [DOI] [PMC free article] [PubMed] [Google Scholar]
- 34.Guan WJ, Ni ZY, Hu Y, et al. Clinical Characteristics of Coronavirus Disease 2019 in China. N Engl J Med 2020;382(18):1708–1720. [DOI] [PMC free article] [PubMed] [Google Scholar]
- 35.Chan JF, Yuan S, Kok KH, et al. A familial cluster of pneumonia associated with the 2019 novel coronavirus indicating person-to-person transmission: a study of a family cluster. Lancet 2020;395(10223):514–523. [DOI] [PMC free article] [PubMed] [Google Scholar]
- 36.Oran DP, Topol EJ. Prevalence of Asymptomatic SARS-CoV-2 Infection: A Narrative Review. Ann Intern Med 2020. doi: 10.7326/M20-3012. Published online June 3, 2020. Accessed June 1, 2020. [DOI] [PMC free article] [PubMed] [Google Scholar]
- 37.He J, Guo Y, Mao R, Zhang J. Proportion of asymptomatic coronavirus disease 2019: A systematic review and meta-analysis. J Med Virol 2020. doi: 10.1002/jmv.26326. Published online July 21, 2020. Accessed July 1, 2020. [DOI] [PMC free article] [PubMed] [Google Scholar]
- 38.Ding Y, Yan H, Guo W. Clinical Characteristics of Children With COVID-19: A Meta-Analysis. Front Pediatr 2020;8:431. [DOI] [PMC free article] [PubMed] [Google Scholar]
- 39.Bajema KL, Oster AM, McGovern OL, et al. Persons Evaluated for 2019 Novel Coronavirus: United States, January 2020. MMWR Morb Mortal Wkly Rep 2020;69(6):166–170. [DOI] [PMC free article] [PubMed] [Google Scholar]
- 40.Huang C, Wang Y, Li X, et al. Clinical features of patients infected with 2019 novel coronavirus in Wuhan, China. Lancet 2020;395(10223):497–506 [Published correction appears in Lancet 2020;395(10223):496.]. [DOI] [PMC free article] [PubMed] [Google Scholar]
- 41.Chen N, Zhou M, Dong X, et al. Epidemiological and clinical characteristics of 99 cases of 2019 novel coronavirus pneumonia in Wuhan, China: a descriptive study. Lancet 2020;395(10223):507–513. [DOI] [PMC free article] [PubMed] [Google Scholar]
- 42.Liu K, Fang YY, Deng Y, et al. Clinical characteristics of novel coronavirus cases in tertiary hospitals in Hubei Province. Chin Med J (Engl) 2020;133(9):1025–1031. [DOI] [PMC free article] [PubMed] [Google Scholar]
- 43.Yang X, Yu Y, Xu J, et al. Clinical course and outcomes of critically ill patients with SARS-CoV-2 pneumonia in Wuhan, China: a single-centered, retrospective, observational study. Lancet Respir Med 2020;8(5):475–481 [Published correction appears in Lancet Respir Med 2020;8(4):e26.]. [DOI] [PMC free article] [PubMed] [Google Scholar]
- 44.Wu Z, McGoogan JM. Characteristics of and Important Lessons From the Coronavirus Disease 2019 (COVID-19) Outbreak in China: Summary of a Report of 72 314 Cases From the Chinese Center for Disease Control and Prevention. JAMA 2020;323(13):1239. [DOI] [PubMed] [Google Scholar]
- 45.Goyal P, Choi JJ, Pinheiro LC, et al. Clinical Characteristics of Covid-19 in New York City. N Engl J Med 2020;382(24):2372–2374. [DOI] [PMC free article] [PubMed] [Google Scholar]
- 46.Kolifarhood G, Aghaali M, Mozafar Saadati H, et al. Epidemiological and Clinical Aspects of COVID-19; a Narrative Review. Arch Acad Emerg Med 2020;8(1):e41. [PMC free article] [PubMed] [Google Scholar]
- 47.Xiao AT, Tong YX, Zhang S. Profile of RT-PCR for SARS-CoV-2: a preliminary study from 56 COVID-19 patients. Clin Infect Dis 2020. doi: 10.1093/cid/ciaa460. Published online April 19, 2020. Accessed June 1, 2020. [DOI] [PMC free article] [PubMed] [Google Scholar]
- 48.Illinois Department of Public Health . COVID-19 Statistics. https://www.dph.illinois.gov/covid19/covid19-statistics. Accessed April 9, 2020. [Google Scholar]
- 49.Mehra MR, Desai SS, Kuy S, Henry TD, Patel AN. Cardiovascular Disease, Drug Therapy, and Mortality in Covid-19. N Engl J Med 2020;382(25):e102 [Published retraction appears in N Engl J Med 2020;382(26):2582.]. [DOI] [PMC free article] [PubMed] [Google Scholar] [Retracted]
- 50.Grillet F, Behr J, Calame P, Aubry S, Delabrousse E. Acute PE Associated with COVID-19 Pneumonia Detected with Pulmonary CT Angiography. Radiology 2020;296(3):E186–E188. [DOI] [PMC free article] [PubMed] [Google Scholar]
- 51.Danzi GB, Loffi M, Galeazzi G, Gherbesi E. Acute PE and COVID-19 pneumonia: a random association? Eur Heart J 2020;41(19):1858. [DOI] [PMC free article] [PubMed] [Google Scholar]
- 52.Zhang Y, Xiao M, Zhang S, et al. Coagulopathy and Antiphospholipid Antibodies in Patients with Covid-19. N Engl J Med 2020;382(17):e38. [DOI] [PMC free article] [PubMed] [Google Scholar]
- 53.Mao L, Jin H, Wang M, et al. Neurologic Manifestations of Hospitalized Patients With Coronavirus Disease 2019 in Wuhan, China. JAMA Neurol 2020;77(6):683. [DOI] [PMC free article] [PubMed] [Google Scholar]
- 54.Klok FA, Kruip M, van der Meer NJM, et al. Incidence of thrombotic complications in critically ill ICU patients with COVID-19. Thromb Res 2020;191:145–147. [DOI] [PMC free article] [PubMed] [Google Scholar]
- 55.Oxley TJ, Mocco J, Majidi S, et al. Large-Vessel Stroke as a Presenting Feature of Covid-19 in the Young. N Engl J Med 2020;382(20):e60. [DOI] [PMC free article] [PubMed] [Google Scholar]
- 56.Mehta P, McAuley DF, Brown M, et al. COVID-19: consider cytokine storm syndromes and immunosuppression. Lancet 2020;395(10229):1033–1034. [DOI] [PMC free article] [PubMed] [Google Scholar]
- 57.Olson MC, Lubner MG, Menias CO, et al. RadioGraphics Update: Venous Thrombosis and Hypercoagulability in the Abdomen and Pelvis—Findings in COVID-19. RadioGraphics 2020. doi: 10.1148/rg.2020200119. Published online July 10, 2020. Accessed August 1, 2020. [DOI] [PMC free article] [PubMed] [Google Scholar]
- 58.Myers LC, Parodi SM, Escobar GJ, Liu VX. Characteristics of Hospitalized Adults With COVID-19 in an Integrated Health Care System in California. JAMA 2020;323(21):2195. [DOI] [PMC free article] [PubMed] [Google Scholar]
- 59.Liang W, Guan W, Chen R, et al. Cancer patients in SARS-CoV-2 infection: a nationwide analysis in China. Lancet Oncol 2020;21(3):335–337. [DOI] [PMC free article] [PubMed] [Google Scholar]
- 60.Zhou F, Yu T, Du R, et al. Clinical course and risk factors for mortality of adult inpatients with COVID-19 in Wuhan, China: a retrospective cohort study. Lancet 2020;395(10229):1054–1062 [Published correction appears in Lancet 2020;395(10229):1038.]. [DOI] [PMC free article] [PubMed] [Google Scholar]
- 61.Lighter J, Phillips M, Hochman S, et al. Obesity in patients younger than 60 years is a risk factor for Covid-19 hospital admission. Clin Infect Dis 2020;71(15):896–897. [DOI] [PMC free article] [PubMed] [Google Scholar]
- 62.Wang D, Hu B, Hu C, et al. Clinical Characteristics of 138 Hospitalized Patients With 2019 Novel Coronavirus-Infected Pneumonia in Wuhan, China. JAMA 2020. doi: 10.1001/jama.2020.1585. Published online February 7, 2020. Accessed May 1, 2020. [DOI] [PMC free article] [PubMed] [Google Scholar]
- 63.Zhang L, Yan X, Fan Q, et al. D-dimer levels on admission to predict in-hospital mortality in patients with Covid-19. J Thromb Haemost 2020;18(6):1324–1329. [DOI] [PMC free article] [PubMed] [Google Scholar]
- 64.Wong HYF, Lam HYS, Fong AH, et al. Frequency and Distribution of Chest Radiographic Findings in Patients Positive for COVID-19. Radiology 2020;296(2):E72–E78. [DOI] [PMC free article] [PubMed] [Google Scholar]
- 65.Liu Q, Wang RS, Qu GQ, et al. Gross examination report of a COVID-19 death autopsy. Fa Yi Xue Za Zhi 2020;36(1):21–23. [DOI] [PubMed] [Google Scholar]
- 66.Mossa-Basha M, Medverd J, Linnau K, et al. Policies and Guidelines for COVID-19 Preparedness: Experiences from the University of Washington. Radiology: 2020. doi: 10.1148/radiol.2020201326. Published online April 8, 2020. Accessed May 1, 2020. [DOI] [PubMed] [Google Scholar]
- 67.Chung M, Bernheim A, Mei X, et al. CT Imaging Features of 2019 Novel Coronavirus (2019-nCoV). Radiology 2020;295(1):202–207. [DOI] [PMC free article] [PubMed] [Google Scholar]
- 68.Zhou S, Wang Y, Zhu T, Xia L. CT Features of Coronavirus Disease 2019 (COVID-19) Pneumonia in 62 Patients in Wuhan, China. AJR Am J Roentgenol 2020;214(6):1287–1294. [DOI] [PubMed] [Google Scholar]
- 69.Bernheim A, Mei X, Huang M, et al. Chest CT Findings in Coronavirus Disease-19 (COVID-19): Relationship to Duration of Infection. Radiology 2020;295(3):200463. [DOI] [PMC free article] [PubMed] [Google Scholar]
- 70.Kanne JP, Little BP, Chung JH, Elicker BM, Ketai LH. Essentials for Radiologists on COVID-19: An Update—Radiology Scientific Expert Panel. Radiology 2020;296(2):E113–E114. [DOI] [PMC free article] [PubMed] [Google Scholar]
- 71.Jacobi A, Chung M, Bernheim A, Eber C. Portable chest X-ray in coronavirus disease-19 (COVID-19): A pictorial review. Clin Imaging 2020;64:35–42. [DOI] [PMC free article] [PubMed] [Google Scholar]
- 72.Salehi S, Abedi A, Balakrishnan S, Gholamrezanezhad A. Coronavirus Disease 2019 (COVID-19): A Systematic Review of Imaging Findings in 919 Patients. AJR Am J Roentgenol 2020;215(1):87–93. [DOI] [PubMed] [Google Scholar]
- 73.Toussie D, Voutsinas N, Finkelstein M, et al. Clinical and Chest Radiography Features Determine Patient Outcomes In Young and Middle Age Adults with COVID-19. Radiology 2020. doi: 10.1148/radiol.2020201754. Published online May 14, 2020. Accessed May 1, 2020. [DOI] [PMC free article] [PubMed] [Google Scholar]
- 74.Li MD, Arun NT, Gidwani M, et al. Automated assessment of COVID-19 pulmonary disease severity on chest radiographs using convolutional Siamese neural networks. medRxiv [preprint] 10.1101/2020.05.20.20108159. Posted May 26, 2020. Accessed May 1, 2020. [DOI] [PMC free article] [PubMed] [Google Scholar]
- 75.American College of Radiology. ACR Recommendations for the use of Chest Radiography and Computed Tomography (CT) for Suspected COVID-19 Infection. https://www.acr.org/Advocacy-and-Economics/ACR-Position-Statements/Recommendations-for-Chest-Radiography-and-CT-for-Suspected-COVID19-Infection. Updated March 22, 2020. Accessed March 12, 2020. [Google Scholar]
- 76.Stempniak M. CT should not be used as first-line tool against coronavirus, ACR warns following pandemic declaration. Radiology Business. https://www.radiologybusiness.com/topics/care-delivery/ct-scan-coronavirus-chest-x-ray-radiology-covid-19. Published March 11, 2020. Accessed March 11, 2020. [Google Scholar]
- 77.Bai HX, Hsieh B, Xiong Z, et al. Performance of Radiologists in Differentiating COVID-19 from Non-COVID-19 Viral Pneumonia at Chest CT. Radiology 2020;296(2):E46–E54. [DOI] [PMC free article] [PubMed] [Google Scholar]
- 78.Simpson S, Kay FU, Abbara S, et al. Radiological Society of North America Expert Consensus Statement on Reporting Chest CT Findings Related to COVID-19: Endorsed by the Society of Thoracic Radiology, the American College of Radiology, and RSNA—Secondary Publication. J Thorac Imaging 2020;35(4):219–227. [DOI] [PMC free article] [PubMed] [Google Scholar]
- 79.Soldati G, Smargiassi A, Inchingolo R, et al. Is There a Role for Lung Ultrasound During the COVID-19 Pandemic? J Ultrasound Med 2020;39(7):1459–1462. [DOI] [PMC free article] [PubMed] [Google Scholar]
- 80.Volpicelli G, Gargani L. Sonographic signs and patterns of COVID-19 pneumonia. Ultrasound J 2020;12(1):22. [DOI] [PMC free article] [PubMed] [Google Scholar]
- 81.Volpicelli G, Mussa A, Garofalo G, et al. Bedside lung ultrasound in the assessment of alveolar-interstitial syndrome. Am J Emerg Med 2006;24(6):689–696. [DOI] [PubMed] [Google Scholar]
- 82.Efremov SM, Kuzkov VV, Fot EV, et al. Lung Ultrasonography and Cardiac Surgery: A Narrative Review. J Cardiothorac Vasc Anesth 2020. doi: 10.1053/j.jvca.2020.01.032. Published online January 23, 2020. Accessed May 1, 2020. [DOI] [PubMed] [Google Scholar]
- 83.Kooraki S, Hosseiny M, Myers L, Gholamrezanezhad A. Re: Ventilation-Perfusion Scans During the Coronavirus Disease 2019 (COVID-19) Outbreak. J Am Coll Radiol 2020;17(6):698–699. [DOI] [PMC free article] [PubMed] [Google Scholar]
- 84.Som A, Lang M, Little B. Pulmonary Vascular Pathology in Covid-19. N Engl J Med 2020. doi: 10.1056/NEJMc2022068. Published online July 17, 2020. Accessed August 1, 2020. [DOI] [PubMed] [Google Scholar]
- 85.Prokop M, van Everdingen W, van Rees Vellinga T, et al. CO-RADS: A Categorical CT Assessment Scheme for Patients Suspected of Having COVID-19-Definition and Evaluation. Radiology 2020;296(2):E97–E104. [DOI] [PMC free article] [PubMed] [Google Scholar]
- 86.Hope MD, Raptis CA, Shah A, Hammer MM, Henry TS; six signatories . A role for CT in COVID-19? What data really tell us so far. Lancet 2020;395(10231):1189–1190. [DOI] [PMC free article] [PubMed] [Google Scholar]
- 87.Rubin GD, Ryerson CJ, Haramati LB, et al. The Role of Chest Imaging in Patient Management During the COVID-19 Pandemic: A Multinational Consensus Statement From the Fleischner Society. Chest 2020;158(1):106–116. [DOI] [PMC free article] [PubMed] [Google Scholar]
- 88.Pan F, Ye T, Sun P, et al. Time Course of Lung Changes at Chest CT during Recovery from Coronavirus Disease 2019 (COVID-19). Radiology 2020;295(3):715–721. [DOI] [PMC free article] [PubMed] [Google Scholar]
- 89.Wang Y, Dong C, Hu Y, et al. Temporal Changes of CT Findings in 90 Patients with COVID-19 Pneumonia: A Longitudinal Study. Radiology 2020;296(2):E55–E64. [DOI] [PMC free article] [PubMed] [Google Scholar]
- 90.Song F, Shi N, Shan F, et al. Emerging 2019 Novel Coronavirus (2019-nCoV) Pneumonia. Radiology 2020;295(1):210–217. [DOI] [PMC free article] [PubMed] [Google Scholar]
- 91.Georgiadou SP, Sipsas NV, Marom EM, Kontoyiannis DP. The diagnostic value of halo and reversed halo signs for invasive mold infections in compromised hosts. Clin Infect Dis 2011;52(9):1144–1155. [DOI] [PMC free article] [PubMed] [Google Scholar]
- 92.Ye Z, Zhang Y, Wang Y, Huang Z, Song B. Chest CT manifestations of new coronavirus disease 2019 (COVID-19): a pictorial review. Eur Radiol 2020;30(8):4381–4389. [DOI] [PMC free article] [PubMed] [Google Scholar]
- 93.Li M. Chest CT features and their role in COVID-19. Radiol Infect Dis 2020;7(2):51–54. [DOI] [PMC free article] [PubMed] [Google Scholar]
- 94.Hosseiny M, Kooraki S, Gholamrezanezhad A, Reddy S, Myers L. Radiology Perspective of Coronavirus Disease 2019 (COVID-19): Lessons From Severe Acute Respiratory Syndrome and Middle East Respiratory Syndrome. AJR Am J Roentgenol 2020;214(5):1078–1082. [DOI] [PubMed] [Google Scholar]
- 95.Li Y, Xia L. Coronavirus Disease 2019 (COVID-19): Role of Chest CT in Diagnosis and Management. AJR Am J Roentgenol 2020;214(6):1280–1286. [DOI] [PubMed] [Google Scholar]
- 96.Zhao W, Zhong Z, Xie X, Yu Q, Liu J. Relation Between Chest CT Findings and Clinical Conditions of Coronavirus Disease (COVID-19) Pneumonia: A Multicenter Study. AJR Am J Roentgenol 2020;214(5):1072–1077. [DOI] [PubMed] [Google Scholar]
- 97.Grosse C, Grosse A. CT findings in diseases associated with pulmonary hypertension: a current review. RadioGraphics 2010;30(7):1753–1777. [DOI] [PubMed] [Google Scholar]
- 98.Gattinoni L, Coppola S, Cressoni M, Busana M, Rossi S, Chiumello D. COVID-19 Does Not Lead to a “Typical” Acute Respiratory Distress Syndrome. Am J Respir Crit Care Med 2020;201(10):1299–1300. [DOI] [PMC free article] [PubMed] [Google Scholar]
- 99.Stefanidis K, Moser J, Vlahos I. Imaging of Diffuse Lung Disease in the Intensive Care Unit Patient. Radiol Clin North Am 2020;58(1):119–131. [DOI] [PubMed] [Google Scholar]
- 100.McGuinness G, Zhan C, Rosenberg N, et al. High Incidence of Barotrauma in Patients with COVID-19 Infection on Invasive Mechanical Ventilation. Radiology doi: 10.1148/radiol.2020202352. Published online July 1, 2020. Accessed July 1, 2020. [DOI] [PMC free article] [PubMed]
- 101.Léonard-Lorant I, Delabranche X, Séverac F, et al. Acute PE in Patients with COVID-19 at CT Angiography and Relationship to d-Dimer Levels. Radiology 2020;296(3):E189–E191. [DOI] [PMC free article] [PubMed] [Google Scholar]
- 102.Poyiadji N, Cormier P, Patel PY, et al. Acute PE and COVID-19. Radiology doi: 10.1148/radiol.2020201955. Published online May 14, 2020. Accessed June 1, 2020.
- 103.Oudkerk M, Büller HR, Kuijpers D, et al. Diagnosis, Prevention, and Treatment of Thromboembolic Complications in COVID-19: Report of the National Institute for Public Health of the Netherlands. Radiology: doi: 10.1148/radiol.2020201629. Published online April 23, 2020. Accessed June 1, 2020. [DOI] [PMC free article] [PubMed] [Google Scholar]
- 104.Bikdeli B, Madhavan MV, Jimenez D, et al. COVID-19 and Thrombotic or Thromboembolic Disease: Implications for Prevention, Antithrombotic Therapy, and Follow-Up: JACC State-of-the-Art Review. J Am Coll Cardiol 2020;75(23):2950–2973. [DOI] [PMC free article] [PubMed] [Google Scholar]
- 105.Olson MC, Lubner MG, Menias CO, et al. Venous Thrombosis and Hypercoagulability in the Abdomen and Pelvis: Causes and Imaging Findings. RadioGraphics 2020;40(3):875–894. [DOI] [PubMed] [Google Scholar]
- 106.Tang N, Li D, Wang X, Sun Z. Abnormal coagulation parameters are associated with poor prognosis in patients with novel coronavirus pneumonia. J Thromb Haemost 2020;18(4):844–847. [DOI] [PMC free article] [PubMed] [Google Scholar]
- 107.Ranucci M, Ballotta A, Di Dedda U, et al. The procoagulant pattern of patients with COVID-19 acute respiratory distress syndrome. J Thromb Haemost 2020;18(7):1747–1751. [DOI] [PMC free article] [PubMed] [Google Scholar]
- 108.Panigada M, Bottino N, Tagliabue P, et al. Hypercoagulability of COVID-19 patients in intensive care unit: A report of thromboelastography findings and other parameters of hemostasis. J Thromb Haemost 2020;18(7):1738–1742. [DOI] [PMC free article] [PubMed] [Google Scholar]
- 109.Connors JM, Levy JH. Thromboinflammation and the hypercoagulability of COVID-19. J Thromb Haemost 2020;18(7):1559–1561. [DOI] [PMC free article] [PubMed] [Google Scholar]
- 110.Iba T, Levy JH, Raj A, Warkentin TE. Advance in the Management of Sepsis-Induced Coagulopathy and Disseminated Intravascular Coagulation. J Clin Med 2019;8(5):E728. [DOI] [PMC free article] [PubMed] [Google Scholar]
- 111.Yin S, Huang M, Li D, Tang N. Difference of coagulation features between severe pneumonia induced by SARS-CoV2 and non-SARS-CoV2. J Thromb Thrombolysis doi: 10.1007/s11239-020-02105-8. Published online April 3, 2020. Accessed May 1, 2020. [DOI] [PMC free article] [PubMed]
- 112.Magro C, Mulvey JJ, Berlin D, et al. Complement associated microvascular injury and thrombosis in the pathogenesis of severe COVID-19 infection: A report of five cases. Transl Res 2020;220:1–13. [DOI] [PMC free article] [PubMed] [Google Scholar]
- 113.Driggin E, Madhavan MV, Bikdeli B, et al. Cardiovascular Considerations for Patients, Health Care Workers, and Health Systems During the COVID-19 Pandemic. J Am Coll Cardiol 2020;75(18):2352–2371. [DOI] [PMC free article] [PubMed] [Google Scholar]
- 114.Song I, Yi JG, Park JH, Ko SM. Indirect CT Venography at 80 kVp with Sinogram-Affirmed Iterative Reconstruction Compared to 120 kVp with Filtered Back Projection: Assessment of Image Quality and Radiation Dose. PLoS One 2016;11(9):e0163416. [DOI] [PMC free article] [PubMed] [Google Scholar]
- 115.Shi WY, Wang LW, Wang SJ, Yin XD, Gu JP. Combined Direct and Indirect CT Venography (Combined CTV) in Detecting Lower Extremity Deep Vein Thrombosis. Medicine (Baltimore) 2016;95(11):e3010. [DOI] [PMC free article] [PubMed] [Google Scholar]
- 116.Klok FA, Kruip MJHA, van der Meer NJM, et al. Confirmation of the high cumulative incidence of thrombotic complications in critically ill ICU patients with COVID-19: An updated analysis. Thromb Res 2020;191:148–150. [DOI] [PMC free article] [PubMed] [Google Scholar]
- 117.Cui S, Chen S, Li X, Liu S, Wang F. Prevalence of venous thromboembolism in patients with severe novel coronavirus pneumonia. J Thromb Haemost 2020;18(6):1421–1424. [DOI] [PMC free article] [PubMed] [Google Scholar]
- 118.Middeldorp S, Coppens M, van Haaps TF, et al. Incidence of venous thromboembolism in hospitalized patients with COVID-19. J Thromb Haemost 2020;18(8):1995–2002. [DOI] [PMC free article] [PubMed] [Google Scholar]
- 119.Lippi G, Favaloro EJ. D-dimer is Associated with Severity of Coronavirus Disease 2019: A Pooled Analysis. Thromb Haemost 2020;120(5):876–878. [DOI] [PMC free article] [PubMed] [Google Scholar]
- 120.Suwanwongse K, Shabarek N. Rhabdomyolysis as a Presentation of 2019 Novel Coronavirus Disease. Cureus 2020;12(4):e7561. [DOI] [PMC free article] [PubMed] [Google Scholar]
- 121.Zhou B, She J, Wang Y, Ma X. Venous thrombosis and arteriosclerosis obliterans of lower extremities in a very severe patient with 2019 novel coronavirus disease: a case report. J Thromb Thrombolysis 2020;50(1):229–232. [DOI] [PMC free article] [PubMed] [Google Scholar]
- 122.Kashi M, Jacquin A, Dakhil B, et al. Severe arterial thrombosis associated with Covid-19 infection. Thromb Res. 2020;192:P75–77. [DOI] [PMC free article] [PubMed] [Google Scholar]


