

Summary
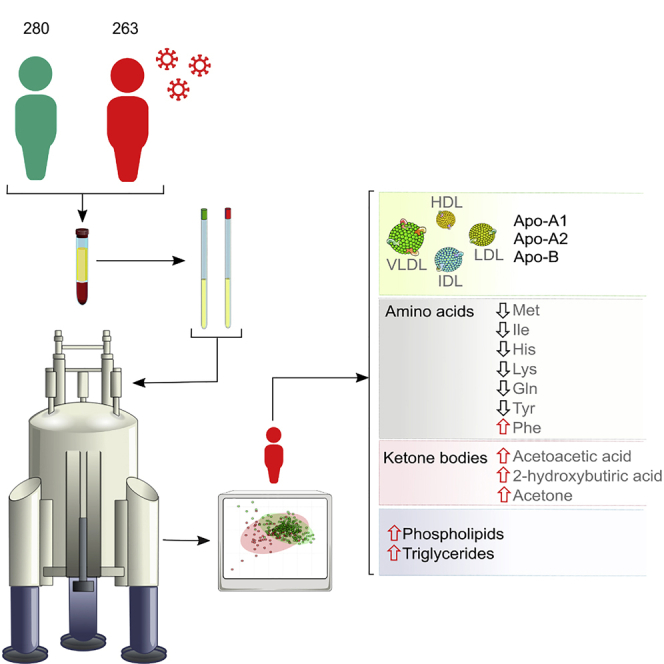
COVID-19 is a systemic infection that exerts significant impact on the metabolism. Yet, there is little information on how SARS-CoV-2 affects metabolism. Using NMR spectroscopy, we measured the metabolomic and lipidomic serum profile from 263 (training cohort) + 135 (validation cohort) symptomatic patients hospitalized after positive PCR testing for SARS-CoV-2 infection. We also established the profiles of 280 persons collected before the coronavirus pandemic started. Principal-component analysis discriminated both cohorts, highlighting the impact that the infection has on overall metabolism. The lipidomic analysis unraveled a pathogenic redistribution of the lipoprotein particle size and composition to increase the atherosclerotic risk. In turn, metabolomic analysis reveals abnormally high levels of ketone bodies (acetoacetic acid, 3-hydroxybutyric acid, and acetone) and 2-hydroxybutyric acid, a readout of hepatic glutathione synthesis and marker of oxidative stress. Our results are consistent with a model in which SARS-CoV-2 infection induces liver damage associated with dyslipidemia and oxidative stress.
Subject Areas: Human Metabolism, Virology, Metabolomics
Graphical Abstract
Highlights
-
•
Metabolomic and lipidomic serum profile of 398 COVID-19 acute-phase patients
-
•
Severe dyslipidemia that affects lipoprotein particle size and distribution
-
•
Central metabolism dysregulation and ketone bodies accumulation
-
•
Succinic upregulation resembles the pseudohypoxic environment in cancer
Human Metabolism; Virology; Metabolomics
Introduction
SARS-CoV-2 is a highly transmissible virus described for the first time in Wuhan (Hubei Province, China) in December 2019 (Zhu et al., 2020). Yet, there are evidences showing that SARS-CoV-2 emerged in Europe earlier than thought, after the analysis of wastewater samples collected in Italy by December 2019 (La Rosa et al., 2020) The virus shares sequence identity with other related coronaviruses such as SARS-CoV and MERS-CoV (Zhou et al., 2020b). Upon viral infection, an incubation period ranging from 1 to 14 days (Lauer et al., 2020) results in the onset of COVID-19 disease (Munster et al., 2020). Unfortunately, this mechanism is very efficient and SARS-CoV-2 has rapidly spread worldwide, resulting in the ongoing coronavirus pandemic. According to the World Health Organization, more than 26 million cases have been reported worldwide, having thus far resulted in about 864.000 deaths (WHO, 2020).
There are a plethora of symptoms associated to COVID-19 including fever, non-productive cough, tiredness, sore throat, nasal congestion, diarrhea, conjunctivitis, headache, dyspnea, nausea/vomiting, and in some cases loss of taste, loss of smell, or skin problems (Song et al., 2020; Tammaro et al., 2020; Wei et al., 2020). In many cases the prognosis is favorable, but approximately 20% COVID-19 patients require intensive care unit admission due to severe acute respiratory syndrome, which may be accompanied by multiorgan failure (Richardson et al., 2020). Such patients also may develop neurological problems (Niazkar et al., 2020) or hematological abnormalities (Liu et al., 2020) and suffer venous thromboembolism (Al-Ani et al., 2020). The mortality rate is very high (ca. 17%) among the elderly or people with chronic diseases (Zhou et al., 2020a).
The disease etiology is progressively being unraveled, but the underlying molecular mechanisms and the associated metabolic alterations remain much more poorly understood. To the best of our knowledge, there are only three public studies that analyzed the metabolism of patients with COVID-19 (Shen et al., 2020; Thomas et al., 2020; Wu et al., 2020). The observed molecular changes in the sera of COVID-19 patients implied significant metabolic suppression as well as a dysregulation of the macrophage function, platelet degranulation, and the complement system pathway among others. These results are in line with the mechanism observed for other viral infections like Ebola (Kyle et al., 2019) and highlight the systemic characteristic of the disease that may affect further organs such as the liver. Yet, these conclusions were mostly obtained from proteomics data and would demand complementary metabolomic analyses of much larger cohorts.
The aim of this study was to investigate whether there is a specific metabolic and/or lipoprotein profile associated with patients diagnosed with COVID-19 by a positive RT-PCR testing and showing clear manifestations of the disease. To that end, we have used NMR-based metabolomics that is particularly well suited for the characterization of complex solutions like serum and is capable at the same time to quantify and identify both, known and unknown metabolites. Mass spectrometry is also widely used for metabolomics studies, because of its extreme sensitivity and ability to analyze a massive number of metabolites using very small sample amounts. That said, NMR is fully quantitative and can also classify and quantify lipoproteins in a robust and reliable way, with higher resolution than ultracentrifugation (Chapman et al., 1981). We have analyzed a cohort with 263 COVID-19-positive serum samples obtained from patients hospitalized after positive PCR testing for SARS-CoV-2 infection (information about the patients is shown in Tables S2 and S3). As a control, we have analyzed the sera from 280 persons collected during 2018–2019, well before the coronavirus pandemic started. Our results show that COVID-19 patients present a severe metabolic and lipoprotein dysregulation, compatible with induced dyslipidemia and oxidative stress among other metabolic factors.
Results
SARS-CoV-2 Infection Significantly Rewires the Metabolome and the Lipoprotein Composition
To investigate the metabolic and lipidomic changes induced by SARS-CoV-2 infection, we analyzed a cohort of 263 COVID-19 patients by NMR spectroscopy (COVID). These individuals presented compatible symptomatology that was confirmed by PCR testing upon admission to the hospital. A subset of 43 samples from the COVID cohort was tested for antibodies, where 21 (48%) were positive for IgG only and 11 (26%) for IgG and IgM. This sub-cohort well represents the COVID cohort in terms of gender and age. Hence, this set of hospitalized individuals represents well the acute and severe symptomatic phases of the disease. As a control, we employed a cohort of sera from 280 individuals of the working population from the same geographical region, but collected in pre-COVID times (2018–2019) during a routine medical check-up and with no other exclusion criteria than having suffered a serious illness like cancer or stroke within the three months preceding the sample collection (preCOVID).
The NMR Carr-Purcell-Meiboom-Gill spectrum (Embade et al., 2016) filters out the lipoprotein fraction, rendering the metabolic profiling of the serum. Already a visual inspection of such spectra revealed substantial differences, a notion that was further substantiated by an unsupervised principal-component analysis (PCA) of the 40 metabolites that can be routinely quantified from this type of spectrum (Figures 2A and 2B). In turn, a regular 1H NMR spectrum of serum also reveals the complex lipoprotein profile (Jiménez et al., 2018), as shown in Figure 1 for representative examples of the COVID and preCOVID cohorts, where 21 main lipoprotein fractions, 74 lipoprotein subfractions, and other important serum parameters can nowadays be identified and quantified by spectra deconvolution. Such set includes lipoproteins and their respective subfractions (Table S5). The NMR spectrum also allows a detailed characterization of the different lipoprotein subclasses, with the quantification of the total and free cholesterol, phospholipids, triglycerides, Apo-A1, Apo-A2, and Apo-B. PCA shows a reasonable separation between COVID and preCOVID cohorts (Figures 2C and 2D), suggesting that SARS-CoV-2 infection may also inflict changes in the blood lipoprotein composition.
Figure 2.

Summary of Multivariate Unsupervised (PCA) and Supervised (OPLS-DA) Analyses
(A and C) Score plots representing first two principal components from PCA of serum metabolites (A) and lipoprotein subclasses (C), colored by cohort. Each axis indicates the percentage of total variability explained by the component.
(B and D) Loading plots from serum metabolites PCA (B) and lipoprotein subclasses PCA (D). They show the top 10 variables with the highest contribution to the first two PCA components. Their direction indicates how their weight is distributed in both components, and the color is the percentage of contribution.
(E) Score plot from OPLS-DA between COVID (green) and preCOVID (red) cohorts, using the full list of metabolites and lipoprotein subclasses. The plot shows the main component versus the first orthogonal component.
(F) Loading plot from the previous OPLS-DA. Each type of variable (metabolites or the lipoprotein subclasses) is represented with different colors. For each type, ellipses surround the area that includes 95% of their members. For each direction, the four variables that most contribute to the component are labeled.
Figure 1.

Representative Region of 1H NMR Spectra of COVID and preCOVID Sera
(A) Metabolite identification in sera spectrum from COVID positive and preCOVID. For instance, notice the increased amount of ketone bodies (3-hydroxybutiric acid, acetoacetic acid, acetone) in the COVID-positive spectrum when compared with the preCOVID one.
(B) Overlapped nuclear Overhauser effect spectra from COVID-positive and preCOVID serum samples.
These differences observed by unsupervised analysis were also confirmed by orthogonal partial least-squares discriminant analysis (OPLS-DA) for the full set of serum metabolites and lipoprotein subclasses (Figure 2E), using one predictive and one orthogonal component. Not surprisingly, OPLS-DA showed a high degree of separation between groups, also with very good predictability (AUROCvalidation = 0.977) (Table 1) and statistical significance (p value < 0.01) (Figures S4 and S5). Remarkably, even when metabolites and all the different lipid fractions were included as independent classes in an OPLS-DA, a reasonable degree of clustering was achieved (Figure 2F).
Table 1.
Performance Metrics from OPLS-DA through a Repeated Double Cross-Validation Process
| Metric | Training |
Validation |
||
|---|---|---|---|---|
| Value | p Value | Value | p Value | |
| AUROC | 0.980 | <0.01 | 0.977 | <0.01 |
| Accuracy | 0.928 | <0.01 | 0.923 | <0.01 |
| Sensitivity | 0.874 | <0.01 | 0.867 | <0.01 |
| Specificity | 0.978 | <0.01 | 0.975 | <0.01 |
Value columns are the mean value; p value columns were obtained from permutation tests.
As COVID-19 severity increases particularly for elderly people, a potential caveat is the substantial age difference between the COVID and the preCOVID cohorts. Yet, two sub-cohorts of 112 samples each, properly balanced for gender and age distribution, showed the same qualitative separation for metabolites and lipoproteins in both, PCA and OPLS-DA (Figures S1 and S5, Table S4). These results rule out a bias due to improper randomization of the control group.
Another concern is that, during the peak of the pandemic, collecting protocols could not be completely abided, what could affect the results. However, the analysis of a second patient cohort from a different hospital yielded the same results (Figure S2), which strongly suggests that technical handling aspects may not decisively affect the outcome. Remarkably, the added cohort includes almost 400 patient samples, which, to our knowledge, is the largest metabolomic analysis reported in COVID-19.
The pre-COVID cohort belongs to a collection of samples from healthy population that were collected in a period of 2 years before COVID-19 outbreak. To evaluate the effect of storage of the samples, we performed a PCA of a subset of the first samples collected (in 2016), compared with the last samples to be frozen (in 2018). As shown in Figure S3, the two groups cannot be separated, indicating that the freezing period does not significantly bias the cohort.
Lipoprotein Profiling Unravels Increased Atherogenic Risk in COVID-19 Patients
It is instructive to analyze the changes observed upon SARS-CoV-2 infection in more depth because it is already known that SARS-CoV-2, SARS-CoV-1, or MERS-CoV infection may affect the liver (Kukla et al., 2020), eventually inducing long-term injury in some patients (Wu et al., 2017). The effect of SARS-CoV-2 infection on the different lipoprotein classes and subclasses, as analyzed by 1H NMR, is summarized in Figures 2D and 3 and Table S1. Our findings are consistent with a triglyceride (TG)-rich lipoprotein profile in the COVID cohort: serum TG content and the mean concentration of TG-VLDL (VLDL, very low density lipoproteins), TG-IDL (IDL, intermediate density lipoproteins), TG-LDL (LDL, low density lipoproteins), and TG-HDL (HDL, high density lipoproteins) were significantly increased in COVID-19 patients. Among these, the largest increase (by factor 2) was observed for TG-LDL (Figure 3). Inversely, the total cholesterol (TC) and mean concentration of bound TC-LDL and TC-HDL (both are the main carriers of cholesterol) were decreased in COVID-19 serum, most prominently for TC-HDL subfractions 4 and 3. In contrast, TC-VLDL and TC-IDL levels were slightly, but significantly, increased. The concentrations of cholesteryl esters and phospholipids in the main lipoprotein classes showed a profile similar to that observed for TG and TC. All these observations suggest a remodeling of the lipoprotein particle phenotype in COVID-19 patients, with a reduction of the mean HDL size, an enlargement of the mean size of LDL, and increased level of VLDL subclasses with intermediate size.
Figure 3.

Average Effect of COVID-19 for Each Lipoprotein Subclass
Horizontal axis is the number of standard deviations that a variable is on average increased (or decreased) when an individual is positive for COVID-19. Circles are positioned in the specific mean increase (decrease) value, whereas horizontal black bars are the 95% confidence interval. Statistically significant differences (p value < 0.05) are represented with filled circles.
Among the apolipoproteins, both Apo-A1 and Apo-A2, the major apoprotein components of HDL, markedly decreased in COVID-19 patient serum, although they maintained a normal Apo-A1 to Apo-A2 ratio, indicating that SARS-CoV-2 infection did not alter HDL composition. The Apo-B to Apo-A1 ratio, a balance between atherogenic and anti-atherogenic particles, markedly increased by about 2-fold indicating an increased cardiovascular risk for COVID-19 patients.
Low-Molecular-Weight Metabolite Profiling Shows Indications of Liver Damage in COVID-19 Patients
Our analysis of low-molecular-mass metabolites NMR showed that ketone bodies (acetoacetic acid, 3-hydroxybutyric acid, and acetone) were markedly elevated in the serum of COVID-19 patients. Acetoacetic acid increased from 1.14 × 10⁻² to 5.54 × 10⁻² mmol/L (p < 0.0001, 385%), 3-hydroxybutyric acid from 6.6 × 10⁻² to 2.7 × 10⁻¹ mmol/L (p < 0.0001, 302%), and acetone from 2.75 × 10⁻² to 6.45 × 10⁻² mmol/L (p < 0.0001, 134%) (Figure 4). It is known that ketone bodies are induced by fasting conditions (Scott and Deuster, 2017), but we observed elevated ketone bodies for the patient's cohort (collected under uncontrolled fasting conditions) when compared with the pre-COVID cohort (collected under fasting conditions). Therefore, the differences shown in the amount of ketone bodies can be only attributed to the disease. Moreover, recent medical reports also suggest that COVID-19 implies ketone bodies accumulation (Li et al., 2020). As ketone bodies are produced predominantly in the liver from fatty acid oxidation-derived acetyl-CoA, the observed serum accumulation of TG and TG-VLDL in COVID-19 patients, shown in Figure 3, may be due to a reduced hepatic capacity to oxidize acetyl-CoA in the mitochondria, which is then redirected to the synthesis of acetoacetic acid and 2-hydroxybutyric acid. The elevation of glucose in the serum of COVID-19 patients (8.19 versus 4.89 mmol/L, p < 0.0001, 68%) (Figure 4) is consistent with this model, because mitochondrial oxaloacetate is driven to the cytoplasm into gluconeogenesis, via the synthesis of malic acid, when it cannot condensate with acetyl-CoA to feed the tricarboxylic acid cycle. The increase in succinic acid, citric acid, glutamic acid, and pyruvic acid by 156%, 12%, 33%, and 67%, respectively (Figure 4), may all be related to this dysregulation of hepatic central carbon metabolism in COVID-19 patients. In addition to the metabolic re-wiring that may result as a consequence of central carbon metabolism dysregulation, the accumulation of succinic acid has been shown to create a pseudohypoxic environment that facilitates cancer development and progression (Klukova et al., 2018). Moreover, the reduction in the essential amino acids methionine, isoleucine, histidine, and lysine by 19%, 11%, 16%, and 34%, respectively, together with the reduction of tyrosine and glutamine by 4%, and 19%, respectively, two amino acids whose synthesis can be limited under special pathophysiological conditions, along with substantially increased levels of phenylalanine (an essential amino acid precursor of tyrosine) and 2-hydroxybutiryc acid (a readout of hepatic oxidative stress), which increased by 81%, and 628%, respectively (Figure 4), altogether suggests the existence of a general metabolic stress condition in COVID-19 patients.
Figure 4.

Average Effect of COVID-19 for Each Metabolite
Horizontal axis is the number of standard deviations that a variable is on average increased (or decreased) when an individual is positive for COVID-19. Circles are positioned in the specific mean increase (decrease) value, whereas horizontal black bars are the 95% confidence interval. Statistically significant differences (p value < 0.05) are represented with filled circles.
Discussion
We have here investigated the changes that SARS-CoV-2 infection may provoke in the metabolism, by measuring the serum concentrations of various lipoproteins and metabolites using 1H NMR spectroscopy. To that end we have investigated a large cohort of patients (n = 263) at the moment of hospitalization, all with COVID-19-compatible symptomatology and 100% of them confirmed by RT-PCR testing. From the antibody test, 75% of the patients also already developed IgG antibodies, and about a third of them, also IgM antibodies. Importantly, these patients did not necessarily have previous health problems as the only inclusion criterion was the SARS-CoV-2 infection. Taken together, this patient cohort is, on average, representing the acute symptomatic phase of the disease, approximately between 14 and 21 days from onset. As a control cohort, we have used a pool of samples of similar size (n = 280), that belongs to healthy population and acquired before the advent of COVID-19. Although the two cohorts have different average age, we have demonstrated that this is not a contributing factor to the observed differences (Figure S1).
One of the most striking differences arises from the lipoprotein distribution. Endogenous lipoproteins are classified according to lipid and apolipoprotein composition in VLDL, IDL, LDL, and HDL (Feingold KR, 2018). HDL is classified as atheroprotective because it is involved in the transport of cholesterol to the liver. Upon an excess of fatty acids and TC in the liver, these lipids are converted into TG and cholesteryl esters, respectively; wrapped with apolipoproteins (mainly Apo-B), decorated with phospholipids; and placed into circulation as VLDL where, via capillaries, they get in contact with the various tissues. Our NMR analysis clearly reflects a scenario with a severe lipoprotein dysregulation toward increased TG and abnormal lipoprotein particle distribution, with an increase of VLDL subclasses with intermediate size. These results are in line with other observations using MS (Shen et al., 2020; Thomas et al., 2020), but our study, on a very large cohort, adds granularity to the lipoprotein distribution and allows devising a detailed landscape of lipoprotein rearrangement upon SARS-CoV-2 infection. This acute dysregulation is obviously pathogenic, and, when found in non-acute episodes such as metabolic syndrome or non-alcoholic fatty liver disease, it would fit well with increased atherosclerotic risk.
The metabolic profile of COVID-19 patients, also obtained by NMR spectroscopy, agrees well with the lipidomic analysis. The excess of ketone bodies (acetone, acetoacetic acid, and 3-hydroxybutyric acid) suggests that they are being used as an alternative energy source due to a sort of diabetic ketoacidosis. Consistently, glucose levels are also elevated, but this has to be taken with extreme caution because samples were not collected at fasting conditions. Some other metabolites such as succinate and pyruvate among others are consistent with impaired central metabolism and/or mitochondrial dysfunction. We have recently observed that thrombocytopenia in COVID-19 patients (Connors and Levy, 2020) ultimately results in elevated porphyrin levels, in a similar way as observed in porphyria, a family of diseases that always imply oxidative stress, mitochondrial impairment, and liver damage.
Furthermore, the analysis of low-molecular-weight metabolites reveals the presence of general metabolic stress in COVID-19 patients, as indicated by the increase in 2-hydroxybutiryc acid (hepatic oxidative stress marker), and the reduction in essential amino acids, tyrosine, and glutamine. In summary, herein we provide an observational report of the comprehensive serum metabolome of a very large cohort of COVID-19-positive patients in the acute phase of the disease. Our results evidence massive changes in the lipoprotein and metabolomic profiles consistent with the observed blood alterations in COVID-19 patients, highlighting the systemic character of the disease.
Limitations of the Study
The cohort is limited to the same world region, which may partially compromise the generality of the conclusions due to geographical biases. Freezing the samples may alter the metabolite concentrations, even though the two control groups (Figure S3) suggest that this problem does not significantly affect the conclusions of the present study. Samples that were collected before the pandemic (preCOVID) may have not used the same protocol as the COVID cohorts. All the samples correspond to the acute phase of the disease, and the study would benefit from the study of samples from patients at different stages of the SARS-CoV-2 infection.
Resource Availability
Lead Contact
Further information and requests for resources and reagents should be directed to and will be fulfilled by the Lead Contact, Oscar Millet (omillet@cicbiogune.es).
Materials Availability
This study did not generate new unique reagents.
Data and Code Availability
All parameter values, datasets, and used in the model are included in the Supplemental Information.
Methods
All methods can be found in the accompanying Transparent Methods supplemental file.
Acknowledgments
Support was provided by the Department of Economic Development and Infrastructures of the Government of the Autonomous Community of the Basque Country (Elkartek BG2019) and the Severo Ochoa Excellence Accreditation from MCIU (SEV-2016-0644). O.M. acknowledges the Agencia Estatal de Investigación (Spain) for grants CTQ2015-68756-R, RTI2018-101269-B-I00. J.M.M. acknowledges the Agencia Estatal de Investigación (Spain) and CIBERehd for grants SAF2017-88041-R. O.M. and J.M.M. acknowledge NIH 1R01DK119437-01A1.
Author Contributions
E.A., M.S., and A.G.d.V. collected the samples; I.S.J., C.B., M.B., G.B.-S., A.L., P.U., J.G.-M., and T.D. performed the experiments; R.G.-R. and N.E. performed the statistical data analysis; J.M.M. and O.M. designed research, and O.M. wrote the paper.
Declaration of Interest
The authors declare no competing interests.
Published: October 23, 2020
Footnotes
Supplemental Information can be found online at https://doi.org/10.1016/j.isci.2020.101645.
Supplemental Information
The table has been deposited in Mendeley Data: Millet, Oscar (2020), “SARS-CoV-2 infection dysregulates the metabolomic and lipidomic profiles of serum. Bruzzone et al.,” Mendeley Data, V1, doi: 10.17632/3h96n97xrb.1.
The table has been deposited in Mendeley Data: Millet, Oscar (2020), “SARS-CoV-2 infection dysregulates the metabolomic and lipidomic profiles of serum. Bruzzone et al.,” Mendeley Data, V1, doi: 10.17632/3h96n97xrb.1
References
- Al-Ani F., Chehade S., Lazo-Langner A. Thrombosis risk associated with COVID-19 infection. A scoping review. Thromb. Res. 2020;192:152–160. doi: 10.1016/j.thromres.2020.05.039. [DOI] [PMC free article] [PubMed] [Google Scholar]
- Connors J.M., Levy J.H. COVID-19 and its implications for thrombosis and anticoagulation. Blood. 2020;135:2033–2040. doi: 10.1182/blood.2020006000. [DOI] [PMC free article] [PubMed] [Google Scholar]
- Chapman M.J., Goldstein S., Lagrange D., Laplaud P.M. A density gradient ultracentrifugal procedure for the isolation of the major lipoprotein classes from human serum. J. Lipid Res. 1981;22:339–358. [PubMed] [Google Scholar]
- Embade N., Mariño Z., Diercks T., Cano A., Lens S., Cabrera D., Navasa M., Falcón-Pérez J.M., Caballería J., Castro A. Metabolic characterization of advanced liver fibrosis in HCV patients as studied by serum 1H-NMR spectroscopy. PLoS One. 2016;11:e0155094. doi: 10.1371/journal.pone.0155094. [DOI] [PMC free article] [PubMed] [Google Scholar]
- Feingold KR G.C. MDText.com, Inc; 2018. Introduction to Lipids and Lipoproteins. [Google Scholar]
- Jiménez B., Holmes E., Heude C., Tolson R.F., Harvey N., Lodge S.L., Chetwynd A.J., Cannet C., Fang F., Pearce J.T.M. Quantitative lipoprotein subclass and low molecular weight metabolite analysis in human serum and plasma by (1)H NMR spectroscopy in a multilaboratory trial. Anal. Chem. 2018;90:11962–11971. doi: 10.1021/acs.analchem.8b02412. [DOI] [PubMed] [Google Scholar]
- Klukova K., Tennant D. Metabolic implications of hypoxia and pseudohypoxia in pheochromocytoma and paraganglioma. Cell Tissue Res. 2018;372:367–378. doi: 10.1007/s00441-018-2801-6. [DOI] [PMC free article] [PubMed] [Google Scholar]
- Kukla M., Skonieczna-Żydecka K., Kotfis K., Maciejewska D., Łoniewski I., Lara L.F., Pazgan-Simon M., Stachowska E., Kaczmarczyk M., Koulaouzidis A. COVID-19, MERS and SARS with concomitant liver injury-systematic review of the existing literature. J. Clin. Med. 2020;9:1420. doi: 10.3390/jcm9051420. [DOI] [PMC free article] [PubMed] [Google Scholar]
- Kyle J.E., Burnum-Johnson K.E., Wendler J.P., Eisfeld A.J., Halfmann P.J., Watanabe T., Sahr F., Smith R.D., Kawaoka Y., Waters K.M. Plasma lipidome reveals critical illness and recovery from human Ebola virus disease. Proc. Natl. Acad. Sci. U S A. 2019;116:3919–3928. doi: 10.1073/pnas.1815356116. [DOI] [PMC free article] [PubMed] [Google Scholar]
- La Rosa G., Mancini P., Bonanno Ferraro G., Veneri C., Iaconelli M., Bonadonna L., Lucentini L., Suffredini E. SARS-CoV-2 has been circulating in northern Italy since December 2019: evidence from environmental monitoring. Sci. total Environ. 2020;750:141711. doi: 10.1016/j.scitotenv.2020.141711. [DOI] [PMC free article] [PubMed] [Google Scholar]
- Lauer S.A., Grantz K.H., Bi Q., Jones F.K., Zheng Q., Meredith H.R., Azman A.S., Reich N.G., Lessler J. The incubation period of coronavirus disease 2019 (COVID-19) from publicly reported confirmed cases: estimation and application. Ann. Intern. Med. 2020;172:577–582. doi: 10.7326/M20-0504. [DOI] [PMC free article] [PubMed] [Google Scholar]
- Li J., Wang X., Chen J., Zuo X., Zhang H., Deng A. COVID-19 infection may cause ketosis and ketoacidosis. Diabetes Obes. Metab. 2020 doi: 10.1111/dom.14057. [DOI] [PMC free article] [PubMed] [Google Scholar]
- Liu X., Zhang R., He G. Hematological findings in coronavirus disease 2019: indications of progression of disease. Ann. Hematol. 2020:1–8. doi: 10.1007/s00277-020-04103-5. [DOI] [PMC free article] [PubMed] [Google Scholar]
- Munster V.J., Koopmans M., van Doremalen N., van Riel D., de Wit E. A novel coronavirus emerging in China - key questions for impact assessment. New Engl. J. Med. 2020;382:692–694. doi: 10.1056/NEJMp2000929. [DOI] [PubMed] [Google Scholar]
- Niazkar H.R., Zibaee B., Nasimi A., Bahri N. The neurological manifestations of COVID-19: a review article. Neurol. Sci. 2020;41:1667–1671. doi: 10.1007/s10072-020-04486-3. [DOI] [PMC free article] [PubMed] [Google Scholar]
- Richardson S., Hirsch J.S., Narasimhan M., Crawford J.M., McGinn T., Davidson K.W., Barnaby D.P., Becker L.B., Chelico J.D., Cohen S.L. Presenting characteristics, comorbidities, and outcomes among 5700 patients hospitalized with COVID-19 in the New York city area. Jama. 2020;323:2052–2059. doi: 10.1001/jama.2020.6775. [DOI] [PMC free article] [PubMed] [Google Scholar]
- Scott J.M., Deuster P.A. Ketones and human performance. J. Spec. operations Med. 2017;17:112–116. doi: 10.55460/PGWG-H55J. [DOI] [PubMed] [Google Scholar]
- Shen B., Yi X., Sun Y., Bi X., Du J., Zhang C., Quan S., Zhang F., Sun R., Qian L. Proteomic and metabolomic characterization of COVID-19 patient sera. Cell. 2020;S0092-8674:30627–30629. doi: 10.1016/j.cell.2020.05.032. [DOI] [PMC free article] [PubMed] [Google Scholar]
- Song Y., Liu P., Shi X.L., Chu Y.L., Zhang J., Xia J., Gao X.Z., Qu T., Wang M.Y. SARS-CoV-2 induced diarrhoea as onset symptom in patient with COVID-19. Gut. 2020;69:1143–1144. doi: 10.1136/gutjnl-2020-320891. [DOI] [PubMed] [Google Scholar]
- Tammaro A., Adebanjo G.A.R., Parisella F.R., Pezzuto A., Rello J. Cutaneous manifestations in COVID-19: the experiences of barcelona and Rome. J. Eur. Acad. Dermatol. Venereol. 2020;34:e306–e307. doi: 10.1111/jdv.16530. [DOI] [PMC free article] [PubMed] [Google Scholar]
- Thomas T., Stefanoni D., Reisz J.A., Nemkov T., Bertolone L., Francis R.O., Hudson K.E., Zimring J.C., Hansen K.C., Hod E.A. COVID-19 infection results in alterations of the kynurenine pathway and fatty acid metabolism that correlate with IL-6 levels and renal status. medRxiv. 2020 doi: 10.1101/2020.05.14.20102491. [DOI] [PMC free article] [PubMed] [Google Scholar]
- Wei X.S., Wang X., Niu Y.R., Ye L.L., Peng W.B., Wang Z.H., Yang W.B., Yang B.H., Zhang J.C., Ma W.L. Diarrhea is associated with prolonged symptoms and viral carriage in corona virus disease 2019. Clin. Gastroenterol. Hepatol. 2020;18:1753–1759.e2. doi: 10.1016/j.cgh.2020.04.030. [DOI] [PMC free article] [PubMed] [Google Scholar]
- WHO. 2020. www.who.int/emergencies/diseases/novel-coronavirus-2019/situation-reports/
- Wu D., Shu T., Yang X., Song J.-X., Zhang M., Yao C., Liu W., Huang M., Yu Y., Yang Q. Plasma metabolomic and lipidomic alterations associated with COVID-19. Natl. Sci. Rev. 2020:nwaa086. doi: 10.1093/nsr/nwaa086. [DOI] [PMC free article] [PubMed] [Google Scholar]
- Wu Q., Zhou L., Sun X., Yan Z., Hu C., Wu J., Xu L., Li X., Liu H., Yin P. Altered lipid metabolism in recovered SARS patients twelve years after infection. Sci. Rep. 2017;7:9110. doi: 10.1038/s41598-017-09536-z. [DOI] [PMC free article] [PubMed] [Google Scholar]
- Zhou F., Yu T., Du R., Fan G., Liu Y., Liu Z., Xiang J., Wang Y., Song B., Gu X. Clinical course and risk factors for mortality of adult inpatients with COVID-19 in Wuhan, China: a retrospective cohort study. Lancet (London, England) 2020;395:1054–1062. doi: 10.1016/S0140-6736(20)30566-3. [DOI] [PMC free article] [PubMed] [Google Scholar]
- Zhou P., Yang X.-L., Wang X.-G., Hu B., Zhang L., Zhang W., Si H.-R., Zhu Y., Li B., Huang C.-L. Discovery of a novel coronavirus associated with the recent pneumonia outbreak in humans and its potential bat origin. bioRxiv. 2020 doi: 10.1038/s41586-020-2012-7. [DOI] [Google Scholar]
- Zhu N., Zhang D., Wang W., Li X., Yang B., Song J., Zhao X., Huang B., Shi W., Lu R. A novel coronavirus from patients with pneumonia in China, 2019. N. Engl. J. Med. 2020;382:727–733. doi: 10.1056/NEJMoa2001017. [DOI] [PMC free article] [PubMed] [Google Scholar]
Associated Data
This section collects any data citations, data availability statements, or supplementary materials included in this article.
Supplementary Materials
The table has been deposited in Mendeley Data: Millet, Oscar (2020), “SARS-CoV-2 infection dysregulates the metabolomic and lipidomic profiles of serum. Bruzzone et al.,” Mendeley Data, V1, doi: 10.17632/3h96n97xrb.1.
The table has been deposited in Mendeley Data: Millet, Oscar (2020), “SARS-CoV-2 infection dysregulates the metabolomic and lipidomic profiles of serum. Bruzzone et al.,” Mendeley Data, V1, doi: 10.17632/3h96n97xrb.1
Data Availability Statement
All parameter values, datasets, and used in the model are included in the Supplemental Information.