Abstract
Cancer stem cells (CSCs) are cancer‐initiating cells that are not only a source of tumorigenesis but also the cause of tumour progression, metastasis and therapy resistance. EBV‐associated gastric cancer (EBVaGC) is a distinct subtype of gastric cancer with unique clinicopathological and molecular features. However, whether CSCs exist in EBVaGC, and the tumorigenic mechanism of EBV, remains unclear. Here, NOD/SCID mice were injected subcutaneously with the EBVaGC cell line SNU719 and treated with 5‐fluorouracil weekly. Successive generations of xenografts yielded a highly malignant EBVaGC cell line, SNU‐4th, which displays properties of CSCs and mainly consists of CD44+ CD24− cells. In SNU‐4th cells, an EBV‐encoded circRNA, ebv‐circLMP2A, expression increased and plays crucial roles in inducing and maintaining stemness phenotypes through targeting miR‐3908/TRIM59/p53 axis. Additionally, high expression of ebv‐circLMP2A is significantly associated with metastasis and poor prognosis in patients with EBVaGC. These findings not only provide evidence for the existence of CSCs in EBVaGC and elucidate the pathogenic mechanism of ebv‐circLMP2A in EBVaGC, but also provide a promising therapeutic target for EBVaGC.
Keywords: cancer stem cells, circular RNA, EBV, gastric carcinoma, miR‐3908
Subject Categories: Cancer; Microbiology, Virology & Host Pathogen Interaction; RNA Biology
The circRNA LMP2A produced by the Epstein‐Barr virus induces stemness of EBV‐associated gastric cancer cells by attenuating the tumor suppressive effect of the miR‐3908/TRIM59/p53 axis, thereby promoting metastasis and tumor progression.

Introduction
Epstein–Barr virus (EBV) is an oncogenic human herpesvirus that is ubiquitously carried by more than 90% of the world's population (Chen et al, 2010). EBV‐related malignancies account for 1.8% of all cancer deaths worldwide, with an estimated 143,000 deaths in 2010 (Khan & Hashim, 2014). Among EBV‐related malignancies, EBV‐associated gastric cancer (EBVaGC) is one of the most frequent cause of EBV‐related death (Khan & Hashim, 2014). Approximately 10% of gastric cancer (GC) is defined as EBVaGC by in situ hybridization (ISH) for EBV‐encoded RNA (EBER‐1) (Murphy et al, 2009). Compared with EBV‐negative GC (EBVnGC), EBVaGC has distinct clinicopathological characteristics, including male predominance, conspicuously inflammatory infiltration and a relatively favourable prognosis (Fukayama et al, 2008). EBVaGC also exhibits unique genetic changes and molecular features, including DNA hypermethylation, PIK3CA mutations, and JAK2, PD‐L1 and PD‐L2 amplification (Cancer Genome Atlas Research Network, 2014). Therefore, EBVaGC is regarded as a distinct subtype of GC. In EBVaGC, EBV is present in almost all tumour cells but absent in normal mucosal epithelial cells (Morales‐Sanchez & Fuentes‐Panana, 2017), hinting that EBV plays key roles in the development of EBVaGC. However, the tumorigenic mechanism of EBV in EBVaGC remains unclear.
With the concept of tumour heterogeneity being proposed, a small subpopulation of cells with particularly strong self‐renewal, differentiation, tumorigenesis and drug resistance has been found to exist in a variety of malignant cancers, which are called cancer stem cells (CSCs) (Reya et al, 2001). Mounting evidences has indicated that CSCs are not only the initiators of cancer but also related to tumour progression, metastasis and treatment resistance (Ajani et al, 2015). Since the identification of CSCs in leukaemia, CSCs have been identified in a variety of solid tumours, including nasopharyngeal carcinoma (NPC) (Kong et al, 2010), another EBV‐related epithelial malignancy derived from the amplification of a single EBV‐infected nasopharyngeal epithelial cell (Lun et al, 2014). As a direct pathogenic factor of NPC, EBV has been shown to be involved in sustaining the stemness phenotypes of NPC (Yang et al, 2016). Of the products of EBV, EBV‐encoded latent membrane protein 1 (LMP1) and 2A (LMP2A) have been reported to promote cell proliferation, avoid apoptosis, and participate in the acquisition of stemness features in NPC (Port et al, 2013; Yang et al, 2016). EBV‐encoded miRNAs, such as ebv‐miR‐BART5, ebv‐miR‐BART4‐5p and ebv‐miR‐BART9, also play an important role in maintaining the stemness phenotype by regulating cycle progression and epithelial–mesenchymal transition (EMT) and blocking apoptosis (Choy et al, 2008; Marquitz et al, 2011; Tsai et al, 2017). Additionally, the use of CSC‐targeting agents is becoming an efficient treatment for improving patient outcomes (Lun et al, 2014). A recent study has shown that DNAzyme (DZ1), a deoxyribozyme that can specifically target LMP1 mRNA, significantly increases the radiosensitivity of NPC (Cao et al, 2014).
EBVaGC presents distinctive characteristics that distinguish it from NPC (Fukayama et al, 2008). Previous studies have shown that EBV is clonally inherited by every EBVaGC tumour cell (using Terminal Repeat Analysis) and that it plays an important role in the pathogenesis of EBVaGC (Fukayama et al, 2008; Morales‐Sanchez & Fuentes‐Panana, 2017). As we know, CSCs are responsible for tumour initiation and development (Dawood et al, 2014). If EBV present in EBVaGC CSCs can regulate the stemness phenotypes in EBVaGC, they will provide additional evidence to demonstrate that EBV is an important pathogenic agent for EBVaGC. Nevertheless, whether CSCs exist in EBVaGC has not been reported, and whether EBV is involved in maintaining the stemness phenotype in EBVaGC deserves further exploration.
A novel class of noncoding RNAs, circular RNAs (circRNAs), are formed from a covalently closed loop that can tolerate the degradation of RNase R (Li et al, 2015a; Hsiao et al, 2017b). At present, increasing studies have shown that circRNA helps regulate stemness properties (Yu et al, 2017; Kristensen et al, 2018; Cherubini et al, 2019). For example, circPRMT5 promotes EMT and induces an aggressive phenotype in urothelial carcinoma of the bladder (Chen et al, 2018). circPan3 promotes the self‐renewal of intestinal stem cells by activating IL‐13/β‐catenin signalling (Zhu et al, 2019). Our previous study and two other reports have shown that EBV can generate various circRNAs (ebv‐circRNAs) (Toptan et al, 2018; Ungerleider et al, 2018; Huang et al, 2019). In our previous study, ebv‐circRNA was found to be expressed in several EBV‐positive malignancies, including Burkitt lymphoma, EBVaGC and NPC (Huang et al, 2019), suggesting that ebv‐circRNAs may play an important role in maintaining the tumour phenotype. However, as a virus‐derived noncoding RNA, the biological function of ebv‐circRNAs has not yet been explored, let alone in CSC biology.
In this study, we established a successive xenograft model to enrich EBVaGC CSCs by long‐term treatment of the EBVaGC cell line SNU719 with 5‐fluorouracil (5‐Fu) in mice. We further demonstrated that ebv‐circLMP2A, which originated from exon 3 to exon 5 of the LMP2A gene, was significantly upregulated in EBVaGC CSCs and played a critical role in inducing the stemness phenotype, by diminishing the anticarcinogenic effect of the miR‐3908/TRIM59/p53 axis. Moreover, high expression of ebv‐circLMP2A was positively correlated with metastasis and a poor prognosis in patients with EBVaGC, providing a useful biomarker and potential therapeutic target for EBVaGC.
Results
Chemotherapy selectively enriches EBVaGC CSCs
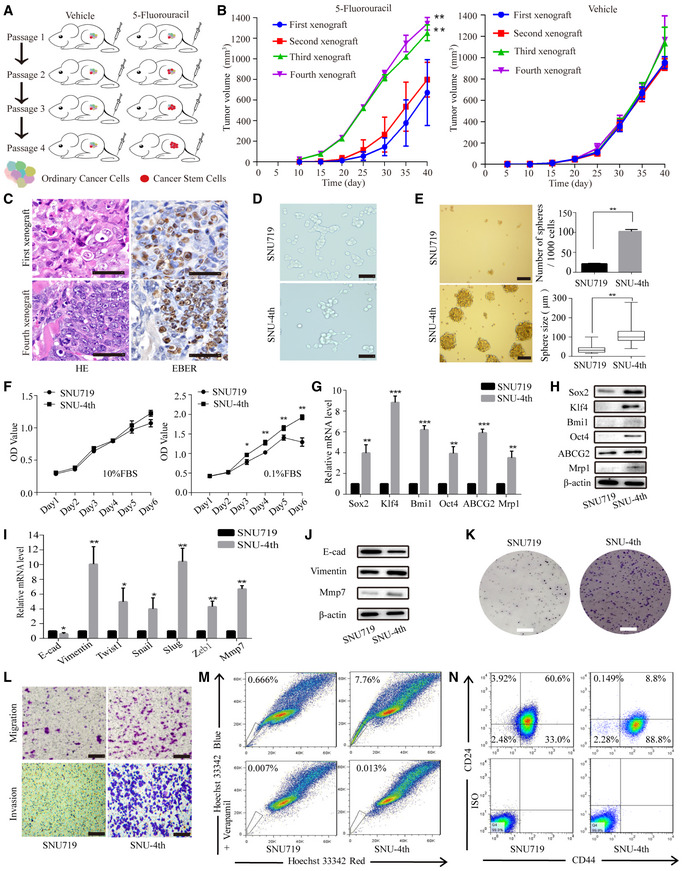
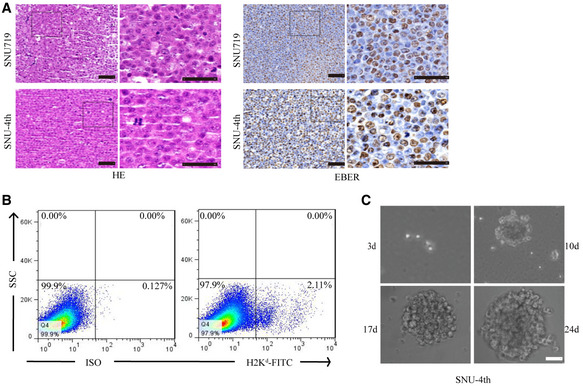
First, we established a method to enrich EBVaGC CSCs using a successive xenograft model under chemotherapy pressure (Fig 1A). In the 5‐Fu‐treated xenograft group, the growth rate of the third and fourth passage xenografts was significantly higher than in the first generation, and there was no significant difference between the third passage and fourth passage. However, in the PBS‐treated xenografts, there was no significant difference among successive four‐generation xenografts (Fig 1B). After removing the H2Kd‐positive mouse cells by flow cytometry, the remaining freshly isolated cells that were obtained from the fourth passage xenograft treated with 5‐Fu were designated as SNU‐4th cells (Fig EV1B). EBER‐1 ISH confirmed the existence of EBV in passaged xenografts, SNU719 and SNU‐4th cells (Figs 1C and EV1A).
Figure 1. EBVaGC CSCs are selectively enriched under low‐dose chemotherapy pressure.
-
ASchematic model presenting the process used to acquire EBVaGC CSCs.
-
BTumour growth curves for successive four‐generation xenografts treated with 5‐Fu or PBS. Twelve mice per group.
-
CRepresentative cases show the first‐ and fourth‐generation xenograft H&E staining (left) and EBER‐1 ISH staining (right).
-
DThe morphology of parental SNU719 and SNU‐4th cells.
-
ETumour sphere culture was performed to evaluate the sphere formation capacity in SNU719 and SNU‐4th cells, and the data are shown as the mean numbers and sizes of the tumour spheres. The central horizontal lines represent the median, the top and the bottom positions of the box represent upper and lower quartiles, error bars represent the mean ± SD, and the average number and maximal diameter of spheres were calculated under a microscope in five randomly chosen fields in each independent experiment, n = 3 biological replicates.
-
FCCK‐8 assay of SNU719 and SNU‐4th cells to determine cell proliferation under the indicated culture conditions (10% FBS or 0.1% FBS).
-
G, HExpression of stemness markers (Sox2, Klf4, Bmi1, Oct4) and drug resistance genes (ABCG2, Mrp1) evaluated by real‐time PCR (G) and WB (H) in SNU719 and SNU‐4th cells.
-
IReal‐time PCR analysis of the expression of EMT‐associated markers (E‐cad, Vimentin) and transcription factors (Twist1, Snail, Slug, Zeb1) in SNU719 and SNU‐4th cells.
-
JWB analysis of the expression of E‐cad, Vimentin and Mmp7 in SNU719 and SNU‐4th cells.
-
KColony formation assay analysis of the colony‐forming ability in SNU719 and SNU‐4th cells.
-
LTranswell migration and the Matrigel invasion assay were performed to assess the migratory and invasive capability of SNU719 and SNU‐4th cells.
-
MRepresentative images of the flow cytometric analysis of SP cells.
-
NRepresentative images of the flow cytometric analysis of the surface antigen phenotype.
Figure EV1. Isolation of SNU‐4th cells from fourth passage xenograft treated with 5‐Fu.
-
ARepresentative images showing H&E staining (left) and EBER‐1 ISH staining (right) of the parental cell line SNU719 and SNU‐4th cells.
-
BH2Kd‐positive mouse cells were removed from freshly isolated SNU‐4th cells by flow cytometry.
-
CCompared with parental SNU719 cells, SNU‐4th single cell could grow as a tumour sphere.
Morphologically, SNU‐4th cells were predominantly dispersed and spindle‐shaped (Fig 1D). Compared with parental SNU719 cells, SNU‐4th single cell could grow as a tumour sphere at day 10 and formed more and larger tumour spheres (Figs EV1C and 1E). As shown in Fig 1F, compared with parental SNU719 cells, the growth curve of SNU‐4th cells was almost identical when the medium was supplemented with 10% foetal bovine serum (FBS), while SNU‐4th cells showed a significantly accelerated growth rate when the cells were maintained in medium supplemented with 0.1% FBS. Furthermore, SNU‐4th cells but not parental SNU719 cells showed high expression of stemness markers (Sox2, Klf4, Bmi1 and Oct4) and drug resistance genes (ABCG2 and Mrp1) at both mRNA and protein levels (Fig 1G and H).
Next, we evaluated the expression levels of a representative mesenchymal marker (Vimentin), EMT‐associated transcription factors (Twist1, Snail, Slug and Zeb1) and the metastasis‐related gene matrix metalloproteinase 7 (Mmp7), and SNU‐4th cells exhibited higher mRNA levels of these genes than parental SNU719 cells (Fig 1I). In addition, compared with parental SNU719 cells, SNU‐4th cells showed decreased expression of epithelial cell marker E‐cadherin (E‐cad) and increased expression of the mesenchymal marker Vimentin and Mmp7 (Fig 1J), colony‐forming ability (Fig 1K) and migratory and invasive capability (Fig 1L).
Cancer stem cells are also believed to be resistant to chemotherapy, in part by over‐expressing an ATP‐binding cassette half‐transporter ABCG2, and this property refers to the capacity to expel dyes, defined as a flow cytometry side population (SP) (Patrawala et al, 2005). Freshly isolated SNU‐4th cells contained 15‐fold more SP cells than SNU719 cells (6.87 ± 2.56% vs 0.47 ± 0.38%, P < 0.001; Fig 1M), and a larger proportion of SNU‐4th cells were CD44+CD24− (89.17 ± 7.31% vs 27.89 ± 9.47%, P < 0.001; Fig 1N).
Collectively, the above results demonstrated that SNU‐4th cells obtained from the fourth passage xenograft treated with 5‐Fu possessed the properties of CSCs and mainly consisted of CD44+CD24− cells.
Profiling of circRNAs in the fourth passage xenografts
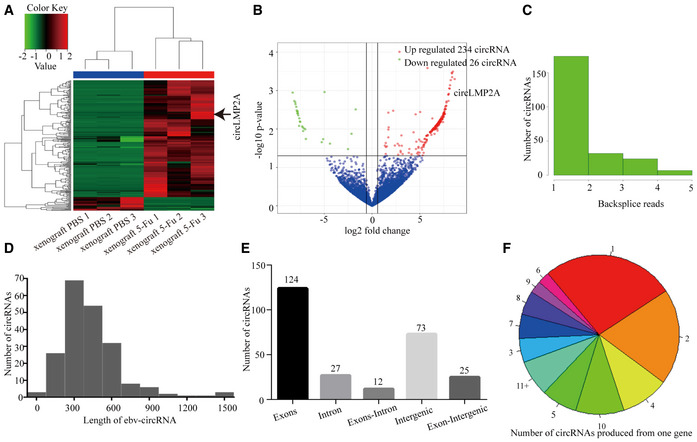
We compared the expression of circRNAs between the fourth passage xenografts treated with 5‐Fu and PBS by RNA sequencing. Detailed information for each sample and annotations is provided in Dataset EV1. A total of 260 circRNAs (both human and ebv‐circRNAs) were differentially expressed between the two groups, in which 234 circRNAs were significantly upregulated and 26 circRNAs were downregulated in the xenografts treated with 5‐Fu compared with those treated with PBS (Fig 2A and B). Additionally, a total of 261 distinct ebv‐circRNA candidates were found in these tissues, 144 of which contained at least two back‐spliced reads (Fig 2C). Most ebv‐circRNAs ranged in length from 300 to 600 nucleotides (nt) and no more than 1,500 nt (Fig 2D). Approximately 47.5% of the ebv‐circRNAs originated from protein coding exons, and others derived from intergenic regions, introns, exon‐intergenic regions and exons–introns (Fig 2E). Analysis of the number of ebv‐circRNA isotypes from their host gene showed that one gene could generate multiple ebv‐circRNAs isotypes (Fig 2F).
Figure 2. Profiling of circRNAs in the fourth passage xenografts.
-
AHeat map analysis of the expression of circRNAs (both human circRNAs and ebv‐circRNAs) in the fourth passage xenografts treated with 5‐Fu or PBS. Red colour represents upregulated circRNAs, and green colour represents downregulated circRNAs.
-
BVolcano plot representing the expression fold changes in circRNAs. The red dots represent upregulated circRNAs, and green dots represent downregulated circRNAs.
-
CThe back‐spliced read distribution of ebv‐circRNAs (n = 261).
-
DThe length distribution of ebv‐circRNAs.
-
EGenomic origin of ebv‐circRNAs.
-
FNumber of ebv‐circRNAs produced from one gene.
ebv‐circLMP2A is highly expressed in EBVaGC CSCs and correlated with the prognosis of EBVaGC patients
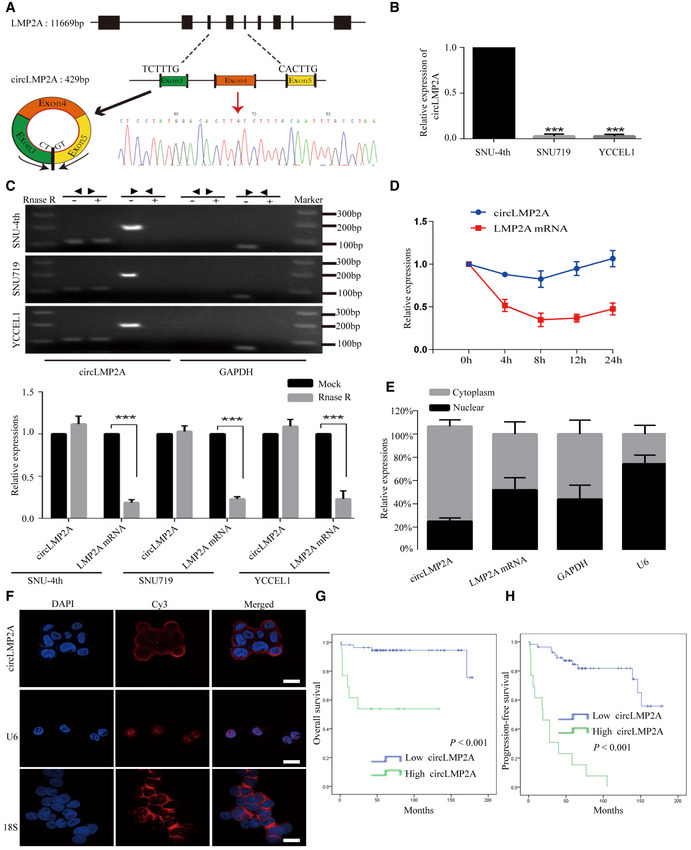
Compared with the xenografts treated with PBS, the expression of a single ebv‐circRNA was consistently upregulated in the three xenografts treated with 5‐Fu (Table EV1). This ebv‐circRNA was derived from LMP2A gene with a head‐to‐tail loop formed from exon 3 to exon 5, which we termed ebv‐circLMP2A. The distinct sequence of ebv‐circLMP2A was confirmed by Sanger sequencing (Fig 3A). The expression of ebv‐circLMP2A was further evaluated in EBVaGC cells. SNU‐4th cells highly expressed ebv‐circLMP2A, while SNU719 and YCCEL1 cells barely expressed ebv‐circLMP2A (Fig 3B). As shown in Fig 3C, the presence of ebv‐circLMP2A was validated by reverse transcription‐polymerase chain reaction (RT–PCR) and real‐time PCR in SNU‐4th, SNU719 and YCCEL1 cells treated with or without RNase R digestion. The fragment of the linear form of LMP2A was digested with RNase R, whereas ebv‐circLMP2A was resistant to RNase R digestion. We further explored the stability of ebv‐circLMP2A in SNU‐4th cells, and after treatment with actinomycin D, real‐time PCR revealed that the half‐life of ebv‐circLMP2A exceeded 24 h while that of linear LMP2A mRNA was < 4 h (Fig 3D). In addition, both real‐time PCR analysis of nuclear and cytoplasmic ebv‐circLMP2A RNA and RNA ISH demonstrated that ebv‐circLMP2A predominately localized in the cytoplasm (Fig 3E and F).
Figure 3. Characterization of circLMP2A in SNU‐4th, SNU719 and YCCEL1 cells and correlated with the prognosis of EBVaGC patients.
-
ASchematic illustration showing the genomic loci of the circLMP2A (black arrow). The sequence of circLMP2A was validated by Sanger sequencing. The red arrow indicates the “head‐to-tail” splicing sites of circLMP2A.
-
BReal‐time PCR analysis of the expression of circLMP2A in SNU‐4th, SNU719 and YCCEL1 cells.
-
CThe existence of circLMP2A was validated by RT–PCR (up) and real‐time PCR (down) in SNU‐4th, SNU719 and YCCEL1 cells treated with or without RNase R digestion. GAPDH was used as a negative control.
-
DReal‐time PCR analysis of circLMP2A and LMP2A expression after treatment with actinomycin D at the indicated time points in SNU‐4th cells.
-
EReal‐time PCR analysis of circLMP2A and LMP2A expression in either the cytoplasm or nucleus in SNU‐4th cells. GAPDH and U6 were used as controls in cytoplasm and nucleus, respectively.
-
FRNA ISH for circLMP2A. U6 and 18S are mainly localized in the nucleus and cytoplasm, respectively, and were used as controls.
-
GKaplan–Meier survival curve analysis showing the correlation between circLMP2A expression and OS. n = 69, P < 0.001, log‐rank test.
-
HKaplan–Meier survival curve analysis showing the correlation between circLMP2A expression and progression‐free survival (PFS). n = 69, P < 0.001, log‐rank test.
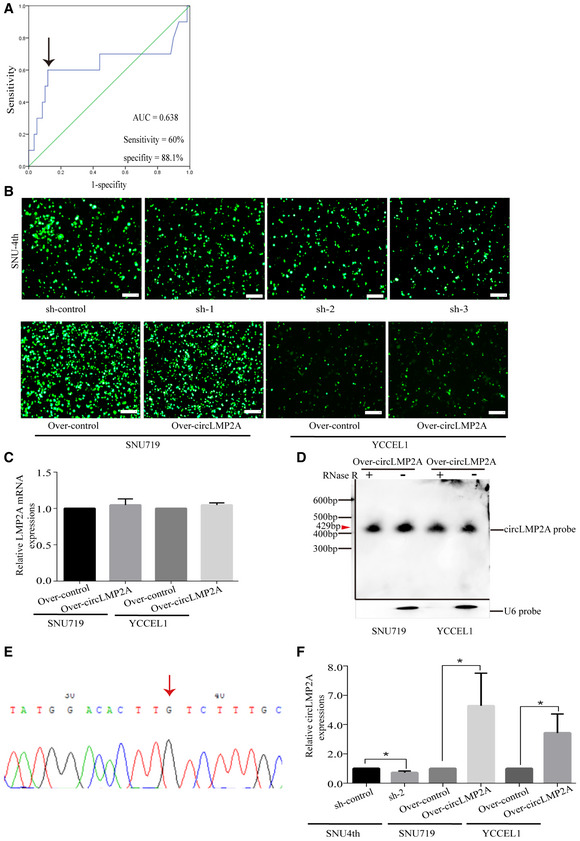
Furthermore, the expression of ebv‐circLMP2A in 69 EBVaGC patients was analysed by real‐time PCR. ROC analysis was applied to distinguish between high and low expression of ebv‐circLMP2A (Fig EV2A). As shown in Table 1, high ebv‐circLMP2A expression was significantly correlated with lymph node metastasis (P < 0.001), distant metastasis (P = 0.001) and advanced TNM stage (P = 0.032). Additionally, EBVaGC patients with high ebv‐circLMP2A expression had a worse 5‐year overall survival (OS) than those with low ebv‐circLMP2A expression (53.8% vs 75.6%, P < 0.001, Fig 3G). We also assessed progression‐free survival (PFS) and found that higher expression of ebv‐circLMP2A also predicted a poorer PFS than low ebv‐circLMP2A expression (15.4% vs 72.6%, P < 0.001, Fig 3H).
Figure EV2. Stable transfection of circLMP2A in SNU‐4th cells.
-
AROC curves for the discrimination of patients with high or low expression of circLMP2A. The black arrow indicates the cut‐off value (left).
-
BFluorescence microscopy showing the expression of GFP‐labelled plasmids in SNU‐4th, SNU719 and YCCEL1 cells.
-
CThe linear LMP2A mRNA levels were detected by real‐time PCR.
-
DNorthern blots for the detection of circLMP2A in SNU719 and YCCEL1 cells (circLMP2A over‐expressing stable transfectants) treated with or without RNase R digestion. Please note that the image was assembled from different blots (indicated by the black lines). The red arrow indicates the size of circLMP2A (429 bp).
-
EThe back‐spliced sequence of circLMP2A from the over‐expression system was validated by Sanger sequencing. The red arrow indicates the “head‐to-tail” splicing sites of circLMP2A.
-
FThe expression of circLMP2A was detected in xenograft tissues from in vivo tumorigenicity experiments using RT–qPCR.
Table 1.
Correlations between the clinicopathological features and expression of ebv‐circLMP2A, hsa‐miR‐3908 and TRIM59 in 69 EBVaGC patients
| Cases | ebv‐circLMP2A expression | Cases | hsa‐miR‐3908 expression | Cases | TRIM59 expression | |||||||
|---|---|---|---|---|---|---|---|---|---|---|---|---|
| Low | High | P | Low | High | P | Low | High | P | ||||
| Gender | ||||||||||||
| Male | 64 | 38 | 26 | 0.575 | 64 | 34 | 30 | 0.198 | 64 | 33 | 31 | 0.166 |
| Female | 5 | 5 | 0 | 5 | 1 | 4 | 5 | 2 | 3 | |||
| Age | ||||||||||||
| < 60 | 42 | 24 | 18 | 0.561 | 42 | 22 | 20 | 0.808 | 42 | 21 | 21 | 0.448 |
| ≥ 60 | 27 | 19 | 8 | 27 | 13 | 14 | 27 | 14 | 13 | |||
| Lauren classification | ||||||||||||
| Intestinal | 15 | 4 | 11 | 0.458 | 15 | 10 | 5 | 0.244 | 15 | 7 | 8 | 0.386 |
| Diffuse | 54 | 39 | 15 | 54 | 25 | 29 | 54 | 28 | 26 | |||
| Size | ||||||||||||
| < 5 cm | 29 | 23 | 6 | 0.058 | 29 | 16 | 13 | 0.628 | 29 | 12 | 17 | 0.807 |
| ≥ 5 cm | 40 | 20 | 20 | 40 | 19 | 21 | 40 | 23 | 17 | |||
| Differentiation | ||||||||||||
| Well/Moderate | 11 | 7 | 4 | 0.199 | 11 | 6 | 5 | 0.513 | 11 | 5 | 6 | 0.202 |
| Poor | 58 | 36 | 22 | 58 | 29 | 29 | 58 | 30 | 28 | |||
| T stage | ||||||||||||
| T1 + T2 | 15 | 12 | 3 | 0.853 | 15 | 8 | 7 | 0.771 | 15 | 14 | 1 | 0.003 |
| T3 + T4 | 54 | 31 | 23 | 54 | 27 | 27 | 54 | 21 | 33 | |||
| Lymph node status | ||||||||||||
| Negative | 33 | 32 | 1 | < 0.001 | 33 | 16 | 17 | 0.085 | 33 | 17 | 16 | 0.784 |
| Positive | 36 | 11 | 25 | 36 | 19 | 17 | 36 | 18 | 18 | |||
| Distant metastasis | ||||||||||||
| Negative | 53 | 42 | 11 | 0.001 | 53 | 26 | 27 | 0.055 | 53 | 27 | 26 | 0.589 |
| Positive | 16 | 1 | 15 | 16 | 9 | 7 | 16 | 8 | 8 | |||
| TNM stage | ||||||||||||
| I + II | 26 | 23 | 3 | 0.032 | 26 | 13 | 13 | 0.458 | 26 | 14 | 12 | 0.066 |
| III + IV | 43 | 20 | 23 | 43 | 22 | 21 | 43 | 21 | 22 | |||
Bold values: P < 0.05 indicates statistical significance (chi‐square test).
Taken together, our results indicated that ebv‐circLMP2A was abundantly expressed in SNU‐4th cells and mainly localized in the cytoplasm, and higher ebv‐circLMP2A expression correlated with a worse prognosis in EBVaGC patients.
Silencing of ebv‐circLMP2A inhibits the stemness phenotype of SNU‐4th cells in vitro and vivo
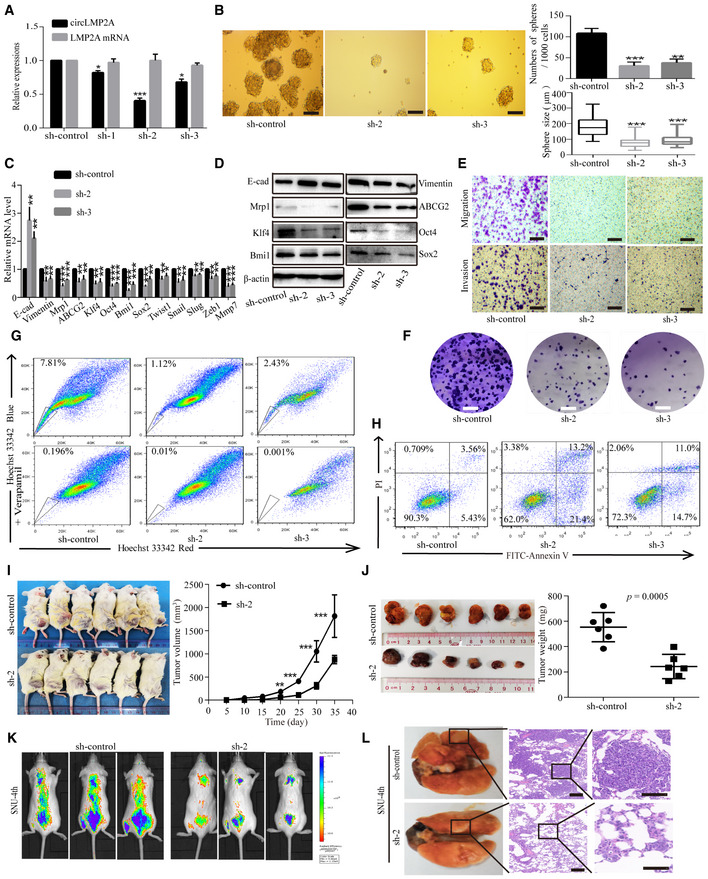
To investigate the function of ebv‐circLMP2A, we designed three shRNAs, which could target the back‐spliced sequence of ebv‐circLMP2A. Fluorescence microscopy showed the expression of GFP‐labelled interfering plasmids in SNU‐4th cells (Fig EV2B). Real‐time PCR revealed that of the three shRNAs, sh‐2 and sh‐3 dramatically downregulated ebv‐circLMP2A expression, and the linear LMP2A mRNA levels were not regulated by ebv‐circLMP2A shRNAs (Fig 4A). Sh‐2 and sh‐3 interfering plasmids were used in subsequent experiments. The tumour sphere formation assay showed that downregulation of ebv‐circLMP2A markedly suppressed the self‐renewal ability of SNU‐4th cells (Fig 4B). Interfering ebv‐circLMP2A expression also significantly reduced the expression of Vimentin, Mrp1, ABCG2, Klf4, Oct4, Bmi1 and Sox2 in SNU‐4th cells at both mRNA and protein levels (Fig 4C and D). Moreover, silencing of ebv‐circLMP2A expression inhibited the migratory and invasive capability (Fig 4E), and colony‐forming ability (Fig 4F) of SNU‐4th cells, and the interference in ebv‐circLMP2A expression also led to a significant decrease in SP cells and a sharp increase in the apoptosis rate of SNU‐4th cells (Fig 4G and H).
Figure 4. Silencing of circLMP2A inhibits the stemness phenotypes of SNU‐4th cells.
-
AReal‐time PCR analysis of the interfering efficacy and linear LMP2A mRNA levels after transfection of three circLMP2A shRNAs.
-
BTumour sphere culture analysis of the tumour sphere formation in SNU‐4th cells transfected with sh‐circLMP2A‐2, sh‐circLMP2A‐3 or sh‐control. The central horizontal lines represent the median, top and bottom positions of the box represent upper and lower quartiles, and error bars represent the mean ± SD. The average number and maximal diameter of spheres were calculated under a microscope in five randomly chosen fields in each independent experiment, n = 3 biological replicates. Scale bars = 100 μm.
-
C, DEMT‐related markers, stemness markers and drug resistance genes were evaluated by real‐time PCR (C) and WB (D) in SNU‐4th cells transfected with sh‐circLMP2A‐2, sh‐circLMP2A‐3 or sh‐control.
-
E, FTranswell assay (E) and colony formation assay (F) analysis of the migratory and invasive capability and colony‐forming ability in SNU‐4th cells transfected with sh‐circLMP2A‐2, sh‐circLMP2A‐3 or sh‐control. Scale bars = 100 μm.
-
G, HFlow cytometric analysis of the rate of SP cells (G) and apoptosis (H) in SNU‐4th cells transfected with sh‐circLMP2A‐2, sh‐circLMP2A‐3 or sh‐control.
-
I, JSubcutaneously established tumour xenografts in NOD/SCID mice. Tumour volume (I) and tumour weight (J) of the xenografts were remarkably inhibited by downregulation of circLMP2A. Six mice per group.
-
K, LRepresentative images of bioluminescence (K) and lung metastases (L) are presented to measure the metastatic colonies. Six mice per group, scale bars = 50 μm.
To investigate whether ebv‐circLMP2A could affect tumour growth in vivo, SNU‐4th cells transfected with ebv‐circLMP2A interfering plasmids or control vector were subcutaneously injected into NOD/LtSz‐scid/scid (NOD/SCID) mice. Compared with the control group, the expression of ebv‐circLMP2A was significantly reduced in xenograft tissues from the circLMP2A interfering group (Fig EV2F). Additionally, compared with the control group, the ebv‐circLMP2A interfering group showed a significantly decreased xenograft growth rate and tumour weight (Fig 4I and J). We also established a metastasis model by injecting the above different transfectants via the tail vein into NOD/SCID mice. Compared with the control group, the ebv‐circLMP2A interfering group formed fewer and smaller metastatic colonies (Fig 4K and L).
Over‐expression of ebv‐circLMP2A induces the stemness phenotype of SNU719 and YCCEL1 cells in vitro and vivo
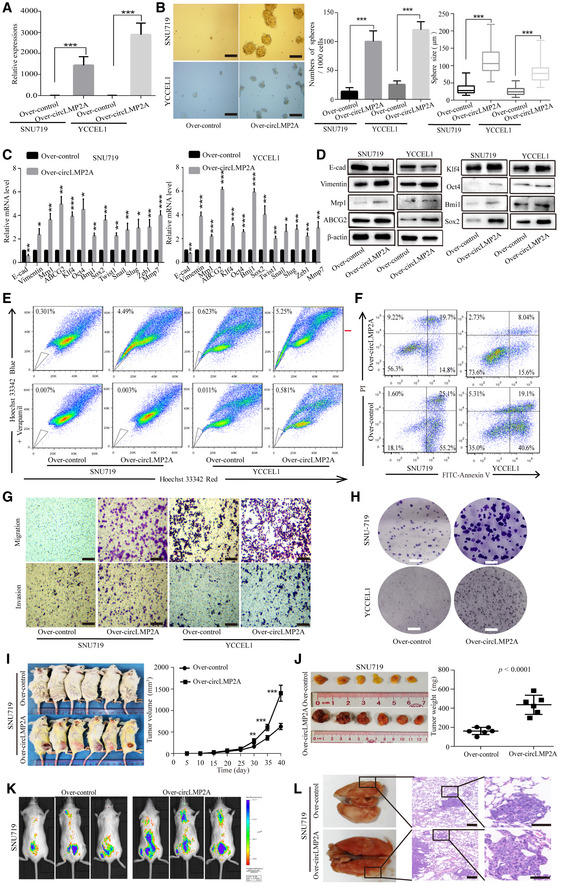
To further clarify the role of ebv‐circLMP2A in regulating the stemness phenotype, we constructed GFP‐labelled ebv‐circLMP2A over‐expression stable transfectants in SNU719 and YCCEL1 cells (Fig EV2B). The expression of ebv‐circLMP2A was observably increased in these stable transfectants (Fig 5A). Additionally, the linear LMP2A mRNA levels were not regulated by ebv‐circLMP2A over‐expression (Fig EV2C). Northern blotting +/− RNase R treatment was performed to confirm the product from the over‐expression system was actually circular RNA (Fig EV2D). We also performed Sanger sequencing to confirm the distinct circularization junction sequence of ebv‐circLMP2A from the over‐expression system (Fig EV2E). As presented in Fig 5B, over‐expression of ebv‐circLMP2A induced the formation of tumour spheres in both SNU719 and YCCEL1 cells. The expression of Vimentin, Mrp1, ABCG2, Klf4, Oct4, Bmi1 and Sox2 in SNU719 and YCCEL1 cells transfected with ebv‐circLMP2A was also increased at both mRNA and protein levels (Fig 5C and D). Moreover, over‐expression of ebv‐circLMP2A could increase the proportion of SP cells and decrease the rate of apoptosis in SNU719 and YCCEL1 cells (Fig 5E and F). Moreover, the migratory and invasive capability, and the colony‐forming ability in SNU719 and YCCEL1 cells were also promoted by ebv‐circLMP2A (Fig 5G and H).
Figure 5. Over‐expression of circLMP2A induces the stemness phenotypes of SNU719 and YCCEL1 cells.
-
AReal‐time PCR confirmed the over‐expression of circLMP2A in SNU719 and YCCEL1 cells after transfection.
-
BOver‐expression of circLMP2A induced the formation of tumour spheres in SNU719 and YCCEL1 cells. The central horizontal lines represent the median, top and bottom positions of the box represent upper and lower quartiles, and error bars represent the mean ± SD. The average number and maximal diameter of spheres were calculated under a microscope in five randomly chosen fields in each independent experiment, n = 3 biological replicates. Scale bars = 100 μm.
-
C, DEMT‐related markers, stemness markers and drug resistance genes were assessed by real‐time PCR (C) and WB (D) in SNU719 and YCCEL1 cells transfected with circLMP2A or vector.
-
E, FFlow cytometric analysis of the rate of SP cells (E) and apoptosis (F) in SNU719 and YCCEL1 cells transfected with circLMP2A or vector.
-
G, HTranswell assay (G) and colony formation assay (H) analysis of the migratory and invasive capability and colony‐forming ability in SNU719 and YCCEL1 cells transfected with circLMP2A or vector. Scale bars = 100 μm.
-
I, JSubcutaneously established tumour xenografts in NOD/SCID mice. Tumour volume (I) and tumour weight (J) of the xenografts were significantly increased by over‐expression of circLMP2A. Six mice per group.
-
K, LRepresentative images of bioluminescence (K) and lung metastases (L) are presented to measure the metastatic colonies. Six mice per group, scale bars = 50 μm.
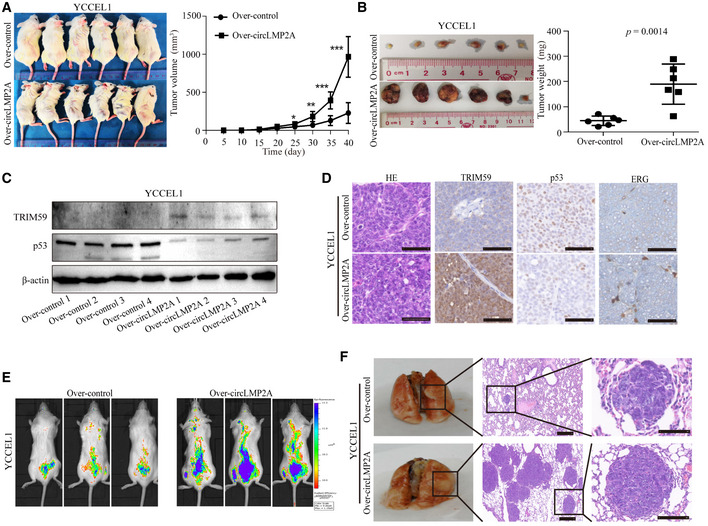
Furthermore, in the in vivo tumorigenicity experiment, compared with the control group, the expression of ebv‐circLMP2A was clearly increased in xenograft tissues from the over‐expression ebv‐circLMP2A group (Fig EV2F). Compared with the control group, the xenograft growth rate and tumour weight were also promoted in the over‐expression ebv‐circLMP2A group (Figs 5I and J, and EV3A and B), forming more and larger metastatic colonies (Figs 5K and L, and EV3E and F).
Figure EV3. Forced expression of circLMP2A promoted tumour growth, angiogenesis and metastasis in vivo .
-
A, BSubcutaneously established tumour xenografts in NOD/SCID mice. Tumour volume (A) and tumour weight (B) of the xenografts were significantly increased by over‐expression of circLMP2A.
-
CWB analysis of the expression of TRIM59 and p53 in tumour xenografts.
-
DThe expression of TRIM59, p53 and ERG was measured using IHC in tumour xenografts.
-
E, FRepresentative images of bioluminescence (E) and lung metastases (F) are presented to measure the metastatic colonies.
ebv‐circLMP2A serves as a sponge for miR‐3908
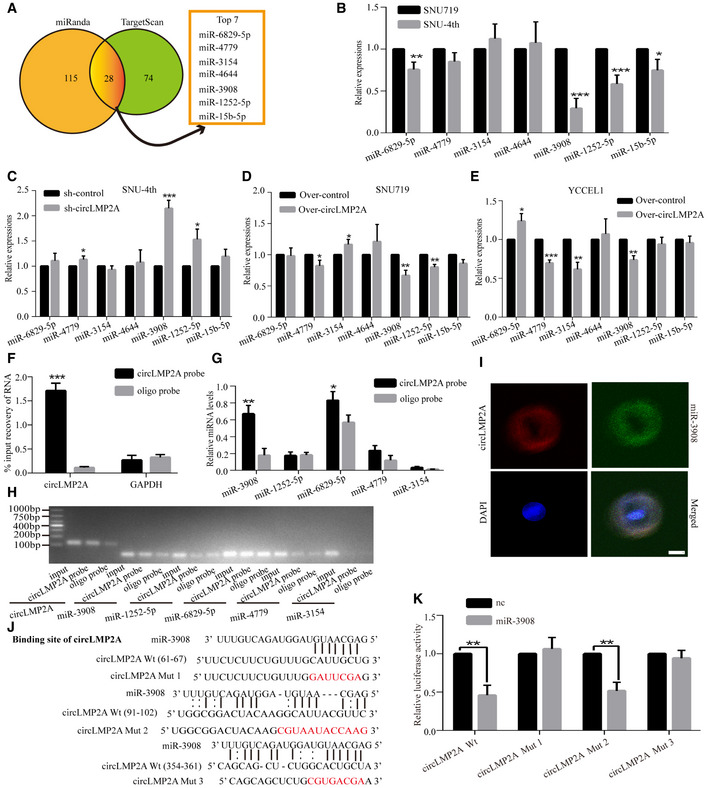
Given that ebv‐circLMP2A is abundant and stable in the cytoplasm, we speculated that ebv‐circLMP2A could function as a miRNA sponge to bind functional miRNAs. In this study, by bioinformatics analysis (miRanda and TargetScan), the top seven candidate miRNAs were identified to address whether ebv‐circLMP2A could function as a sponge for miRNAs (Fig 6A, Dataset EV2). Of the seven candidate miRNAs, we found that miR‐3908 was the most markedly downregulated miRNA in freshly isolated SNU‐4th cells compared with parental SNU719 cells (Fig 6B). In addition, miR‐3908 was upregulated after specific knockdown of ebv‐circLMP2A in SNU‐4th cells (Fig 6C) and downregulated upon over‐expression of ebv‐circLMP2A in SNU719 and YCCEL1 cells (Fig 6D and E). To further confirm that the ebv‐circLMP2A could sponge miR‐3908, a biotin‐labelled ebv‐circLMP2A probe was designed to pull down ebv‐circLMP2A in SNU‐4th cells. The pull‐down efficiency was validated by real‐time PCR and RT–PCR (Fig 6F and H). Subsequently, of the miRNAs pulled down by the ebv‐circLMP2A probe in SNU‐4th cells, miR‐3908 was the most abundant (Fig 6G and H). Moreover, RNA ISH in SNU‐4th cells revealed that ebv‐circLMP2A and miR‐3908 were co‐localized in the cytoplasm (Fig 6I).
Figure 6. circLMP2A serves as a sponge for miR‐3908.
-
ASchematic illustration showing overlapping target miRNAs of circLMP2A predicted by miRanda and TargetScan.
-
BThe relative levels of seven miRNA candidates were detected by real‐time PCR in SNU719 and SNU‐4th cells.
-
C–EReal‐time PCR analysis of seven miRNA expression in SNU‐4th cells transfected with sh‐circLMP2A‐2 or sh‐control (C), and SNU719 (D) and YCCEL1 cells (E) transfected with circLMP2A or vector.
-
F–HcircLMP2A in SNU‐4th cell lysate was pulled down with circLMP2A‐specific probe and detected by real‐time PCR (F) and RT–PCR (H). The relative levels of five miRNA candidates were detected by real‐time PCR (G) and RT–PCR (H). GAPDH was used as a negative control.
-
IRNA ISH showing the co‐localization between circLMP2A and miR‐3908 in SNU‐4th cells. circLMP2A probes were labelled with Cy3, and miR‐3908 probes were labelled with FITC. Nuclei were stained with DAPI.
-
JWild‐type and mutant circLMP2A and miR‐3908 sequences are presented. Red font indicates mutant bases.
-
KDual‐luciferase reporter assay for luciferase activity of the indicated plasmids (circLMP2A Wt, circLMP2A mut1, circLMP2A mut2, circLMP2A mut3 luciferase reporter) in HEK‐293T cells transfected with mimic‐NC or miR‐3908.
As shown in Fig 6J, ebv‐circLMP2A contained three predictive binding sites of miR‐3908. To identify which binding site was functional, we mutated each binding site in ebv‐circLMP2A, and the dual‐luciferase reporter assay indicated that miR‐3908 was able to reduce the luciferase reporter activities of ebv‐circLMP2A Wt and ebv‐circLMP2A mut2 (Fig 6K), suggesting that binding site1 and site3 but not site2 were critical for ebv‐circLMP2A to sponge miR‐3908.
Over‐expression of miR‐3908 reverses the ebv‐circLMP2A‐induced stemness phenotype in vitro
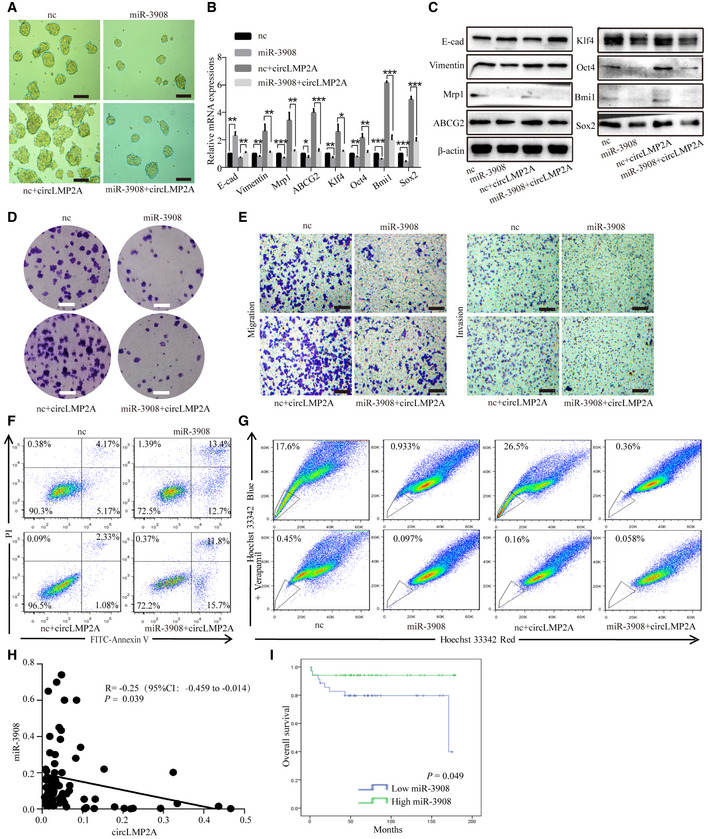
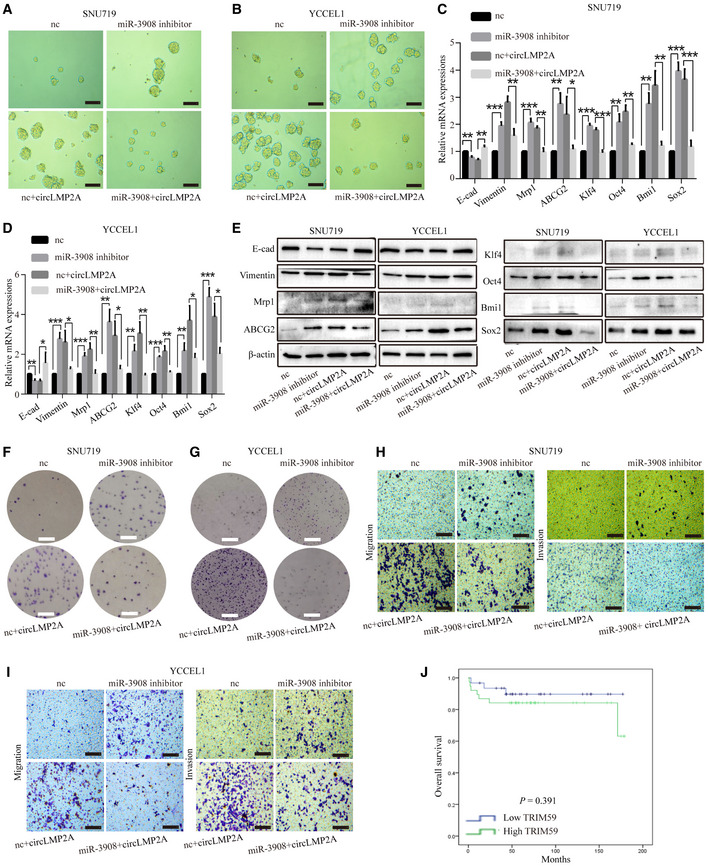
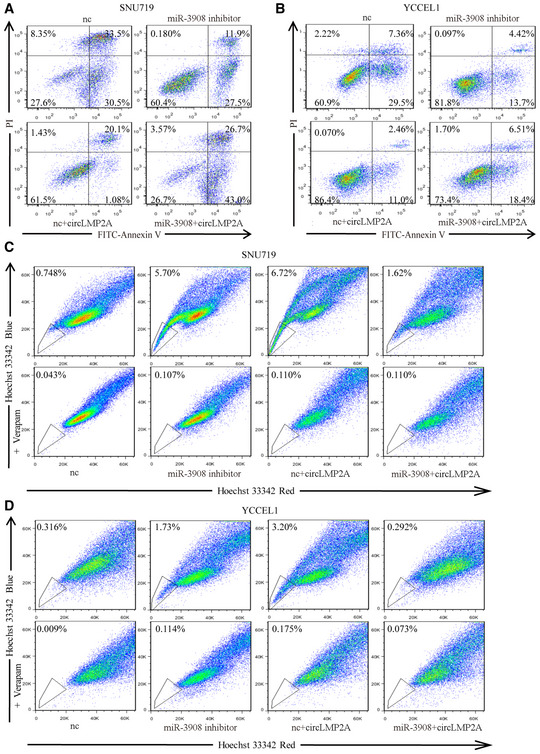
We next explored the potential function of miR‐3908 in EBVaGC. Over‐expression of miR‐3908 inhibited the formation of tumour spheres in SNU‐4th cells (Fig 7A), whereas suppression of miR‐3908 expression promoted their formation in SNU719 and YCCEL1 cells (Fig EV4A and B). To address whether ebv‐circLMP2A could induce stemness phenotype by interacting with miR‐3908, we co‐transfected miR‐3908 mimics and ebv‐circLMP2A into SNU‐4th, SNU719 and YCCEL1 cells, and we found that over‐expression of miR‐3908 attenuated the tumour sphere formation ability induced by ebv‐circLMP2A (Figs 7A, and EV4A and B). Moreover, the results of real‐time PCR and WB also indicated that miR‐3908 counteracted the upregulation effect of ebv‐circLMP2A on the expression of EMT‐related markers, stemness markers and drug resistance genes (Figs 7B and C, and EV4C–E). In addition, miR‐3908 significantly suppressed the colony‐forming ability and migratory and invasive capability, and it substantially diminished the impact of ebv‐circLMP2A on colony formation, migration and invasion (Figs 7D and E, and EV4F–I). Furthermore, miR‐3908 obviously promoted cell apoptosis and largely eliminated ebv‐circLMP2A‐induced inhibition of apoptosis (Figs 7F, and EV5A and B). MiR‐3908 could also decrease the percentage of SP cells and greatly inhibit the upregulation effect of ebv‐circLMP2A on SP cells (Figs 7G, and EV5C and D).
Figure 7. Over‐expression of miR‐3908 reverses the circLMP2A induced stemness phenotype.
-
ATumour sphere culture analysis of the tumour sphere formation ability of SNU‐4th cells transfected with the above different mimics.
-
B, CReal‐time PCR (B) and WB (C) analysis of EMT‐related markers, stemness markers and drug resistance genes expression in SNU‐4th cells transfected with the above different mimics.
-
D, EColony formation assay (D) and transwell assay (E) analysis of the colony‐forming ability and migratory and invasive capability of SNU‐4th cells transfected with the above different mimics.
-
F, GFlow cytometric analysis of the rate of apoptosis (F) and SP cells (G) in SNU‐4th cells transfected with the above different mimics.
-
HPearson correlation analysis of the correlation between the expression of circLMP2A and miR‐3908. n = 69, P = 0.039, Pearson's correlation coefficient analysis.
-
IKaplan–Meier survival curve analysis of the correlation between miR‐3908 expression and OS. n = 69, P = 0.049, log‐rank test.
Figure EV4. Inhibition of miR‐3908 expression induces the stemness phenotype of SNU719 and YCCEL1 cells.
-
A, BSuppression of miR‐3908 expression promoted the formation of tumour spheres in SNU719 (A) and YCCEL1 (B) cells, and miR‐3908 could impair the promoting function of circLMP2A on sphere formation.
-
C, DReal‐time PCR showed that miR‐3908 inhibitors elevated the expression levels of EMT‐related markers, stemness markers and drug resistance genes in SNU719 (C) and YCCEL1 cells (D), and miR‐3908 could weaken the upregulation effect of circLMP2A on EMT‐related markers, stemness markers and drug resistance genes.
-
EWB revealed the upregulation effect of miR‐3908 inhibitors on EMT‐related markers, stemness markers and drug resistance genes in SNU719 and YCCE1 cells, and miR‐3908 could attenuate the upregulation effect of circLMP2A on EMT‐related markers, stemness markers and drug resistance genes.
-
F, GThe colony formation assay indicated that miR‐3908 inhibitors enhanced colony formation of SNU719 (F) and YCCE1 (G) cells, and miR‐3908 could impair the promoting function of circLMP2A on colony formation.
-
H, ImiR‐3908 inhibitors promoted the migratory and invasive capabilities of SNU719 (H) and YCCE1(I) cells, and miR‐3908 could attenuate the promoting function of circLMP2A on migration and invasion.
-
JKaplan–Meier survival curve analysis showing the correlation between TRIM59 expression and overall survival. n = 69, P = 0.391, log‐rank test.
Figure EV5. miR‐3908 inhibitors decrease cell apoptosis and increase the ratio of SP cells in SNU719 and YCCEL1 cells.
-
A, BmiR‐3908 inhibitors decreased the rate of apoptosis in SNU719 (A) and YCCEL1(B) cells, and miR‐3908 could attenuate the inhibitory function of circLMP2A on cell apoptosis.
-
C, DmiR‐3908 inhibitors elevated the percentage of SP cells in SNU719 (C) and YCCEL1 (D) cells, and miR‐3908 could reverse the upregulation effect of circLMP2A on SP cells.
In addition, the expression level of ebv‐circLMP2A was negatively correlated with that of miR‐3908 in EBVaGC tissues (r = −0.25, P = 0.039, Fig 7H). EBVaGC patients with higher miR‐3908 expression had a better 5‐year OS than those with lower 3908 expression (94.1% vs 79.7%, P = 0.049, Fig 7I).
ebv‐circLMP2A modulates the expression of TRIM59 through miR‐3908
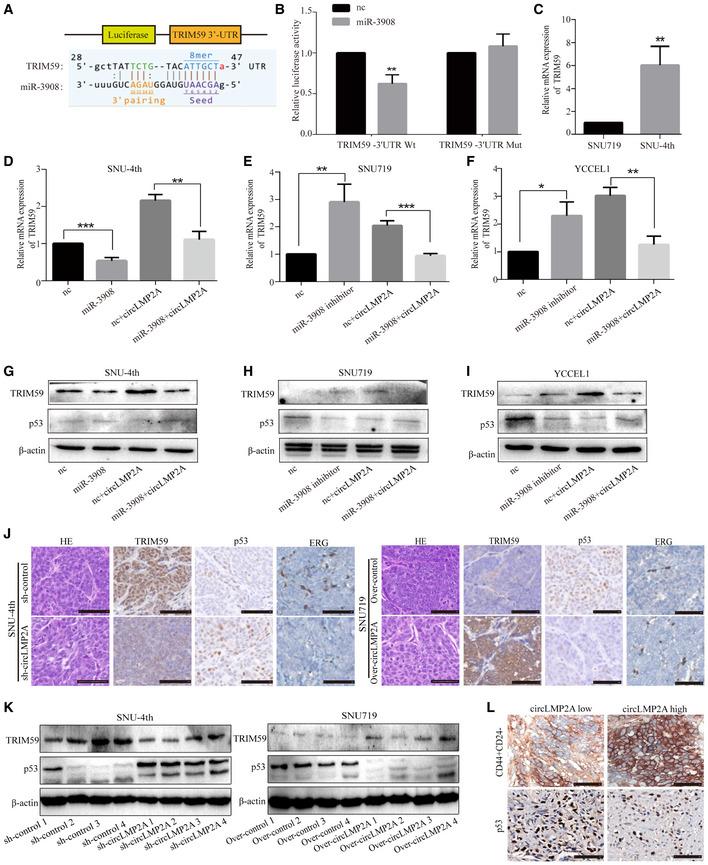
It has been reported that tripartite motif‐containing 59 (TRIM59) is upregulated in GC tissues and can promote proliferation, clone formation and migration of GC cells via degradation of p53 (Zhou et al, 2014). Using miRanda analysis, we found that the 3′untranslated region (3′ UTR) of TRIM59 mRNA contained a potential binding site for miR‐3908 (Fig 8A). Co‐transfection of miR‐3908 and TRIM59‐Wt luciferase reporter strongly reduced the luciferase activity, whereas co‐transfection of miR‐3908 and TRIM59‐mut luciferase reporter showed no obvious effect on the luciferase activity (Fig 8B). In addition, the mRNA level of TRIM59 was significantly increased in freshly isolated SNU‐4th cells compared with parental SNU719 cells (Fig 8C), and miR‐3908 could reduce the expression of TRIM59 and attenuate the upregulation of TRIM59 expression induced by ebv‐circLMP2A in SNU‐4th, SNU719 and YCCEL1 cells, at both mRNA and protein levels (Fig 8D–I). Moreover, p53, which can be degraded by TRIM59, was significantly downregulated by either miR‐3908 inhibitors or ebv‐circLMP2A (Fig 8G–I). WB and immunohistochemistry (IHC) analysis further demonstrated that the expression of TRIM59 was upregulated and p53 inhibited by ebv‐circLMP2A in xenograft tumours (Figs 8J and K, and EV3C and D). Moreover, ebv‐circLMP2A led to an increase in ERG+ intra‐tumour microvessel density in xenograft tumours (Figs 8J, and EV3D). We also explored the correlation between the expression of TRIM59 and clinicopathological parameters. As presented in Table 1, high expression of TRIM59 was correlated with an advanced T stage (P = 0.003), although there was no significant correlation between the expression of TRIM59 and overall survival (Fig EV4J).
Figure 8. circLMP2A modulates the expression of miR‐3908 target TRIM59.
-
ASchematic representation of the putative binding sites for miR‐3908 and TRIM59.
-
BDual‐luciferase reporter assay for the luciferase activity of the indicated plasmids (TRIM59‐Wt and TRIM59‐Mut luciferase reporter) in HEK‐293T cells transfected with mimic‐NC or miR‐3908.
-
CReal‐time PCR analysis of the mRNA level of TRIM59 in SNU719 and SNU‐4th cells.
-
D–FReal‐time PCR analysis of the expression of TRIM59 in SNU‐4th (D), SNU719 (E) and YCCEL1 cells (F) transfected with the above different mimics.
-
G–IWB analysis of the expression of TRIM59 and p53 in SNU‐4th (G), SNU719 (H) and YCCEL1 cells (I) transfected with the above different mimics.
-
JImmunohistochemical staining showing that over‐expression of circLMP2A could lead to increased expression of TRIM59 and ERG but decreased expression of p53.
-
KWB analysis of the expression of TRIM59 and p53 in tumour xenografts.
-
LImmunohistochemical staining showing that high expression of circLMP2A in EBVaGC tissues resulted in significant increases in CD44+CD24− cells and significant decreases in p53+ cells.
We also studied the expression of CD44/CD24 and p53 in 69 paraffin‐embedded EBVaGC samples by IHC, and we observed that in ebv‐circLMP2A high‐expression EBVaGC specimens, the CD44+CD24− cells were significantly increased and the p53+ cells significantly decreased (Fig 8L, Table EV2). Taken together, these results indicate that the ebv‐circLMP2A/miR‐3908/TRIM59/p53 axis plays crucial roles in inducing and maintaining stemness phenotypes.
Discussion
In this study, we acquired a highly aggressive EBVaGC cell line, SNU‐4th, by long‐term treatment of the EBVaGC cell line SNU719 with 5‐Fu in mice in vivo. The SNU‐4th cells exhibited clear stemness characteristics and mainly consisted of CD44+CD24− cells. Importantly, an EBV‐encoded circRNA, ebv‐circLMP2A, was highly expressed in SNU‐4th cells, acted as a sponge for miR‐3908, and further enhanced the TRIM59/p53 pathway to sustain the stemness phenotype in EBVaGC CSCs. Moreover, we also revealed that ebv‐circLMP2A was positively correlated with metastasis and a poor prognosis in patients with EBVaGC.
Increasing evidence indicates that CSCs are the cause and maintainers of tumours (Reya et al, 2001; Ajani et al, 2015). However, due to the rarity of CSCs within cancers, it is difficult to isolate and study CSCs, and little is known about what regulates their stemness phenotype and initiates tumours. Current methods for CSC isolation include serum‐free culture‐based approaches, SP isolation, cellular markers for the identification of CSCs, and the establishment of tumorigenicity under chemotherapy pressure (Yu et al, 2007; Khan et al, 2015; Abbaszadegan et al, 2017). In the past, we have used serum‐free culture to isolate EBVaGC CSCs, but EBV was lost in the enriched CSCs, potentially due to prolonged culture under serum‐free conditions with nutrient deficiency (Yip et al, 2018). Here, we took advantage of CSC chemotherapeutic resistance (Yu et al, 2007) to generate a highly aggressive EBVaGC cell line, SNU‐4th, by successive in vivo passage of EBVaGC cell SNU719 under 5‐Fu treatment. Compared with parental SNU719 cells, SNU‐4th cells exhibited unique properties, including self‐renewal capacity, growth under nonadherent conditions, survival in serum‐free medium, EMT, upregulation of stemness and drug resistance markers, and an increasing proportion of SP cells. Given that these biological properties are important requirements suggesting the presence of CSCs in cancers (Reya et al, 2001; Patrawala et al, 2005; Abbaszadegan et al, 2017), SNU‐4th cells can be considered as CSCs in EBVaGC. In addition, we found that SNU‐4th cells mainly consisted of CD44+CD24− cells, providing a reliable surface marker to isolate EBVaGC CSCs. Moreover, EBER‐1 ISH manifested the existence of EBV in SNU‐4th cells, suggesting that EBV may be involved in maintaining the stemness phenotype in EBVaGC.
At present, only three viral genomes have been reported to generate circRNAs, including EBV, Kaposi's sarcoma herpesvirus and human papillomaviruses (HPV) (Toptan et al, 2018; Zhao et al, 2019). For the biological functions of viral circRNA, only one study published in 2019 has reported that HPV‐encoded circE7 is essential for the transformed growth of cervical carcinoma cells (Zhao et al, 2019). Our previous study has verified that various ebv‐circRNA exist in EBVaGC, but the biological roles of ebv‐circRNA have not been explored (Huang et al, 2019). In this study, we found that an EBV‐encoded circRNA, ebv‐circLMP2A, was highly expressed in SNU‐4th cells, and further in vitro and in vivo functional experiments demonstrated that ebv‐circLMP2A participated in the induction and maintenance of CSCs phenotype in EBVaGC. Our findings that EBV was present in EBVaGC CSCs and EBV‐encoded circRNA could induce and maintain the stem cell‐like properties, not only elucidate the exact role of this ebv‐circRNA in the emergence of CSCs but also provide crucial evidence to clarify that EBV is an important pathogen of EBVaGC.
When circRNAs are mainly present in the cytoplasm, the best characterized function is as an miRNA sponge to regulate gene expression. In the nucleus, in contrast, circRNAs can bind to RNA binding proteins, such as certain transcription factors (Li et al, 2015b; Jin et al, 2016). Here, ebv‐circLMP2A was found to be predominantly localized in the cytoplasm and able to sponge miR‐3908. Interestingly, although ebv‐circLMP2A contained three predicted binding sites for miR‐3908, only binding site1 and site3 were critical for ebv‐circLMP2A to sponge miR‐3908. This finding suggests that the presence of putative miRNA binding sites in circRNAs does not necessarily indicate that the circRNA inhibits the miRNA by an absolute stoichiometric relationship at the real cell level. Indeed, the changes in expression levels of a single circRNA generally will not lead to significant changes in competing miRNA binding sites (Kristensen et al, 2019), and the circRNA may not inhibit the miRNA by functioning as a sponge but through targeted RNA‐directed miRNA degradation (TDMD), which requires extensive complementarity outside the seed sequence (Ghini et al, 2018). Here, we found that site3 of ebv‐circLMP2A and miR‐3908 has extensive complementarity outside of the seed sequence, suggesting that the function of ebv‐circLMP2A might also suppress miR‐3908 through targeted RNA‐directed miRNA degradation in addition to sponging.
MiR‐3908 has been reported to suppress tumorigenicity, cell migration and invasion and to promote apoptosis in glioma and breast cancer (Li et al, 2017; Liu et al, 2017). Consistent with the tumour‐suppressing role of miR‐3908 in these studies, our study demonstrated that miR‐3908 could suppress the stemness phenotypes in SNU‐4th cells. Moreover, over‐expression of miR‐3908 could substantially eliminate the ebv‐circLMP2A induced stemness phenotypes, indicating that ebv‐circLMP2A exerted its function through attenuating the inhibitory function of miR‐3908. In addition, studies have shown that circRNAs exert tumour suppressive or carcinogenic functions by acting as miRNA sponges for multiple different miRNAs, rather than containing multiple sites for a specific miRNA (Kristensen et al, 2019). For example, the oncogenic circCCDC66 contains binding sites for several miRNAs, including miR‐33b and miR‐93, both of which target the MYC oncogene (Hsiao et al, 2017a). Here, we found that ebv‐circLMP2A has a much larger effect on patient survival than miR‐3908, suggesting that other mechanisms of ebv‐circLMP2A might also exist in promoting the progression of EBVaGC. For example, ebv‐circLMP2A might also sponge other miRNAs or regulate the expression of other genes via unknown mechanisms.
We also found that TRIM59 was a direct target of miR‐3908. As a newly identified member of the TRIM family with extensive ubiquitin enzyme activity (Hatakeyama, 2011), TRIM59 has been shown to be upregulated in a variety of solid tumours, with the function of promoting invasion, metastasis and EMT (Chen et al, 2017; Sun et al, 2017). In gastric cancer, TRIM59 promotes gastric carcinogenesis by ubiquitinating and degrading p53 (Zhou et al, 2014). As a downstream target of TRIM59, p53 could be inhibited by miR‐3908 inhibitors or ebv‐circLMP2A in our study, suggesting that ebv‐circLMP2A induces the stemness phenotype of EBVaGC cells through eliminating the anticarcinogenic effect of the miR‐3908/TRIM59/p53 axis.
In addition, in the EBVaGC clinical samples, the expression level of ebv‐circLMP2A was negatively correlated with that of miR‐3908, EBVaGC patients with lower miR‐3908 expression had a worse 5‐year OS and high expression of TRIM59 was correlated with an advanced T stage. In high‐expression ebv‐circLMP2A EBVaGC clinical specimens, cells with low p53 expression were significantly increased. Our findings elucidate the significance of the interaction between ebv‐circLMP2A, miR‐3908, TRIM59 and p53 in EBVaGC tissues and further support that the ebv‐circLMP2A/miR‐3908/TRIM59/p53 axis plays key roles in the development of EBVaGC. Importantly, the expression of ebv‐circLMP2A was positively correlated with metastasis and a poor prognosis. Considering the high stability of circRNAs (Li et al, 2015a), ebv‐circLMP2A might be a more preponderant prognostic biomarker than EBV‐encoded protein and miRNA in EBVaGC.
In conclusion, for the first time, we enriched EBVaGC CSCs and demonstrated that ebv‐circLMP2A was involved in inducing and maintaining stemness phenotypes through targeting the miR‐3908/TRIM59/p53 axis in EBVaGC cells, and we further revealed that ebv‐circLMP2A predicted a poor prognosis of EBVaGC patients, providing not only a novel insights into the exact role of EBV in EBVaGC but a promising therapeutic strategy for the treatment of EBVaGC.
Materials and Methods
Ethics statement
All specimens were obtained with appropriate informed consent from the patients and approved by the Institute Research Ethics Committee of Sun Yat‐Sen University. All animal studies were performed in accordance with the institutional ethics guidelines for the animal experiments which were approved by the Experimental Animal Ethics Committee of the Third Affiliated Hospital, Sun Yat‐sen University.
Patient samples
A total of 78 paraffin‐embedded EBVaGC samples were collected from patients who underwent gastrectomy in the First, Second, Third, and Sixth Affiliated Hospitals of Sun Yat‐Sen University and the Guangzhou First People's Hospital between January 2006 and June 2012, among which follow‐up data were lost in four cases and the reference gene GAPDH was not detected in five cases because the amount of RNA extracted from the samples was insufficient. Thus, only 69 samples were included in the clinicopathological and survival analyses. Clinical information was obtained from the hospital archives. All patients were staged according to the seventh American Joint Committee on Cancer (AJCC) TNM staging system for GC (Edge & Compton, 2010).
Cell lines
EBV‐positive gastric cell lines SNU719 and YCCEL1 cells were purchased from Korean Cell Line Bank and were cultured in RPMI‐1640 medium (Gibco, Carlsbad, CA, USA) supplemented with 10% FBS (Gibco). HEK‐293T cells were cultured in Dulbecco's Modified Eagle's Medium (Gibco) supplemented with 10% FBS. All cells were maintained at 37°C in a humidified atmosphere with 5% CO2.
Generation of SNU‐4th cells
Parental SNU719 cells were passaged in 4‐week‐old female (weight: 18–24 g) NOD/SCID mice (Model Animal Research Center of Nanjing University, Nanjing, China) by subscapular subcutaneous injection of 2 × 10⁶ cells. The 5‐Fu (20 mg/kg, Selleck, Houston, TX, USA) was injected into the tail vein weekly. When the diameter of the xenografts reached 1.5 cm, the mice were euthanized and single‐cell suspensions were obtained by collagenase digestion as described by Ponti et al (2005). Subsequently, H2Kd‐positive mouse cells were removed from freshly isolated cells by flow cytometry, and the purified cells were passaged in 5‐Fu‐treated NOD/SCID mice as described above. After four successive generations, we defined the freshly purified single tumour cells that were obtained from each generation of xenografts treated with 5‐Fu as SNU‐1st, SNU‐2nd, SNU‐3rd and SNU‐4th cell.
RNA preparation, RNase R treatment
Total RNA was extracted from cultured cells, and three pairs of the fourth passage tumour xenografts were treated with 5‐Fu or PBS using TRIzol reagent (Invitrogen, Carlsbad, CA, USA) according to the manufacturer's instruction. Total RNA from formalin‐fixed, paraffin‐embedded EBVaGC tissues was purified using the RNeasy FFPE Kit (Qiagen, Germany) according to the manufacturer's instruction. The Cytoplasmic and Nuclear RNA Purification Kit (Norgen, Thorold, Canada) was used to isolate and purify both cytoplasmic and nuclear RNA following the vendor's protocol.
For RNase R treatment, purified RNA was incubated with 2 U/μg of RNase R (Epicentre, WI, USA) for 20 min at 37°C.
RT–PCR, real‐time PCR and DNA sequencing
cDNA was synthesized using the Evo M‐MLV RT Kit with gDNA Clean (AG, Changsha, China) for mRNAs and the Mir‐X miRNA First‐Strand Synthesis Kit (Takara, Dalian, China) for miRNAs.
For RT–PCR, cDNAs were amplified using SYBR Green Premix Pro Taq HS qPCR Kit (AG, Changsha, China) according to the manufacturer's instruction. The PCR product was analysed by electrophoresis in a 1.8% agarose gel stained with 0.4 mg/ml of ethidium bromide and visualized under UV light.
Real‐time PCR was carried out on an ABI 7500 FAST Real‐Time PCR System (Applied Biosystems, USA) using the SYBR® Premix Ex Taq™II Kit (Takara). GAPDH and U6 were used as internal standard controls for mRNAs and miRNAs, respectively. Each sample was replicated three times, and data were calculated by the ∆∆C T method. The primers used in this study are listed in Table EV3.
DNA sequencing was performed on 3730xl DNA analysers using the ABI PRISM Big Dye Terminator Cycle Sequencing Ready Reaction Kit (PE Applied Biosystems, USA) according to the vendor's protocol. The PCR product was sequenced bidirectionally.
RNA sequencing
The total RNA samples of three pairs of tumour xenografts were subjected to the RiboMinus Eukaryote Kit (Qiagen) to remove ribosomal RNA, followed by linear RNA depletion using RNase R before constructing the RNA sequencing libraries. Strand‐specific RNA‐seq libraries were prepared using the NEBNext Ultra Directional RNA Library Prep Kit for Illumina (NEB, Beverly, MA) following the manufacturer's instructions. Briefly, the digested RNA samples were fragmented and synthesized to cDNA, and then, the purified cDNA was subjected to 12–15 cycles of PCR amplification, and the libraries were quality controlled with a Bioanalyzer 2100 (Agilent, Santa Clara, CA). Finally, the purified cDNA was sequenced in a HiSeq 2000 system (Illumina, San Diego, CA, USA). The RNA‐seq data were deposited in GEO (Accession code: GSE145894).
Identification and annotation of circRNAs
The reference human genome (GRCh38/hg38) was obtained from the UCSC genome browser (http://genome.ucsc.edu/), and the reference EBV genome (Accession No. NC_007605.1) was obtained from NCBI GenBank (http://www.ncbi.nlm.nih.gov/). First, sequencing reads that aligned contiguously and across the full length to the genomes by TopHat2 were removed. Subsequently, the unmapped reads were processed to 20‐nt anchors from both ends and aligned in the reverse orientation (head‐to‐tail) representing a back‐spliced junction. The total number of reads that spanned back‐spliced junctions was used as an absolute measure of the circRNA abundance. The genomic regions that mapped to inferred circRNAs were annotated according to RefSeq, and the corresponding gene of this transcript fragment was defined as the host gene for each circRNA.
RNA in situ hybridization
The existence of EBV in tumour cells was confirmed by ISH with theEBER‐1 probe (PanPath, Amsterdam, the Netherlands), as previously described by Chen et al (2010).
ebv‐circLMP2A and miR‐3908 probes designed and synthesized by RiboBio (Guangzhou, China) were labelled with Cy3 and FITC, respectively. A fluorescence in situ hybridization kit (RiboBio) was used to detect the signal of the probes according to the manufacturer's instruction. The images were obtained using a Nikon A1Si Laser Scanning Confocal Microscope (Nikon, Japan).
CircRNA plasmid construction, lentivirus production and stable transfection
siRNAs targeting to ebv‐circLMP2A were synthesized by RiboBio, and short hairpin RNA (shRNA) plasmid was further constructed by Geneseed Biotech (Guangzhou, China). Transfection was performed using Lipofectamine 3000 (Invitrogen) according to the manufacturer's instruction.
The lentiviral vector for ebv‐circLMP2A over‐expression was constructed by Geneseed Biotech, and the empty lentiviral vector was used as a control. SNU719 and YCCEL1 cells were seeded into 24‐well plates and infected with the corresponding lentivirus along with polybrene (8 μg/ml, Sigma, USA). After 48 h, the transfected cells were selected with puromycin (2 μg/ml, Sigma) for 4–6 weeks, and surviving cells were used as stable transfectants.
Oligonucleotide transfection
The mimic‐nc, miR‐3908 mimic, nc‐inhibitors and miR‐3908 inhibitors were synthesized and purchased from RiboBio. Transfection was carried out using the riboFECT™ CP transfection kit (RiboBio) according to the manufacturer's instruction.
Northern blot analysis
Biotin‐labelled U6 and ebv‐circLMP2A probes were synthesized by RiboBio. The sequence of the U6 probe was CGTGTCATCCTTGCGCAGGGGCCATGCTAATCTTCTCTGTATCGTTCCAATTTTAGTATATGTGCTGCCGA‐biotin, and the sequence of the ebv‐circLMP2A probe was CAGAAGAGAATTAAAAGGTGGGTCCTCAATCCTCCATGTTAGGCAAATTGCAAAGACAAGTGTCCATAGGAGCATGAGAAGGAACATTGTAGTCAAGTTAAGTGTGCCCAAAATCAGTGACGCTAGCAGTGC‐biotin. Briefly, 10 μg total RNA with or without RNase R treatment was loaded on a 15% urea denatured PAGE gel and run in 1× TBE buffer. Then, the RNA was transferred to a Hybond‐N+ membrane (GE Healthcare, Uppsala, Sweden) by capillary transfer. The membrane was washed and the RNA ultraviolet‐crosslinked onto the membrane at 265 nm (UVP, CA, USA). Pre‐hybridization was done at 64°C for 1.5 h, and hybridization with ebv‐circLMP2A probe was performed at 64°C overnight. The membranes were washed twice in 0.2× SSC and 0.1% SDS at 62°C for 30 min. After washing, the blot was visualized using the Immobilon ECL substrate kit (Millipore, Germany).
Biotin‐coupled probe pull‐down assay
Both the oligo and circLMP2A biotinylated probes were designed by RiboBio. The sequence of the oligo probe against the LacZ gene of bacteria used as control was GCTGTATCGCTGGATCAAAT‐biotin, and the sequence of the circLMP2A probe for targeting the back‐spliced sequence of ebv‐circLMP2A was GATACCTGTGAACAGAAACG‐biotin. In brief, 5 × 10⁷ cells were harvested, lysed and sonicated. The lysates were then incubated with 4 μg biotinylated ebv‐circLMP2A probes at 4°C overnight. Subsequently, the biotin‐coupled RNA complex was pulled down by incubating the cell lysates with streptavidin magnetic beads (Life Technologies, CA, USA) for 3 h at 25°C. After washing the beads complex with the wash buffer, the RNA complex bound to the beads was eluted and extracted using the RNeasy Mini Kit (Qiagen) and further analysed by real‐time PCR.
Luciferase reporter assay
The pmiR‐RB‐Report™ 3′UTR was synthesized by RiboBio. HEK‐293T cells were co‐transfected with indicated luciferase reporter plasmids and miRNA mimics using Lipofectamine 3000 (Invitrogen) according to the manufacturer's instructions. Forty‐eight hours after transfection, the dual‐luciferase reporter assay system (Promega, Wisconsin, USA) was used to measure the firefly and renilla luciferase activities using the multi‐label analyser Infinite F500 (TECAN, Austria). Ratios of luminescence from firefly to renilla luciferase were calculated. Each assay was repeated in three independent experiments.
Tumour sphere culture
Cells were seeded into ultra‐low attachment six‐well plates (Corning, USA) at a density of 1,000 cells per well and cultured in suspension in serum‐free RPMI‐1640 (Gibco), supplemented with B27 (1:50, Invitrogen), 50 ng/ml fibroblast growth factor (ProSpec, Israel), 50 ng/ml epidermal growth factor (ProSpec) and 8 μg/ml insulin (Sigma). After 4 weeks, tumour spheres were photographed, and the average number and maximal diameter of spheres were calculated under a microscope in five randomly chosen fields.
Cell proliferation assay
Cells were seeded in 96‐well plates at a density of 5,000 cells per well. Cell viability was measured using the Cell Counting Kit‐8 (CCK‐8) (Dojindo, Japan) on days 1, 2, 3, 4, 5 and 6 according to the manufacturer's instruction, and the absorbance at 450 nm was evaluated using an automatic microplate reader (TECAN, Austria).
Colony formation assay
Cells were plated in six‐well plates at a density of 1,000 cells per well and maintained with RPMI‐1640 medium supplemented with 10% FBS. After 15 days, the cells were fixed with 4% paraformaldehyde and stained with 0.1% crystal violet for 20 min at room temperature. Subsequently, the dye was washed out with PBS, the plates were photographed, and the number of colonies that reached more than 50 cells was calculated.
Cell migration and invasion assay
Cells were resuspended in 200 μl serum‐free RPMI‐1640 medium at a density of 5 × 10⁵ cells/ml and seeded into the upper chambers of each transwell (8 μm pore size, Costar) which was precoated without or with Matrigel (BD Biosciences, USA) for the migration and invasion assays. RPMI‐1640 medium supplemented with 20% FBS was added to the bottom chamber as a chemoattractant. The cells were cultured at 37°C with 5% CO2 for 48 h. Cells in the upper chambers were removed with cotton swabs, and cells on the lower surface were fixed with 4% paraformaldehyde and then stained with 0.1% crystal violet. Five microscopic fields of view were randomly selected for imaging, and the average number of stained cells per high‐power field was calculated. Each assay was repeated in three independent experiments.
Flow cytometry for sorting, apoptosis and side population analysis
For sorting analysis, the freshly isolated cells were incubated with the anti‐H2Kd antibody (BD Pharmingen™, San Diego, USA) at 4°C for 30 min, and the purity of sorted populations was determined by flow cytometry (BD influx, USA). For analysis of the cell surface markers, CD24 (PE‐conjugated) and CD44 (APC‐conjugated) antibodies (BD Pharmingen™) were used and detected by flow cytometry (BD influx, USA).
For apoptosis analysis, cells were stained using an Annexin V, 633 apoptosis kit (Dojindo, Japan) according to the manufacturer's instruction and analysed by flow cytometry (BD influx, USA).
For side population analysis, 500 μl of single‐cell suspensions at a density of 1 × 10⁶ cells/ml was incubated with 50 μM verapamil (MP Biomedicals, California, USA) at 37°C for 30 min. After incubation, 5 μg/ml of the DNA binding dye Hoechst 33342 (MP Biomedicals) was added to the cells and further incubated at 37°C for 90 min in the dark. Subsequently, the cells were washed three times with PBS and analysed by flow cytometry (BD influx, USA). Each assay was repeated in three independent experiments.
Western blotting
Cells were lysed and proteins extracted using the whole protein extraction kit (KeyGen Biotech, Nanjing, China) according to the manufacturer's instructions. The protein concentration was quantified using a bicinchoninic acid (BCA) protein assay kit (Keygen Biotech). Protein extractions were separated by 10% SDS–PAGE and transferred to polyvinylidene fluoride (PVDF) membranes (0.22 μm, Millipore, Germany). Immunoreactive bands were detected using Immobilon ECL substrate kit (Millipore, Germany). The images were acquired using a chemiluminescence system (Bio‐Rad, USA) and analysed using Image Lab Software. The primary antibodies used in this study and the dilutions are listed in Table EV4.
In vivo tumorigenicity experiment
Female 4‐week‐old NOD/SCID mice (weight: 18–24 g) were randomly divided into six groups (six mice per group). SNU‐4th cells with ebv‐circLMP2A knockdown and control vector, and SNU719 and YCCEL1 cells stably transfected with ebv‐circLMP2A over‐expression and control vector were subcutaneously injected into left subscapular region of NOD/SCID mice (2 × 10⁶ cells per mouse). Subsequently, xenograft growth was monitored once a week by measuring the width (W) and length (L) with callipers, and the volume (V) of the xenograft was calculated using the formula V = (W 2 × L)/2. Six weeks after injection, the mice were euthanized and examined for tumour weights and gene expression. For the in vivo tumour metastasis studies, NOD/SCID mice were also divided into six groups as described previously. The above different transfectants were injected into NOD/SCID mice via the tail vein (5 × 10⁶ cells per mouse), respectively. Two months later, mice were imaged using the bioluminescence IVIS Lumina α Imaging System (Caliper Life Sciences, America) and then euthanized.
Immunohistochemistry
The paraffin‐embedded xenografts and 69 EBVaGC paraffin‐embedded samples were cut into 4‐μm‐thick sections. Subsequently, immunohistochemistry analysis was carried out according to a procedure described previously (Gong et al, 2019), with antibodies specific for TRIM59 (1:50 dilution, Abcam, Cat No. ab69639), p53 (1:100 dilution, Cell Signaling Technology, Cat No. #2572) and ERG (1:100 dilution, Dako, Cat No. EP111). The co‐expression of CD24 (1:100 dilution, R&D, Cat No. MAB5248) and CD44 (1:100 dilution, Abcam, Cat No. ab51037) was detected by sequential double‐immunohistochemical staining according to the instructions supplied with the double‐staining DouSP™ Double stain System (Maixin, Fuzhou, China). In the first step, sections were incubated with anti‐CD24 antibody at 4°C overnight after antigen retrieval, followed by incubation with secondary antibody for 10 min. Then, the alkaline phosphatase method was used with BCIP/NBT as a chromogen (dark blue). For the second step, the sections were incubated with anti‐CD44 antibody at 37°C for 1 h, followed by incubation with secondary antibody for 10 min. Immunostaining detection was accomplished using a polymer peroxidase system with the chromogen DAB (brown). CD44+CD24− cells were visualized with a brown cellular membrane. The immunoreactivity in each tissue section was evaluated by two pathologists, and the images were obtained under a microscope (Olympus CX23, Japan) with appropriate magnification.
Statistical analysis
All data are shown as the mean ± standard deviation (SD). Statistical analyses were performed with SPSS 19.0 (IBM SPSS, Chicago, IL, USA), and a P‐value < 0.05 was considered statistically significant. Data differences between two groups were analysed using Student's t‐test or chi‐square test. Pearson's correlation coefficient analysis was carried out to analyse the correlations.
ROC analysis was used to generate a cut‐off value to distinguish between high and low expression of ebv‐circLMP2A, as previously described by Dong et al (2016). For miR‐3908 and TRIM59, the median values were used as cut‐off values to define the subgroups. Overall survival was calculated from the date of surgery to the date of death from any cause or the last day of follow‐up. Survival analysis was performed by Kaplan–Meier methodology and the log‐rank test for significance.
Author contributions
L‐pG designed the study, performed the experiments and wrote the manuscript. J‐nC performed part of the experiments and revised the manuscript, MD and Z‐dX interpreted part of the data and revised the manuscript. Z‐yF, Y‐hP and YZ performed IHC Scoring and provided statistics of data. YD and J‐yZ involved in data curation and formal analysis. Y‐hB, J‐tH and JL involved in collection of clinical specimens. C‐kS designed the study and revised the manuscript.
Conflict of interest
The authors declare that they have no conflict of interest.
Supporting information
Expanded View Figures PDF
Table EV1
Table EV2
Table EV3
Table EV4
Dataset EV1
Dataset EV2
Source Data for Expanded View
Review Process File
Source Data for Figure 1
Source Data for Figure 4
Source Data for Figure 5
Source Data for Figure 7
Source Data for Figure 8
Acknowledgements
This work was supported by the National Natural Science Foundation of China (No. 81572309), the Natural Science Foundation of Guangdong Province (No. 2019A1515011455 & No. 2018A030313650 & No. 2017A030313502), and the Guangzhou Science and Technology Project (No. 201707010119), Guangdong Province, China. The sponsors have no role in the study design, in the collection, analysis and interpretation of data, in the writing of the manuscript, and in the decision to submit the article for publication.
EMBO Reports (2020) 21: e49689
Data availability
The circRNA‐seq data produced in this study are available at the Gene Expression Omnibus under the accessgseion code GSE145894 (https://www.ncbi.nlm.nih.gov/geo/query/acc.cgi?acc=GSE145894).
References
- Abbaszadegan MR, Bagheri V, Razavi MS, Momtazi AA, Sahebkar A, Gholamin M (2017) Isolation, identification, and characterization of cancer stem cells: a review. J Cell Physiol 232: 2008–2018 [DOI] [PubMed] [Google Scholar]
- Ajani JA, Song S, Hochster HS, Steinberg IB (2015) Cancer stem cells: the promise and the potential. Semin Oncol 42(Suppl 1): S3–S17 [DOI] [PubMed] [Google Scholar]
- Cancer Genome Atlas Research Network (2014) Comprehensive molecular characterization of gastric adenocarcinoma. Nature 513: 202–209 [DOI] [PMC free article] [PubMed] [Google Scholar]
- Cao Y, Yang L, Jiang W, Wang X, Liao W, Tan G, Liao Y, Qiu Y, Feng D, Tang F et al (2014) Therapeutic evaluation of Epstein‐Barr virus‐encoded latent membrane protein‐1 targeted DNAzyme for treating of nasopharyngeal carcinomas. Mol Ther 22: 371–377 [DOI] [PMC free article] [PubMed] [Google Scholar]
- Chen JN, Ding YG, Feng ZY, Li HG, He D, Du H, Wu B, Shao CK (2010) Association of distinctive Epstein‐Barr virus variants with gastric carcinoma in Guangzhou, southern China. J Med Virol 82: 658–667 [DOI] [PubMed] [Google Scholar]
- Chen W, Zhao K, Miao C, Xu A, Zhang J, Zhu J, Su S, Wang Z (2017) Silencing Trim59 inhibits invasion/migration and epithelial‐to‐mesenchymal transition via TGF‐beta/Smad2/3 signaling pathway in bladder cancer cells. Onco Targets Ther 10: 1503–1512 [DOI] [PMC free article] [PubMed] [Google Scholar]
- Chen X, Chen RX, Wei WS, Li YH, Feng ZH, Tan L, Chen JW, Yuan GJ, Chen SL, Guo SJ et al (2018) PRMT5 Circular RNA promotes metastasis of urothelial carcinoma of the bladder through sponging miR‐30c to induce epithelial‐mesenchymal transition. Clin Cancer Res 24: 6319–6330 [DOI] [PubMed] [Google Scholar]
- Cherubini A, Barilani M, Rossi RL, Jalal MMK, Rusconi F, Buono G, Ragni E, Cantarella G, Simpson H, Peault B et al (2019) FOXP1 circular RNA sustains mesenchymal stem cell identity via microRNA inhibition. Nucleic Acids Res 47: 5325–5340 [DOI] [PMC free article] [PubMed] [Google Scholar]
- Choy EY, Siu KL, Kok KH, Lung RW, Tsang CM, To KF, Kwong DL, Tsao SW, Jin DY (2008) An Epstein‐Barr virus‐encoded microRNA targets PUMA to promote host cell survival. J Exp Med 205: 2551–2560 [DOI] [PMC free article] [PubMed] [Google Scholar]
- Dawood S, Austin L, Cristofanilli M (2014) Cancer stem cells: implications for cancer therapy. Oncology 28: 1101–1107, 1110 [PubMed] [Google Scholar]
- Dong M, Wang HY, Zhao XX, Chen JN, Zhang YW, Huang Y, Xue L, Li HG, Du H, Wu XY et al (2016) Expression and prognostic roles of PIK3CA, JAK2, PD‐L1, and PD‐L2 in Epstein‐Barr virus‐associated gastric carcinoma. Hum Pathol 53: 25–34 [DOI] [PubMed] [Google Scholar]
- Edge SB, Compton CC (2010) The American Joint Committee on Cancer: the 7th edition of the AJCC cancer staging manual and the future of TNM. Ann Surg Oncol 17: 1471–1474 [DOI] [PubMed] [Google Scholar]
- Fukayama M, Hino R, Uozaki H (2008) Epstein‐Barr virus and gastric carcinoma: virus‐host interactions leading to carcinoma. Cancer Sci 99: 1726–1733 [DOI] [PMC free article] [PubMed] [Google Scholar]
- Ghini F, Rubolino C, Climent M, Simeone I, Marzi MJ, Nicassio F (2018) Endogenous transcripts control miRNA levels and activity in mammalian cells by target‐directed miRNA degradation. Nat Commun 9: 3119 [DOI] [PMC free article] [PubMed] [Google Scholar]
- Gong LP, Chen JN, Xiao L, He Q, Feng ZY, Zhang ZG, Liu JP, Wei HB, Shao CK (2019) The implication of tumor‐infiltrating lymphocytes in Epstein‐Barr virus‐associated gastric carcinoma. Hum Pathol 85: 82–91 [DOI] [PubMed] [Google Scholar]
- Hatakeyama S (2011) TRIM proteins and cancer. Nat Rev Cancer 11: 792–804 [DOI] [PubMed] [Google Scholar]
- Hsiao KY, Lin YC, Gupta SK, Chang N, Yen L, Sun HS, Tsai SJ (2017a) Noncoding effects of circular RNA CCDC66 promote colon cancer growth and metastasis. Can Res 77: 2339–2350 [DOI] [PMC free article] [PubMed] [Google Scholar]
- Hsiao KY, Sun HS, Tsai SJ (2017b) Circular RNA ‐ new member of noncoding RNA with novel functions. Exp Biol Med 242: 1136–1141 [DOI] [PMC free article] [PubMed] [Google Scholar]
- Huang JT, Chen JN, Gong LP, Bi YH, Liang J, Zhou L, He D, Shao CK (2019) Identification of virus‐encoded circular RNA. Virology 529: 144–151 [DOI] [PubMed] [Google Scholar]
- Jin X, Feng CY, Xiang Z, Chen YP, Li YM (2016) CircRNA expression pattern and circRNA‐miRNA‐mRNA network in the pathogenesis of nonalcoholic steatohepatitis. Oncotarget 7: 66455–66467 [DOI] [PMC free article] [PubMed] [Google Scholar]
- Khan G, Hashim MJ (2014) Global burden of deaths from Epstein‐Barr virus attributable malignancies 1990‐2010. Infect Agents Cancer 9: 38 [DOI] [PMC free article] [PubMed] [Google Scholar]
- Khan MI, Czarnecka AM, Helbrecht I, Bartnik E, Lian F, Szczylik C (2015) Current approaches in identification and isolation of human renal cell carcinoma cancer stem cells. Stem Cell Res Ther 6: 178 [DOI] [PMC free article] [PubMed] [Google Scholar]
- Kong QL, Hu LJ, Cao JY, Huang YJ, Xu LH, Liang Y, Xiong D, Guan S, Guo BH, Mai HQ et al (2010) Epstein‐Barr virus‐encoded LMP2A induces an epithelial‐mesenchymal transition and increases the number of side population stem‐like cancer cells in nasopharyngeal carcinoma. PLoS Pathog 6: e1000940 [DOI] [PMC free article] [PubMed] [Google Scholar]
- Kristensen LS, Okholm TLH, Veno MT, Kjems J (2018) Circular RNAs are abundantly expressed and upregulated during human epidermal stem cell differentiation. RNA Biol 15: 280–291 [DOI] [PMC free article] [PubMed] [Google Scholar]
- Kristensen LS, Andersen MS, Stagsted LVW, Ebbesen KK, Hansen TB, Kjems J (2019) The biogenesis, biology and characterization of circular RNAs. Nat Rev Genet 20: 675–691 [DOI] [PubMed] [Google Scholar]
- Li Y, Zheng Q, Bao C, Li S, Guo W, Zhao J, Chen D, Gu J, He X, Huang S (2015a) Circular RNA is enriched and stable in exosomes: a promising biomarker for cancer diagnosis. Cell Res 25: 981–984 [DOI] [PMC free article] [PubMed] [Google Scholar]
- Li Z, Huang C, Bao C, Chen L, Lin M, Wang X, Zhong G, Yu B, Hu W, Dai L et al (2015b) Exon‐intron circular RNAs regulate transcription in the nucleus. Nat Struct Mol Biol 22: 256–264 [DOI] [PubMed] [Google Scholar]
- Li Y, Shan F, Chen J (2017) Lipid raft‐mediated miR‐3908 inhibition of migration of breast cancer cell line MCF‐7 by regulating the interactions between AdipoR1 and Flotillin‐1. World J Surg Oncol 15: 69 [DOI] [PMC free article] [PubMed] [Google Scholar]
- Liu X, Chen J, Zhang J (2017) AdipoR1‐mediated miR‐3908 inhibits glioblastoma tumorigenicity through downregulation of STAT2 associated with the AMPK/SIRT1 pathway. Oncol Rep 37: 3387–3396 [DOI] [PubMed] [Google Scholar]
- Lun SW, Cheung ST, Lo KW (2014) Cancer stem‐like cells in Epstein‐Barr virus‐associated nasopharyngeal carcinoma. Chin J Cancer 33: 529–538 [DOI] [PMC free article] [PubMed] [Google Scholar]
- Marquitz AR, Mathur A, Nam CS, Raab‐Traub N (2011) The Epstein‐Barr Virus BART microRNAs target the pro‐apoptotic protein Bim. Virology 412: 392–400 [DOI] [PMC free article] [PubMed] [Google Scholar]
- Morales‐Sanchez A, Fuentes‐Panana EM (2017) Epstein‐Barr virus‐associated gastric cancer and potential mechanisms of oncogenesis. Curr Cancer Drug Targets 17: 534–554 [DOI] [PubMed] [Google Scholar]
- Murphy G, Pfeiffer R, Camargo MC, Rabkin CS (2009) Meta‐analysis shows that prevalence of Epstein‐Barr virus‐positive gastric cancer differs based on sex and anatomic location. Gastroenterology 137: 824–833 [DOI] [PMC free article] [PubMed] [Google Scholar]
- Patrawala L, Calhoun T, Schneider‐Broussard R, Zhou J, Claypool K, Tang DG (2005) Side population is enriched in tumorigenic, stem‐like cancer cells, whereas ABCG2+ and ABCG2‐ cancer cells are similarly tumorigenic. Can Res 65: 6207–6219 [DOI] [PubMed] [Google Scholar]
- Ponti D, Costa A, Zaffaroni N, Pratesi G, Petrangolini G, Coradini D, Pilotti S, Pierotti MA, Daidone MG (2005) Isolation and in vitro propagation of tumorigenic breast cancer cells with stem/progenitor cell properties. Can Res 65: 5506–5511 [DOI] [PubMed] [Google Scholar]
- Port RJ, Pinheiro‐Maia S, Hu C, Arrand JR, Wei W, Young LS, Dawson CW (2013) Epstein‐Barr virus induction of the Hedgehog signalling pathway imposes a stem cell phenotype on human epithelial cells. J Pathol 231: 367–377 [DOI] [PubMed] [Google Scholar]
- Reya T, Morrison SJ, Clarke MF, Weissman IL (2001) Stem cells, cancer, and cancer stem cells. Nature 414: 105–111 [DOI] [PubMed] [Google Scholar]
- Sun Y, Ji B, Feng Y, Zhang Y, Ji D, Zhu C, Wang S, Zhang C, Zhang D, Sun Y (2017) TRIM59 facilitates the proliferation of colorectal cancer and promotes metastasis via the PI3K/AKT pathway. Oncol Rep 38: 43–52 [DOI] [PMC free article] [PubMed] [Google Scholar]
- Toptan T, Abere B, Nalesnik MA, Swerdlow SH, Ranganathan S, Lee N, Shair KH, Moore PS, Chang Y (2018) Circular DNA tumor viruses make circular RNAs. Proc Natl Acad Sci USA 115: E8737–E8745 [DOI] [PMC free article] [PubMed] [Google Scholar]
- Tsai CY, Liu YY, Liu KH, Hsu JT, Chen TC, Chiu CT, Yeh TS (2017) Comprehensive profiling of virus microRNAs of Epstein‐Barr virus‐associated gastric carcinoma: highlighting the interactions of ebv‐Bart9 and host tumor cells. J Gastroenterol Hepatol 32: 82–91 [DOI] [PubMed] [Google Scholar]
- Ungerleider N, Concha M, Lin Z, Roberts C, Wang X, Cao S, Baddoo M, Moss WN, Yu Y, Seddon M et al (2018) The Epstein Barr virus circRNAome. PLoS Pathog 14: e1007206 [DOI] [PMC free article] [PubMed] [Google Scholar]
- Yang CF, Yang GD, Huang TJ, Li R, Chu QQ, Xu L, Wang MS, Cai MD, Zhong L, Wei HJ et al (2016) EB‐virus latent membrane protein 1 potentiates the stemness of nasopharyngeal carcinoma via preferential activation of PI3K/AKT pathway by a positive feedback loop. Oncogene 35: 3419–3431 [DOI] [PubMed] [Google Scholar]
- Yip YL, Lin W, Deng W, Jia L, Lo KW, Busson P, Verillaud B, Liu X, Tsang CM, Lung ML et al (2018) Establishment of a nasopharyngeal carcinoma cell line capable of undergoing lytic Epstein‐Barr virus reactivation. Lab Invest 98: 1093–1104 [DOI] [PubMed] [Google Scholar]
- Yu F, Yao H, Zhu P, Zhang X, Pan Q, Gong C, Huang Y, Hu X, Su F, Lieberman J et al (2007) let‐7 regulates self renewal and tumorigenicity of breast cancer cells. Cell 131: 1109–1123 [DOI] [PubMed] [Google Scholar]
- Yu CY, Li TC, Wu YY, Yeh CH, Chiang W, Chuang CY, Kuo HC (2017) The circular RNA circBIRC6 participates in the molecular circuitry controlling human pluripotency. Nat Commun 8: 1149 [DOI] [PMC free article] [PubMed] [Google Scholar]
- Zhao J, Lee EE, Kim J, Yang R, Chamseddin B, Ni C, Gusho E, Xie Y, Chiang CM, Buszczak M et al (2019) Transforming activity of an oncoprotein‐encoding circular RNA from human papillomavirus. Nat Commun 10: 2300 [DOI] [PMC free article] [PubMed] [Google Scholar]
- Zhou Z, Ji Z, Wang Y, Li J, Cao H, Zhu HH, Gao WQ (2014) TRIM59 is up‐regulated in gastric tumors, promoting ubiquitination and degradation of p53. Gastroenterology 147: 1043–1054 [DOI] [PubMed] [Google Scholar]
- Zhu P, Zhu X, Wu J, He L, Lu T, Wang Y, Liu B, Ye B, Sun L, Fan D et al (2019) IL‐13 secreted by ILC2s promotes the self‐renewal of intestinal stem cells through circular RNA circPan3. Nat Immunol 20: 183–194 [DOI] [PubMed] [Google Scholar]
Associated Data
This section collects any data citations, data availability statements, or supplementary materials included in this article.
Supplementary Materials
Expanded View Figures PDF
Table EV1
Table EV2
Table EV3
Table EV4
Dataset EV1
Dataset EV2
Source Data for Expanded View
Review Process File
Source Data for Figure 1
Source Data for Figure 4
Source Data for Figure 5
Source Data for Figure 7
Source Data for Figure 8
Data Availability Statement
The circRNA‐seq data produced in this study are available at the Gene Expression Omnibus under the accessgseion code GSE145894 (https://www.ncbi.nlm.nih.gov/geo/query/acc.cgi?acc=GSE145894).


