

Abstract
Single nucleotide polymorphisms (SNPs) in TMEM106B encoding the lysosomal type II transmembrane protein 106B increase the risk for frontotemporal lobar degeneration (FTLD) of GRN (progranulin gene) mutation carriers. Currently, it is unclear if progranulin (PGRN) and TMEM106B are synergistically linked and if a gain or a loss of function of TMEM106B is responsible for the increased disease risk of patients with GRN haploinsufficiency. We therefore compare behavioral abnormalities, gene expression patterns, lysosomal activity, and TDP‐43 pathology in single and double knockout animals. Grn −/−/Tmem106b −/− mice show a strongly reduced life span and massive motor deficits. Gene expression analysis reveals an upregulation of molecular signature characteristic for disease‐associated microglia and autophagy. Dysregulation of maturation of lysosomal proteins as well as an accumulation of ubiquitinated proteins and widespread p62 deposition suggest that proteostasis is impaired. Moreover, while single Grn −/− knockouts only occasionally show TDP‐43 pathology, the double knockout mice exhibit deposition of phosphorylated TDP‐43. Thus, a loss of function of TMEM106B may enhance the risk for GRN‐associated FTLD by reduced protein turnover in the lysosomal/autophagic system.
Keywords: FTD, neurodegeneration, progranulin, TDP‐43, TMEM106B
Subject Categories: Molecular Biology of Disease, Neuroscience
Loss of TMEM106B expression aggravates the mild phenotype of Grn knockout mice, suggesting that the FTLD‐associated TMEM106B SNPs might cause partial loss of function.
Introduction
Frontotemporal lobar degeneration (FTLD) is the second most common pre‐senile neurodegenerative disease after Alzheimer's disease and is predominantly characterized by either tau or TAR DNA‐binding protein 43 (TDP‐43) depositions. Clinically, FTLD‐TDP patients present with behavior and personality changes as well as speech disabilities (Snowden et al, 2006). In addition, many patients show an overlap with motor neuron diseases like amyotrophic lateral sclerosis (ALS) (Hardy & Rogaeva, 2014). A strong family history of dementia is present in FTD patients, implicating a significant genetic component. C9orf72 repeat expansions (DeJesus‐Hernandez et al, 2011; Renton et al, 2011) and progranulin (PGRN) haploinsufficiency are common causes of familial FTLD with TDP‐43 pathology (FTLD‐TDP) (Baker et al, 2006; Cruts et al, 2006; Gass et al, 2006). PGRN appears to exhibit neurotrophic and anti‐inflammatory activities (Bateman et al, 2018). In addition, loss of PGRN is linked to dysfunctional lysosomal degradation and autophagy (Chang et al, 2017; Kao et al, 2017). While patients with PGRN haploinsufficiency show lysosomal abnormalities and present with some biochemical phenotypes of neuronal ceroid lipofuscinosis (NCL) (Gotzl et al, 2014; Ward et al, 2017), homozygous mutations leading to total loss of PGRN result in classical NCL (Smith et al, 2012; Almeida et al, 2016). PGRN is upregulated upon lysosomal dysfunction (Capell et al, 2011) and co‐regulated with other lysosomal genes (Sardiello et al, 2009; Belcastro et al, 2011). Furthermore, PGRN is transported to lysosomes (Hu et al, 2010; Zhou et al, 2015) where it is processed by lysosomal proteases to granulin peptides (Holler et al, 2017; Lee et al, 2017; Zhou et al, 2017b). Lysosomal gene expression in Grn knockout mice is upregulated during aging (Gotzl et al, 2014; Klein et al, 2017) or injury (Tanaka et al, 2013, 2017; Beel et al, 2017). In line with lysosomal dysfunction in GRN‐associated FTLD, aged Grn knockout mice are characterized by accumulation of lipofuscin, saposin D, the autophagy markers SQSTM1/p62 and ubiquitin. It is still puzzling that TDP‐43 pathology is abundant in GRN patients, but only occasionally observed in aged Grn knockout mice (Ahmed et al, 2010; Yin et al, 2010a; Ghoshal et al, 2012; Petkau et al, 2012; Wils et al, 2012; Gotzl et al, 2014; Tanaka et al, 2014).
The high variability in age of onset as well as the incomplete penetrance of GRN mutations led to the search for genetic risk factors in a genome‐wide association study (GWAS), which identified single nucleotide polymorphisms (SNPs) in the TMEM106B locus that segregate with GRN‐associated FTLD (Van Deerlin et al, 2010). TMEM106B risk variants are also associated with C9orf72 repeat mutations (van Blitterswijk et al, 2014; Gallagher et al, 2014), TDP‐43 pathology, severity of GRN independent FTLD, and other neurodegenerative disorders (Rutherford et al, 2012; Murray et al, 2014; Nelson et al, 2015; Yu et al, 2015). The most significant SNPs are in high linkage disequilibrium with a SNP that leads to a threonine to serine exchange at amino acid 185. The minor protective S185 allele is underrepresented in FTLD and may thus reduce the risk of GRN mutation carriers (Cruchaga et al, 2011; Finch et al, 2011; van der Zee et al, 2011). However, contradictory findings make it difficult to understand how TMEM106B and PGRN functionally interact to increase the risk for FTLD‐TDP. There is some evidence that the risk haplotype enhances inflammatory gene expression (Rhinn & Abeliovich, 2017; Ren et al, 2018), whereas the protective variant provides neuroprotection (Li et al, 2020). Functionally, TMEM106B is linked to the lysosomal protein degradation pathway and autophagy suggesting an interaction with similar functions of PGRN. TMEM106B is an endo‐lysosomal type 2 transmembrane protein and plays a crucial role in regulating lysosomal size, morphology, subcellular trafficking, and acidification (Chen‐Plotkin et al, 2012; Lang et al, 2012; Brady et al, 2013; Schwenk et al, 2014; Stagi et al, 2014). In neurons, TMEM106B overexpression leads to enlarged lysosomes, inhibits their acidification and transport, and results in accumulation of LAMP1‐positive structures at the cell soma (Stagi et al, 2014). This may be in line with increased mRNA and protein levels (Van Deerlin et al, 2010; Nicholson et al, 2013; Gallagher et al, 2017) in FTLD‐TDP patients (Van Deerlin et al, 2010; Chen‐Plotkin et al, 2012; Gotzl et al, 2014). This would also be consistent with the observation that a Tmem106b knockout rescues lysosomal deficits in Grn knockout mice (Klein et al, 2017). However, knockdown of TMEM106B also results in clustering of lysosomes in nuclear proximity and enhanced retrograde transport in dendrites (Schwenk et al, 2014; Clayton et al, 2018). Moreover, similar to TMEM106B overexpression, TMEM106B deficiency in mice also results in impaired lysosomal acidification and reduced lysosomal enzyme activities (Klein et al, 2017; Arrant et al, 2018) and altered axonal transport accompanied by accumulation of lipofuscin and autophagosomes (Luningschror et al, 2020). Thus, it is currently unclear if a loss or a gain of function contributes to the elevated risk for FTLD.
To understand a potential pathological consequence and synergistic effects of PGRN and TMEM106B loss of function, we investigated single knockout and double knockout animals. Surprisingly, we found that loss of TMEM106B strongly enhanced age‐related PGRN phenotypes resulting in robust TDP‐43 pathology, early lysosomal dysfunction accompanied by an accumulation of ubiquitinated proteins, severe microgliosis/astrogliosis, and dramatically reduced life span. This suggests that the TMEM106B risk alleles may modulate GRN‐associated FTLD via a loss‐of‐function mechanism.
Results
Loss of PGRN and TMEM106B leads to early motor deficits in mice
To understand the contribution of a loss of function of TMEM106B to FTLD pathology, we generated Grn/Tmem106b double knockout animals. The Tmem106b −/− mouse line was generated by injection of targeted ES cells (KOMP clone EPD0047_1_E02) into BALB/C blastocysts. Germline transmission of the tm2a allele (Wtsi lacZ genetrap “knockout first” cassette between exon3 and exon4) was verified, and the mice were bred with constitutively Cre recombinase expressing mice to delete exon 4 and generate the Tmem106b −/− (tm2b) founder generation (Fig 1A) (see also (Luningschror et al, 2020)). Grn −/−/Tmem106b −/− mice were generated by crossing Tmem106b −/− mice with Grn −/− mice (Kayasuga et al, 2007). All genotypes were verified by Western blotting (Fig 1B). In contrast to the single knockout lines, double knockout Grn −/−/Tmem106b−/− mice showed a reduced life expectancy. According to animal welfare practices, we had to sacrifice these mice at 16–18 weeks of age when they reached pre‐defined endpoint criteria. The hind‐leg clasping reflex test revealed an overt phenotypic difference between 3‐month‐old Grn −/−/Tmem106b −/− mice and single knockout littermates or wild‐type (WT) mice. Grn −/−/Tmem106b −/− mice showed sustained hind limb clasping associated with trunk flexion while single knockout and WT mice held their hind limbs apart with paw external rotation (Fig 1C). Furthermore, the rotarod test confirmed motor incoordination in Grn −/−/Tmem106b −/− mice (Fig 1D). The motor deficits of the Grn −/−/Tmem106b −/− mice, visible by shaking‐like movements and paresis of hind limbs, increased with age to a stage in which the mice could not turn back, when they were manually flipped over (Fig 1E and Movie EV1). To investigate whether the total loss of TMEM106B and PGRN is required for developing such a strong phenotype, we analyzed Grn −/+/Tmem106b −/− mice. Although the hind‐leg clasping reflex was normal (Fig 1C) and the mice could not be turned on their back, rotarod performance was significantly impaired compared to WT but significantly improved compared to double knockout mice (Fig 1D). Thus, reduced PGRN levels in combination with TMEM106B loss of function exacerbate the rather mild phenotypes of the individual knockouts. However, the strong effect on life expectancy only occurred upon total loss of both proteins PGRN and TMEM106B.
Figure 1. Early motor deficits in Grn −/−/Tmem106b −/− mice.
- Schema of the mouse wild‐type and mutant Tmem106b locus. The tm2a allele carries a LacZ‐Neo selection cassette in intron 3 and a loxP‐flanked exon 4. Upon Cre recombinase expression in the germline, exon 4 is deleted and Tmem106b expression abolished (tm2b allele).
- Western blot analysis of total brain lysates of wild‐type, Tmem106b −/− , Grn −/− and Grn −/−/Tmem106b −/− mice using antibody 6F2 to detect TMEM106B. (4.5‐month‐old mice with the given genotype; n = 3 biological replicates per genotype).
- Hind limb clasping test wild‐type, Tmem106b −/− , Grn −/−, Grn +/−/Tmem106b −/− and Grn −/−/Tmem106b −/− mice. Representative pictures are shown of three mice analyzed for each genotype at 3 months of age.
- Rotarod performance of wild‐type, Tmem106b −/− , Grn −/−, Grn +/−/Tmem106b −/− and double knockout animals at 3–4 months of age. Number of animals used for analysis, 10 wild‐type, 12 Tmem106b −/−, five Grn −/−, seven Grn +/−/Tmem106b −/−, three Grn −/−/Tmem106b −/− mice.
- Representative picture of a 4.5‐month‐old double knockout (Grn −/−/Tmem106b −/−) mouse after manual flip.
Enhanced dysregulation of genes in the double knockout is associated with microglia and astrocyte function
To specify functional changes in Grn −/−/Tmem106b −/− mice, we analyzed the expression of genes associated with neurodegenerative diseases using the nCounter® Neuropathology panel (NanoString Technologies) in total brain of 4.5‐month‐old mice. Genes expressed in neurons, astrocytes, microglia, oligodendrocytes, and endothelial cells, addressing six fundamental themes of neurodegeneration including neurotransmission, neuron–glia interaction, neuroplasticity, cell structure integrity, neuroinflammation, and metabolism, were analyzed. Gene expression levels of 760 genes in each sample were normalized against the geometric mean of 10 housekeeping genes. The most significant dysregulation of genes was found in Grn −/−/Tmem106b −/− mice (Fig 2A–C). While in single knockout mice expression of genes was altered no more than two‐fold up or 0.5‐fold down, in the double knockout mice 23 genes were dysregulated above/below these values. Overlap in gene expression was considered if a gene was significantly changed in the respective mouse models with more than 20% change in at least one mouse model. Most overlap exists between Tmem106b −/− and Grn −/−/Tmem106b −/− mice (15 genes, 10 up, five down), while the strongest modulation occurs in a gene cluster associated with activated microglia in Grn −/− and Grn −/−/Tmem106b −/− mice (Cd68, C1qc) or in all three mouse models (Trem2, C1qa, C1qb; Fig 2D). Notably, almost all overlapping genes are regulated in the same direction. The double knockout mice show the strongest effects, and the changes in gene expression are not simply the additive effects of single knockout mice (Fig 2D). In line with previous findings, pathway analyses revealed upregulation of gene clusters associated with activated microglia, autophagy (Lui et al, 2016; Gotzl et al, 2019), and angiogenesis in Grn −/− mice and in Tmem106b −/− mice (Fig 2E). Scores of these gene clusters were strongly elevated in the double knockout animals (Fig 2E), suggesting severe microgliosis and deficits in protein degradation. Moreover, all downregulated genes in Grn −/−/Tmem106b −/− mice are associated with “axon and dendrite structure” and “neural connectivity”. The strongest downregulation in Grn −/−/Tmem106b −/− mice was observed for genes affecting “myelination” (Fa2h, Mog, Mag, Ugt8a, Mal; Fig 2C). Note that downregulation of myelination‐associated genes could be confirmed on the protein level (Fig EV1). Interestingly, in several pathways associated with neuronal function like “neuronal cytoskeleton”, “myelination”, “axon and dendrite structure”, and “vesicle trafficking”, a high score is only observed in double knockout mice, while single knockout mice show no changes (Fig 2E).
Figure 2. Expression analysis reveals global dysregulation of gene clusters associated with autophagy and microglial activation in double knockout mice.

-
A–CVolcano plot of differentially expressed brain mRNAs of 4.5‐month‐old mice (n = 3 biological replicates per genotype) detected by the Neuropathology panel of NanoString. Expression changes were only taken into consideration when the extent of change was above 20% as indicated by vertical lines for all volcano plots. Gliosis‐ and myelination‐related genes are highlighted if changes are above 20%. Fold changes are displayed after log2 transformation. (A) Comparison of differentially expressed brain mRNAs from Tmem106b −/− and wild‐type mice. From 680 detected genes, 21 are significantly upregulated, while 10 are significantly reduced. (B) Comparison of Grn −/− and wild‐type mice. From 680 detected genes, 12 are significantly upregulated, while six are significantly reduced. (C) Volcano plot for Grn −/−/Tmem106b −/− and wild‐type mice. From 680 detected genes, 79 are significantly upregulated, while 24 are significantly reduced.
-
DDisplay of differently expressed genes overlapping between the analyzed genotypes from (A–C). Overlap was considered if a gene was significantly changed in the respective mouse models with more than 20% change in at least one mouse model. Note that nine genes are significantly altered in all three genotypes in comparison to the wild type. Seven genes are exclusively overlapping between the Grn −/− and the Grn −/−/Tmem106b −/− mice. Tmem106b −/− and Grn −/−/Tmem106b −/− mice share 15 significantly altered genes. Tmem106b −/− and Grn −/− mice share one significant altered gene. Data represent the mean ± SD.
-
EGene set analysis based on NanoString advanced analysis R‐script included in the Neuropathology panel.
Figure EV1. Reduced abundance of myelination‐related proteins in Grn −/−/Tmem106b −/− mice.
- Western blot analysis of the myelin basic protein (MBP) and the myelin oligodendrocyte glycoprotein (MOG) in RIPA total brain lysates from 4.5‐month‐old mice with the indicated genotype (n = 3 biological replicates per genotype).
- Quantification of (A). Protein expression was normalized to levels in wild‐type animals. Data represent the mean ± SD.
Besides upregulated genes associated with hyperactivated microglia, Gfap is 6.5‐fold upregulated and therefore after Cd68, which is eight‐fold upregulated, the second strongest upregulated gene in the double knockout mice (Fig 2C). Thus, we also addressed glial pathology by analyzing gene expression using the nCounter® Neuroinflammation panel (NanoString Technologies) covering 757 genes and 13 housekeeping in total brain of 4.5‐month‐old mice. Gene expression levels were analyzed as described for the nCounter® Neuropathology panel. As expected expression changes in the single knockout mice are low, no gene reaches a two‐fold or 0.5‐fold change in expression (Fig 3A and B). The double knockout mice show again the strongest effects with 27 genes either with a two‐fold or 0.5‐fold change, and 126 genes with more than 20% change (Fig 3C). Changes in gene expression are not simply additive (Fig 3D). Ninteen genes were altered in all three mouse models and 17 genes altered in the double knockout together with either single knockout (Fig 3D). As observed for the Neuropathology panel, almost all overlapping genes are regulated in the same direction. Downregulation overlapped only in Tmem106b −/− and Grn −/−/Tmem106b −/− mice, while upregulation overlapped more between Grn −/− and Grn −/−/Tmem106b −/− mice in astrocytic and microglial expressed genes (Fig 3D). Furthermore, all inflammation‐associated pathways, like “innate and adaptive”, “immune response”, “inflammatory signaling”, and “astrocyte and microglia function”, were slightly upregulated in Grn −/− mice and strongly increased in Grn −/−/Tmem106b −/− mice (Fig 3E). Thus, the hyperactivated microglial state identified in the Neuropathology panel was confirmed with the Neuroinflammation panel. In line with expression changes of genes associated with myelination, detected in the Neuropathology panel, “oligodendrocyte function” is also strongly reduced in the double knockout (Fig 3E).
Figure 3. Expression analysis reveals enhanced dysregulation of genes associated with microglia and astrocyte function.
-
A–CAnalysis of brain mRNA expression of 4.5‐month‐old mice (five wild‐type, four Grn −/−, four Tmem106b −/−, five Grn −/−/Tmem106b −/− mice) detected by the Neuroinflammation panel by NanoString. Expression changes were only taken into consideration when the extent of change was above 20% as indicated by vertical lines for in all volcano plots. Gliosis‐related genes are highlighted if changes are above 20%. Fold changes are displayed after log2 transformation. (A) Comparison of differentially expressed mRNA of Tmem106b −/− mice in comparison to wild‐type mice. From 622 detected genes, 21 are significantly upregulated, while 12 are significantly reduced. (B) Comparison of differentially expressed mRNA in Grn −/− and wild‐type mice. From 622 detected genes, 32 are significantly upregulated, while only one is significantly reduced. (C) Volcano plot of differentially expressed brain mRNAs from Grn −/−/Tmem106b −/− mice in comparison to wild‐type mice. From 622 detected genes, 110 are significantly upregulated, while 16 are significantly reduced.
-
DDisplay of differently expressed genes overlapping between the analyzed genotypes from (A–C). Overlap was considered if a gene was significantly changed in the respective mouse models with more than 20% change in at least one mouse model. Note that 19 genes are significantly altered in all three genotypes in comparison to the wild type. Seventeen genes are exclusively overlapping between the Grn −/− and the Grn −/−/Tmem106b −/− mice. Tmem106b −/− and Grn −/−/Tmem106b −/− mice share 17 significantly altered genes. Data represent the mean ± SD.
-
EGene set analysis based on NanoString advanced analysis R‐script included in the Neuroinflammation panel.
Exaggerated gliosis in young Grn −/−/Tmem106b −/− mice
To validate the changes of the mRNA signature at the protein level, we performed biochemical analyses of total brain homogenate from 4.5‐month‐old mice. This confirmed a significant 3.4‐ to 4.7‐fold increase of GFAP and IBA1 expression in Grn −/−/Tmem106b −/− mice (Fig 4A and B) which is in line with strong astrogliosis and microgliosis in the double knockout. Importantly and consistent with our previous findings in Grn −/− mice (Gotzl et al, 2014), at this age no microgliosis and astrogliosis was apparent in the single knockouts (Fig 4A and B). Next, we investigated by immunohistochemistry which brain regions were particularly affected by gliosis. Astrogliosis and microgliosis were most prominent in the thalamus, pons and medulla, midbrain, cerebellum, and cerebral cortex of the double knockout mice (Figs 4C and D, and EV2A and B). To confirm enhanced microgliosis in double knockout mice in vivo, we performed previously established TSPO‐μPET (Brendel et al, 2016; Gotzl et al, 2019). A higher increase of TSPO signals between 2‐ and 3.5‐month‐old Grn −/−/Tmem106b −/− mice compared to WT was detected in the regions of accelerated astro‐ and microgliosis, like thalamus, pons and medulla, midbrain, and cerebellum (Fig 4E). To further investigate microglial activation in the different mouse lines, we analyzed protein expression of CD68, CLEC7A, TREM2, and ApoE in total brain extracts of 4.5‐month‐old mice (Fig 5A). Quantification revealed a significant increase of all four proteins in Grn −/−/Tmem106b −/− mice (Fig 5B). Only TREM2 was also significantly elevated in Grn −/− mice (Fig 5B). In Grn −/−/Tmem106b −/− mice, most IBA1‐positive microglia are also positive for CLEC7A, CD68, and to a lower extent for TREM2 confirming activated microglia already at the age of 4.5 months (Fig 5C–E).
Figure 4. Astrogliosis and microgliosis in different brain regions of Grn −/−/Tmem106b −/− mice.
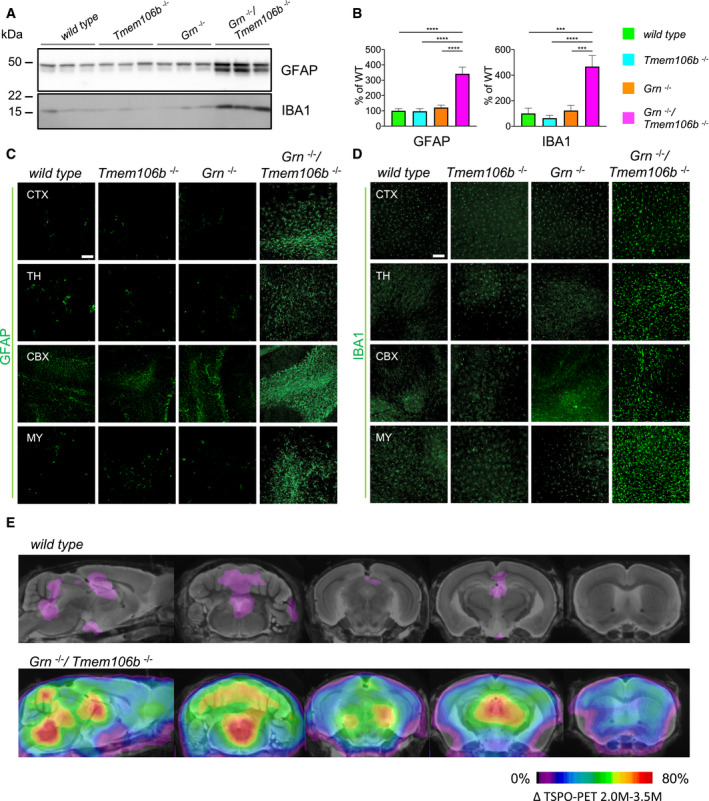
- Western blot analysis of GFAP and IBA1 in total brain lysates from 4.5‐month‐old mice with the given genotype (n = 3 biological replicates per genotype).
- Quantification of (A). Protein expression was normalized to levels in wild‐type animals. Data represent the mean ± SD.
- Expression of GFAP in sagittal brain sections. Representative images of indicated brain regions (CBX, cerebellum; CTX, cortex; MY, medulla; TH, thalamus). Scale bar indicates 100 μm.
- Expression of IBA1 in sagittal brain sections. Representative images of indicated brain regions (CBX, cerebellum; CTX, cortex; MY, medulla; TH, thalamus). Scale bar indicates 100 μm.
- In vivo 18F‐GE180 TSPO μPET imaging. Two female Grn −/−/Tmem106b −/− and five female wild‐type mice underwent longitudinal TSPO μPET at 2.0 and 3.5 months of age. All analyses were performed by PMOD (V3.5, PMOD technologies). Normalization of injected activity was performed by the previously validated myocardium correction method.
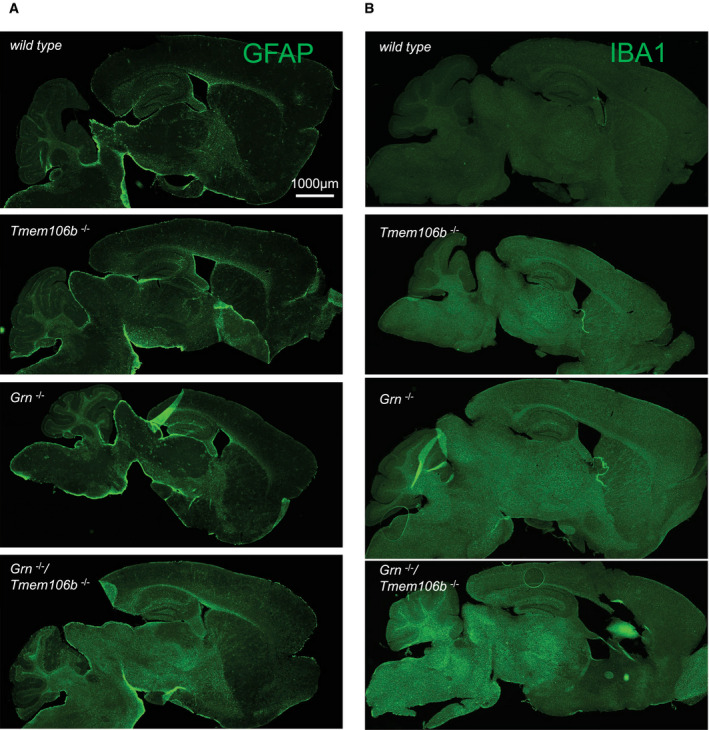
Figure EV2. Increased gliosis in sagittal brain sections of Grn −/−/Tmem106b −/− mice.
-
A, BGliosis analyzed by immunofluorescence staining of GFAP (A) and IBA1 (B) in sagittal brain sections. Whole brain section of 4.5‐month‐old mice, all genotypes acquired by same acquisition conditions. Scale bar indicates 1,000 μm.
Figure 5. Enhanced expression of proteins associated with activated microglia in Grn −/−/Tmem106b −/− mice.
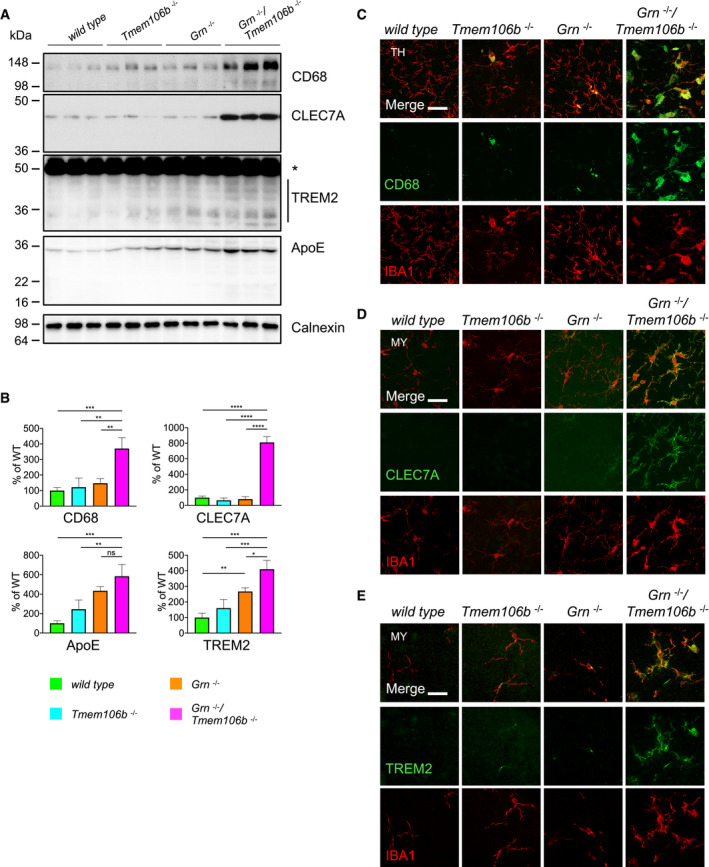
- Western blot analysis of CD68, CLEC7A, TREM2, and ApoE in total brain lysates from 4.5‐month‐old mice with the given genotype. Asterisk indicates unspecific band (n = 3 biological replicates per genotype).
- Quantification of (A). Protein expression was normalized to levels in wild‐type animals. Data represent the mean ± SD.
- Expression of CD68 and the microglial marker IBA1 in sagittal brain sections. Representative images of indicated brain regions (TH, thalamus). Scale bar indicates 25 μm.
- Expression of CLEC7A and the microglial marker IBA1 in sagittal brain sections. Representative images of indicated brain regions (MY, medulla). Scale bar indicates 25 μm.
- Expression of TREM2 and the microglial marker IBA1 in sagittal brain sections. Representative images of indicated brain regions (MY, medulla). Scale bar indicates 25 μm.
The strong motor phenotype together with the gliosis in regions of the brainstem let us additionally analyze the spinal cord for astrogliosis and microgliosis. Again, only Grn −/−/Tmem106b −/− mice show a strongly increased expression of GFAP and CD68, a microglial lysosomal membrane protein, in both white and gray matter (Fig EV3).
Figure EV3. Increased gliosis in the spinal cord of Grn −/−/Tmem106b −/− mice.
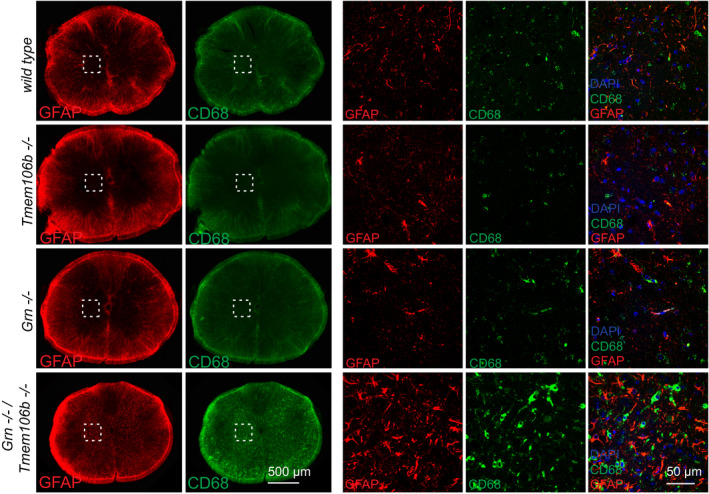
Astrogliosis and microgliosis in spinal cord sections analyzed by immunofluorescence staining of GFAP and CD68. Scale bar indicates 500 μm in overview and 50 μm in insert.
Enhanced lysosomal and autophagic dysfunction in Grn −/−/Tmem106b −/− mice
Activation of microglia is accompanied by elevated expression of lysosomal cathepsins, which was described for aged Grn −/− mice (Ahmed et al, 2010; Wils et al, 2012; Tanaka et al, 2013; Gotzl et al, 2014; Klein et al, 2017). In line with these observations, Grn −/−/Tmem106b −/− mice show elevated levels of the cathepsin D, cathepsin B, and cathepsin L compared to WT and single knockout mice (Fig 6A and B). The elevated CatD and CatL expression levels result in significantly increased enzymatic activities compared to WT and single knockout mice (Fig 6C). Elevated lysosomal protease expression and lysosomal activity often indicate impaired protein degradation and accumulation of autophagy cargo as observed in NCL mouse models (Gotzl et al, 2014) and in aged Grn knockout mice (Ahmed et al, 2010; Wils et al, 2012; Gotzl et al, 2014). Furthermore, autophagy is among the strongest hits in the pathway analysis of both NanoString panels (Figs 2E and 3E); therefore, we next investigated accumulation of autophagic cargo. Since the complete loss of PGRN results in a NCL‐like storage phenotype with exaggerated deposition of lipofuscin in aged mice (Kleinberger et al, 2013), we investigated the autofluorescence signal in single and double knockout mice. Lipofuscin is detectable predominantly in the thalamus of the double knockout mice, while the single knockout mice show weak (Tmem106b −/−) or no lipofuscin deposition (Grn −/−) at 4.5 months of age (Fig 7A). Interestingly, in Grn −/−/Tmem106b −/− mice lipofuscin accumulation partially overlaps with the microglia marker IBA1, which may suggest early degradation deficits in microglia (Fig 7A). Lipofuscin accumulation indicates a dysfunction in protein degradation as described for NCL (Palmer et al, 2013) and GRN‐associated FTLD (Ward et al, 2017). Since protein aggregates and long‐lived proteins are normally cleared by autophagy, we investigated the multifunctional adaptor protein p62/sequestosome1 (p62/SQSTM1), which directs ubiquitinated cargos for autophagy. Indeed, Grn −/−/Tmem106b −/− mice show robustly elevated p62/SQSTM1 levels in RIPA and urea lysates compared to single knockout and WT mice (Fig 7B and C). The accumulation of p62/SQSTM1 in the urea lysate reflects reduced solubility and indicates elevated protein aggregation. Furthermore, p62/SQSTM1 accumulates in all brain regions associated with elevated astrogliosis and microgliosis of Grn −/−/Tmem106b −/− mice including the spinal cord (Figs 7D and EV3). Co‐staining of p62/SQSTM1 with NeuN, Iba1, or GFAP shows that most p62/SQSTM1 accumulates in neurons and not in microglia or astrocytes (Figs 7E and F). The minor co‐localization of p62 with microglia is also supported by little overlay in the cerebellar staining (Fig EV4). In line with accumulation of the p62/SQSTM1, ubiquitinated proteins are significantly increased and autophagosomes are accumulated, as indicated by elevated LC3II levels, in double knockout mice compared to single knockout mice (Fig 7B and C).
Figure 6. Elevated lysosomal enzyme levels and activity in Grn −/−/Tmem106b −/− mice.
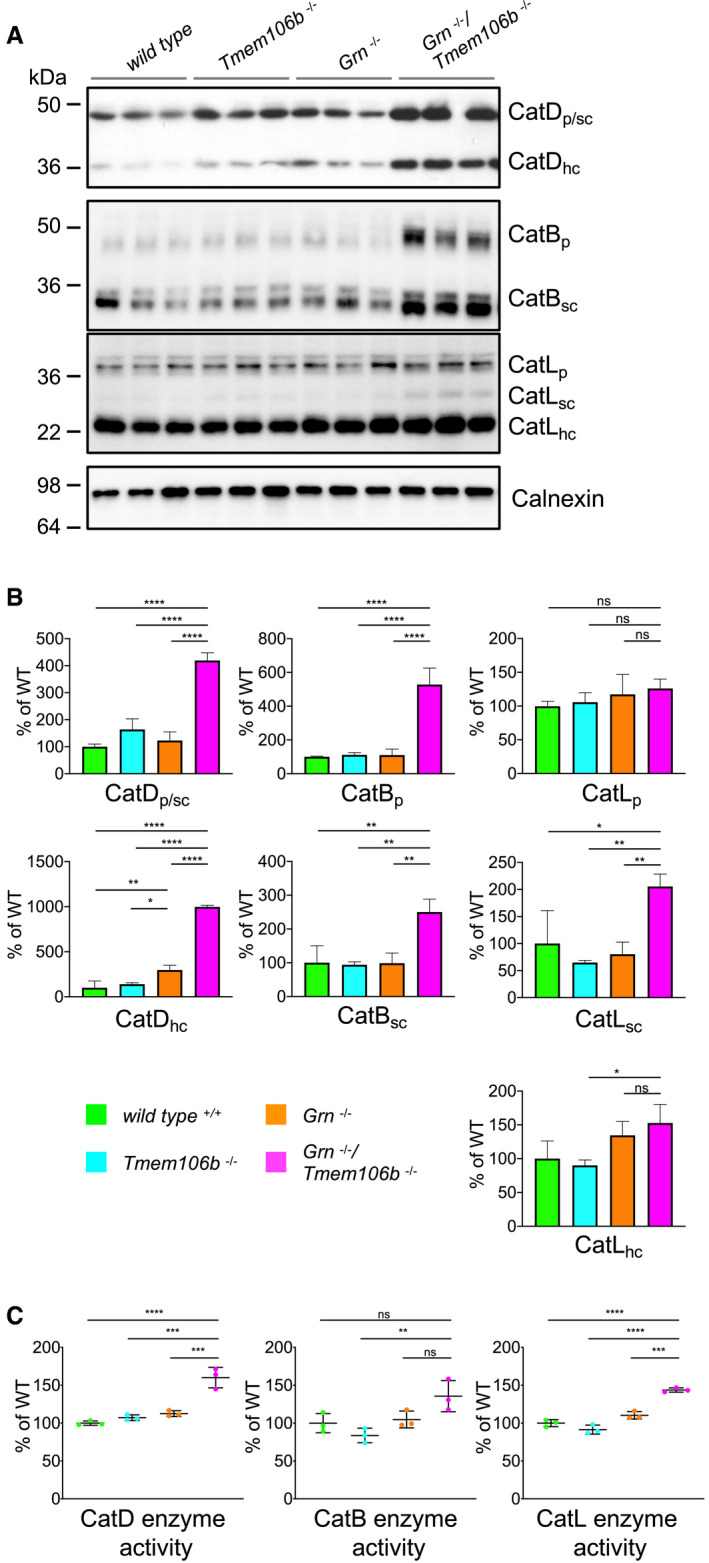
- Western blot analysis of cathepsin (Cat) D, B, and L in total brain lysates from 4.5‐month‐old mice with the indicated genotype. Different maturation variants are indicated (hc, heavy chain; p, preform; sc, single chain; n = 3 biological replicates per genotype).
- Quantification of proteolytically generated variants of cathepsin D, B, and L normalized to levels in wild‐type animals from (A). Data represent the mean ± SD.
- Catalytic activity of cathepsin D, B, and L. Total brain lysates from 4.5‐month‐old mice were incubated with quenched fluorogenic substrate for Cat D, Cat B, and Cat L. The linear increase of fluorescence signal was measured and then normalized to wild type. Data represent the mean normalized activity ± SD (n = 3 biological replicates per genotype).
Figure 7. Widespread impairment of autophagy and protein degradation in Grn −/−/Tmem106b −/− mice.
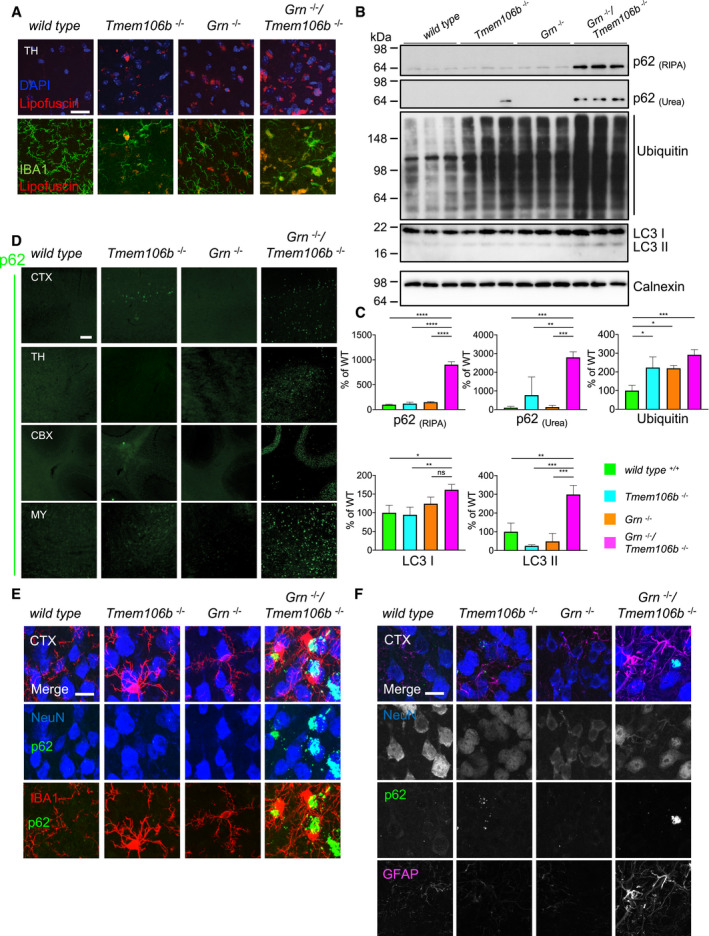
- Immunofluorescence analysis of lipofuscin (red) and IBA1 (green) in sagittal brain sections. Representative images of the thalamus (TH). Scale bar indicates 25 μm.
- Western blot analysis of ubiquitin and the autophagy marker LC3 in RIPA, and p62 in RIPA and urea total brain lysates from 4.5‐month‐old mice with the indicated genotype. Calnexin used as a loading control. (n = 3 biological replicates per genotype).
- Quantification of (B). Protein expression was normalized to levels in wild‐type animals. Data represent the mean ± SD.
- Immunofluorescence analysis of p62 in sagittal brain sections. Representative images of indicated brain regions (CBX, cerebellum; CTX, cortex; MY, medulla; TH, thalamus). Scale bar indicates 100 μm.
- Localization of p62 mainly in NeuN‐positive cells in the cortex (CTX) of 4.5‐month‐old mice. Minor overlap of aggregates with microglial marker IBA1. Scale bar indicates 15 μm.
- Complete overlap of co‐staining of p62 with NeuN in the cortex (CTX) and not with the reactive astrocyte marker GFAP. Scale bar indicates 15 μm.
Figure EV4. Overview of brain regions with p62‐positive aggregates.
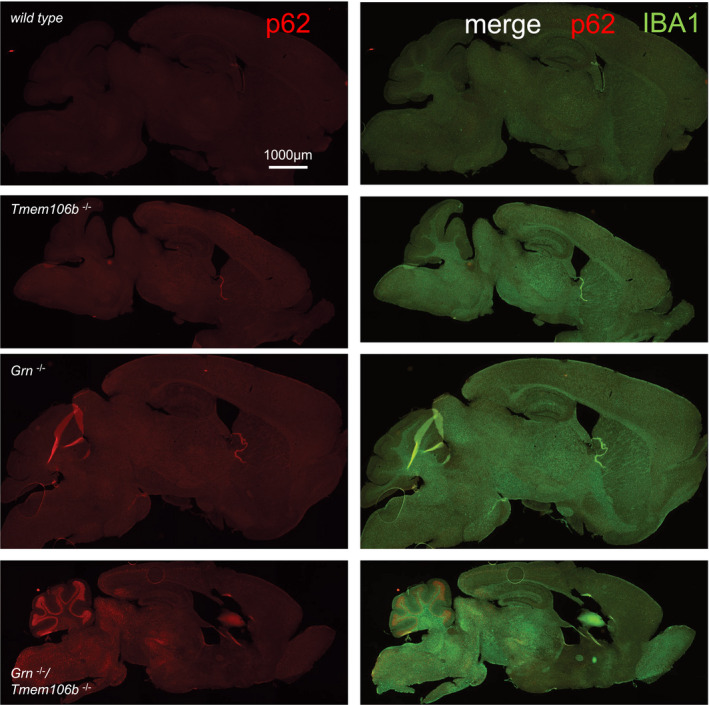
Immunofluorescence staining of p62 in sagittal brain sections. Merge of p62 and IBA1 staining from EV2. Whole brain section of 4.5‐month‐old mice, all images acquired by identical acquisition conditions. Scale bar indicates 1,000 μm.
Accelerated TDP‐43 aggregation and phosphorylation in Grn −/−/Tmem106b −/− mice
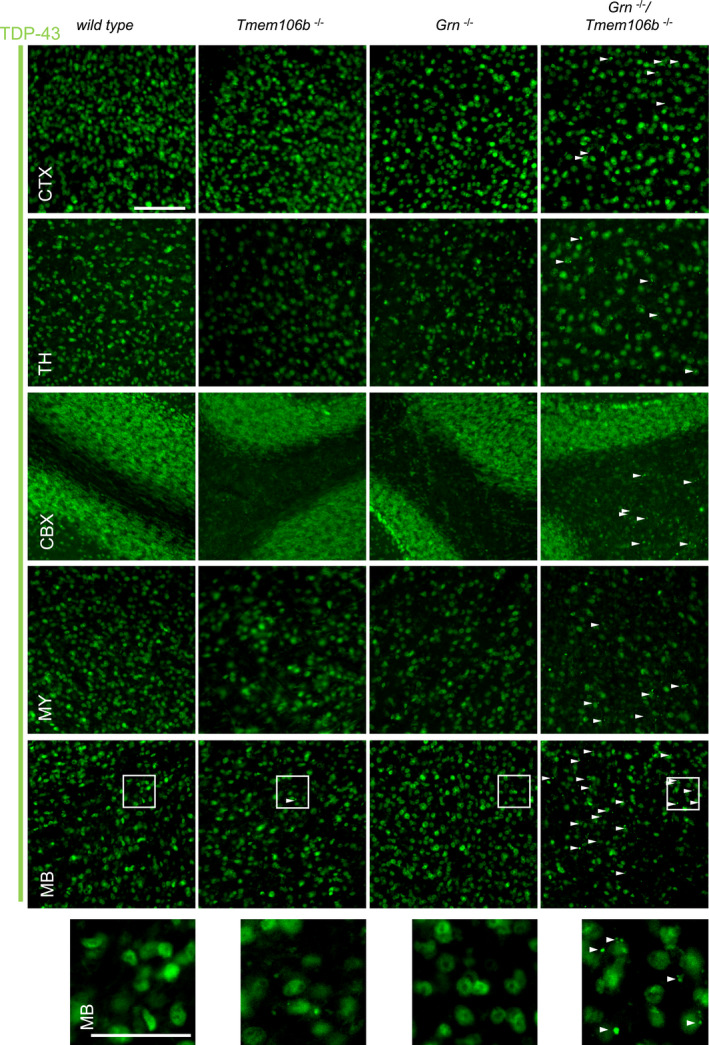
The pathological hallmarks of GRN‐associated FTLD are nuclear and cytoplasmic, ubiquitin positive inclusions composed of phosphorylated TDP‐43 and its proteolytically generated C‐terminal fragments. In aged Grn knockout mice, cytoplasmic TDP‐43 depositions were only occasionally detected (Guo et al, 2010; Kleinberger et al, 2010; Yin et al, 2010b). To address the question if the additional loss of TMEM106B promotes TDP‐43 pathology in the Grn knockout mice, we performed immunohistochemistry. Small cytoplasmic TDP‐43 inclusions were detected throughout the brain of Grn −/−/Tmem106b −/− mice (Figs 8A and EV5). They were less frequent in the cortex and most abundant in the midbrain (Fig 8A). Some of the inclusions also contain TDP‐43 phosphorylated at amino acids 409/410, a specific hallmark of FTLD‐TDP (Hasegawa et al, 2008; Neumann et al, 2009) (Fig 8B). Sequential high salt (HS), RIPA, and urea extraction of total brain homogenate revealed slightly reduced levels of TDP‐43 holoprotein in the HS fraction of the Grn −/−/Tmem106b −/− mice compared to WT and Tmem106b −/− mice (Fig 8C and D), but elevated levels of a RIPA‐extracted C‐terminal TDP‐43 fragments of approximately 35 kDa (Fig 8C and D). Moreover, phosphorylated TDP‐43, specifically detected in the urea fraction, is significantly elevated in the double knockout mice (Fig 8C and D).
Figure 8. Enhanced TDP‐43 aggregation and phosphorylation in Grn −/−/Tmem106b −/− mice.
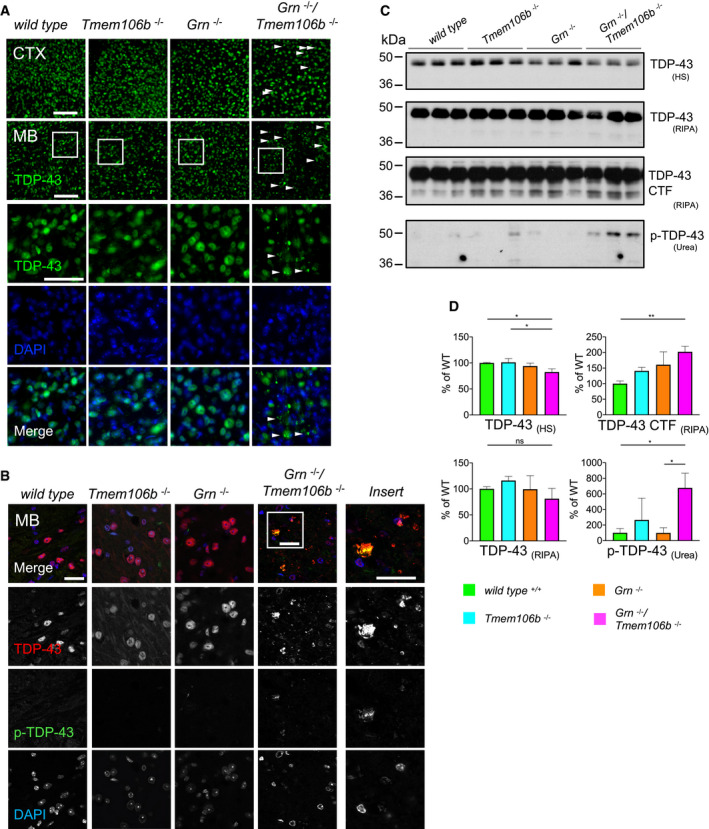
- Immunofluorescence analysis of TDP‐43 in sagittal brain sections. Representative images of indicated brain regions (CTX, cortex; MB, midbrain). White arrow heads indicate TDP‐43 aggregation. Scale bar indicates 100 μm. Zoom in on TDP‐43 aggregation in double knockout mouse brain sections of the midbrain, scale bar zoom in indicates 50 μm (animals 4.5 months of age).
- Immunofluorescence analysis of total TDP‐43 and phosphorylated TDP‐43 (p‐TDP-43) in sagittal brain sections by confocal microscopy. Representative images of one confocal layer in the midbrain. Zoom in on TDP‐43 aggregation in double knockout mouse brain sections of the midbrain. Scale bar indicates 25 μm (animals 4.5 months of age).
- Western blot analysis of TDP‐43 and phosphorylated TDP‐43 (p‐TDP-43) in sequential high salt (HS)/RIPA/Urea fractionations of total brain lysates from 4.5‐month‐old mice with the indicated genotype. Analysis of C‐terminal fragments of TDP‐43 (CTF) in RIPA fraction. p‐TDP-43 analyzed in Urea fraction (n = 3 biological replicates per genotype).
- Quantification of (C). Protein expression was normalized to levels in wild‐type animals. Data represent the mean ± SD.
Figure EV5. Enhanced TDP‐43 aggregation in different brain regions of Grn −/−/Tmem106b −/− mice.
Immunofluorescence analysis of TDP‐43 in sagittal brain sections of 4.5‐month‐old mice. Representative images of indicated brain regions (CBX, cerebellum; CTX, cortex; MB, midbrain; MY, medulla; TH, thalamus). White arrow heads indicate TDP‐43 aggregates. Scale bar indicates 100 μm. Zoom in on TDP‐43 aggregates in double knockout mouse brain sections of the midbrain, scale bar zoom in indicates 50 μm.
Discussion
In this study, we demonstrate that the combined knockout of Tmem106b and Grn accelerates the phenotypes of the individual knockout mice suggesting that a loss of function of TMEM106B further promotes Grn‐associated FTLD.
Motor impairment is an early and very prominent phenotype detected in Grn −/−/Tmem106b −/− mice and to a much lesser extent in Grn +/−/Tmem106b −/− mice already at 3 months of age (Fig 1C–E). Hind limb clasping and paralysis has been observed in a number of mouse models for neurodegenerative diseases like Alzheimer's disease, Parkinson's disease, and other tauopathies (http://www.informatics.jax.org/mp/annotations/MP:0001513) and may indicate progression of neurodegeneration, including cerebellar ataxia. In addition, several FTD/ALS mouse models (Wils et al, 2010; Le et al, 2016; Liu et al, 2016) as well as autophagy‐related mouse models (Komatsu et al, 2005; Hara et al, 2006) present with similar motor deficits. Impaired autophagy has been associated with many neurodegenerative diseases (Nixon, 2013) including FTD/ALS (Gotzl et al, 2016). In Tmem106b and Grn double knockout mice, dysfunction in the lysosomal/autophagic degradation is indicated by accumulation of lipofuscin, ubiquitinated proteins, and the cargo adaptor protein p62 (Fig 6A–E). P62 interacts with autophagic substrates and delivers them to autophagosomes for degradation. Since p62 is also degraded during this process, accumulation of p62 suggests that the turnover of autophagosomes may be delayed which is also indicated by LC3II accumulation. Elevated autophagy associated with an increase of autophagosomes and cargo adaptor proteins is unlikely since mRNA expression of autophagy initiating genes and cargo adaptors is not elevated. However, we cannot distinguish between a failure of autophagosome/lysosome fusion or lysosomal degradation of engulfed autolysosome since both would result in cargo, p62 and LC3II accumulation.
A significant contribution of dysfunctional autophagy to the prominent phenotype of the double knockout mice is further supported by “autophagy” being one of the strongest hits in the pathway analysis of the nCounter® Neuropathology gene expression panel (Fig 2E). Indicators of impaired protein degradation are also detected in single knockout mice, albeit to a much lesser extent. In line with our earlier findings (Gotzl et al, 2018), “autophagy” was also one of the strongest hits in the pathway analysis in Grn −/− mice (Fig 2E). Furthermore, in line with previous findings (Ahmed et al, 2010; Ghoshal et al, 2012; Wils et al, 2012; Petkau et al, 2016; Beel et al, 2017; Tanaka et al, 2017; Zhou et al, 2017a; Gotzl et al, 2018) Grn −/− mice also showed impaired protein degradation but recognizable effects occur after the age 6 months.
Besides PGRN, the lysosomal transmembrane protein TMEM106B is linked to lysosomal integrity and function (Chen‐Plotkin et al, 2012; Lang et al, 2012; Brady et al, 2013; Schwenk et al, 2014; Stagi et al, 2014). In cell culture, loss of TMEM106B affects lysosomal positioning and trafficking (Schwenk et al, 2014; Stagi et al, 2014) leading to reduced stress resistance (Stagi et al, 2014). However, overexpression also results in dysfunctional and enlarged lysosomes (Chen‐Plotkin et al, 2012; Brady et al, 2013; Stagi et al, 2014) causing a translocation of the autophagy regulation transcription factor EB (TFEB) to nuclei (Stagi et al, 2014). Since such prominent phenotypes were detected in cellular systems, it is surprising that some Tmem106b knockout mouse models revealed only minor changes in lysosomal integrity (Klein et al, 2017; Arrant et al, 2018; Nicholson et al, 2018). We demonstrate that 4.5‐month‐old Tmem106b knockout mice show ubiquitin accumulation and few p62‐positive inclusions in cortex and cerebellum (Fig 6A and C). Additionally, it was recently demonstrated that these mice show vacuolization in thalamus and facial motor nucleus accompanied by large LAMP1‐positive membrane structures (Luningschror et al, 2020). Mechanistically, this could be explained by an enhanced retrograde axonal transport of lysosomes followed by an accumulation of endo‐/lysosomal membrane structures at the axon initial segment, which may result in reduced fusion of lysosomes with autophagosomes. Reduced fusion may lead to impaired autophagic degradation in Tmem106b mice (Luningschror et al, 2020). Therefore, the strong phenotype of the Grn −/−/Tmem106b −/− mice could be the consequence of disturbed lysosomal (Beel et al, 2017; Tanaka et al, 2017; Zhou et al, 2017a) and autophagic activities (Chang et al, 2017) in neurons and microglia.
In clear contrast to our observations, additional loss of TMEM106B has recently been reported to protect against the FTLD‐like phenotypes in Grn −/− mice (Klein et al, 2017), while our findings and those published independently by two other research teams in this issue of EMBO Reports (Feng et al, 2020a; Zhou et al, 2020a) even demonstrate prominent gliosis, premature death, and exacerbated FTLD‐like pathology. Klein et al report an increase in several lysosomal enzymes and their activity in 2‐month‐old Grn −/− mice. These enhanced activities of lysosomal enzymes are reduced upon additional TMEM106B knockout. However, lipofuscin accumulation is not reduced, which indicates that dysfunction in protein degradation is not improved. One may speculate that the elevated lysosomal enzyme levels and activities in Grn −/− mice, which predominantly occur in non‐microglial cells (Gotzl et al, 2018), could be a rescue attempt in response to the lysosomal dysfunction. Lysosomal dysfunction shows the strongest effects in microglia since these cells have the highest PGRN expression (Lui et al, 2016; Gotzl et al, 2018) and are the degradation hub in the brain. Thus, with additional loss of TMEM106B the ability to upregulate such rescue mechanisms may be lost or overcome by factors released from malfunctional microglia. In line with the idea that TMEM106B plays a role in regulating a lysosomal rescue mechanism, it has been shown that TMEM106B knockdown reduces the signaling of TFEB (Stagi et al, 2014), a master regulator of the lysosomal autophagic pathway (Settembre & Ballabio, 2011; Settembre et al, 2011).
Loss of TMEM106B in Grn −/− mice dramatically enhanced astrogliosis and microgliosis (Fig 4). Note, that 7‐ to 18‐month‐old Grn −/− mice show similar progressive astrogliosis and microgliosis (Ahmed et al, 2010; Yin et al, 2010b; Ghoshal et al, 2012; Petkau et al, 2012; Wils et al, 2012) but the double knockout mice develop these phenotypes already before 4.5 months of age. Furthermore, “activated microglia”, “innate and adaptive immune response”, “inflammatory signaling”, and “astrocyte function” are the strongest hits in the gene expression pathway analysis (Figs 2E and 3E). Several genes related to inflammation and disease‐associated microglia (DAM) are already slightly upregulated in the brain of Grn −/− mice (Figs 2B and 3B) and further increased in Grn −/−/Tmem106b −/− mice (Figs 2C and 3C). Of note, the double knockout of Grn −/−/Tmem106b −/− shifts the change in the mRNA signature to a much earlier time point as observed in Grn −/− alone (Lui et al, 2016; Gotzl et al, 2019). Among the strongest hits in double knockouts are mostly microglial expressed genes such as Cd68, Trem2, Tyrobp, Apoe, and complement factors but also genes associated with astrocyte activation such as Gfap, Serpina3n, and C4a (Figs 2C and 3C). Additionally, we detect in 4.5‐month‐old double knockouts reduced gene expression of myelination‐associated genes (Fa2h, Mog, Mag, Ugt8a, Mal) and reduced protein levels of MOG and MAP (Fig EV1) which is in line with recent publications describing myelination deficits upon TMEM106B deficiency or loss of function (Feng et al, 2020b; Ikemoto et al, 2020; Zhou et al, 2020b).
Finally, the question arises how PGRN and TMEM106B deficiency results in lysosomal dysfunction affecting mainly microglia, which initiates autophagic cargo protein accumulation and pathological TDP‐43 deposition in neurons. Since PGRN is mainly expressed in microglia, whereas TMEM106b is ubiquitously expressed within the brain (with the lowest expression in microglia), it is tempting to speculate that microglia lacking PGRN may initiate a pathological crosstalk to neurons. Another option would be that TMEM106B‐deficient neurons required protective support from microglia, which could not be provided upon additional PGRN deficiency. In the same vein, malfunctioned oligodendrocytes may not receive support in the absence of PGRN. These scenarios suggest that dysfunctional microglia cannot appropriately communicate with other brain cells or are unable to compensate neuronal or oligodendrocyte defects.
Materials and Methods
Animal experiments
All animal experiments were performed according to German animal welfare law and approved by the government of upper Bavaria. Mice were kept under standard housing conditions including standard pellet food and water provided ad libitum. Recombinant mouse ES cells carrying loxP sites flanking Exon 4 of Tmem106b (tm2a allele) were provided by the KOMP consortium (Clone EPD0047_1_E02). Blastocyst injection of the tm2a allele carrying ES cells leads to chimeric mice that were further bread with Cre deleter mice after germline transmission to obtain the Tmem106b −/− mouse line. The Grn −/− mouse line was kindly provided by Dr. M. Nishihara. Breeding and behavior tests were performed under the animal license: ROB‐55.2‐2532.Vet_02‐17‐106. Mice were perfused with PBS after deep/lethal anesthesia.
Rotarod behavior test
The rotarod test was conducted in accordance with European and national guidelines, and all experiments were performed with the researcher blinded to the genotype. The spindle speed was accelerated from 5 to 50 rpm over 5 min. The test finished either when the mouse dropped down or after the time limit of 5 min. After three rounds of training on three individual days, the average time of three trials with 1‐h break in between was used.
In vivo μPET imaging
Small animal positron emission tomography (μPET) procedures followed an established standardized protocol for radiochemistry, acquisition, and post‐processing (Brendel et al, 2016). In brief, 18F‐GE180 TSPO μPET with an emission window of 60–90 min post‐injection was used to measure cerebral microglial activity. Two female Grn −/− &Tmem106b −/− and five female wild‐type mice underwent longitudinal TSPO μPET at 2.0 and 3.5 months of age. All analyses were performed by PMOD (V3.5, PMOD technologies, Basel, Switzerland). Normalization of injected activity was performed by the previously validated myocardium correction method (Deussing et al, 2018). TSPO μPET estimates (percentage changes over time) deriving from a brainstem target VOI (7 mm³) were extracted and compared descriptively between the two age and genotype groups. Percentage difference maps were calculated for the changes between baseline and follow‐up for the averaged images of Grn −/−/Tmem106b −/− and wild type.
Gene expression profiling and data analysis
Snap‐frozen brain hemispheres were mechanically powdered in liquid nitrogen. Following total RNA isolation with the Qiagen RNeasy Mini Kit, 80 ng total RNA per sample was used for gene expression profiling with the nCounter® Neuropathology panel from NanoString (NanoString Technologies). Expression analysis on the nCounter® Neuroinflammation panel was conducted using 60 ng of total RNA per sample. NanoString reads for all samples were analyzed and normalized using the nSolver software including the R plugin for advanced gene set analysis (NanoString Technologies). The geometric mean of the on‐chip housekeeping genes was used for normalization of reads. The mean of each group was used for calculation of the fold changes. For the Neuropathology panel, each group contained an n of three animals. The Neuroinflammation panel was conducted on six wild‐type, four Grn −/− and four Tmem106b −/−single knockout, and five double knockout Grn −/−/Tmem106b −/− mice. Detailed information on mice used is listed in Table EV1. Volcano plots were generated by plotting the log2‐transformed changes between wild‐type and individual groups, against the calculated values of significance with the software GraphPad Prism 8.
Western blotting and antibodies
Mice were PBS perfused, and for biochemically analysis, each brain hemisphere was snap‐frozen in liquid nitrogen and mechanically ground to powder. Brain powder was lysed in RIPA buffer (150 mM NaCl, 20 mM Tris–HCl pH 7.4, 1% NP40, 0.05% Triton X‐100, 0.5% sodium deoxycholate, 2.5 mM ETDA) using the Precellys lysing kit (Ref.: P00933‐LYSK0‐A; Bertin Technologies). Supernatants were collected after centrifugation at 17,000 g, 4°C, and protein concentration was determined using the bicinchoninic acid assay (Interchim Bioscience). For analysis of TDP‐43 and p62, proteins were sequentially isolated as described previously (Gotzl et al, 2014). All samples were boiled in Laemmli buffer, and proteins were separated on Tris‐glycine gels. Proteins were transferred onto polyvinylidene difluoride membranes or nitrocellulose membranes (both GE Healthcare Life Science). HRP‐conjugated antibodies and Pierce™ ECL Plus Western Blotting Substrate (Thermo Fisher Scientific) were used for visualization. The following antibodies were used for Western blotting: TMEM106B (clone 6F2, (Lang et al, 2012)), GFAP (DAKO, Z0334), IBA1 (GeneTex, GTX100042), CD68 (Abcam, ab125212), CLEC7A (R&D Systems, AF1756), TREM2 (clone 5F4, (Xiang et al, 2016), p62 (MBL, PM045), LC3 (Novusbio, NB100), Ubiquitin (Santa Cruz, clone P4D1), Cathepsin D (Santa Cruz, sc‐6486), Cathepsin B (R&D Systems, AF965), Cathepsin L (R&D Systems, AF1515), TDP‐43 (Proteintech, 12892‐2AP), and Phospho‐TDP‐43 409/410 (Cosmo Bio Co, CAC‐TIP‐PTD‐M01).
Immunofluorescence and image acquisition
Following deep/lethal anesthesia, animals were PBS perfused. One brain hemisphere was fixed overnight in 4% PFA in PBS (pH = 7.4) and transferred to 30% sucrose in PBS. Brains were processed into 35‐μm‐thick sagittal sections. Sections were blocked in 4% goat serum and incubated with indicated antibodies of the bellow listed primary antibodies. After several washing steps, sections were incubated with fluorophore conjugated secondary antibodies as indicated (Alexa 488, 594, 647; Thermo Fisher Scientific). After additional washing steps, nuclei were visualized with DAPI. Sections were embedded in Fluoromount™ (Sigma‐Aldrich, Merck). Image acquisition was performed on a LEICA DMI‐8 with a DFC9000GT camera and the following objectives: (HC PL FL L 20×/0.40 CORR PH1; HC PL APO 40×/0.95 CORR). Confocal Images were acquired on Zeiss LSM 800 Microscope Axio Observer 7 (Objective Plan‐Apochromat 63×/1,4 Oil M27). The following antibodies were used for immunofluorescence: GFAP (DAKO, Z0334), IBA1 (GeneTex, GTX100042), CD68 (Abcam, ab125212), CLEC7A (R&D Systems, AF1756), TREM2 (R&D Systems, AF1729), p62 (MBL, PM045), p62 (Progen Biotech GP62C), NeuN (Millipore, MAB377), TDP‐43 (Proteintech, 12892‐2AP), and Phospho‐TDP‐43 409/410 (Cosmo Bio Co, CAC‐TIP‐PTD‐M01).
Enzyme activity assay
Fluorescence‐based activity assays (Abnova) were used to asses enzyme activity of cathepsin D, cathepsin B, and cathepsin L. Mouse brain powder was homogenized in the recommended lysis buffer and subsequently centrifuged. Cleavage of the quenched fluorescence substrate was continuously measured using the Fluoroskan Ascent FL plate reader (Labsystems).
Statistical analysis
Data were analyzed using GraphPad Prism 8. The rotarod performance is displayed as mean duration on the rotarod from three rounds of testing for each tested animal with standard deviation (SD) of the respective group. Differences between groups were tested by one‐way ANOVA with Tukey's post hoc test (Figs 1D, 4B, 5B, 6B and C, 7C and 8D). For the analysis of gene expression, the mean of the individual group is compared to the mean of the wild‐type controls by two‐tailed, unpaired Student's t‐test (Figs 2A–C and 3A–C). For multiple comparison expression analysis and enzyme activity, all data were normalized to wild type.
Significant differences are indicated as follows in all diagrams: *P < 0.05; **P < 0.01; ***P < 0.001; and ****P < 0.0001.
Author contributions
AC, CH, and GW conceived the study and analyzed the results. AC and CH wrote the manuscript with input from all co‐authors. GW performed all Western blot assays and immunofluorescence experiments. DE conducted and GW and MS performed behavioral experiments. MD performed the staining of the spinal cord and provided support on immunofluorescence techniques. JG, KW, and MB performed and analyzed TSPO‐PET imaging. KF performed RNA isolation and enzyme activity assays. WW consulted and BW generated the Tmem106b −/− founder mouse from ES cells.
Conflict of interest
CH collaborates with Denali Therapeutics, participated on one advisory board meeting of Biogen, and received a speaker honorarium from Novartis and Roche. CH is chief advisor of ISAR Bioscience.
Supporting information
Expanded View Figures PDF
Table EV1
Movie EV1
Source Data for Expanded View
Review Process File
Source Data for Figure 1
Source Data for Figure 2
Source Data for Figure 3
Source Data for Figure 4
Source Data for Figure 5
Source Data for Figure 6
Source Data for Figure 7
Acknowledgements
This work is supported by the Deutsche Forschungsgemeinschaft (DFG) within the framework of the Munich Cluster for Systems Neurology (EXC 2145 SyNergy; ID 390857198). CH is supported by the Koselleck Project HA1737/16‐1 of the DFG (Helmholtz‐Gemeinschaft, Zukunftsthema “Immunology and Inflammation” (ZT‐0027)). We thank Ramona Rodde for excellent technical assistance. We would like to acknowledge the NanoString EMEA grant program for providing a Neuropathology panel. We would like to thank Dr. M. Nishihara (Department of Veterinary Physiology, The University of Tokyo) for providing the Grn −/− founder mouse strain. Open access funding enabled and organized by ProjektDEAL.
EMBO Reports (2020) 21: e50241
See also: X Zhou et al, T Feng et al and EL Clayton & AM Isaacs (October 2020)
Contributor Information
Christian Haass, Email: christian.haass@mail03.med.uni-muenchen.de.
Anja Capell, Email: anja.capell@mail03.med.uni-muenchen.de.
Data availability
Data sets of raw and processed data produced in this study are available in the following database:
NanoString gene sequence, raw, and processed data:
Gene Expression Omnibus accession number (GSE155065) at https://www.ncbi.nlm.nih.gov/geo/query/acc.cgi?acc=GSE155065
Gene Expression Omnibus accession number (GSE155066) at https://www.ncbi.nlm.nih.gov/geo/query/acc.cgi?acc=GSE155066
References
- Ahmed Z, Sheng H, Xu YF, Lin WL, Innes AE, Gass J, Yu X, Wuertzer CA, Hou H, Chiba S et al (2010) Accelerated lipofuscinosis and ubiquitination in granulin knockout mice suggest a role for progranulin in successful aging. Am J Pathol 177: 311–324 [DOI] [PMC free article] [PubMed] [Google Scholar]
- Almeida MR, Macario MC, Ramos L, Baldeiras I, Ribeiro MH, Santana I (2016) Portuguese family with the co‐occurrence of frontotemporal lobar degeneration and neuronal ceroid lipofuscinosis phenotypes due to progranulin gene mutation. Neurobiol Aging 41: 200.e201–200 [DOI] [PubMed] [Google Scholar]
- Arrant AE, Nicholson AM, Zhou X, Rademakers R, Roberson ED (2018) Partial Tmem106b reduction does not correct abnormalities due to progranulin haploinsufficiency. Mol Neurodegener 13: 32 [DOI] [PMC free article] [PubMed] [Google Scholar]
- Baker M, Mackenzie IR, Pickering‐Brown SM, Gass J, Rademakers R, Lindholm C, Snowden J, Adamson J, Sadovnick AD, Rollinson S et al (2006) Mutations in progranulin cause tau‐negative frontotemporal dementia linked to chromosome 17. Nature 442: 916–919 [DOI] [PubMed] [Google Scholar]
- Bateman A, Cheung ST, Bennett HPJ (2018) A brief overview of progranulin in health and disease. Methods Mol Biol 1806: 3–15 [DOI] [PubMed] [Google Scholar]
- Beel S, Moisse M, Damme M, De Muynck L, Robberecht W, Van Den Bosch L, Saftig P, Van Damme P (2017) Progranulin functions as a cathepsin D chaperone to stimulate axonal outgrowth in vivo . Hum Mol Genet 26: 2850–2863 [DOI] [PMC free article] [PubMed] [Google Scholar]
- Belcastro V, Siciliano V, Gregoretti F, Mithbaokar P, Dharmalingam G, Berlingieri S, Iorio F, Oliva G, Polishchuck R, Brunetti‐Pierri N et al (2011) Transcriptional gene network inference from a massive dataset elucidates transcriptome organization and gene function. Nucleic Acids Res 39: 8677–8688 [DOI] [PMC free article] [PubMed] [Google Scholar]
- van Blitterswijk M, Mullen B, Nicholson AM, Bieniek KF, Heckman MG, Baker MC, DeJesus‐Hernandez M, Finch NA, Brown PH, Murray ME et al (2014) TMEM106B protects C9ORF72 expansion carriers against frontotemporal dementia. Acta Neuropathol 127: 397–406 [DOI] [PMC free article] [PubMed] [Google Scholar]
- Brady OA, Zheng Y, Murphy K, Huang M, Hu F (2013) The frontotemporal lobar degeneration risk factor, TMEM106B, regulates lysosomal morphology and function. Hum Mol Genet 22: 685–695 [DOI] [PMC free article] [PubMed] [Google Scholar]
- Brendel M, Probst F, Jaworska A, Overhoff F, Korzhova V, Albert NL, Beck R, Lindner S, Gildehaus FJ, Baumann K et al (2016) Glial activation and glucose metabolism in a transgenic amyloid mouse model: a triple‐tracer PET study. J Nucl Med 57: 954–960 [DOI] [PubMed] [Google Scholar]
- Capell A, Liebscher S, Fellerer K, Brouwers N, Willem M, Lammich S, Gijselinck I, Bittner T, Carlson AM, Sasse F et al (2011) Rescue of progranulin deficiency associated with frontotemporal lobar degeneration by alkalizing reagents and inhibition of vacuolar ATPase. J Neurosci 31: 1885–1894 [DOI] [PMC free article] [PubMed] [Google Scholar]
- Chang MC, Srinivasan K, Friedman BA, Suto E, Modrusan Z, Lee WP, Kaminker JS, Hansen DV, Sheng M (2017) Progranulin deficiency causes impairment of autophagy and TDP‐43 accumulation. J Exp Med 214: 2611–2628 [DOI] [PMC free article] [PubMed] [Google Scholar]
- Chen‐Plotkin AS, Unger TL, Gallagher MD, Bill E, Kwong LK, Volpicelli‐Daley L, Busch JI, Akle S, Grossman M, Van Deerlin V et al (2012) TMEM106B, the risk gene for frontotemporal dementia, is regulated by the microRNA‐132/212 cluster and affects progranulin pathways. J Neurosci 32: 11213–11227 [DOI] [PMC free article] [PubMed] [Google Scholar]
- Clayton EL, Milioto C, Muralidharan B, Norona FE, Edgar JR, Soriano A, Jafar‐Nejad P, Rigo F, Collinge J, Isaacs AM (2018) Frontotemporal dementia causative CHMP2B impairs neuronal endolysosomal traffic‐rescue by TMEM106B knockdown. Brain 141: 3428–3442 [DOI] [PMC free article] [PubMed] [Google Scholar]
- Cruchaga C, Graff C, Chiang HH, Wang J, Hinrichs AL, Spiegel N, Bertelsen S, Mayo K, Norton JB, Morris JC et al (2011) Association of TMEM106B gene polymorphism with age at onset in granulin mutation carriers and plasma granulin protein levels. Arch Neurol 68: 581–586 [DOI] [PMC free article] [PubMed] [Google Scholar]
- Cruts M, Gijselinck I, van der Zee J, Engelborghs S, Wils H, Pirici D, Rademakers R, Vandenberghe R, Dermaut B, Martin JJ et al (2006) Null mutations in progranulin cause ubiquitin‐positive frontotemporal dementia linked to chromosome 17q21. Nature 442: 920–924 [DOI] [PubMed] [Google Scholar]
- DeJesus‐Hernandez M, Mackenzie IR, Boeve BF, Boxer AL, Baker M, Rutherford NJ, Nicholson AM, Finch NA, Flynn H, Adamson J et al (2011) Expanded GGGGCC hexanucleotide repeat in noncoding region of C9ORF72 causes chromosome 9p‐linked FTD and ALS. Neuron 72: 245–256 [DOI] [PMC free article] [PubMed] [Google Scholar]
- Deussing M, Blume T, Vomacka L, Mahler C, Focke C, Todica A, Unterrainer M, Albert NL, Lindner S, von Ungern‐Sternberg B et al (2018) Coupling between physiological TSPO expression in brain and myocardium allows stabilization of late‐phase cerebral [(18)F]GE180 PET quantification. NeuroImage 165: 83–91 [DOI] [PubMed] [Google Scholar]
- Feng T, Mai S, Roscoe JM, Sheng RR, Ullah M, Zhang J, Iscol Katz I, Yu H, Xiong W, Hu F (2020a) Loss of TMEM106B and PGRN leads to severe lysosomal abnormalities and neurodegeneration in mice. EMBO Rep 21: e50219 [DOI] [PMC free article] [PubMed] [Google Scholar]
- Feng T, Sheng RR, Sole‐Domenech S, Ullah M, Zhou X, Mendoza CS, Enriquez LCM, Katz II, Paushter DH, Sullivan PM et al (2020b) A role of the frontotemporal lobar degeneration risk factor TMEM106B in myelination. Brain 143: 2255–2271 [DOI] [PMC free article] [PubMed] [Google Scholar]
- Finch N, Carrasquillo MM, Baker M, Rutherford NJ, Coppola G, Dejesus‐Hernandez M, Crook R, Hunter T, Ghidoni R, Benussi L et al (2011) TMEM106B regulates progranulin levels and the penetrance of FTLD in GRN mutation carriers. Neurology 76: 467–474 [DOI] [PMC free article] [PubMed] [Google Scholar]
- Gallagher MD, Suh E, Grossman M, Elman L, McCluskey L, Van Swieten JC, Al‐Sarraj S, Neumann M, Gelpi E, Ghetti B et al (2014) TMEM106B is a genetic modifier of frontotemporal lobar degeneration with C9orf72 hexanucleotide repeat expansions. Acta Neuropathol 127: 407–418 [DOI] [PMC free article] [PubMed] [Google Scholar]
- Gallagher MD, Posavi M, Huang P, Unger TL, Berlyand Y, Gruenewald AL, Chesi A, Manduchi E, Wells AD, Grant SFA et al (2017) A dementia‐associated risk variant near TMEM106B alters chromatin architecture and gene expression. Am J Hum Genet 101: 643–663 [DOI] [PMC free article] [PubMed] [Google Scholar]
- Gass J, Cannon A, Mackenzie IR, Boeve B, Baker M, Adamson J, Crook R, Melquist S, Kuntz K, Petersen R et al (2006) Mutations in progranulin are a major cause of ubiquitin‐positive frontotemporal lobar degeneration. Hum Mol Genet 15: 2988–3001 [DOI] [PubMed] [Google Scholar]
- Ghoshal N, Dearborn JT, Wozniak DF, Cairns NJ (2012) Core features of frontotemporal dementia recapitulated in progranulin knockout mice. Neurobiol Dis 45: 395–408 [DOI] [PMC free article] [PubMed] [Google Scholar]
- Gotzl JK, Mori K, Damme M, Fellerer K, Tahirovic S, Kleinberger G, Janssens J, van der Zee J, Lang CM, Kremmer E et al (2014) Common pathobiochemical hallmarks of progranulin‐associated frontotemporal lobar degeneration and neuronal ceroid lipofuscinosis. Acta Neuropathol 127: 845–860 [DOI] [PubMed] [Google Scholar]
- Gotzl JK, Lang CM, Haass C, Capell A (2016) Impaired protein degradation in FTLD and related disorders. Ageing Res Rev 32: 122–139 [DOI] [PubMed] [Google Scholar]
- Gotzl JK, Colombo AV, Fellerer K, Reifschneider A, Werner G, Tahirovic S, Haass C, Capell A (2018) Early lysosomal maturation deficits in microglia triggers enhanced lysosomal activity in other brain cells of progranulin knockout mice. Mol Neurodegener 13: 48 [DOI] [PMC free article] [PubMed] [Google Scholar]
- Gotzl JK, Brendel M, Werner G, Parhizkar S, Sebastian Monasor L, Kleinberger G, Colombo AV, Deussing M, Wagner M, Winkelmann J et al (2019) Opposite microglial activation stages upon loss of PGRN or TREM2 result in reduced cerebral glucose metabolism. EMBO Mol Med 11: e9711 [DOI] [PMC free article] [PubMed] [Google Scholar]
- Guo A, Tapia L, Bamji SX, Cynader MS, Jia W (2010) Progranulin deficiency leads to enhanced cell vulnerability and TDP‐43 translocation in primary neuronal cultures. Brain Res 1366: 1–8 [DOI] [PubMed] [Google Scholar]
- Hara T, Nakamura K, Matsui M, Yamamoto A, Nakahara Y, Suzuki‐Migishima R, Yokoyama M, Mishima K, Saito I, Okano H et al (2006) Suppression of basal autophagy in neural cells causes neurodegenerative disease in mice. Nature 441: 885–889 [DOI] [PubMed] [Google Scholar]
- Hardy J, Rogaeva E (2014) Motor neuron disease and frontotemporal dementia: sometimes related, sometimes not. Exp Neurol 262(Pt B): 75–83 [DOI] [PubMed] [Google Scholar]
- Hasegawa M, Arai T, Nonaka T, Kametani F, Yoshida M, Hashizume Y, Beach TG, Buratti E, Baralle F, Morita M et al (2008) Phosphorylated TDP‐43 in frontotemporal lobar degeneration and amyotrophic lateral sclerosis. Ann Neurol 64: 60–70 [DOI] [PMC free article] [PubMed] [Google Scholar]
- Holler CJ, Taylor G, Deng Q, Kukar T (2017) Intracellular proteolysis of progranulin generates stable, lysosomal granulins that are haploinsufficient in patients with frontotemporal dementia caused by GRN mutations. eNeuro 4: ENEURO.0100‐17.2017 [DOI] [PMC free article] [PubMed] [Google Scholar]
- Hu F, Padukkavidana T, Vaegter CB, Brady OA, Zheng Y, Mackenzie IR, Feldman HH, Nykjaer A, Strittmatter SM (2010) Sortilin‐mediated endocytosis determines levels of the frontotemporal dementia protein, progranulin. Neuron 68: 654–667 [DOI] [PMC free article] [PubMed] [Google Scholar]
- Ikemoto S, Hamano SI, Kikuchi K, Koichihara R, Hirata Y, Matsuura R, Hiraide T, Nakashima M, Inoue K, Kurosawa K et al (2020) A recurrent TMEM106B mutation in hypomyelinating leukodystrophy: a rapid diagnostic assay. Brain Dev 42: 603–606 [DOI] [PubMed] [Google Scholar]
- Kao AW, McKay A, Singh PP, Brunet A, Huang EJ (2017) Progranulin, lysosomal regulation and neurodegenerative disease. Nat Rev Neurosci 18: 325–333 [DOI] [PMC free article] [PubMed] [Google Scholar]
- Kayasuga Y, Chiba S, Suzuki M, Kikusui T, Matsuwaki T, Yamanouchi K, Kotaki H, Horai R, Iwakura Y, Nishihara M (2007) Alteration of behavioural phenotype in mice by targeted disruption of the progranulin gene. Behav Brain Res 185: 110–118 [DOI] [PubMed] [Google Scholar]
- Klein ZA, Takahashi H, Ma M, Stagi M, Zhou M, Lam TT, Strittmatter SM (2017) Loss of TMEM106B ameliorates lysosomal and frontotemporal dementia‐related phenotypes in progranulin‐deficient mice. Neuron 95: 281–296 [DOI] [PMC free article] [PubMed] [Google Scholar]
- Kleinberger G, Wils H, Ponsaerts P, Joris G, Timmermans JP, Van Broeckhoven C, Kumar‐Singh S (2010) Increased caspase activation and decreased TDP‐43 solubility in progranulin knockout cortical cultures. J Neurochem 115: 735–747 [DOI] [PubMed] [Google Scholar]
- Kleinberger G, Capell A, Haass C, Van Broeckhoven C (2013) Mechanisms of granulin deficiency: lessons from cellular and animal models. Mol Neurobiol 47: 337–360 [DOI] [PMC free article] [PubMed] [Google Scholar]
- Komatsu M, Waguri S, Ueno T, Iwata J, Murata S, Tanida I, Ezaki J, Mizushima N, Ohsumi Y, Uchiyama Y et al (2005) Impairment of starvation‐induced and constitutive autophagy in Atg7‐deficient mice. J Cell Biol 169: 425–434 [DOI] [PMC free article] [PubMed] [Google Scholar]
- Lang CM, Fellerer K, Schwenk BM, Kuhn PH, Kremmer E, Edbauer D, Capell A, Haass C (2012) Membrane orientation and subcellular localization of transmembrane protein 106B (TMEM106B), a major risk factor for frontotemporal lobar degeneration. J Biol Chem 287: 19355–19365 [DOI] [PMC free article] [PubMed] [Google Scholar]
- Le NT, Chang L, Kovlyagina I, Georgiou P, Safren N, Braunstein KE, Kvarta MD, Van Dyke AM, LeGates TA, Philips T et al (2016) Motor neuron disease, TDP‐43 pathology, and memory deficits in mice expressing ALS‐FTD‐linked UBQLN2 mutations. Proc Natl Acad Sci USA 113: E7580–E7589 [DOI] [PMC free article] [PubMed] [Google Scholar]
- Lee CW, Stankowski JN, Chew J, Cook CN, Lam YW, Almeida S, Carlomagno Y, Lau KF, Prudencio M, Gao FB et al (2017) The lysosomal protein cathepsin L is a progranulin protease. Mol Neurodegener 12: 55 [DOI] [PMC free article] [PubMed] [Google Scholar]
- Li Z, Farias FHG, Dube U, Del‐Aguila JL, Mihindukulasuriya KA, Fernandez MV, Ibanez L, Budde JP, Wang F, Lake AM et al (2020) The TMEM106B FTLD‐protective variant, rs1990621, is also associated with increased neuronal proportion. Acta Neuropathol 139: 45–61 [DOI] [PMC free article] [PubMed] [Google Scholar]
- Liu Y, Pattamatta A, Zu T, Reid T, Bardhi O, Borchelt DR, Yachnis AT, Ranum LP (2016) C9orf72 BAC mouse model with motor deficits and neurodegenerative features of ALS/FTD. Neuron 90: 521–534 [DOI] [PubMed] [Google Scholar]
- Lui H, Zhang J, Makinson SR, Cahill MK, Kelley KW, Huang HY, Shang Y, Oldham MC, Martens LH, Gao F et al (2016) Progranulin deficiency promotes circuit‐specific synaptic pruning by microglia via complement activation. Cell 165: 921–935 [DOI] [PMC free article] [PubMed] [Google Scholar]
- Luningschror P, Werner G, Stroobants S, Kakuta S, Dombert B, Sinske D, Wanner R, Lullmann‐Rauch R, Wefers B, Wurst W et al (2020) The FTLD risk factor TMEM106B regulates the transport of lysosomes at the axon initial segment of motoneurons. Cell Rep 30: 3506–3519 [DOI] [PubMed] [Google Scholar]
- Murray ME, Cannon A, Graff‐Radford NR, Liesinger AM, Rutherford NJ, Ross OA, Duara R, Carrasquillo MM, Rademakers R, Dickson DW (2014) Differential clinicopathologic and genetic features of late‐onset amnestic dementias. Acta Neuropathol 128: 411–421 [DOI] [PMC free article] [PubMed] [Google Scholar]
- Nelson PT, Wang WX, Partch AB, Monsell SE, Valladares O, Ellingson SR, Wilfred BR, Naj AC, Wang LS, Kukull WA et al (2015) Reassessment of risk genotypes (GRN, TMEM106B, and ABCC9 variants) associated with hippocampal sclerosis of aging pathology. J Neuropathol Exp Neurol 74: 75–84 [DOI] [PMC free article] [PubMed] [Google Scholar]
- Neumann M, Kwong LK, Lee EB, Kremmer E, Flatley A, Xu Y, Forman MS, Troost D, Kretzschmar HA, Trojanowski JQ et al (2009) Phosphorylation of S409/410 of TDP‐43 is a consistent feature in all sporadic and familial forms of TDP‐43 proteinopathies. Acta Neuropathol 117: 137–149 [DOI] [PMC free article] [PubMed] [Google Scholar]
- Nicholson AM, Finch NA, Wojtas A, Baker MC, Perkerson RB 3rd, Castanedes‐Casey M, Rousseau L, Benussi L, Binetti G, Ghidoni R et al (2013) TMEM106B p. T185S regulates TMEM106B protein levels: implications for frontotemporal dementia. J Neurochem 126: 781–791 [DOI] [PMC free article] [PubMed] [Google Scholar]
- Nicholson AM, Zhou X, Perkerson RB, Parsons TM, Chew J, Brooks M, DeJesus‐Hernandez M, Finch NA, Matchett BJ, Kurti A et al (2018) Loss of Tmem106b is unable to ameliorate frontotemporal dementia‐like phenotypes in an AAV mouse model of C9ORF72‐repeat induced toxicity. Acta Neuropathol Commun 6: 42 [DOI] [PMC free article] [PubMed] [Google Scholar]
- Nixon RA (2013) The role of autophagy in neurodegenerative disease. Nat Med 19: 983–997 [DOI] [PubMed] [Google Scholar]
- Palmer DN, Barry LA, Tyynela J, Cooper JD (2013) NCL disease mechanisms. Biochim Biophys Acta 1832: 1882–1893 [DOI] [PubMed] [Google Scholar]
- Petkau TL, Neal SJ, Milnerwood A, Mew A, Hill AM, Orban P, Gregg J, Lu G, Feldman HH, Mackenzie IR et al (2012) Synaptic dysfunction in progranulin‐deficient mice. Neurobiol Dis 45: 711–722 [DOI] [PubMed] [Google Scholar]
- Petkau TL, Hill A, Leavitt BR (2016) Core neuropathological abnormalities in progranulin‐deficient mice are penetrant on multiple genetic backgrounds. Neuroscience 315: 175–195 [DOI] [PubMed] [Google Scholar]
- Ren Y, van Blitterswijk M, Allen M, Carrasquillo MM, Reddy JS, Wang X, Beach TG, Dickson DW, Ertekin‐Taner N, Asmann YW et al (2018) TMEM106B haplotypes have distinct gene expression patterns in aged brain. Mol Neurodegener 13: 35 [DOI] [PMC free article] [PubMed] [Google Scholar]
- Renton AE, Majounie E, Waite A, Simon‐Sanchez J, Rollinson S, Gibbs JR, Schymick JC, Laaksovirta H, van Swieten JC, Myllykangas L et al (2011) A hexanucleotide repeat expansion in C9ORF72 is the cause of chromosome 9p21‐linked ALS‐FTD. Neuron 72: 257–268 [DOI] [PMC free article] [PubMed] [Google Scholar]
- Rhinn H, Abeliovich A (2017) Differential aging analysis in human cerebral cortex identifies variants in TMEM106B and GRN that regulate aging phenotypes. Cell Syst 4: 404–415 [DOI] [PubMed] [Google Scholar]
- Rutherford NJ, Carrasquillo MM, Li M, Bisceglio G, Menke J, Josephs KA, Parisi JE, Petersen RC, Graff‐Radford NR, Younkin SG et al (2012) TMEM106B risk variant is implicated in the pathologic presentation of Alzheimer disease. Neurology 79: 717–718 [DOI] [PMC free article] [PubMed] [Google Scholar]
- Sardiello M, Palmieri M, di Ronza A, Medina DL, Valenza M, Gennarino VA, Di Malta C, Donaudy F, Embrione V, Polishchuk RS et al (2009) A gene network regulating lysosomal biogenesis and function. Science 325: 473–477 [DOI] [PubMed] [Google Scholar]
- Schwenk BM, Lang CM, Hogl S, Tahirovic S, Orozco D, Rentzsch K, Lichtenthaler SF, Hoogenraad CC, Capell A, Haass C et al (2014) The FTLD risk factor TMEM106B and MAP6 control dendritic trafficking of lysosomes. EMBO J 33: 450–467 [DOI] [PMC free article] [PubMed] [Google Scholar]
- Settembre C, Ballabio A (2011) TFEB regulates autophagy: an integrated coordination of cellular degradation and recycling processes. Autophagy 7: 1379–1381 [DOI] [PubMed] [Google Scholar]
- Settembre C, Di Malta C, Polito VA, Garcia Arencibia M, Vetrini F, Erdin S, Erdin SU, Huynh T, Medina D, Colella P et al (2011) TFEB links autophagy to lysosomal biogenesis. Science 332: 1429–1433 [DOI] [PMC free article] [PubMed] [Google Scholar]
- Smith KR, Damiano J, Franceschetti S, Carpenter S, Canafoglia L, Morbin M, Rossi G, Pareyson D, Mole SE, Staropoli JF et al (2012) Strikingly different clinicopathological phenotypes determined by progranulin‐mutation dosage. Am J Hum Genet 90: 1102–1107 [DOI] [PMC free article] [PubMed] [Google Scholar]
- Snowden JS, Pickering‐Brown SM, Mackenzie IR, Richardson AM, Varma A, Neary D, Mann DM (2006) Progranulin gene mutations associated with frontotemporal dementia and progressive non‐fluent aphasia. Brain 129: 3091–3102 [DOI] [PubMed] [Google Scholar]
- Stagi M, Klein ZA, Gould TJ, Bewersdorf J, Strittmatter SM (2014) Lysosome size, motility and stress response regulated by fronto‐temporal dementia modifier TMEM106B. Mol Cell Neurosci 61: 226–240 [DOI] [PMC free article] [PubMed] [Google Scholar]
- Tanaka Y, Matsuwaki T, Yamanouchi K, Nishihara M (2013) Increased lysosomal biogenesis in activated microglia and exacerbated neuronal damage after traumatic brain injury in progranulin‐deficient mice. Neuroscience 250: 8–19 [DOI] [PubMed] [Google Scholar]
- Tanaka Y, Chambers JK, Matsuwaki T, Yamanouchi K, Nishihara M (2014) Possible involvement of lysosomal dysfunction in pathological changes of the brain in aged progranulin‐deficient mice. Acta Neuropathol Commun 2: 78 [DOI] [PMC free article] [PubMed] [Google Scholar]
- Tanaka Y, Suzuki G, Matsuwaki T, Hosokawa M, Serrano G, Beach TG, Yamanouchi K, Hasegawa M, Nishihara M (2017) Progranulin regulates lysosomal function and biogenesis through acidification of lysosomes. Hum Mol Genet 26: 969–988 [DOI] [PubMed] [Google Scholar]
- Van Deerlin VM, Sleiman PM, Martinez‐Lage M, Chen‐Plotkin A, Wang LS, Graff‐Radford NR, Dickson DW, Rademakers R, Boeve BF, Grossman M et al (2010) Common variants at 7p21 are associated with frontotemporal lobar degeneration with TDP‐43 inclusions. Nat Genet 42: 234–239 [DOI] [PMC free article] [PubMed] [Google Scholar]
- Ward ME, Chen R, Huang HY, Ludwig C, Telpoukhovskaia M, Taubes A, Boudin H, Minami SS, Reichert M, Albrecht P et al (2017) Individuals with progranulin haploinsufficiency exhibit features of neuronal ceroid lipofuscinosis. Sci Transl Med 9: eaah5642 [DOI] [PMC free article] [PubMed] [Google Scholar]
- Wils H, Kleinberger G, Janssens J, Pereson S, Joris G, Cuijt I, Smits V, Ceuterick‐de Groote C, Van Broeckhoven C, Kumar‐Singh S (2010) TDP‐43 transgenic mice develop spastic paralysis and neuronal inclusions characteristic of ALS and frontotemporal lobar degeneration. Proc Natl Acad Sci USA 107: 3858–3863 [DOI] [PMC free article] [PubMed] [Google Scholar]
- Wils H, Kleinberger G, Pereson S, Janssens J, Capell A, Van Dam D, Cuijt I, Joris G, De Deyn PP, Haass C et al (2012) Cellular ageing, increased mortality and FTLD‐TDP‐associated neuropathology in progranulin knockout mice. J Pathol 228: 67–76 [DOI] [PubMed] [Google Scholar]
- Xiang X, Werner G, Bohrmann B, Liesz A, Mazaheri F, Capell A, Feederle R, Knuesel I, Kleinberger G, Haass C (2016) TREM2 deficiency reduces the efficacy of immunotherapeutic amyloid clearance. EMBO Mol Med 8: 992–1004 [DOI] [PMC free article] [PubMed] [Google Scholar]
- Yin F, Banerjee R, Thomas B, Zhou P, Qian L, Jia T, Ma X, Ma Y, Iadecola C, Beal MF et al (2010a) Exaggerated inflammation, impaired host defense, and neuropathology in progranulin‐deficient mice. J Exp Med 207: 117–128 [DOI] [PMC free article] [PubMed] [Google Scholar]
- Yin F, Dumont M, Banerjee R, Ma Y, Li H, Lin MT, Beal MF, Nathan C, Thomas B, Ding A (2010b) Behavioral deficits and progressive neuropathology in progranulin‐deficient mice: a mouse model of frontotemporal dementia. FASEB J 24: 4639–4647 [DOI] [PMC free article] [PubMed] [Google Scholar]
- Yu L, De Jager PL, Yang J, Trojanowski JQ, Bennett DA, Schneider JA (2015) The TMEM106B locus and TDP‐43 pathology in older persons without FTLD. Neurology 84: 927–934 [DOI] [PMC free article] [PubMed] [Google Scholar]
- van der Zee J, Van Langenhove T, Kleinberger G, Sleegers K, Engelborghs S, Vandenberghe R, Santens P, Van den Broeck M, Joris G, Brys J et al (2011) TMEM106B is associated with frontotemporal lobar degeneration in a clinically diagnosed patient cohort. Brain 134: 808–815 [DOI] [PMC free article] [PubMed] [Google Scholar]
- Zhou X, Sun L, Bastos de Oliveira F, Qi X, Brown WJ, Smolka MB, Sun Y, Hu F (2015) Prosaposin facilitates sortilin‐independent lysosomal trafficking of progranulin. J Cell Biol 210: 991–1002 [DOI] [PMC free article] [PubMed] [Google Scholar]
- Zhou X, Paushter DH, Feng T, Pardon CM, Mendoza CS, Hu F (2017a) Regulation of cathepsin D activity by the FTLD protein progranulin. Acta Neuropathol 134: 151–153 [DOI] [PMC free article] [PubMed] [Google Scholar]
- Zhou X, Paushter DH, Feng T, Sun L, Reinheckel T, Hu F (2017b) Lysosomal processing of progranulin. Mol Neurodegener 12: 62 [DOI] [PMC free article] [PubMed] [Google Scholar]
- Zhou X, Brooks M, Jiang P, Koga S, Zuberi AR, Baker MC, Parsons TM, Castanedes‐Casey M, Phillips V, Librero AL et al (2020a) Loss of Tmem106b exacerbates FTLD pathologies and causes motor deficits in progranulin deficient mice. EMBO Rep 21: e50197 [DOI] [PMC free article] [PubMed] [Google Scholar]
- Zhou X, Nicholson AM, Ren Y, Brooks M, Jiang P, Zuberi A, Phuoc HN, Perkerson RB, Matchett B, Parsons TM et al (2020b) Loss of TMEM106B leads to myelination deficits: implications for frontotemporal dementia treatment strategies. Brain 143: 1905–1919 [DOI] [PMC free article] [PubMed] [Google Scholar]
Associated Data
This section collects any data citations, data availability statements, or supplementary materials included in this article.
Supplementary Materials
Expanded View Figures PDF
Table EV1
Movie EV1
Source Data for Expanded View
Review Process File
Source Data for Figure 1
Source Data for Figure 2
Source Data for Figure 3
Source Data for Figure 4
Source Data for Figure 5
Source Data for Figure 6
Source Data for Figure 7
Data Availability Statement
Data sets of raw and processed data produced in this study are available in the following database:
NanoString gene sequence, raw, and processed data:
Gene Expression Omnibus accession number (GSE155065) at https://www.ncbi.nlm.nih.gov/geo/query/acc.cgi?acc=GSE155065
Gene Expression Omnibus accession number (GSE155066) at https://www.ncbi.nlm.nih.gov/geo/query/acc.cgi?acc=GSE155066