

Abstract
Attention is a fundamental cognitive process that is critical for essentially all aspects of higher-order cognition and real-world activities. Younger generations have deeply embraced information technology and multitasking in their personal lives, school, and the workplace, creating myriad challenges to their attention. While improving sustained attention in healthy young adults would be beneficial, enhancing this ability has proven notoriously difficult in this age group. Here we show that six-weeks of engagement with a meditation-inspired, closed-loop software program (MediTrain) delivered on mobile devices led to gains in both sustained attention and working memory in healthy young adults (n = 22). These improvements were associated with positive changes in key neural signatures of attentional control (frontal theta inter-trial coherence and parietal P3b latency), as measured by electroencephalography. Our findings suggest the utility of delivering aspects of the ancient practice of focused-attention meditation in a modern, technology-based approach and its benefits on enhancing sustained attention.
Introduction
Media and technology multitasking have become pervasive in the lives of young adults1 and research has shown that this behavior is associated with challenges to their attention abilities that present as increased distractibility2,3, diminished attention span4, poorer academic performance and reduced personal contentment1. Given that attention is a fundamental component process of all aspects of higher order cognition (e.g., memory, decision making, goal management, and emotional regulation)5,6, there exists a need for new methods to enhance attention abilities. Attempts to do so have largely focused on populations with documented attention deficits, such as children diagnosed with Attention Deficit Hyperactivity Disorder (ADHD) and older adults7–9. Interestingly, a few approaches, such as playing action videogames10 and physical fitness training11, have been associated with fostering improved attention in healthy young adults; however, the benefits of these activities are not sufficient on their own to completely address modern day challenges to attention. Further, while readily available, these methods are not universally appealing, and attempts to boost attention using technology-based approaches, like cognitive training software programs, have revealed only minimal value in this age group12.
While young adults display superior attention abilities compared to clinical or other vulnerable populations, who are typically most responsive to benefits of treatments7–9, they nevertheless face numerous real-world challenges to attention. Perhaps as a result, the use of stimulants has skyrocketed in non-diagnosed college students attempting to increase their focus and boost school performance, with non-prescription use rates as high as 43% among college students13–15. However, stimulant use in this population has not been found to actually improve sustained attention13 and misuse is associated with a multitude of substance abuse complications and even life-threatening outcomes14. There is thus an important, and growing, need for new accessible and affordable approaches to enhance attention abilities in healthy young adults, which are validated by randomized controlled trials (RCTs).
A growing scientific literature supports the positive effects of real-world practices of focused-attention meditation as a means of improving self-regulation processes, including the deployment of sustained and selective attention9,16,17, as well as its beneficial influences on stress, mood, and emotional regulation18. While the majority of these studies have been conducted on middle-aged and older adults, a few studies have shown that the practice of meditation may increase attention abilities in healthy young adults19,20. However, traditional forms of meditation can be challenging, intimidating, and expensive to learn, because they require access to trained expert facilitators and in-person meetings over multiple months18. Moreover, these practices do not offer quantifiable metrics of success, nor performance feedback during the program—factors that are important for maintaining engagement and long-term compliance21. Further, traditional meditation is not adaptive or tailored to individuals, making it overly challenging for some people. While more recent studies have tested the delivery of website-accessible meditation programs22, these online practices tended to duplicate the procedures of the real-world practices and consequently had similar hurdles in terms of implementation and traction. Moreover, while meditation “apps” on mobile devices have become increasingly ubiquitous23, studies to date have either failed to characterize their effects on cognition or have shown equivocal results24.
To extend the benefits of focused-attention meditation to larger numbers and more diverse populations, we adopted an “east meets west” approach. Unlike other meditation apps in the consumer market place that offer a digital version of traditional methods to guided mediation, our approach involved designing, developing and testing a meditation-inspired software program that integrates key aspects of traditional focused-attention meditation with a neuroplasticity-based, closed-loop approach to cognitive enhancement that has proven successful in generating positive outcomes with other interventions7. The MediTrain program (see Supplementary Fig. 1 and Methods) is a standalone software application deployed on mobile devices, designed to make the practice of focused-attention meditation more accessible, deliverable, and sustainable, notably to younger generations who navigate towards the use of mobile digital devices1. To constrain interpretations regarding which active ingredients confer benefits, we restricted our approach to specific, but fundamental, aspects of focused-attention meditation (i.e., focused internal attention to the breath, awareness of distractions, and return of focus to the breath).
When engaging with MediTrain, users are first instructed on how to focus their attention on their breath (e.g., sensation of air in the nostrils or movement of their chest) with their eyes closed. Following this lesson, they begin the training trials, where they are instructed to be aware of their mind’s wandering (either due to an attentional lapse or a distraction), and when it is detected to shift their attention back to their breath (see Supplementary Information for detailed instructions). Based on their introspection and self-report of mind-wandering, the closed-loop aspect of MediTrain uses an adaptive staircase algorithm to adjust the difficulty of the next trial (i.e., increase in duration when they report that their focus was maintained and decrease when focus wavered from the breath). This closed-loop approach allows the delivery of a focused-meditation challenge in a personalized manner and offers regular feedback on the effectiveness of an individual’s ability to sustain their attention to their breath, as well as metrics of improvement over time. Another strength of this program is its delivery on wireless mobile platforms (i.e., tablets or phones), which has the practical benefit of broad accessibility and appeal to younger generations.
A common criticism of previous meditation research and cognitive training studies is the absence of suitable control groups to address potential placebo effects driven by participant expectations that an intervention will lead to positive effects12,18,25. To address this concern, we conducted Experiment 1 to select an appropriate control condition based on participant predictions of potential training-related cognitive gains. Specifically, we asked a large sample of young adults (n = 334) to report their expectations regarding the extent that engaging with MediTrain or a selection of other mobile software applications (see Methods for details of Experiment 1) would improve their performance on our specific outcome measures. This experiment revealed a set of apps that, compared to MediTrain, revealed no significant differences in participant expectations of improvement on any of our outcome measures, indicating that they would serve as an appropriate placebo control condition.
Results and Discussion
Based on key findings from the traditional meditation literature, we hypothesized that MediTrain would lead to improvements in sustained attention19 beyond that of an expectancy-matched control group. To test this hypothesis, we designed Experiment 2 as a randomized, double-blind, placebo-controlled study. We randomly assigned 59 healthy young adults (18–35 years of age) to receive 6-weeks of at home treatment with either MediTrain or the expectancy-matched placebo program (see Methods and Supplementary Fig. 2 for details of randomization). Of these participants, 24 in the MediTrain group and 20 in the placebo group completed the full treatment and the pre- and post-outcome assessments. We excluded two MediTrain participants due to irregularities in their software usage (see Methods for details), resulting in a final analyzed sample of 22 MediTrain participants. We found that, on average, participants in the MediTrain group gradually increased the amount of time each day that they successfully sustained their attention to their breath without attentional lapses or distractions, averaging 20sec on the first day and progressing to an average of 6min after 25 days of training (Fig. 1).
Figure 1. MediTrain Training Curves.

Each gray line represents data from an individual MediTrain participant (n = 20) and the bold green bar represents the average of all participants. On average, the group went from an initial time of 20 sec to 47.5 sec at the end of the first week to a time of 346 sec at the completion of the sixth week.
As our primary outcome measurement of interest, we evaluated intra-individual variability in response time across trials (RTVar) on a vigilance task that required a rapid response to a rare target stimulus (Fig. 2A). This well-studied measure of sustained attention assesses the consistency of attentional deployment during extended task engagement, as influenced by mind wandering events and brief periods of distractibility19,26. RTVar has been shown to be increased in children with ADHD27 and older adults with mild cognitive impairment28,29 and dementia30. This measure has also been shown to be reduced in middle-aged adults in response to traditional practices of meditation, and presented as evidence of meditation improving sustained attention abilities31.
Figure 2. Improvements in Sustained Attention.
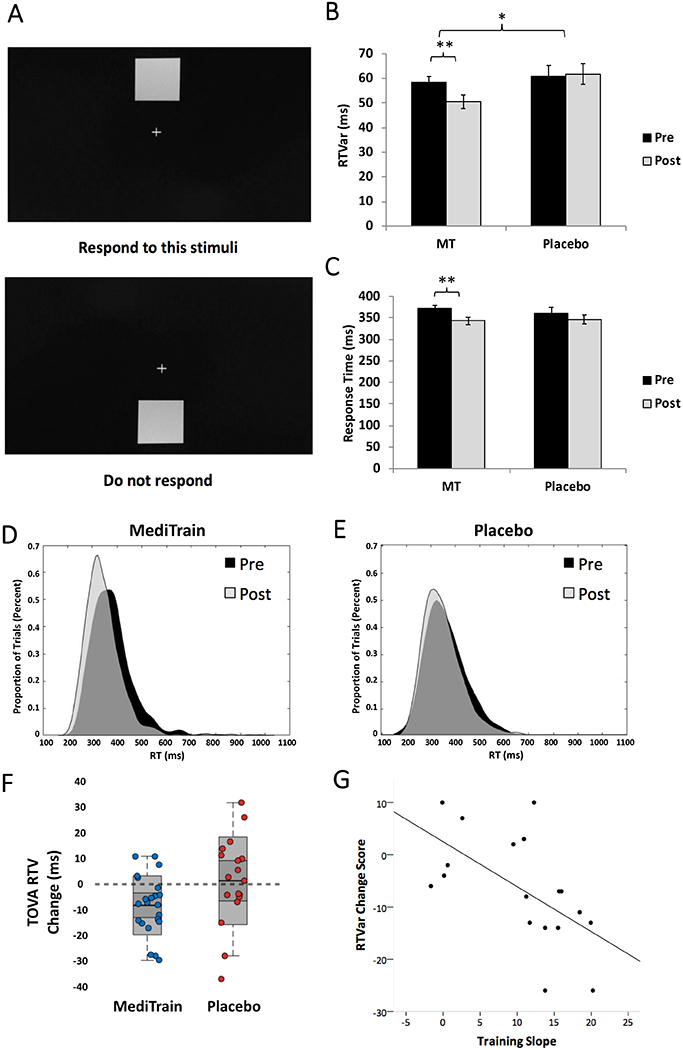
A) stimuli and protocol for the vigilance task; B) Response Time variability (RTVar) post-treatment was significantly lower (ANCOVA F1,37 = 6.4, p = 0.016, Cohen’s d = −0.66, 95% CI: −17.8 to −2.0) in MediTrain (MT; n = 22) compared to placebo (n = 18), with MediTrain participants showing a significant decrease in RTVar from pre- (mean = 58.2ms, SE = 2.6ms) to post- (mean = 50.5ms, SE = 2.8ms; Δ = −7.98 ms, two-tailed paired t21 = −3.5, p = 0.002, 95% CI: −12.7 to −3.1), while control participants showed no significant difference in RTVar from pre- (mean = 60.7 ms, SE = 4.6ms) to post- (mean = 61.8ms, SE = 4.2ms; Δ = 1.1 ms, two-tailed paired t17 = 0.29, p = 0.78, 95% CI: −7.0 to 9.1). C) While RTs did not differ between groups after treatment, only MediTrain participants were significantly faster at post-treatment compared to baseline. D) Histograms of RT distributions for MediTrain at pre (black) and post (gray) intervention and for E) Placebo at pre (black) and post (gray) intervention. F) Change scores (post – pre) for RTVar for individual MediTrain (blue circles) and placebo (red circles) participants. Shaded boxes represent 95% confidence intervals. G) Scatterplot and best-fit line for the correlation between training slopes and change in RTVar on the vigilance task in MediTrain participants. Error bars represent SE of the mean, *ANCOVA p < 0.05, **two-tailed paired t-test p < 0.01.
Using an ANCOVA to evaluate post-intervention scores while controlling for pre-intervention levels (see Statistics in Methods), we found that RTVar differed significantly between the two groups following training, with less variability in RT across the task period in the MediTrain group (F1,37 = 6.4, p = 0.016, Cohen’s d = −0.66; Fig 2B). Analysis further revealed that MediTrain participants showed a significant decrease in RTVar from pre- to post-training (Figs. 2D–F; Δ = −7.98 ms, paired t21 = −3.5, p = 0.002, 95% CI: −12.7 to −3.1), while placebo participants did not change (Δ = 1.1 ms, paired t17 = 0.29, p = 0.78, 95% CI: −7.0 to 9.1). Note that two participants in the placebo group were excluded from these analyses as being extreme outliers (see Methods for details of outlier analyses and exclusions), resulting in a final as-treated sample of n = 22 in MediTrain and n = 18 in placebo for this task. To ensure that the decrease in RTVar was not related to a general response time (RT) slowing or tradeoff in accuracy, we performed a post-hoc analysis of RT and the sensitivity index (d′). Controlling for pre-intervention levels, an ANCOVA revealed no significant group difference in RT at post-intervention (F1,37 = 0.14, p = 0.71, Cohen’s d = −0.15, 95% CI: −189.5 to 276.5; Fig 2C), but did reveal a significant difference in d′ (ANCOVA F1,37 = 6.7, p = 0.014; Cohen’s d = 0.39, 95% CI: 0.09 to 0.79), with the MediTrain group performing significantly better than placebo controls at post-intervention. These data indicate that the decrease in RTVar in the MediTrain group was not associated with a tradeoff in other performance metrics.
We next examined the relationship between the improvement of each participant on MediTrain breath focus itself over the 6 weeks of training and the change in their RTVar on the vigilance task after the completion treatment period (Fig. 2G). We were able to extract complete training datasets from 20 MediTrain participants (see Methods for details). We found a significant negative correlation (Pearson r18 = −0.59, p = 0.01), indicating that the participants who advanced the most in the amount of time they could maintain focus on their breath showed the greatest decrease in RTVar on the independent outcome measure (i.e., improvement in sustained attention). These data support the conclusion that the mechanistic action driving the benefit in sustained attention is the improved ability to sustain focus on one’s breath, fostered via the adaptive nature of MediTrain.
In addition to measuring cognitive performance, participants also underwent EEG recordings during the vigilance task, enabling us to examine the neural mechanisms underlying participants’ increased ability to stabilize their attention (i.e., reduce RTVar) following the MediTrain intervention. While vigilance tasks similar to ours (e.g., other continuous performance tasks) have been frequently used to assess sustained attention and examine neural changes in older adults with cognitive decline32, little is known about the neural correlates of the RTVar performance measure in healthy young adults. In order to constrain the number of neural markers examined, we sought to identify, a priori, key neural signatures that underlie differences in RTVar. To accomplish this goal, in Experiment 3 we analyzed EEG data from an independent sample of young adults (n = 73) performing the same version of this vigilance task in other studies and assessed correlations with neural markers previously associated with attention performance (see Methods for details of Experiment 3). We identified two relevant neural markers and two measurements for each them: parietal P3b event-related potential (ERP) latency (Fig. 3A) and area under the curve (AUC; Fig. 3B) and frontal midline theta (4–7 Hz) inter-trial coherence (ITC; Fig 3C) and power (Fig. 3D) correlated significantly with RTVar on the vigilance task.
Figure 3. Correlations between RTVar and neural markers of attention for Experiment 3.

A) In an independent sample of participants (n = 69) who completed a single EEG session, RTvar during vigilance task performance was significantly correlated with the latency of the P3b ERP at parietal electrode Pz (Pearson r67 = 0.280, p = 0.020), such that participants with faster P3b latencies exhibited less variable RTs. B) RTvar was also negatively correlated with the area under the curve (AUC) for P3b at parietal electrode Pz (Pearson r67 = −0.368, p = 0.002), such that participants with greater P3b AUC values exhibited less variable RTs. C) RTvar was also significantly correlated with frontal midline theta ITC from 200–300 ms after onset of infrequent target stimuli (Pearson r67 = −0.365, p = 0.002), indicating that participants with greater frontal midline theta ITC values tend to have less variable RTs. D) We also found a correlation between RTVar and frontal midline theta power from 200–300 ms after onset of infrequent target stimuli (Pearson r67 = −0.270, p = 0.025), indicating that participants with greater frontal midline theta power tend to have less variable RTs.
Having identified these neural markers of sustained attention, we then assessed whether they were differentially impacted by training with MediTrain compared to placebo. Complete EEG datasets for participants with complete pre- and post-intervention measurements were obtained from 12 participants in each group (see Methods for details about missing data). Separate ANCOVAs of post-intervention measures revealed significantly greater levels of both mid-frontal theta ITC (F1,21 = 9.71, p = 0.005, Cohen’s d = 1.27, 95% CI: 0.33 to 0.42; Figs. 4A–C) and earlier parietal P3b latencies (F1,21 = 15.4, p = 0.001, Cohen’s d = 1.02, 95% CI: 327.5 to 353.0; Figs. 5A–C) in the MediTrain group, compared to placebo, while controlling for pre-intervention levels. Both of these group differences were driven by post-intervention improvements in the MediTrain group (see Figs 4C and 5C). There was no significant effect of the intervention on overall frontal midline theta power at post-intervention (ANCOVA F1,21 = 0.01, p = 0.92, Cohen’s d = 0.069, 95% CI: 1.17 to 2.90). In addition, there was a trend toward a greater P3b AUC after the intervention in the MediTrain group, compared to placebo (F1,21 = 3.54, p = 0.07, Cohen’s d = 0.66, 95% CI: 467.27 to 676.36). An exploratory analysis revealed a significant correlation between change in P3b latency and change in RTVar in the MediTrain group (Pearson r10 = 0.568, p = 0.05; Supplementary Fig.6).
Figure 4. Changes in mid-frontal theta ITC.

A) Time-frequency plot of the difference in theta-band ITC for MediTrain (n = 12) versus placebo (n = 12) groups at post-intervention while completing the vigilance task; B) Change scores (post – pre) for P3B latencies for individual MediTrain (blue circles) and placebo (red circles) participants. Shaded boxes represent 95% confidence intervals. C) An ANCOVA of Phase Locking Values (PLV; see Methods for details) revealed a significant difference in post-intervention theta-band ITC, corrected for pre-intervention levels (ANCOVA F1,21 = 9.71, p = 0.005, Cohen’s d = 1.27, 95% CI: 0.33 to 0.42); PLV were computed for the time window depicted by the dotted rectangle in A. *ANCOVA or one-sample t-test p < 0.05. D) Theta-band ITC differences between the MediTrain group and placebo group at the post-intervention time point was source localized to medial and lateral prefrontal cortex.
Figure 5. Changes in P3b Latencies.

A) ERP waveforms from the Pz electrode during the vigilance task for MediTrain and placebo at pre- and post-intervention; B) Change scores (post – pre) for theta ITC for individual MediTrain (blue circles) and placebo (red circles) participants. Shaded boxes represent 95% confidence intervals. C) An ANCOVA revealed a significant difference between training groups in the post-intervention P3b peak latencies (F1,21 = 15.4, p = 0.001, Cohen’s d = 1.02, 95% CI: 328 to 353). Post-hoc analyses showed that participants in the MediTrain group exhibited significantly faster P3b peaks (two-tailed paired t11 = 3.083 , p = 0.010, Cohen’s d = 0.89 95% CI: 10.4 to 62.2) at post-intervention (mean = 319.8 ms, SE = 13.9 ms) than at pre (mean = 356.1 ms, SE = 15.2 ms), while placebo participants had significantly slower P3b peaks (two-tailed paired t11 = −2.236 , p = 0.047, Cohen’s d = −0.65, 95% CI: −29.71 to −0.24) at post-intervention (mean = 360.7 ms, SE = 14.7 ms) than at pre (mean = 345.7 ms, SE = 16.7 ms); D) Topographical distribution on P3b at peak latency (350 ms) collapsed across all participants at pre. Error bars and shading represent SE of the mean, **ANCOVA p < 0.01, *two-tailed paired t-test p < 0.05.
In order to determine the anatomical substrate of these EEG markers and to link our findings to the broader literature, we performed source localization using individual neuroanatomy derived from MRI from all 12 participants from the MediTrain group who were included in the EEG analysis. Source analysis of frontal theta ITC (Fig. 4D) revealed that the peak signal was centralized to medial prefrontal cortex (an area typically associated with the default mode network33), and to lateral prefrontal cortex (more commonly associated with fronto-paririetal attention networks6). Consistent with previous studies34, we found that the P3b ERP component arose from a broadly distributed posterior temporo-parietal network that included the precuneus (Fig. 5D), which is often considered a “hub” within the default mode network33.
These neural findings provide insights into the underlying mechanisms by which this closed-loop approach to focused-attention meditation with MediTrain leads to improvements in sustained attention and are largely consistent with previous findings of neural changes following three months of traditional, intensive meditation practice31. The frontal theta rhythm has been established as a marker of attentional control35, and we have previously shown that frontal theta power changes in response to interventions that enhanced cognitive control7,36. Studies have also shown that frontal midline theta power is inversely correlated with neural activity in the default network33, where deactivation has been associated with increased task performance11. Here we show that the trial-by-trial consistency of this metric (i.e., ITC) improves following MediTrain treatment, mirroring the greater trial-by-trial consistency found for task performance (i.e., RTVar). Thus, our data suggest that enhanced stability of this network over time underlies the improved sustained attentional focus we observed following MediTrain. While other research has pointed toward power in the frontal theta signal as being an important marker of cognitive control7,36, our findings reveal that consistency in the phase of the theta oscillation from trial-to-trial, rather than simple activation of this top-down network, is critical for the ability to maintain attentional focus from moment-to-moment, and that this process is to strengthened by our meditation approach. The neural changes observed in the P3b are thought to reflect improved allocation of attentional resources. Recent evidence suggests that a complex interplay between activity in the default network and the precuneus underlies attentional stability and flexibility, respectively37. In addition, the default network has been shown to be more deactivated at rest in experienced meditation practitioners38 and the P3b is also modulated by meditation training39. In aggregate, the neural data suggest that both frontal and parietal networks drive these benefits on sustained attention.
In addition to our primary cognitive outcome task, we sought to test whether MediTrain led to more consistent performance on an attention task (Fig. 6A) that was more challenging than the vigilance task; i.e., complex visual discrimination amidst distractions (see Methods for task details). Confirming this hypothesis, an ANCOVA revealed that RTVar post-intervention was significantly lower in MediTrain (n = 22) compared to placebo (n = 19; F1,38 = 5.5, p = 0.024, Cohen’s d = −0.73, 95% CI: 0.2 to 0.3; Fig. 6B), with MediTrain participants showing a significant reduction in RTVar (Δ = −91.1ms, paired-sample t21 = 5.8, p < 0.001, 95% CI = −0.12 to −0.06; Fig 6C), while the placebo group did not change significantly (Δ = −9.1ms, paired-sample t18 = 0.15, p = 0.88, 95% CI: 0.079 to 0.069). We did not find a significant difference in overall RT (F1,38 = 1.9, p = 0.18, Cohen’s d = −0.31, 95%CI: −0.02 to 0.09) or accuracy (d′: F1,38 = 2.5, p = 0.12, Cohen’s d = 0.37, 95% CI: −0.08 to 0.7) at post-intervention, confirming that the decrease in RTVar was not achieved at a cost in performance. The finding that RTVar was diminished in an identical manner on a second, more demanding, task with external distractions, provides supporting evidence that MediTrain has a generalizable positive impact on sustained selective attention.
Figure 6. Improvements in Visual Discrimination and Working Memory.

A) Visual discrimination and distractor filtering task stimuli and protocol; B) RTVar post-treatment was significantly lower in MediTrain (MT) compared to placebo (F1,38 = 5.5, p = 0.024, Cohen’s d = −0.73, 95% CI: 0.2 to 0.3), with MediTrain participants showing a significant decrease in RTVar from pre- (mean = 329 ms, SE = 3.1 ms) to post- (mean = 248 ms, SE = 2.9 ms; t21 = −5.7, p < 0.0001, 95% CI = −0.12 to −0.06), while control participants showed no significant difference in RTVar from pre- (mean = 336 ms, SE = 3.0 ms) to post- (mean = 345 ms, SE = 5.1 ms; t18 = −0.13, p = 0.9, 95% CI: 0.079 to 0.069). C) Change scores (post – pre) for Filter RTVar for individual MediTrain (blue circles) and placebo (red circles) participants. Shaded boxes represent 95% confidence intervals. D) Change Localization Task stimuli and protocol and E) An ANCOVA showed a significant group difference in capacity (k-score: the number of items a participant is able to keep in mind during a delay) at post-training (F(1,36) = 4.4, p = 0.04, Cohen’s d = 0.66, 95% CI = 0.006 to 0.35), with MediTrain participants showing a significant increase in k from pre- (mean = 3.11, SE = 0.09) to post-training (mean = 3.3, SE = 0.08, paired-sample t19 = 3.4, p = 0.003, 95% CI = 0.067 to 0.28), while the placebo control group did not show a change in k score from pre- (mean = 3.16, SE = 0.11) to post-training (mean = 3.15, SE = 0.11, Δ = −0.02, paired-sample t18 = −0.15, p = 0.89, 95% CI = −0.16 to 0.14). F) Change scores (post – pre) for CLT k-scores for individual MediTrain (blue circles) and placebo (red circles) participants. Shaded boxes represent 95% confidence intervals. Error bars represent SE of the mean, *ANCOVA p < 0.05, **paired-samples t-test p < 0.01.
Finally, we asked whether the benefits of MediTrain generalized to improvements in working memory, an important internally-oriented form of attention40. On a test of working memory capacity (Fig 6D), we found significantly higher capacity at post-intervention in MediTrain participants (n = 20), as compared to placebo controls (n = 19; see Methods for sample size details), while controlling for pre-intervention levels (ANCOVA: F(1,36) = 4.4, p = 0.04, Cohen’s d = 0.66, 95% CI = 0.006 to 0.35; Figs. 6E & F). Further analysis revealed that MediTrain group showed increased working memory capacity from pre- to post-intervention (Δ = 0.17, paired-sample t19 = 3.4, p = 0.003, 95% CI = 0.067 to 0.28) while the placebo group did not change (Δ = −0.01, paired-sample t18 = −0.15, p = 0.89, 95% CI = −0.16 to 0.14).
In conclusion, we found that MediTrain led to improvement in the ability of healthy young adults to stabilize their attention from moment-to-moment across two independent tasks. These results suggest transfer of benefits from 6 weeks of engagement in a self-paced, internally-directed attention practice (i.e., MediTrain) to enhanced sustained attention while performing externally-directed attention tasks that demanded rapid processing speed. Coupled with the finding of increased working memory capacity, and further supported by neural data showing improved markers of attention and neural consistency, these findings offer converging evidence of improvements in attention in response to a closed-loop, digital meditation program. Critically, we observed these MediTrain-related cognitive and neural improvements in a population of young adults who face myriad modern-day challenges to their attention, further underscoring the timeliness and importance of this approach.
Limitations
While the observed improvements in sustained attention and working memory were present on average a week following the completion of the training period (i.e., post-intervention cognitive testing visits were scheduled within 2 weeks after the last training day), no conclusions can be made regarding the long-term durability of the observed beneficial effects of MediTrain. In addition, future replication studies on larger and more diverse populations will be important to confirm the robustness and generalizability of the positive effects reported here.
Methods
Experiment 1: Expectancy-matched Placebo Control Selection.
All methods were carried out in accordance with relevant guidelines and regulations approved by the UCSF Committee on Human Research’s Institutional Review Board and all participants gave informed consent and received monetary compensation for their participation. We first conducted a study using Mechanical Turk41 to identify apps that were matched to MediTrain in terms of participants’ expectations regarding potential beneficial outcomes of cognition or behavior12,42, but we did not hypothesize that they would improve attention43. We used an empirical assessment of participants’ expectations44 of training-related gains in cognition to find a combination of apps that would act as an appropriate placebo control for our MediTrain intervention. Expectancy matching here involved showing participants a recording of either MediTrain or the placebo apps, followed by a video describing each of the cognitive outcomes, and then asked them to rate the extent to which training with the displayed intervention would lead to improvements on each of the outcomes (see Methods for Experiment 2 below for detailed descriptions of Treatment Programs and Cognitive Outcomes). We used an iterative process of comparing 10 different apps to MediTrain in a sample of 261 participants. No statistical methods were used to pre-determine sample sizes, but we aimed for a target sample of 25 on each app. Each participant was randomly assigned to view a video of MediTrain or one of the 10 potential apps (n = 15–30 per app). Based on this first round of testing, we selected three apps that had the highest potential for expectancy matching and ran a final comparison of this combination of apps against MediTrain. In our final comparison on a sample of 73 young adults, also recruited through Mechanical Turk (yielding a total n of 334 for Experiment 1), we found that these three apps (n = 37) revealed no significant differences, compared to MediTrain (n = 36), in participant expectations of improvement on our primary outcome of sustained attention (vigilance task, t71 = 0.39, p = 0.7, Cohen’s d = 0.1, 95% CI: −0.7 to 1.1), or any secondary outcome (distractor filtering, t71 = 0.45, p = 0.65, Cohen’s d = 0.1, 95% CI: −0.7 to 1.2; working memory capacity, t71 = −.22, p = .83, Cohen’s d = 0.05, 95% CI: −1.1 to 0.9; or working memory fidelity, t71 = 0.53, p = 0.6, Cohen’s d = 0.1, 95% CI: −0.7 to 1.3), indicating the identification of an appropriate placebo control condition. These apps included a foreign language learning app, a stretching app, and a logic games app (see details below).
Experiment 2: Randomized, Placebo-controlled Trial of MediTrain.
Participants and Randomization.
We recruited 59 healthy young adults (18–35 years of age) who met our inclusion criteria for this longitudinal study. Participants were recruited from the local community using flyers posted at local colleges and universities, though online ads, and via word of mouth. All participants were screened for a history of neurological disease or current psychiatric illness and current use of psychotropic medications. We only enrolled participants who did not have a history of meditation experience, defined as currently practicing one or more days per week, having practiced on a weekly basis in the past, or having attended a meditation retreat of three or more days. These criteria for defining a sample as meditation-naïve are consistent with prior studies45 and were developed through conversations with expert colleagues familiar with such designs (Stuart Eisendrath, personal communication). We performed vision testing with a Snellen chart and acuity differences were corrected to 20/40 or better. All participants gave informed consent to participate in the study according to procedures approved by the Committee for Human Research at the University of California San Francisco and were compensated $15 per hour of time spent in the laboratory for cognitive testing or EEG recordings and for each hour spent training at home with a treatment program, as well as a $50 “completion bonus” for completing all required training days and outcomes (for a possible total compensation of ~$600 for the entire study).
Participants were then randomized to either the MediTrain group or the placebo control group (see Supplementary Figure 2 for Consort Table). The study was designed in a double-blinded manner, such that all participants received the same instructions and laboratory personnel who were collecting data were unaware of group assignments. Double-blinding began at the point of recruitment, where all participants were informed that they were being recruited for a study designed to test the efficacy of software interventions for improving cognition in a variety of domains. As such, participants in both the MediTrain and placebo groups had equal expectations that they were part of an active treatment group (see below for details on establishing matched expectancy of improvement across conditions). All staff that collected data were blind to group assignment; one study coordinator (S.S.) was informed of the treatment assignments in order to provide technical and other support during the training. Randomization resulted in 32 participants assigned to MediTrain and 27 assigned to placebo control. With two time points and assuming a moderate repeated measures correlation (r = 0.5) and a two-tailed test (α = .05), we calculated that n = 30 per group would yield 75%46,47 to detect a change with a medium effect size (.5)48. Over the course of the study, 8 MediTrain participants and 7 controls voluntarily withdrew from the study for various personal reasons (but not due to adverse events), resulting in complete pre-/post-training data sets from 24 MediTrain participants (13F) and 20 placebo controls (12F).
We excluded two MediTrain participants’ data from all analyses due to obvious irregularities in their software usage, resulting in a final as-treated sample of n=22 in MediTrain. Given the likelihood that these participants were not accurately engaging in the MediTrain treatment, we excluded them from all further analyses. We were also unable to recover complete week-by-week training data from two MediTrain participants due to malfunctions with the iPads (but we were able to confirm in the app that both had completed the required number of sessions); data from these participants were not included in the training curve correlations (Fig 1. and Fig. 2G). Two placebo control participants were excluded from analysis of the vigilance task behavioral data because they were extreme outliers (i.e., > 2.5 SD above or below the mean), resulting in a final as-treated sample of n = 22 in MediTrain and n = 18 in placebo for that task. For the Filter Task, one control participant did not complete the task at post-training due to a software malfunction, resulting in a total sample of n = 22 in MediTrain and n = 19 in placebo. For the Change Localization Task, one control and two MediTrain participants did not complete the task at post-training due to a software malfunction, resulting in a total sample of n = 20 in MediTrain and n = 19 in placebo.
Treatment Program.
All participants completed the intervention at home using an iPad Mini 2 (iOS version 8.2) that was supplied by the UCSF Neuroscape Center. Each software program included self-contained instructional videos and practice modules. Participants were provided access to a website containing instruction reminders, a calendar, and email support throughout the treatment period. Each tablet was configured to transmit data automatically to our secure Neuroscape server wirelessly as each session was completed, allowing us to monitor compliance and data integrity in real time. Throughout the treatment period, technical support for the iPads and all software was provided via email, phone, and in-person contact, when needed.
Meditation Group.
The MediTrain program was designed as an integration of meditation-based practices and approaches from plasticity-based, attention-training methods, including quantifiable goals, feedback and adaptivity. Participants were instructed to engage in the training in a quiet location, free of external auditory distractions, with headphones on and eyes closed, and to attend to the sensations of their breath. Prior to the initial day of treatment, the program required participants to listen to and/or read detailed instructions about how to engage in the treatment and use the iPad (approximately 15min). Following these technical instructions, participants listened to and/or read a short “lesson” about mindful breathing practices (see Supplementary Information), written and narrated by Jack Kornfield, an expert teacher of meditation and mindfulness. While focusing on their breath, they were asked to monitor the quality of their attention and to be particularly aware of any internal distracting thoughts that may arise. When these thoughts did occur, participants were instructed to acknowledge the distraction, disengage from it, and shift their attention back to their breath.
For the treatment, the length of the initial trial was set at 20 seconds, based on feedback and results from pilot testing. At the end of each trial, participants were asked to report, via button-press, whether their attention remained on their breath throughout the trial, or if their attention was diverted, even once, by distracting thoughts (i.e., mind-wandering). If they successfully attended to their breath without distraction for the entire trial, the duration of the next trial was increased by 10%; if unsuccessful, the duration of the next trial is decreased by 20% seconds. By adaptively modifying the duration of the trials based on this criterion, we thresholded each participants’ ability to self-regulate internal attention. Training sessions were linked, such that the next session begins at the level attained at the end of the previous session, and participants started at the same level at which they ended on subsequent training days. Participants are provided two types of feedback: 1) real-time feedback – indicating whether the participant successfully detected or classified the target and 2) punctuated feedback – participants advance through a series of “levels” that are reported at the beginning and end of each run.
MediTrain training curves and slopes.
In order to correlate MediTrain app performance improvements with cognitive outcome improvement, we calculated training slopes. Training curves for each MediTrain participant are shown in Figure 1, with the final meditation time achieved during the final session of each week plotted for all six weeks. We were unable to obtain full weekly data for two participants due to device malfunctions. As an index of how participants improved on MT, we calculated the improvement slope as the final session meditation time minus the meditation time achieved at the end of their first day of training divided by 30 (the total number of sessions). We then performed correlations between these slopes and RT Var on our primary outcome measure, the vigilance task (Figure 2G).
Placebo Control Apps.
As described above, in Experiment 1 we identified a set of three commercially available iOS apps that were matched to our MediTrain program in terms of expectation of improvement on our cognitive outcome measures. Those apps were a foreign language learning app (Duolingo; www.duolingo.com), a Tai Chi app (Tha Chi Step by Step; www.imoblife.net), and a logic games app (100 Logic Games; www.andreasabbatini.com/LogicGames.aspx). For Duolingo, participants were given a choice of which foreign language they wanted to learn from those available on the app store. Within the app, we set a 10 min training time per day. During training, the app takes users through a series of modules that increase in difficulty and are only unlocked sequentially following completion of an earlier module. Modules are organized topically (e.g., Food, Animals, Phrases, etc) and each module contains listening, speaking, vocabulary, and translation tasks and culminates with a topic quiz. At the end of each lesson the app provides a progress report showing learning “streaks” and the accumulation of “lingots” (Duolingo currency). These feedback features are meant to keep participants motivated. For Tai Chi, users simply open the app and select from a series of modules that provide detailed and easy-to-follow instructions on how to perform many basic, intermediate, and advanced Tai Chi movements and is geared toward beginners with no Tai Chi experience. Each description can be read or listened to and is accompanied by an animation. Users are instructed to then practice the exercise themselves several times after each lesson. The logic games app is comprised of a series of “puzzle sets” that revolve around a particular theme and which get progressively more difficult as people advance. The puzzles are similar to the more well-known Sudoku puzzles, but provide a more engaging experience with colorful icons, unique rule sets for each theme, and increasing difficulty. For each puzzle, users are given a task (e.g., plant trees according to specific rules), a time limit, and a number of hints that they can unlock.
Because these apps were commercial apps and not designed to send data to our server, we took additional steps to track compliance in the placebo control group. We wrote two custom survey apps and installed them on each placebo iPad along with the placebo apps themselves. Participants were instructed to open the check-in app, complete a couple of questions about their alertness and nature of their training environment. When they submitted the survey, it automatically sent the results, with a timestamp, to our server and it also started a 30-minute timer on the iPad. The timer was to help the participants keep track of their total training time. They were instructed to try to split their time equally among the three apps. When the timer went off, the participants then opened the check-out app and completed another set of questions pertaining to their impression of how they felt about their training that day; the result and a timestamp were then sent to us, allowing us to monitor the start and end training times for every session each participant completed. Participants were instructed to spend approximately 10min with each app each training day (5 days per week for 6 weeks). For Duolingo, the time was set internally in the app. For the other two apps, participants self-timed their training, but with the overall amount of time monitored by the timer app.
Cognitive outcome measures.
We pre-selected one primary cognitive outcome measure (sustained attention), two secondary cognitive outcome measures (distraction filtering and working memory capacity) and an exploratory measure (working memory fidelity; see Supplementary Information for results) to quantify the extent to which each training task exhibited generalization, or transfer, of benefits. All participants were brought back into the lab for cognitive testing and neural recordings 1–2 weeks following the completion of their training regime.
Primary Behavioral Outcome: Sustained Attention.
Our primary outcome measure was a modified version of a well-validated Vigilance Task (Figure 2A), the Test of Variables of Attention (TOVA)49, which provides an index of sustained attention. We have used this task as an outcome measure in previous intervention studies from Neuroscape7,36. The experiment was programmed in Presentation (http://neurobs.com) and the stimuli were presented on a CRT monitor. For the present study, we adapted the task for use with EEG recordings. In this task, participants maintain fixation on a central crosshairs and grey squares are shown on a black background at the top or bottom of the field of view. To test sustained attention, stimuli are presented frequently at the top of the screen and participants are instructed to only respond to the infrequently occurring square in the bottom of the screen. The target-to-non-target ratio is 1:4 (one target for every 4 non-targets), thus requiring participants to sustain their attention over a long period. Participants completed 2 blocks of 125 trials with 25 targets per block, yielding 50 total targets.
Secondary Behavioral Outcome: Complex Visual Discrimination Amidst Distractions.
We used the Filter Task50 (Figure 6A) to assess another aspect of sustained attention: complex visual discrimination amidst distractions. The version that we used was modified to evaluate how well participants were able to ignore task-irrelevant information51,52. The experiment was programmed in MATLAB’s psychophysics toolbox (http://psychtoolbox.org/) and the stimuli were presented on a CRT monitor. In this task, participants must attend to an array of different numbers of items (either 1 or 3 red rectangles) with or without the presence of 2 visual distractors (2 blue or green rectangles): set size 1 no distractors (1 total item), set size 1 with distractors (3 total items), set size 3 no distractors (3 total items), set size 3 with distractors (5 total items). Half of each of the trials for each condition began with a cue indicating the participant should attend to either the left or the right side of the screen. The procedure for each trial began with a 750 ms fixation cross following by a right/left cue (200ms) and then a 300 ms blank ISI. Next, a sample set from one of the four conditions was shown for 200ms followed by a 900 ms blank delay and then a probe set containing the same number of red rectangles as in the sample in either the same orientation or with a single rectangle of altered orientation (50% of each). The probe screen remained visible until participants responded with a “Yes” or “No” button press indicating whether or not one of the attended rectangles changed orientation. Participants completed 8 blocks of 80 trials, yielding 160 trials per condition. Participants were instructed to respond as fast as possible without sacrificing accuracy.
Secondary Behavioral Outcome: Working Memory Capacity.
To assess working memory capacity, all participants completed 60 trials of the Change Localization Task (Figure 6D)53. The experiment was programmed in E-Prime (https://pstnet.com/products/e-prime/) and the stimuli were presented on a CRT monitor. The stimuli were colored squares (0.7° x 0.7°) that were presented on a gray background. On each trial, the color of each of the four squares was selected randomly without replacement from six possible colors. Each square was presented at a random location within an imaginary circle with a 3° radius. On each trial, participants were first presented with a fixation cross for 500ms, followed by an array of four colored squares which remained visible for 100ms and was followed by a 900ms delay/retention interval where only the fixation cross was visible. The delay was followed by a test array of four squares in which the color of three squares was unchanged and the color of one square was different. Participants were instructed to select the square that did change color. A mouse was used to make the selection, and thus we were not able to reliably measure RTs in this experiment. This response was self-paced and trials were separated by a 2,000-ms inter-trial interval. A “K score” was then calculated for each participant (K = % correct X number of items in memory array), providing an index of their overall working memory capacity before and after training.
Exploratory Behavioral Outcomes: Working Memory Fidelity.
We used a delayed recognition paradigm designed to measure changes in participants’ ability to maintain an accurate mental representation of items in working memory either in presence or absence of distracting or interfering information. We have used versions of this task in numerous previous studies54,55, including one other cognitive training study7 where the methods are described in detail. To summarize briefly, this paradigm consisted of four different conditions that were presented in blocks: 1) no distraction (ND), 2) Ignore distractor (distractor was present, but participants were informed that the distractor was to be ignored), 3) Attend Distractor (participants were required to made a judgment about the interfering stimulus), and a passive view (PV) control condition which did not have a memory component and participants simply viewed face or scene stimuli after which they were instructed to respond as quickly as possible to a left or right arrow with a left or right button press. Each run was preceded by an instruction slide informing the participant which condition they would be performing. Each trial began with the presentation of a face displayed for 800 ms, followed by a delay period (3 s), the presentation of a face stimulus as a distractor in the ID and AD conditions (800 ms), a second delay period (3 s), and the presentation of a face probe (1 s). The participants were instructed to make a match/nonmatch button press response at the probe as quickly as possible, without sacrificing accuracy. This was followed by a self-paced inter-trial interval (ITI). The experiment was programmed in E-Prime (https://pstnet.com/products/e-prime/) and the stimuli were presented on a CRT monitor. Results from this outcome are presented in Supplementary Information.
Post-Intervention Survey of Training Expectancy.
In addition to using the results from Experiment 1 to guide our choice of placebo control, we also sought to confirm that expectations of improvements were matched in our actual training sample. Thus, immediately following the completion of all experimental tasks on the participants’ post-training laboratory session, we ended by collected survey data about the participants’ expectations that their assigned intervention would improve their performance on each of the outcome tasks (the procedure was the same as Experiment 1, but simply performed after the end of the post-training experimental session). We did not find a significant difference in the expectation of improving on any of our four outcome measures (see Supplementary Table 1 for means and statistics). These data confirmed that there was no significant difference between the MediTrain and Placebo control groups in their expectations that they would improve on each cognitive task.
EEG Recordings and Analyses.
We collected EEG data while participants performed the vigilance task before and after the six-week treatment programs. We were unable to collect EEG data from three participants at pre-training due to equipment malfunctions and due to technical issues with photodiodes we were unable to time-lock the EEG to the event onsets for several other participants (n = 4 at pre-training, n = 4 at post-training). Further, we excluded datasets where excessive noise led to 30% of target trials being rejected, with the rejection criteria being anything greater than a +/− 100μV voltage deflection within an epoch 56(n = 4 at pre-training, n = 3 at post-training). In the MediTrain group, there were ultimately 14 participants with usable EEG data at pre- intervention, and 21 participants at post. In the placebo group, there were 16 participants with usable data at pre-intervention, and 15 participants at post. Due to the longitudinal design of the experiment, the ANCOVA could only be performed on participants who had usable data at both pre and post-intervention. Thus, the MediTrain group had 12 participants that were included in the analysis, and the placebo group had 12 participants. In order to ensure that this sub-sample did not differ significantly from the full cohort, we performed an ANCOVA of post-intervention RTVar for the vigilance task and found that participants with and without EEG data did not differ significantly (F1,36 = 0.021, p = 0.88, Cohen’s d = 0.013, 95% CI: 66.7 to 83.4). Further, to ensure that this subset was representative of the larger samples, we performed additional ANCOVAs of RTVar for the vigilance task in these participants and found comparable effects: compared to placebo, MT showed lower RTVar at post-intervention, when covarying for pre-training levels (F1,21 = 4.9, p = 0.037, Cohen’s d = 0.76, 95% CI: 65.5 to 86.5). Post-hoc within-group t-tests showed that this effect is driven by a decrease within MT (paired t11 = 2.47, p = 0.031, Cohen’s d = 0.71, 95% CI: 1.3 to 22.8; pre mean = 69.8 ms, SE = 4.2 ms; post mean = 57.7 ms, SE = 5.0 ms), while placebo did not change (paired t11 = −0.86, p = 0.411, Cohen’s d = −0.25, 95% CI: −27.4 to 12.1; pre mean = 86.6 ms, SE = 9.6 ms; post mean = 94.2 ms, SE = 11.7 ms).
All EEG data were recorded and analyzed using identical methods to those used in Experiment 3 (see below). Based on results from Experiment 3, we tested for differences at post-training, while controlling for baseline values using an ANCOVA, for the following measures:
Frontal Midline Theta Analysis. The results from Experiment 3 showed that frontal midline theta (4–7 Hz) ITC from 200–300 ms after onset of infrequent target stimuli was significantly correlated with RTvar in the vigilance task (Fig. 3C). Additionally, meditation engagement has been shown to increase theta-band ITC in frontal midline electrode sites during a sustained attention task, and this change was accompanied by a change in RTvar31. There is a rich literature associating frontal midline theta power with attentional control abilities35, and we have previously shown that this measure is sensitive to change in response to cognitive interventions7,36. Thus, we investigated whether the average theta-band ITC and power from 200–300 ms post-stimulus onset in a cluster of frontal midline electrodes (FCz, Fz, FPz, AF3, AF4, and AFz) was modulated as a result of the intervention in Experiment
P3b ERP Analysis. The P3b is hypothesized to reflect the allocation of attention resources57. Results from Experiment 3 demonstrated that the P3b AUC and latency were significantly correlated with RTvar (Fig. 3A & B). Additionally, prior studies have demonstrated that the P3b can be modulated by meditation training39. Thus, we examined whether the speed and quantity of attentional resources deployed upon target stimulus detection, as indexed by the P3b latency and AUC, respectively, were modulated by the MediTrain intervention. P3b AUC was calculated at the Pz electrode from a time window of 250–500ms after stimulus onset58, and P3b latency was calculated as the time point within this window when maximum voltage was reached. We also conducted a post-hoc analysis to determine the test-retest reliability of the P3b latencies and found the Intraclass Correlations to be high (ICC r22 = 0.7, p < 0.01; Supplementary Figure 5).
EEG Source Localization.
For the purposes of source localization, we collected a high-resolution T1-MPRAGE structural MRI scan from each participant for whom we had a complete EEG dataset (n = 12 per group). All MRIs were obtained on a Siemens 3 T Magnetom Trio equipped with a 12-channel Matrix head coil using the following sequence parameters: voxel size=1.0mm isotropic, TR = 2300ms, TE = 2.98 ms, TI = 900ms, flip angle = 9°. T1-weighted MRI data were processed using the FreeSurfer (http://surfer.nmr.mgh.harvard.edu) morphometric analysis tools. Cortical surfaces were reconstructed using a semi-automated procedure that has been described at length in previous work59–61.
We source localized each participant’s EEG data to their FreeSurfer cortical surface to visualize where the signals of interest are arising from. To achieve this, we used the openMEEG software62, implemented through the Brainstorm63 MATLAB toolbox, to perform boundary element method (BEM) forward modeling. Once forward models were constructed, we used sLORETA to estimate the sources of EEG activity recorded at the scalp. Source estimations of the P3b were projected onto a 15000 vertex cortical surface reconstruction. We computed the grand average of the source projected ERP collapsed across both groups at the pre-intervention assessment, and visualized the cortical distribution of the P3b ERP component at the latency at which the maximum amplitude occurs (350 ms). Before computing the source estimation of the frontal midline theta ITC, we down-sampled the cortical surface reconstruction to 2500 vertices to reduce the computational burden during subsequent processing steps without significantly altering the spatial resolution of the data. The ITC time series was computed by resolving 4–40 Hz activity using EEGLAB’s fast Fourier transform on the source-projected EEG. Using this method, we were able to obtain the ITC time series at each cortical vertex in the source-reconstructed EEG data. We then subtracted the mean ITC at each time point in the placebo group from the mean ITC in the MediTrain group, and visualized this contrast at the latency at which the group contrast is greatest (260 ms). Thus, using this technique, we were able to visualize the cortical distribution of where there is an intervention-related effect on ITC. We did not use this same procedure when visualizing the P3b, because the intervention-related effects on the P3b amplitude were more diffuse than for frontal midline theta ITC. Thus, we only visualized the source-projected topography of the P3b to demonstrate its parietal origins, rather than visualizing intervention-related effects on this component.
Intervention Protocols.
After completing their in-lab cognitive and EEG testing sessions, all participants were supplied with an iPad with their assigned training regime pre-loaded. An experimenter who was not involved in data collection provided detailed instructions for training; these instructions were also accessible to the participants at any time via a customized website and a study coordinator was available by email or phone to answer questions and troubleshoot the technology throughout the study. Both groups engaged with their apps for 6 weeks, starting with 20min per day in weeks 1 and 2, 25min per day in weeks 3 and 4, and ending with 30min per day in weeks 5 and 6. This gradual increase in engagement time was meant to mimic the progression in a more traditional meditation training. Because the placebo group engaged in off the shelf apps that did not send data to our servers, we required the placebo control participants to submit a “check-in” and “check-out” survey directly from their iPads. The purpose of the check-in/out was to have a timestamp of when the participants began and ended their training to ensure compliance. After 6 weeks of training, participants returned to the lab for another cognitive testing session that was identical to the pre-treatment visit.
Statistical Methods.
All initial analyses were conducted by researchers blind to group membership. All statistical tests were two-tailed, and each behavioral and neural measure met the assumptions of normality for parametric statistics (testing using the Shapiro-Wilk test). To test for training effects on our cognitive outcomes, we used an ANCOVA approach, whereby the dependent variable is post-training performance with group (MediTrain vs placebo) as the primary independent variable and pre-training performance on the same task is included in the analysis as a continuous covariate. This approach is considered to be preferable to analysis of gain scores or to repeated measures or mixed model ANOVAs when post-test performance that is not conditional on pre-test performance is the primary outcome in a test of a treatment or intervention64,65. This is an approach we have used in previous intervention studies7,36. Given that our population was healthy young adults who tend perform at near-ceiling levels on many cognitive tasks and because our primary hypothesis was that MediTrain would improve sustained attention abilities, we focused on RTVar as our primary metric, with additional secondary analyses of RT and a discrimination index (d′) All data met the assumptions required for parametric statistics and were screened for outliers. For post-hoc analysis of the within-group changes following a significant main effect in each ANCOVA, we performed two-tailed, paired-sample t-tests on each group separately to test for significant differences from pre- to post-training. Because these tests were performed separately on independent outcome variables, and only one test for each group (MediTrain and placebo), we did not perform a statistical correction for multiple comparisons. In order to derive Cohen’s d effect size scores that reflected the significant group by time interactions, we computed change scores for RTvar from pre- to post-treatment on all measures of interest. We also used these change scores to test for outliers, defined as falling more than three SD beyond the group mean. On the vigilance task, change scores for RTvar revealed two participants who qualified as outliers, with change scores greater than four standard deviations for the rest of the group. As a result, we excluded two control participants from the vigilance task analyses, in addition to the two MediTrain participants who were excluded from all analyses based on analysis of training slopes, described above. To test whether there was a relationship between the training curves and changes in RTvar, we computed a slope for each MediTrain participant (final meditation duration – initial meditation duration / 6 weeks of training) and calculated Pearson correlations between the slopes and change in RTvar.
We used the same ANCOVA approach to test for training effects on our EEG outcome measures, with post-intervention metrics set as dependent variables, and group (MediTrain vs placebo) as the primary independent variable, with pre-intervention metrics set as a continuous covariate. All of these data were screened for parametric assumptions, and any outliers that were excluded from the behavioral analysis above were also excluded from the EEG outcomes analyses. Group-wise post-hoc tests were performed in a manner analogous to that used for behavioral data (described above).
Experiment 3: Selecting EEG Measures for Analysis.
To generate an a priori hypothesis of which neural measures we would expect to change with treatment (Experiment 2), we analyzed EEG data from 73 healthy younger adults (19–32 years of age) while performing the vigilance task. These data were collected as part of other experiments in our Center, and thus constitute an independent sample. No statistical methods were used to pre-determine sample sizes. All data were processed using the same parameters as the data from Experiment 3. Traditional ERP and spectral markers of attentional control (i.e., P1/N1, P3b, frontal midline theta power and ITC, and posterior alpha power)7,34,35,37,66,67 were extracted from the data and correlated with RTvar on the vigilance task. We found two neural markers, and two measurements from each of these, were significantly correlated with RTV: 1) frontal midline theta inter-trial coherence (ITC) and power and 2) P3b latency and area under the curve (AUC). Thus, these neural measures were analyzed for intervention-related change in the MediTrain study (Expt 2 above).
EEG Recordings.
Neurophysiological data were recorded during cognitive outcome testing using an active two head cap (Cortech Solutions) with a BioSemiActiveTwo 64-channel EEG acquisition system in conjunction with BioSemiActiView software (Cortech Solutions). Signals were amplified and digitized at 1024 Hz with a 16-bit resolution. Anti-aliasing filters were used and data were band-pass filtered between 0.01–100 Hz during data acquisition. For each EEG recording session, a 1 × 1-inch white box was flashed for 10 ms at one of the corners on the stimulus presentation monitor at the start of each trial. A photodiode (http://www.gtec.at/Products/Hardware-and-Accessories/g.TRIGbox-Specs-Features) captured this change in luminance to facilitate precise time-locking of the neural activity associated with each sign event. During the experiment, these corners were covered with tape to prevent participants from being distracted by the flashing light.
EEG Preprocessing.
Preprocessing was conducted using the EEGLAB software68. Noisy channels were identified upon initial visual inspection, were removed from the data, and interpolated using a spherical spline interpolation, using the average signal of the surrounding channels to reconstruct the data in the removed channel. The data were then down-sampled to 1024 Hz to reduce the computational demand without losing any important information in the data. A finite impulse response filter with a highpass cutoff of 1 Hz was applied to remove drift, and then a low-pass filter at 40 Hz was applied to remove high frequency noise. Ocular correction was performed by using ICA to isolate and remove activity induced by eye-blinks and lateral eye movements from the signal. The data were then re-referenced to the average signal of all channels. Epochs of −1000 ms to +1000 ms were generated for each stimulus type for subsequent analyses. Epochs containing excessive peak-to-peak deflections (±100 μV) were removed.
Frontal Midline Theta Analysis.
Frontal midline inter-trial coherence (ITC) and power have both been implicated in sustained attention abilities7,31,35,66, including correlating with RTVar across the lifespan67. ITC is a measure that reflects the extent to which synchronization occurs from trial to trial in EEG at a particular frequency and latency69. In other words, it is a measure of electrophysiological response consistency. ITC is quantified by the unit “phase locking value” (PLV), which ranges anywhere between 0 and 1, with a value of 0 indicating that the phase synchrony is completely random, and a value of 1 indicating that the phase-locking is perfectly synchronized across trials. ITC is defined as: ITC(f,t) = 1n∑k = 1nFk(f,t)|Fk(f,t)|. The spectral power and ITC time series were created by resolving 4–40 Hz activity using a fast Fourier transform (FFT) in EEGLAB. We found that frontal midline theta power and ITC (4–7 Hz) from 200–300 ms after onset of infrequent target stimuli are both significantly correlated with RTVar in the vigilance task (Figures 3A and 3B). We selected a cluster of frontal electrodes (FCz, Fz, FPz, AF3, AF4, and AFz) based on previous literature that has used this same electrode cluster for frontal midline theta analyses 8, and selected the 200–300 ms time window based on when frontal midline theta reaches its peak power (247 ms). Thus, the 200–300 ms time window captures peak power and with approximately +/− 50 ms on both ends. We did not use a larger time window to avoid potentially introducing motor-related activity into the signal of interest, as average response times occur at 358 ms.
ERP Analysis.
Event-related potentials (ERP) time-locked to target trials were generated from the preprocessed EEG data recorded from participants while they performed the vigilance task. ERPs were baseline corrected to the average voltage 200 milliseconds (ms) preceding stimulus onset. Before artifact rejection, there were a total of 50 trials that contained the target stimulus. The median number of trials that met the criteria for being excluded from further analysis was 1, with no participant having more than 7 trials that contained supra-threshold artifacts.
We found that the area under the curve (AUC) of the P3b ERP component elicited by rare target stimuli is highly correlated with RTvar during vigilance task performance (Figure 3C). Infrequent target stimuli during visual sustained attention tasks has been shown to reliably evoke strong P3b ERP components66, which is hypothesized to reflect allocation of attention resources, and has been shown to be modulated by meditation training39. Thus, we focused our ERP analysis on the P3b component in the Pz electrode, which is the location that the P3b is commonly reported to reach its maximum amplitude70. We computed the AUC and the peak latency from a time window of 250–500ms after stimulus onset, which is a time window commonly used to define the P3b71. The P3b peak latency was calculated at the time point at which maximum voltage was reached within this 250ms second window.
Supplementary Material
Acknowledgements.
We would like to thank Hyein Cho, Sophia Corona, Alex Ho, Kylie Huang, Julia Kang, Daniel Kingsbrook, Ryan LoPilato, Minsu Kim, Jordie Martin, Lindsey Martin, Anette Recinos, and Madelyn Torres for help with data collection and Theodore Zanto for advice on EEG data analysis and interpretation. Thanks to Ahmed Denison-Afifi, Abby Speight, Kim Stern, Ken Weber, and numerous other volunteers at Zynga.org for assistance in designing and building the MediTrain software and to Alan Duanmu for critical programming support of the application during the study. We also thank Richard Campusano, Jo Gazzaley, Alan Leggitt, and Helen Weng for helpful discussions. Thanks to all of our participants and to Apple who generously provided many of the iPads used in this study. Jamie Gates, Evan and Sara Williams, Zynga.org, and NIH grants R21 AG041071 and R01 AG049424 provided financial support for this research. The funders had no role in study design, data collection and analysis, decision to publish or preparation of the manuscript.
Footnotes
Data availability
The data that support the findings of this study are available from the corresponding authors upon reasonable request.
Code availability
The code used in the analysis of EEG data reported in this paper is available from the corresponding authors upon reasonable request.
Competing Interests. AG is co-founder, shareholder, BOD member, and advisor for Akili Interactive, a company that produces therapeutic video games. MediTrain and the apps used for the control condition are not currently associated with Akili. The other authors declare no competing interests.
References
- 1.Rideout VJ, Foehr UG & Roberts DF Generation M2: Media in the Lives of 8- to 18-Year-Olds. (2010). [Google Scholar]
- 2.Moisala M et al. Media multitasking is associated with distractibility and increased prefrontal activity in adolescents and young adults. Neuroimage 134, 113–121 (2016). [DOI] [PubMed] [Google Scholar]
- 3.Ophir E, Nass C & Wagner AD Cognitive control in media multitaskers. Proceedings of the National Academy of Sciences of the United States of America 106, 15583–15587 (2009). [DOI] [PMC free article] [PubMed] [Google Scholar]
- 4.Ralph BC, Thomson DR, Cheyne JA & Smilek D Media multitasking and failures of attention in everyday life. Psychological research 78, 661–669 (2014). [DOI] [PubMed] [Google Scholar]
- 5.Chun MM, Golomb JD & Turk-Browne NB A taxonomy of external and internal attention. Annu Rev Psychol 62, 73–101 (2011). [DOI] [PubMed] [Google Scholar]
- 6.Posner MI & Petersen SE The attention system of the human brain. Annual review of neuroscience 13, 25–42 (1990). [DOI] [PubMed] [Google Scholar]
- 7.Anguera JA et al. Video game training enhances cognitive control in older adults. Nature 501, 97–101 (2013). [DOI] [PMC free article] [PubMed] [Google Scholar]
- 8.Cortese S et al. Cognitive training for attention-deficit/hyperactivity disorder: meta-analysis of clinical and neuropsychological outcomes from randomized controlled trials. J Am Acad Child Adolesc Psychiatry 54, 164–174 (2015). [DOI] [PMC free article] [PubMed] [Google Scholar]
- 9.Tang YY & Posner MI Attention training and attention state training. Trends Cogn Sci 13, 222–227 (2009). [DOI] [PubMed] [Google Scholar]
- 10.Bediou B et al. Meta-analysis of action video game impact on perceptual, attentional, and cognitive skills. Psychol Bull 144, 77–110 (2018). [DOI] [PubMed] [Google Scholar]
- 11.Brefczynski-Lewis JA, Lutz A, Schaefer HS, Levinson DB & Davidson RJ Neural correlates of attentional expertise in long-term meditation practitioners. Proc Natl Acad Sci U S A 104, 11483–11488 (2007). [DOI] [PMC free article] [PubMed] [Google Scholar]
- 12.Simons DJ et al. Do “Brain-Training” Programs Work? Psychological science in the public interest : a journal of the American Psychological Society 17, 103–186 (2016). [DOI] [PubMed] [Google Scholar]
- 13.Weyandt LL et al. Prescription stimulant medication misuse: Where are we and where do we go from here? Experimental and clinical psychopharmacology 24, 400–414 (2016). [DOI] [PMC free article] [PubMed] [Google Scholar]
- 14.Benson K, Flory K, Humphreys KL & Lee SS Misuse of Stimulant Medication Among College Students: A Comprehensive Review and Meta-analysis. Clin Child Fam Psych 18, 50–76 (2015). [DOI] [PubMed] [Google Scholar]
- 15.Herman L et al. The use of prescription stimulants to enhance academic performance among college students in health care programs. The journal of physician assistant education : the official journal of the Physician Assistant Education Association 22, 15–22 (2011). [DOI] [PubMed] [Google Scholar]
- 16.Lutz A, Slagter HA, Dunne JD & Davidson RJ Attention regulation and monitoring in meditation. Trends Cogn Sci 12, 163–169 (2008). [DOI] [PMC free article] [PubMed] [Google Scholar]
- 17.Chiesa A, Calati R & Serretti A Does mindfulness training improve cognitive abilities? A systematic review of neuropsychological findings. Clin Psychol Rev 31, 449–464 (2011). [DOI] [PubMed] [Google Scholar]
- 18.Zeidan F, Johnson SK, Gordon NS & Goolkasian P Effects of brief and sham mindfulness meditation on mood and cardiovascular variables. J Altern Complement Med 16, 867–873 (2010). [DOI] [PubMed] [Google Scholar]
- 19.Morrison AB, Goolsarran M, Rogers SL & Jha AP Taming a wandering attention: short-form mindfulness training in student cohorts. Front Hum Neurosci 7, 897 (2014). [DOI] [PMC free article] [PubMed] [Google Scholar]
- 20.Tang YY et al. Short-term meditation training improves attention and self-regulation. Proc Natl Acad Sci U S A 104, 17152–17156 (2007). [DOI] [PMC free article] [PubMed] [Google Scholar]
- 21.Deci EL, Koestner R & Ryan RM A meta-analytic review of experiments examining the effects of extrinsic rewards on intrinsic motivation. Psychol Bull 125, 627–668; discussion 692-700 (1999). [DOI] [PubMed] [Google Scholar]
- 22.Spijkerman MP, Pots WT & Bohlmeijer ET Effectiveness of online mindfulness-based interventions in improving mental health: A review and meta-analysis of randomised controlled trials. Clin Psychol Rev 45, 102–114 (2016). [DOI] [PubMed] [Google Scholar]
- 23.Mani M, Kavanagh DJ, Hides L & Stoyanov SR Review and Evaluation of Mindfulness-Based iPhone Apps. JMIR Mhealth Uhealth 3, e82 (2015). [DOI] [PMC free article] [PubMed] [Google Scholar]
- 24.Noone C & Hogan MJ A randomised active-controlled trial to examine the effects of an online mindfulness intervention on executive control, critical thinking and key thinking dispositions in a university student sample. BMC Psychol 6, 13 (2018). [DOI] [PMC free article] [PubMed] [Google Scholar]
- 25.Boot WR, Simons DJ, Stothart C & Stutts C The Pervasive Problem With Placebos in Psychology: Why Active Control Groups Are Not Sufficient to Rule Out Placebo Effects. Perspectives on psychological science : a journal of the Association for Psychological Science 8, 445–454 (2013). [DOI] [PubMed] [Google Scholar]
- 26.MacDonald SW, Nyberg L & Backman L Intra-individual variability in behavior: links to brain structure, neurotransmission and neuronal activity. Trends Neurosci 29, 474–480 (2006). [DOI] [PubMed] [Google Scholar]
- 27.Karalunas SL, Geurts HM, Konrad K, Bender S & Nigg JT Annual research review: Reaction time variability in ADHD and autism spectrum disorders: measurement and mechanisms of a proposed trans-diagnostic phenotype. J Child Psychol Psychiatry 55, 685–710 (2014). [DOI] [PMC free article] [PubMed] [Google Scholar]
- 28.Gorus E, De Raedt R, Lambert M, Lemper JC & Mets T Reaction times and performance variability in normal aging, mild cognitive impairment, and Alzheimer’s disease. J Geriatr Psychiatry Neurol. 21, 204–218 (2008). [DOI] [PubMed] [Google Scholar]
- 29.Tales A et al. Intra-individual reaction time variability in amnestic mild cognitive impairment: a precursor to dementia? J Alzheimers Dis 32, 457–466 (2012). [DOI] [PubMed] [Google Scholar]
- 30.Kalin AM et al. Intraindividual variability across cognitive tasks as a potential marker for prodromal Alzheimer’s disease. Front Aging Neurosci. 6:147 (2014). [DOI] [PMC free article] [PubMed] [Google Scholar]
- 31.Lutz A et al. Mental training enhances attentional stability: neural and behavioral evidence. The Journal of neuroscience : the official journal of the Society for Neuroscience 29, 13418–13427 (2009). [DOI] [PMC free article] [PubMed] [Google Scholar]
- 32.Braverman ER et al. Delayed P300 latency correlates with abnormal test of variables of attention (TOVA) in adults and predicts early cognitive decline in a clinical setting. Adv Ther 23, 582–600 (2006). [DOI] [PubMed] [Google Scholar]
- 33.Scheeringa R et al. Frontal theta EEG activity correlates negatively with the default mode network in resting state. Int J Psychophysiol 67, 242–251 (2008). [DOI] [PubMed] [Google Scholar]
- 34.Bledowski C et al. Localizing P300 generators in visual target and distractor processing: a combined event-related potential and functional magnetic resonance imaging study. J Neurosci 24, 9353–9360 (2004). [DOI] [PMC free article] [PubMed] [Google Scholar]
- 35.Clayton MS, Yeung N & Cohen Kadosh R The roles of cortical oscillations in sustained attention. Trends Cogn Sci. 19, 188–195 (2015). [DOI] [PubMed] [Google Scholar]
- 36.Mishra J, de Villers-Sidani E, Merzenich M & Gazzaley A Adaptive training diminishes distractibility in aging across species. Neuron. 84, 1091–1103 (2014). [DOI] [PMC free article] [PubMed] [Google Scholar]
- 37.Sali AW, Courtney SM & Yantis S Spontaneous Fluctuations in the Flexible Control of Covert Attention. J Neurosci 36, 445–454 (2016). [DOI] [PMC free article] [PubMed] [Google Scholar]
- 38.Brewer J. a. et al. Meditation experience is associated with differences in default mode network activity and connectivity. Proceedings of the National Academy of Sciences of the United States of America, 1–6 (2011). [DOI] [PMC free article] [PubMed] [Google Scholar]
- 39.Slagter HA et al. Mental training affects distribution of limited brain resources. PLoS Biol 5, e138 (2007). [DOI] [PMC free article] [PubMed] [Google Scholar]
- 40.Kiyonaga A & Egner T Working memory as internal attention: Toward an integrative account of internal and external selection processes. Psychon B Rev 20, 228–242 (2013). [DOI] [PMC free article] [PubMed] [Google Scholar]
- 41.Paolacci G & Chandler J Inside the Turk: Understanding Mechanical Turk as a Participant Pool. Curr Dir Psychol Sci 23, 184–188 (2014). [Google Scholar]
- 42.Reijnders J, van Heugten C & van Boxtel M Cognitive interventions in healthy older adults and people with mild cognitive impairment: a systematic review. Ageing Res Rev 12, 263–275 (2013). [DOI] [PubMed] [Google Scholar]
- 43.Boot WR, Simons DJ, Stothart C & Stutts C The pervasive problem with placebos in psychology: why active control groups are not sufficient to rule out placebo effects. Perspectives on Psychological Science 8, 445–454 (2013). [DOI] [PubMed] [Google Scholar]
- 44.Boot WR et al. Video games as a means to reduce age-related cognitive decline: attitudes, compliance, and effectiveness. Front Psychol 4, 31 (2013). [DOI] [PMC free article] [PubMed] [Google Scholar]
- 45.Eisendrath SJ et al. A Randomized Controlled Trial of Mindfulness-Based Cognitive Therapy for Treatment-Resistant Depression. Psychother Psychosom 85, 99–110 (2016). [DOI] [PMC free article] [PubMed] [Google Scholar]
- 46.Stevens JC Applied Multivariate Statistics for the Social Sciences. (Erlbaum Associates, 1986). [Google Scholar]
- 47.Cohen J Statistical Power Analysis for the Behavioral Sciences. 2 edn, (Erlbaum Associates, 1988). [Google Scholar]
- 48.Hedeker, Gibbons & Waternaux. Sample size estimation for longitudinal designs with attrition. Journal of Educational and Behavioral Statistics 24, 70–93 (1999). [Google Scholar]
- 49.Greenberg LMTOVA Continuous Performance Test Manual., (The TOVA Company, 1996). [Google Scholar]
- 50.Vogel EK, McCollough AW & Machizawa MG Neural measures reveal individual differences in controlling access to working memory. Nature 438, 500–503 (2005). [DOI] [PubMed] [Google Scholar]
- 51.Jost K, Bryck RL, Vogel EK & Mayr U Are old adults just like low working memory young adults? Filtering efficiency and age differences in visual working memory. Cereb Cortex 21, 1147–1154 (2011). [DOI] [PubMed] [Google Scholar]
- 52.Lee EY et al. Visual working memory deficits in patients with Parkinson’s disease are due to both reduced storage capacity and impaired ability to filter out irrelevant information. Brain 133 (2010). [DOI] [PMC free article] [PubMed] [Google Scholar]
- 53.Johnson MK et al. The relationship between working memory capacity and broad measures of cognitive ability in healthy adults and people with schizophrenia. Neuropsychology 27, 220–229 (2013). [DOI] [PMC free article] [PubMed] [Google Scholar]
- 54.Clapp WC, Rubens MT, Sabharwal J & Gazzaley A Deficit in switching between functional brain networks underlies the impact of multitasking on working memory in older adults. Proc Natl Acad Sci U S A 108, 7212–7217 (2011). [DOI] [PMC free article] [PubMed] [Google Scholar]
- 55.Clapp WC & Gazzaley A Distinct mechanisms for the impact of distraction and interruption on working memory in aging. Neurobiol Aging 33, 134–148 (2012). [DOI] [PMC free article] [PubMed] [Google Scholar]
- 56.Cohen MX & Cavanagh JF Single-trial regression elucidates the role of prefrontal theta oscillations in response conflict. Frontiers in psychology 2, 30 (2011). [DOI] [PMC free article] [PubMed] [Google Scholar]
- 57.Wickens C, Kramer A, Vanasse L & Donchin E Performance of concurrent tasks: a psychophysiological analysis of the reciprocity of information-processing resources. Science. 221, 1080–1082. (1983). [DOI] [PubMed] [Google Scholar]
- 58.Polich J & Kok A Cognitive and biological determinants of P300: an integrative review. Biol Psychol. 41, 103–146. (1995). [DOI] [PubMed] [Google Scholar]
- 59.Dale AM, Fischl B & Sereno MI Cortical surface-based analysis. I. Segmentation and surface reconstruction. Neuroimage 9, 179–194 (1999). [DOI] [PubMed] [Google Scholar]
- 60.Fischl B, Sereno MI & Dale AM Cortical surface-based analysis. II: Inflation, flattening, and a surface-based coordinate system. Neuroimage 9, 195–207 (1999). [DOI] [PubMed] [Google Scholar]
- 61.Fischl B, Sereno MI, Tootell RB & Dale AM High-resolution intersubject averaging and a coordinate system for the cortical surface. Human brain mapping 8, 272–284 (1999). [DOI] [PMC free article] [PubMed] [Google Scholar]
- 62.Gramfort A, Papadopoulo T, Olivi E & Clerc M OpenMEEG: opensource software for quasistatic bioelectromagnetics. Biomedical engineering online 9, 45 (2010). [DOI] [PMC free article] [PubMed] [Google Scholar]
- 63.Tadel F, Baillet S, Mosher JC, Pantazis D & Leahy RM Brainstorm: a user-friendly application for MEG/EEG analysis. Computational intelligence and neuroscience 2011, 879716 (2011). [DOI] [PMC free article] [PubMed] [Google Scholar]
- 64.Knapp TR & Schafer WD FromGainScorettoANCOVAF(andviceversa). Pract. Assess. Res. Eval 14, 1–7 (2009). [Google Scholar]
- 65.Locascio JJ & Cordray DS A Reanalysis of Lord Paradox. Educ Psychol Meas 43, 115–126 (1983). [Google Scholar]
- 66.Polich J Updating P300: an integrative theory of P3a and P3b. Clin Neurophysiol. 118, 2128–2148. doi: 2110.1016/j.clinph.2007.2104.2019. Epub 2007 Jun 2118 (2007). [DOI] [PMC free article] [PubMed] [Google Scholar]
- 67.Papenberg G, Hammerer D, Muller V, Lindenberger U & Li SC Lower theta inter-trial phase coherence during performance monitoring is related to higher reaction time variability: a lifespan study. Neuroimage 83, 912–920 (2013). [DOI] [PubMed] [Google Scholar]
- 68.Delorme A & Makeig S EEGLAB: an open source toolbox for analysis of single-trial EEG dynamics including independent component analysis. J Neurosci Methods. 134, 9–21 (2004). [DOI] [PubMed] [Google Scholar]
- 69.Tallon-Baudry C, Bertrand O, Delpuech C & Pernier J Stimulus specificity of phase-locked and non-phase-locked 40 Hz visual responses in human. J Neurosci. 16, 4240–4249. (1996). [DOI] [PMC free article] [PubMed] [Google Scholar]
- 70.Johnson R Jr. On the neural generators of the P300 component of the event-related potential. Psychophysiology. 30, 90–97. (1993). [DOI] [PubMed] [Google Scholar]
- 71.Polich J Updating P300: an integrative theory of P3a and P3b. Clinical neurophysiology : official journal of the International Federation of Clinical Neurophysiology 118, 2128–2148, (2007). [DOI] [PMC free article] [PubMed] [Google Scholar]
Associated Data
This section collects any data citations, data availability statements, or supplementary materials included in this article.