

Abstract
Humans learn quickly which actions cause them harm. As social beings, we also need to learn to avoid actions that hurt others. It is currently unknown whether humans are as good at learning to avoid others' harm (prosocial learning) as they are at learning to avoid self-harm (self-relevant learning). Moreover, it remains unclear how the neural mechanisms of prosocial learning differ from those of self-relevant learning. In this fMRI study, 96 male human participants learned to avoid painful stimuli either for themselves or for another individual. We found that participants performed more optimally when learning for the other than for themselves. Computational modeling revealed that this could be explained by an increased sensitivity to subjective values of choice alternatives during prosocial learning. Increased value sensitivity was further associated with empathic traits. On the neural level, higher value sensitivity during prosocial learning was associated with stronger engagement of the ventromedial PFC during valuation. Moreover, the ventromedial PFC exhibited higher connectivity with the right temporoparietal junction during prosocial, compared with self-relevant, choices. Our results suggest that humans are particularly adept at learning to protect others from harm. This ability appears implemented by neural mechanisms overlapping with those supporting self-relevant learning, but with the additional recruitment of structures associated to the social brain. Our findings contrast with recent proposals that humans are egocentrically biased when learning to obtain monetary rewards for self or others. Prosocial tendencies may thus trump egocentric biases in learning when another person's physical integrity is at stake.
SIGNIFICANCE STATEMENT We quickly learn to avoid actions that cause us harm. As “social animals,” we also need to learn and consider the harmful consequences our actions might have for others. Here, we investigated how learning to protect others from pain (prosocial learning) differs from learning to protect oneself (self-relevant learning). We found that human participants performed better during prosocial learning than during self-relevant learning, as they were more sensitive toward the information they collected when making choices for the other. Prosocial learning recruited similar brain areas as self-relevant learning, but additionally involved parts of the “social brain” that underpin perspective-taking and self-other distinction. Our findings suggest that people show an inherent tendency toward “intuitive” prosociality.
Keywords: computational modeling, empathy, fMRI, learning, prosocial behavior, valuation
Introduction
To ensure survival, it is essential that we learn to refrain from actions that cause ourselves harm. Physical pain acts as a powerful learning signal, indicating the immediate need to adjust our behavior to avoid injury (Wiech and Tracey, 2013; Vlaeyen, 2015; Tabor and Burr, 2019). As social beings, we also have to learn and adapt our behavior to avoid harm to others, and “interpersonal harm aversion” has been proposed as the basis of prosocial behavior and morality (Gray et al., 2012; Crockett, 2013; Chen et al., 2018; Decety and Cowell, 2018). However, it remains unknown whether humans are as good at learning to avoid harm to others (prosocial learning) as they are at learning to avoid harm to themselves (self-relevant learning). Moreover, while the neural underpinnings of self-relevant learning are well established, the mechanisms behind prosocial learning remain unclear.
Recent evidence suggests that other people's physical integrity is a highly relevant factor for human behavior. Crockett et al. (2014, 2015) found that individuals are willing to spend more money to protect others from pain than to protect themselves. This suggests that individuals are “hyperaltruistic” in situations where they can deliberately weigh self- and other-relevant outcomes. It remains unclear, though, whether hyperaltruism extends to situations where prosociality depends on more implicit processes, such as operant learning (Zaki and Mitchell, 2013). Other studies have proposed an egocentric bias in learning: Participants learned more slowly to gain financial rewards, and to avoid financial losses, for others than for themselves (Kwak et al., 2014; Lockwood et al., 2016), and to associate objects with others compared with oneself (Lockwood et al., 2018). Crucially, it is thus possible that humans show superior self-relevant learning in the context of financial outcomes and basic associative learning, but similar, or superior, prosocial learning when another person's health is at stake. Moreover, prosocial learning performance might vary greatly between individuals because of differences in socio-cognitive traits, such as empathy (Lockwood et al., 2016; Olsson et al., 2016; Lamm et al., 2019). Here, we therefore investigated people's performance in prosocial learning in the context of harm avoidance, and how it is associated with empathic traits.
Advances in the neuroscience of reinforcement learning (RL) (Lee et al., 2012) suggest that self-relevant learning is implemented by neural systems for two processes: valuation (i.e., choosing between alternatives based on their subjective values) and outcome evaluation (i.e., updating values in response to choice outcomes). Converging evidence suggests that both self- and other-relevant valuation engages the ventromedial prefrontal cortex (VMPFC) (Kable and Glimcher, 2009; Ruff and Fehr, 2014). Activation of the VMPFC related to valuation affecting others appears further modulated by brain areas connected to social cognition, such as the temporoparietal junction (TPJ), a region linked to self-other distinction and perspective-taking (Hare et al., 2010; Janowski et al., 2013). With respect to outcome evaluation, it has been found that learning based on pain as a feedback signal engages the anterior cingulate cortex (ACC) and the anterior insula (AI), both when pain is directed to oneself and when witnessing pain in conspecifics (Olsson et al., 2007; Lindström et al., 2018; Keum and Shin, 2019). It is thus likely that these brain areas also underpin prosocial learning, but the extent of their involvement is unknown.
Here, we conducted a high-powered study with male human participants (N = 96) who learned to avoid painful stimuli either for themselves or another individual. Combining computational modeling with fMRI, we tested whether participants were better, or worse, at learning to avoid others' harm compared with self-harm. We expected that differences in learning behavior should be reflected by different recruitment and connectivity of the VMPFC during valuation, as well as the ACC and AI during outcome evaluation. Our major aim was to clarify whether humans are actually “selfish” learners, as suggested by previous evidence using monetary outcomes as learning signals, or if prosocial tendencies can trump egocentricity in the face of harm.
Materials and Methods
Data reported here were acquired as part of a longitudinal project investigating the effects of violent video games on social behavior (outside the scope of the present report). In brief, participants completed two fMRI sessions ∼2 weeks apart. After the first session, participants came into the behavioral laboratory for 7 times over the course of 2 weeks to complete a violent (or nonviolent) video game training (discussed elsewhere). Here, our focus is exclusively on the data from the first session, before video game training. At this point of the experiment, participants had not yet been exposed to any experimental manipulation, instructions, or other types of information associated with violent video games. This ensures that the present results are not influenced by the design of the overarching study, and that we could exploit the high sample size of that study to pursue the present scientific aims related to prosocial learning.
Participants
Ninety-six male volunteers (age range: 18-35 years) participated in the study. The novelty of the present design precluded formal power analysis. As a benchmark, though, we considered the effect size reported by Lockwood et al. (2016), who used a similar task, but with financial rewards as positive reinforcers, rather than pain as negative reinforcers. They found an effect size of d = 0.87 when comparing the learning rates for self-relevant learning with the learning rates for prosocial learning. With a sample size of 96, we had a power > 99.9% to find an effect of this size in our study. Sensitivity analysis further indicated that we had a power of 80% to detect an effect of d = 0.29, suggesting that our study was adequately powered to detect medium to small effects (Cohen, 2013). Power analyses were performed with the software Gpower 3 (Faul et al., 2007). All participants were healthy, right-handed, had normal or corrected-to-normal vision, reported no history of neurologic or psychiatric disorders or drug abuse, and fulfilled standard inclusion criteria for MRI measurements. Only male participants of the age range 18-35 years were tested based on constraints related to the overarching project on violent video games. Hence, the findings presented here only apply to this population. All participants gave written consent before participation and received financial reimbursement, and the study had been approved by the Ethics Committee of the Medical University of Vienna.
Study timeline and procedures
Participant arrival and interaction with the confederate
Each participant was paired with another male participant who in reality was a member of the experimental team (i.e., a confederate). This way, we ensured that the participant was under the impression of completing the prosocial learning task together with another person (see below for details of the task). As a cover story, the participant was told that he had been randomly assigned to the role of the “MRI participant,” and would complete the experimental tasks inside the MR scanner, while the confederate had been assigned to the role of “pulse measures participant” from whom we would take pulse measurements only. After arrival at the MR facility, it was explained that the participant would first receive task explanations in another room while the confederate would complete the pain calibration, and that they would switch places afterward (only the participant actually underwent the experimental procedures). After the pain calibration (see below), the participant was positioned in the MR scanner and the confederate was seated next to the scanner at a table with an MR compatible monitor and keyboard. To uphold the impression of the confederate actually participating in the task, the confederate remained seated next to the scanner for the entire duration of the experiment, and also responded audibly to the experimenter's mock questions about his physical comfort via the intercom.
Participants were formally interviewed if they doubted the deception (e.g., if they believed that the confederate was a real participant) at the end of the second session of the overarching project (2 weeks later). At this point, 6 participants reported doubts that the confederate was a real participant. No participant expressed doubts about the confederate after the first session, but they were not explicitly interviewed regarding doubts at that point in time, to not raise suspicions about the cover story.
Electrical stimulation and pain calibration
Electrical stimulation was delivered with a Digitimer DS5 Isolated Bipolar Constant Current Stimulator (Clinical & Biomedical Research Instruments) using concentric surface electrodes with 7 mm diameter and a platinum pin (WASP electrode, Specialty Developments) attached to the dorsum of the left hand. With this setup, electrical stimulation was constrained to the skin under and directly adjacent to the electrodes. To determine each participant's subjective pain threshold, we used an adaptive staircase procedure (as previously used in Rütgen et al., 2015a,b). In brief, the participant received short stimuli (500 ms) of increasing intensity and was asked to rate pain intensity on a 10 point numeric scale from 0 to 9. The numbers corresponded to the following subjective perceptions: 0 = not perceptible; 1 = perceptible, but not painful; 3 = a little painful; 5 = moderately painful; 7 = very painful; 9 = extremely painful, highest tolerable pain. To account for habituation and familiarization effects, this procedure was repeated once, after which the participant received 30 random electrical stimuli. The average intensities of electrical stimuli that were rated as 1, and 7 were then chosen as the intensities of nonpainful and painful stimulation during the pain avoidance task.
Prosocial learning task
The participant was instructed to learn the association between abstract symbols and painful electrical stimuli. During each trial (Fig. 1A), the participant had to choose one of two symbols, with one of the symbols resulting in nonpainful electrical stimulation in 70% of trials, and the other in painful electrical stimulation in 30% of the trials (participants were not informed about these contingencies). Importantly, electrical stimulation as a consequence of the choice made was either delivered to the participant (Self condition) or to the other person, that is, the confederate (Other condition). For both conditions, the participant completed three blocks of 16 trials (resulting in 48 trials per condition, and 96 trials in total). The two experimental conditions alternated per block (so the participants never completed the same condition twice in a row), and the starting condition was counterbalanced across participants. Each block contained a different pair of symbols, and the participant was instructed to learn this new set of symbol-stimulus contingencies once more.
Figure 1.
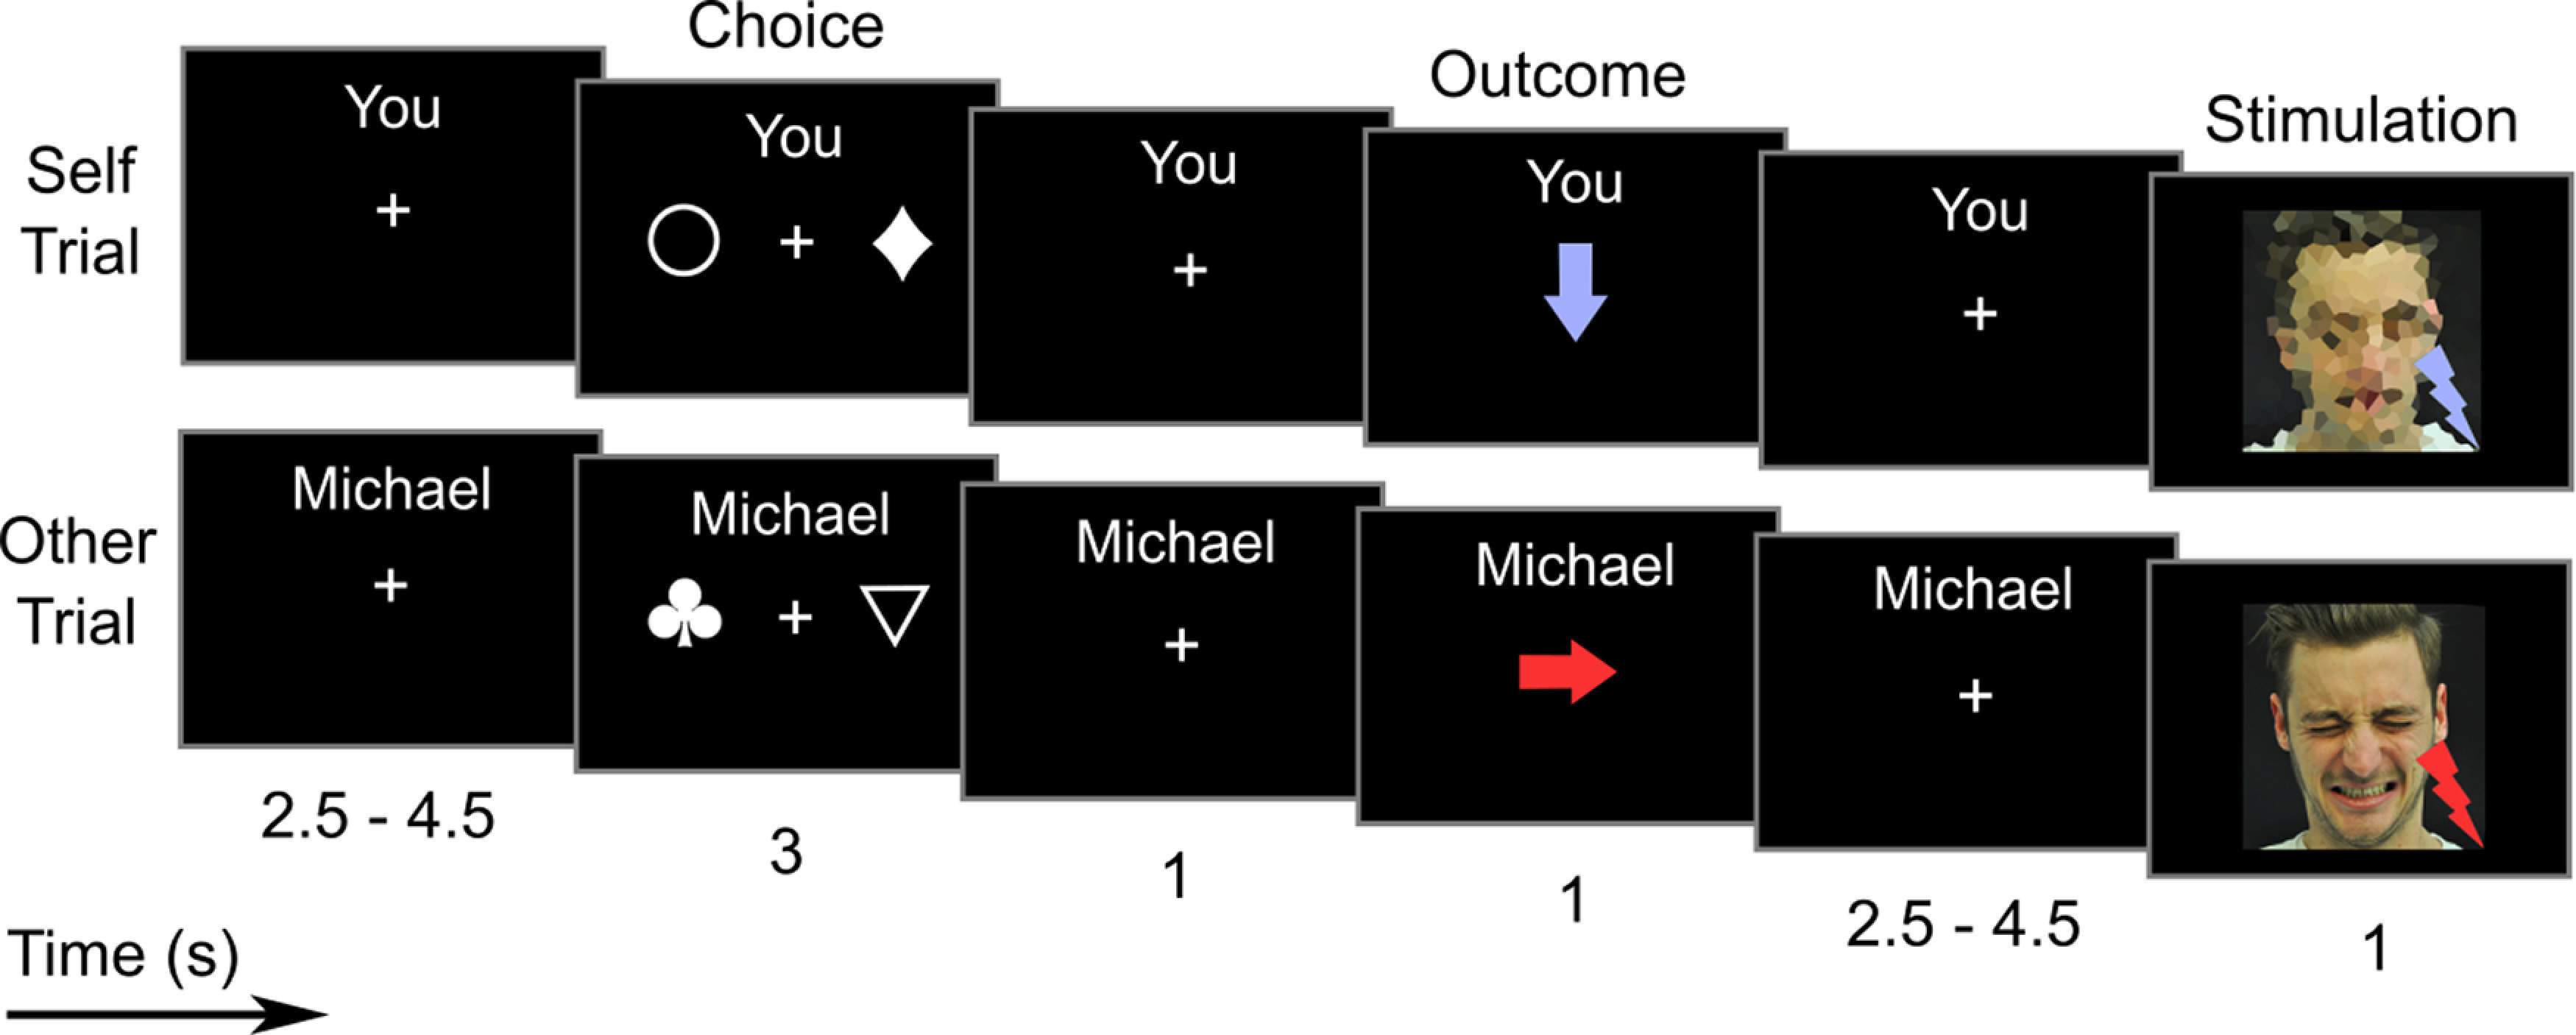
Schematic depiction of the trial structure of the prosocial learning task. The task was to identify, in the Choice window, one of two abstract symbols that would prevent painful stimulation from being delivered to either Self (self-relevant learning) or Other (prosocial learning). One symbol had a 30% chance of delivering pain, the other a 70% chance. Feedback on the outcome of the choice was delivered in the Outcome window, by means of color-coded arrows (red represents pain; blue represents no pain). Overall, 16 such trials were performed in each block, with three blocks per condition (Self/Other; presented in alternating order) being run over the course of the experiment. Top row, Trial of the Self condition (self-relevant learning) in which a nonpainful electrical stimulus is delivered to the participant as a consequence of his choice. Bottom row, Trial of the Other condition (prosocial learning) in which a painful electrical stimulus is delivered to the confederate as a consequence of the participant's choice. Numbers below descriptions indicate event length in seconds, with intervals indicating ranges of interstimulus jitter.
At the start of a new block, the participant was instructed that he would now have to perform the task for himself (“Play for yourself”) or for the confederate (e.g., “Play for Michael”). During each trial, the two symbols were presented for 3000 ms, and the participant was asked to choose one symbol (choice phase). Choices were made with the right hand via a button box. If the participant made a choice within this time limit, a red or blue arrow (presented for 1000 ms) indicated whether the current recipient would receive painful or nonpainful stimulation, respectively (outcome phase). The arrow pointed downwards if the participant received electrical stimulation himself (self-directed electrical stimulation) or to the right toward the confederate (other-directed electrical stimulation). If no button press occurred within the time limit, the message “too slow!” was displayed and was followed by painful electrical stimulation to either the participant or the confederate, depending on the current condition. After an interval of 2500-4500 ms (uniformly jittered, in steps of 250 ms), the electrical stimulation was delivered (stimulation phase). During self-directed electrical stimulation (500 ms), the participant saw a pixelated photograph of the confederate (1000 ms, same onset as electrical stimulus). Pain intensity was indicated by a red or blue lightning icon in the bottom right of the photograph. During other-directed electrical stimulation, the participant saw a photograph of the confederate with a neutral or painful facial expression, during nonpainful or painful electrical stimulation, respectively. The next trial started after an intertrial interval between 2500 and 4500 ms (uniformly jittered, in steps of 250 ms). The task was presented using COGENT (http://www.vislab.ucl.ac.uk/cogent.php), implemented in MATLAB 2017b (The MathWorks). The total task duration was ∼23 min.
As part of the cover story, the participant was instructed that the other participant (i.e., the confederate) would never make choices that could result in stimulation for himself or the participant. Instead, he would be presented with the choices of the participant, and would have to indicate per button press if he would have made the same decision. We chose this approach (instead of saying that the confederate would only passively receive stimulation without any further instructions) to increase the believability of the deception.
MRI data acquisition
MRI data were acquired with a 3 Tesla Siemens Skyra MRI system (Siemens Medical) and a 32-channel head coil. BOLD functional imaging was performed using a multiband accelerated EPI sequence with the following parameters: TE: 34 ms; TR: 1200 ms; flip angle: 66°; interleaved ascending acquisition; 52 axial slices coplanar to the connecting line between anterior and posterior commissure; multiband acceleration factor 4, resulting in 13 excitations per TR; FOV: 192 × 192 × 124.8 mm, matrix size: 96 × 96, voxel size: 2 × 2 × 2 mm, interslice gap 0.4 mm. Structural images were acquired using a MPRAGE sequence with the following parameters: TE = 2.43 ms; TR = 2300 ms; 208 sagittal slices; FOV: 256 × 256 × 166 mm; voxel size: 0.8 × 0.8 × 0.8 mm. To correct functional images for inhomogeneities of the magnetic field, field map images were acquired using a double echo gradient echo sequence with the following parameters: TE1/TE2: 4.92/7.38 ms; TR = 400 ms; flip angle: 60°; 36 axial slices with the same orientation as the functional images; FOV: 220 × 220 × 138 mm; matrix size: 128 × 128 × 36; voxel size: 1.72 × 1.72 × 3.85 mm.
Trait measures
As a measure of trait empathy, participants completed the Questionnaire of Cognitive and Affective Empathy (QCAE) (Reniers et al., 2011), which assesses empathic traits along the two dimensions cognitive empathy (with the subdimensions perspective-taking and online simulation) and affective empathy (with the subdimensions emotion contagion, proximal responsivity, and peripheral responsivity). The questionnaire was completed after the MR session. Because of an error in data collection, questionnaire data from 9 participants were not available for analysis. We therefore restricted analyses related to trait measures of empathy to the remaining 87 participants.
Data analysis
Our analysis plan was as follows: first, we tested whether participants showed better learning behavior during prosocial or self-relevant learning, as measured by an objective index of optimal behavior (described in detail below). Then, we used computational modeling to investigate whether behavioral differences could be explained by differences in the mechanisms underlying these two types of learning. Finally, we used fMRI analyses to relate differences on the behavioral level to differences in the neural mechanisms.
Analysis of optimal behavior
We first investigated whether participants showed more optimal behavior during prosocial or self-relevant learning. In decision theory, optimal choices are defined as those choices that maximize the expected rewards (or minimize the expected loss), given all available information (Kulkarni and Gilbert, 2011). Mathematically, our learning task is equivalent to a two-armed bandit problem with unknown reward probabilities of the two choice alternatives, pA and pB. For this kind of problem, the optimal choice in each trial can be derived algorithmically, as described by Steyvers et al. (2009; see also Kaelbling et al., 1996). For mathematical details, we refer the reader to these references and to our commented scripts (see Code and data availability). In short, a choice is optimal if an “ideal participant” with perfect memory and the ability to calculate all possible outcome sequences would make the same choice, given the information at hand. Importantly, an optimal choice maximizes not only the expected outcome of the current trial, but also the possible outcomes of subsequent trials, balancing exploration and exploitation. Optimal choices also depend on the prior information the decider has about the choice alternatives. This can be modeled by defining a prior distribution for the reward probabilities pA and pB. Following Steyvers et al. (2009), we modeled prior information about the learning task with a beta distribution, with parameters a and b set to 1.5. This gives a symmetric distribution with considerable probability mass for all but the most extreme values of pA and pB. Thus, the distribution reflects that participants were informed that both symbols will lead to painful stimulation in some cases, but did not get any further information about the probabilities. To investigate how sensitive our results were to these exact values of a and b, we also calculated optimal choices under beta distributions with both values set to 1 (reflecting a uniform distribution) or 2 (putting more probability mass on average probabilities).
Preprocessing, analysis, and visualization of behavioral data were performed using R 3.4.4 (R Core Team, 2020). To test for differences in the number of optimal choices between prosocial and self-relevant learning, we computed a generalized linear mixed model (GLMM), with optimal choice as binary response variable (binomial family, logit link function), using the R packages lme4 (Bates et al., 2015) and afex (Singmann et al., 2020). Trial (1-16; numeric, mean centered), condition (Self vs Other; categorical dichotomous; coded as Self = −1, Other = 1), and their interaction (trial × condition) were specified as predictors. To account for dependencies between observations within the same participants, we treated participants as levels of a random factor. Following the recommendation of Matuschek et al. (2017), we selected the random effects structure that led to the most parsimonious fit of the GLMM, as indicated by the Akaike Information Criterion (Akaike, 1998). We then tested the significance of the fixed effects of the final model, using Type III drop-one-term likelihood ratio tests, as implemented by the “mixed” function of the package afex.
Computational modeling
We used computational modeling to investigate differences in the processes underlying prosocial and self-relevant learning. In computational modeling, one first defines a model as a set of mathematical equations that relate observable behavior to theoretical quantities. If the model is true (or, at least, useful) (Box, 1976), it should help explain the observed behavior of a participant. Importantly, the exact relationship between a model's theoretical quantities and actual behavior is governed by a number of free parameters, which have to be estimated from the data. Using techniques of model comparison, one can then select the most useful model from a set of plausible candidates. Here, we used RL models, which already have a long history of use in neuroscientific research (Hackel and Amodio, 2018). Following this modeling framework, we assumed that participants chose between symbols A and B based on the symbols' subjective values (valuation). Then, they updated these subjective values based on the outcome of their choice (outcome evaluation).
Models for valuation
We used the softmax function to model how subjective values are mapped onto choice probabilities. This function takes as input the subjective values of symbols A and B (here denoted as and , and bound in the interval [0, 1]), and gives as output the probability of choosing one symbol over the other. In the case of only two alternatives/symbols, the softmax simplifies to the logistic function, and is as follows:
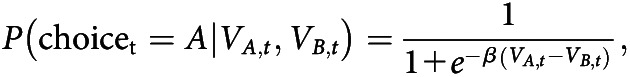 |
where is the probability of choosing symbol A in trial t, given specific values of and , e is the basis of the exponential function, and β is the free inverse temperature parameter, defined on the positive real numbers (0, ). In the simple case of two symbols, the probability of choosing symbol B is given by . The probability of choosing symbol A increases nonlinearly (in a sigmoid shape) with the difference ; for large positive values of the difference, the probability approaches 1; whereas for strongly negative values of the difference, the probability approaches 0. If the difference is close to 0, the probability is close to 0.5; that is, the choices of the participant are nearly random. Importantly, the free parameter β defines how sensitive the softmax function, and thus the participants' choices, are to the difference in subjective values. For very high β, even small differences in subjective values lead to a high probability of choosing the symbol with the higher value. For β close to 0, choices are very random, even if the difference in subjective values is high. In this paper, we will refer to β as a measure of value sensitivity, consistent with the parameter's mathematical definition in the RL model (see also Katahira, 2015; Chung et al., 2017). Importantly, this interpretation is also consistent with the interpretation of β as an indicator of the exploration/exploitation trade-off (e.g., Humphries et al., 2012; Cinotti et al., 2019). In other words, a high β may indicate exploitative choices, as choice behavior is very sensitive to differences in value, and the option with the higher value is frequently chosen. In contrast, a low β leads to choices that are less dependent on the value difference, which may reflect the exploration of the alternative with the lower values.
Importantly, to test for differences between self-relevant and prosocial learning, we also considered models with condition-specific parameters (for a similar approach, see Lockwood et al., 2016). Thus, we also estimated models in which different inverse temperature parameters and governed participants' choice behavior during self-relevant and prosocial learning, respectively. Differences here would indicate that a participant showed differences in value sensitivity between the two conditions (i.e., for self-relevant and prosocial learning).
Models for outcome evaluation
Following the RL modeling framework, we assumed that participants updated the subjective value of the chosen symbol based on the received outcome. Here, we will refer to outcomes that indicate the delivery of nonpainful stimulation as positive outcomes, and to outcomes that indicate painful stimulation as negative outcomes. According to the simplest RL model (Sutton and Barto, 1998; Hackel and Amodio, 2018), subjective values are updated according to the following formula:
where is the value of the chosen symbol A in trial t, is the updated value, and is the free learning rate parameter, which is bound in the interval [0, 1]. is the number encoding the outcome of trial t, here defined as 1 for positive outcomes/“no pain,” and 0 for negative outcomes/“pain.” We chose this coding scheme to make our algorithm more comparable with those used in other studies using the RL model (e.g., Lockwood et al., 2016). But this coding scheme is mathematically equivalent to that used in other aversive learning paradigms where pain outcomes are instead coded as −1 and avoidance of pain as 0 (e.g., Seymour et al., 2004; Roy et al., 2014) (for a mathematical proof of this statement, see https://osf.io/h9txe/). The term is usually referred to as the prediction error of trial t. The free parameter controls the degree to which the value of the chosen symbol is updated by the prediction error. For close to 0, there is nearly no updating. For close to 1, the subjective value is strongly updated by the last outcome. Yet the learning rate cannot directly be interpreted as a measure of how fast participants understand which of the two symbols is better (see also Zhang et al., 2020). Rather, it describes how strongly subjective values are influenced by the last outcome, regardless of the outcomes that came before. and were both initialized to 0.5, reflecting the assumption that participants were equally likely to prefer either symbol on the first trial, and that they had no prior information about symbol-outcome contingencies.
Participants might have responded differently to positive outcomes (i.e., nonpainful stimulation) than to negative outcomes (i.e., painful stimulation). We therefore also considered an extension of the simple RL model which allowed for outcome-specific learning rate parameters (Den Ouden et al., 2013). In this model, participants weighted positive prediction errors with the learning rate , and negative prediction errors with the learning rate . Crucially to our research question, we also estimated models in which condition-specific learning rate parameters and controlled the rate with which participants updated the subjective values during self-relevant and prosocial learning, respectively. If we found beforehand that outcome-specific learning rate parameters are of importance, we also tested models with two separate learning rates for positive outcomes ( and ), two separate learning rates for negative outcomes ( and ), or both.
Hierarchical modeling
The computational models described so far explain a single participant's behavior. To combine the data from all participants in our sample, and draw inferences about the underlying population, we used hierarchical Bayesian modeling. We thus modeled how the parameters that characterized participants' behavior were distributed in the population. Modeling the commonalities between participants in such a way has been shown to enable more stable individual parameter estimates and allows direct inference about population parameters (Ahn et al., 2017).
Individual learning rate parameters were modeled to follow logit-normal distributions with unknown population mean μα and SD σα. This defines a normal distribution on the unbounded scale of the logits of the learning parameters, which are then mapped into the interval [0, 1] by means of the logistic function. Inverse temperature parameters were modeled to follow log-normal distributions with unknown population mean μβ and SD σβ. This defines a normal distribution on the unbounded scale of the natural logarithms of the parameters, which are then sent to the positive real numbers with the exponential function.
Model estimation
Bayesian model estimation was performed using the software STAN version 2.18.1 (Carpenter et al., 2017) implemented in R. Custom code, as well as a detailed description of the used prior distributions, can be found online (see Code and data accessibility). STAN utilizes Markov Chain Monte Carlo (MCMC) sampling to approximate posterior distributions of parameters in light of observed data. MCMC convergence diagnostics were performed by visual inspection of the trace plots and standard diagnostics output of the software (Gelman and Rubin, 1992). We performed model comparison and selection by treating the models to be compared as components of an overarching mixture model (Kamary et al., 2014; Ly et al., 2016; Robert, 2016; Keller and Kamary, 2017). This approach allows to assess which of the compared models is most supported by the observed data, through the calculation of Bayes factors (BFs) (Kass and Raftery, 1995). We used the following rationale to find the best-fitting model: We first assessed whether the data were better explained by a model containing outcome-specific learning rate parameters (, ). We then assessed in a stepwise manner whether the model fit increased by adding separate parameters for self-relevant and prosocial learning. Here, we considered both fixed effects (systematic differences in parameters that characterize the whole population) as well as random effects (random subject-wise differences between parameters). To test whether the addition of a condition-wise parameter difference increased the model fit, we calculated a mixture model containing the current model without the additional parameter, a model including the respective random effect, and a model including the random effect as well as the fixed effect. The mixture model was estimated with 8 MCMC chains of 1000 warmup samples, and 4000 actual samples. We only added a parameter difference to the model if the model including the parameter difference had a substantially better model fit compared with the model without the parameter difference, as indicated by a BF > 3 (Kass and Raftery, 1995).
After model selection, we reestimated the winning model with four chains of 2000 warmup samples and 5000 actual samples. Single-value individual parameter estimates were calculated as the posterior means of the parameters. To assess absolute, rather than relative, model validity, we performed posterior predictive checks (Gelman et al., 2013; Zhang et al., 2020). For each draw of the posterior distribution of parameters, we simulated the behavior of new participants with the same set of parameters. For visual posterior predictive checks, we plotted the 95% highest-density intervals (HDIs) of participants' predicted choices against their actual choices. Furthermore, we calculated the correlation coefficients between participants' actual percentage of optimal choices and the mean of the predicted percentage of optimal choices.
Associations between model parameters and optimal choices
To formally test whether differences in optimal choice behavior could be explained by differences in learning mechanisms, we conducted multilevel mediation analysis (Kenny et al., 2003; Bauer et al., 2006). We defined condition (Self vs Other) as independent variable, relevant model parameters as mediator, and optimal choice as dependent variable. We estimated the effect of condition on the mediator (path a) with linear mixed regression, using the function “lmer” of the package lme4 (Bates et al., 2015). We estimated the effect of the mediator on optimal choices (path b) by adding the mediator to the GLMM described above (see Analysis of optimal behavior). To make inference about the indirect effect of condition via the mediator, we calculated bias-corrected and accelerated CIs (BCa-Cis) (Efron, 1987) for the product a × b, using 1000 bootstrapping samples with the R package boot (Davison and Hinkley, 1997), and tested whether this interval contained 0. BCa-CIs correct for bias and skewness of the bootstrap sample distribution.
Associations between prosocial behavior and trait empathy
Using regression analysis, we investigated whether differences in prosocial versus self-relevant learning behavior were associated with empathic traits. We regressed the difference in parameters for prosocial versus self-relevant learning on the subscales of the QCAE. To test whether the analysis suffered from multicollinearity because of potentially high correlations between the subscales, we also calculated the variance inflation factors per predictor.
fMRI data preprocessing
Preprocessing and analysis of fMRI data were performed using SPM12 (Wellcome Trust Center for Neuroimaging; www.fil.ion.ucl.ac.uk/spm) implemented in MATLAB 2017b. Functional images were slice-timed and referenced to the middle slice, realigned to the mean image, and unwarped to correct for motion × distortion interaction artifacts using the acquired field map. The structural image was then coregistered to the mean image of the realigned functional images using mutual information maximization, and structural and functional images were normalized to the stereotactic MNI space (template: MNI ICBM152). The normalized functional images were smoothed with a Gaussian kernel (4 mm, FWHM). To remove motion-related artifacts, the functional images were then subjected to an independent component analysis-based algorithm for automatic removal of motion artifacts (Pruim et al., 2015a,b), implemented using the FMRIB software library (version 5.0; http://www.fmrib.ox.ac.uk/fsl). For each experimental run, the time course was decomposed into 100 independent components, which were classified as motion- or signal-related independent components. Following this, motion-related independent components were regressed from the time course using ordinary least-squares regression. To further identify participants who exhibited extreme head movement during experimental runs, we calculated the framewise displacement (Power et al., 2012) as a measure of relative image-to-image motion. Since we a priori had decided to exclude runs of participants who exhibited framewise displacement > 0.2 (indicating voxel displacement of ∼2 mm between volumes) in >1% of volumes from all further analyses, data of 5 participants were excluded from the analyses. Moreover, data were high-pass filtered with the SPM12 standard cutoff of 128 s.
fMRI data analysis
For the prosocial learning task, first-level design matrices of the GLM included regressors for the choice phase (presentation of the symbols, 3000 ms), the outcome phase (presentation of the arrow cues indicating the outcome, 1000 ms), and the stimulation phase (electrical stimulation and presentation of the photographs, 1000 ms; see also Fig. 1). Regressors were built by creating onset-locked boxcar functions with the respective event durations, convolved with the canonical HRF. For the choice phase, regressors were defined separately for the Self and the Other condition. For the outcome phase, regressors were defined separately for the Self and the Other condition, as well as for positive outcomes (indicating the delivery of nonpainful stimulation) and negative outcomes (indicating the delivery of painful stimulation). For the stimulation phase, regressors were created separately for every combination of the factors Self versus Other and nonpainful stimulation (after positive outcomes) versus painful stimulation (after negative outcomes). Missed responses were collapsed within three additional nuisance regressors during choice, outcome, and stimulation in the condition in which responses were missing. Thus, if a participant had missing responses in both conditions (Self and Other), six nuisance regressors were added (three per condition, defined as above).
To detect brain areas in which activation was correlated with model-derived quantities, we extracted the values from the winning computational model (see above) and entered them as trial-by-trial parametric modulators. For events of the choice phase, we added the value difference (i.e., value of chosen symbol minus value of unchosen symbol) as a parametric modulator, separately for the Self and Other conditions. For events of the outcome phase, we added the absolute trialwise prediction error as a parametric modulator, separately for positive and negative outcomes, and separately for the Self and Other conditions.
We chose a GLM with separate regressors for positive and negative outcomes, and prediction errors for these outcomes, for two reasons. First, as outcomes and prediction errors are by definition very highly correlated (Behrens et al., 2008; Zhang et al., 2020), this model allowed us to investigate brain activity that is specifically related to deviations from the observed outcome to the expected outcome (the parametric modulators for prediction error are orthogonalized to the regressors for outcome, and can therefore only explain that part of signal variance that is not already explained by mere outcomes). Second, we defined different parametric modulators for prediction errors from positive and negative outcomes to be able to investigate where in the brain positive deviations from the expected outcome are processed differently than negative deviations. We used the absolute prediction error to facilitate interpretation of the resulting estimates: prediction errors for positive outcomes were positive, with higher numbers indicating greater deviation from the expectation. Prediction errors for negative outcomes were negative, with lower (more negative) numbers indicating greater deviation from the expectation. Therefore, higher values of the absolute prediction error indicated stronger deviations from the expectation, regardless of the valence of the outcome.
To summarize, the first-level model included 10 task-based regressors, 6 parametric modulators, and 0, 3, or 6 nuisance regressors, depending on the number of missed responses per participant. Second-level statistical inference was performed using flexible factorial ANOVAs, one-sample t tests, and paired-sample t tests. The statistical threshold for all whole-brain analyses was defined as p < 0.05 familywise error (FWE) corrected for multiple comparisons at the cluster level, using a cluster-defining threshold of p < 0.001. The corrected cluster size threshold (i.e., the spatial extent of a cluster that is required to be labeled significant) was calculated using the SPM extension “CorrClusTh.m” (script provided by Thomas Nichols, University of Warwick, United Kingdom, and Marko Wilke, University of Tübingen, Tübingen, Germany; http://www2.warwick.ac.uk/fac/sci/statistics/staff/academic-research/nichols/scripts/spm/). Anatomical labeling of activation peaks was based on the Automatic Anatomical Labeling atlas (Tzourio-Mazoyer et al., 2002) and performed using the toolbox xjView (http://www.alivelearn.net/xjview).
Functional connectivity analysis
We investigated differences in functional connectivity of the VMPFC during the choice phase, by calculating generalized psychophysiological interaction analyses (McLaren et al., 2012). We created an anatomic mask of the VMPFC (taken from the Automatic Anatomical Labeling atlas; Tzourio-Mazoyer et al., 2002) with significant clusters that emerged from the activation analysis (correlation of brain activity with the difference in value of chosen symbol minus unchosen symbol). From this intersected mask, the first eigenvariate of the participant-specific functional time course was extracted, adjusted for average activation using an F contrast, and deconvolved to estimate the neural activity in the seed region (i.e., the physiological factor). The estimated neural activity was then multiplied with the boxcar function defining the event of interest (i.e., the psychological factor), and the product was convolved with the HRF. This resulted in one psychophysiological interaction regressor per event of interest. The interaction regressors were added to the first-level design matrix, and the GLMs were estimated. Group-level connectivity differences between Other and Self were tested using a paired-sample t test.
Code and data accessibility
Custom scripts for the calculation of optimal choices and estimation of Bayesian models in STAN, as well as a documentation of the used priors, are freely accessible on OSF (https://osf.io/53qvd/). Second-level fMRI contrast maps are accessible at the same location.
Results
Analysis of optimal choice behavior
We first investigated whether participants showed more optimal behavior during self-relevant or prosocial learning, using GLMM. The best fitting GLMM was obtained with a random effects structure containing by-subject random intercepts and random slopes for condition (Self vs Other), trial (1-16), and their interaction (see Table 1). This implies that there was substantial variation between participants with respect to the average probability of an optimal choice, how much this probability increased per trial, and how much it differed between conditions. We found that participants made optimal choices significantly above chance level (intercept = 1.351, = 93.41, p < 0.001): on average, participants chose optimally in 79.4% of trials (see Fig. 2A). A significant main effect of condition (β = 0.099, = 5.78, p = 0.016) indicated that participants made more optimal choices when choosing for the other person compared with when choosing for themselves. Furthermore, there was a significant effect of trial (β = 0.108, = 55.92, p < 0.001), indicating that the probability of making an optimal choice increased over time. The absence of a significant interaction between condition and trial (β = 0.011, = 1.62, p = 0.203) indicated that the increase of optimal choices over time was similar for self-relevant and prosocial learning.
Table 1.
Results of the GLMM analysisa
| Fixed effects | Parameter (SE) | Random effect | p | |
|---|---|---|---|---|
| Intercept | 1.351 (0.109) | 1.017 | 93.409 | <0.001 |
| Condition | 0.099 (0.041) | 0.222 | 5.781 | 0.016 |
| Trial | 0.108 (0.013) | 0.105 | 55.919 | <0.001 |
| Condition × Trial | 0.011 (0.008) | 0.031 | 1.623 | 0.202 |
aDependent variable: optimal choice (0 = no optimal choice; 1 = optimal choice). Factor coding for condition: Self = −1; Other = 1. Trial was mean-centered. Random effect, SDs of the random effect associated with the respective model term. p values were derived from Type III likelihood ratio tests.
Figure 2.

Prosocial learning task: behavioral results and model parameters. A, Percentage of optimal choices per trial. Solid lines indicate the percentage of times participants chose the symbol that minimized the expected number of painful stimuli. Overall, participants made significantly more optimal choices during prosocial learning (Other, red) than during self-relevant learning (Self, blue). Shaded areas represent 95% HDIs from the posterior predictive distribution of optimal choices derived from the computational model. The posterior predictive distribution matches the actual responses well, indicating that the model was able to capture participants' learning curves. B, Posterior predictive check for percentage of optimal choices. The real percentage of optimal choices of each participant is plotted against the average percentage of optimal choices predicted by the winning model. The high congruence between actual and predicted responses suggests that good absolute model fit was achieved, but the model appears to overestimate the percentage of optimal choices for those participants who performed below the chance level of 50%. C, Posterior distributions of group-level means of the learning rates for positive (μα+) and negative (μα–) outcomes. Curves represent the probability density describing the posterior distribution of the mean parameters. Blue-shaded area represents the 95% HDI (the interval containing the 95% of the values with the highest posterior probability). The mean parameters are represented on the logit scale. D, Joint posterior distribution of the group-level means of the inverse temperature parameters, μβ,Self and μβ,Other. Points represent MCMC samples. Contours represent the estimated joint density. Inset, The posterior distribution of the difference μβ,Other – μβ,Self. Blue-shaded area represents the 95% HDI. Dashed vertical line indicates zero.
As described in Materials and Methods, we identified optimal decisions under the assumption that the participants' prior knowledge about outcome probabilities could be modeled as beta(a = 1.5, b = 1.5). To test whether our results were sensitive to this assumption, we repeated the analysis for different prior distributions, beta(a = 1, b = 1) and beta(a = 2, b = 2). These analyses led to the same results, indicating that our findings are robust to changes in prior assumptions (effect of condition for beta(1,1): p = 0.048; for beta(2,2): p = 0.024).
All participants were able to make a choice within the time limit in the majority of trials. There was no participant who missed >10 trials (of 48) in either condition (number of trials missed in Self condition: 0, 63.54%; 1, 21.87%; 2, 6.25%; 3–10, 8.33%; number of trials missed in Other condition: 0, 57.29%; 1, 25.00%; 2, 6.25%; 3-10, 11.46%). An exploratory GLMM on the number of missed trials revealed no significant difference in probability of missing a trial between the two conditions.
In summary, we found that participants were able to choose optimally between symbols that differed in the probability of delivering painful electrical stimulation. Intriguingly, participants made more optimal choices when choosing for the other person than when choosing for themselves.
Computational modeling of self-relevant and prosocial learning
Having found that participants made more optimal choices during prosocial than self-relevant learning, we next used computational modeling to investigate whether this result could be explained by differences in learning mechanisms. As the first step in model selection, we assessed whether the data were better explained by a model with only one learning rate for both positive and negative outcomes (M0), or a model with outcome-specific learning rates (M1). We found that model M1 explained the data substantially better (BF M1 vs M0 > 1000). We next compared model M1 against several models with condition-wise differences in a single parameter: a model with different learning rates for positive outcomes α+ per condition (random effect: M2.1; random effect and fixed effect: M2.2); a model with different learning rates for negative outcomes α– per condition (random effect: M3.1; random effect and fixed effect: M3.2); and a model with different inverse temperature parameters β per condition (random effect: M4.1; random effect and fixed effect: M4.2). Including different inverse temperature parameters for self-relevant and prosocial learning led to the greatest increase in model fit (BF M4.1 vs M1 = 37.67; M4.2 vs M1 = 294.67), compared with adding differences in the other parameters (learning rate for positive outcomes: BF M2.1 vs M1 = 8.88; BF M2.2 vs M1 = 9.35; learning rate for negative outcomes: BF M3.1 vs M1 = 0.32; BF M3.2 vs M1 = 0.25). We next compared model M4.2 with a model that additionally included different learning rates for positive outcomes (additionally to the differences in inverse temperature; random effect: M5.1; random effect and fixed effect: M5.2). This revealed that model fit was only marginally improved by including the random effect, but not the fixed effect (BF M5.1 vs M4.2 = 1.34; M5.2 vs M4.2 = 0.92). Finally, we compared model M4.2 with a model that additionally included different learning rates for negative outcomes (M6.1; random effect and fixed effect: M6.2). This revealed that the data were better explained by a model without these additional differences in parameters (BF M6.1 vs M4.2 = 0.28; M6.2 vs M4.2 = 0.23).
Based on this model selection procedure, we selected model M4.2 as the winning model. This model included different learning rates for positive and negative outcomes, and a population-level difference between inverse temperature parameters for self-relevant and prosocial learning. Next, we validated this model using posterior predictive check analyses. Figure 2A represents the 95% HDI of the predicted percentage of participants' optimal choices. Participants' behavior appears to be well explained by the model, as actually observed percentages lie well within the HDI. However, for Trial 3, the percentage of optimal choices was slightly overestimated by the model. Figure 2B plots the real percentages of optimal choices against the mean predicted percentages. This plot also indicates suitable model fit, although the model appears to slightly overestimate the number of optimal choices for those participants who made optimal choices below the chance level of 50%. The correlations between the percentage between actually observed choices and the percentage predicted by the model were as follows: optimal decisions for self: mean r = 0.757, 95% HDI = [0.678, 0.831]; optimal decisions for other: mean r = 0.796, 95% HDI = [0.721, 0.867].
The group-level parameter estimates of the winning model are summarized in Table 2 and shown in Figure 2C, D. To test the difference in the group-level distribution of the inverse temperature parameter, we calculated the 95% HDI of the difference in mean parameters μβ,Other – μβ,Self (Fig. 2D). The resulting HDI was entirely contained within the positive numbers, indicating generally higher inverse temperature parameters during prosocial learning.
Table 2.
Parameter estimates of the computational modela
| Parameter | Posterior mean | 95% HDI | Posterior mean (transformed) | 95% HDI (transformed) |
|---|---|---|---|---|
| μα+ | –0.53 | [–1.04, –0.01] | 0.37 | [0.26, 0.49] |
| σα+ | 0.92 | [0.12, 1.64] | ||
| μα– | –1.83 | [–2.19, –1.46] | 0.14 | [0.10, 0.18] |
| σα– | 0.92 | [0.62, 1.25] | ||
| μβ,Self | 1.54 | [1.20, 1.86] | 4.73 | [3.27, 6.33] |
| σβ,Self | 1.12 | [0.45, 1.76] | ||
| μβ,Other | 1.70 | [1.36, 2.02] | 5.53 | [3.82, 7.39] |
| σβ,Other | 1.12 | [0.45, 1.76] | ||
| μβ,Other – μβ,Self | 0.16 | [0.03, 0.29] | 0.80 | [0.11, 1.54] |
aThe best-fitting computational model (M4.2) allowed for different learning rates for positive outcomes (α+) and negative outcomes (α–), and for different inverse temperature parameters for self-oriented learning (βOther) and prosocial learning (βOther). Posterior mean, mean of the posterior distribution of the respective parameter; Posterior mean (transformed), mean of the posterior distribution after transformation (logistic function for learning rates; exponential function for inverse temperature).
In summary, we found that participants' choices were characterized by higher inverse temperature parameters during prosocial compared with self-relevant learning. However, we found no differences in learning rates between the two conditions. This suggests that participants were more sensitive to differences in subjective values when making a choice for the other person than when making a choice for themselves. At the same time, the degree to which participants updated their subjective values in response to outcomes did not differ between self-relevant and prosocial learning contexts.
Associations between value sensitivity and optimal choices
As computational modeling had revealed that participants were more sensitive to value differences during prosocial choices than self-relevant choices, we next tested whether this finding could explain the higher number of optimal choices for the other than for oneself. As a simple index of this association, we correlated the difference in number of optimal choices (Other − Self) with the difference in value sensitivity (βOther − βSelf). This revealed a significant correlation (r = 0.476, p < 0.001). To investigate the role of value sensitivity in more detail, we conducted multilevel mediation analysis. This revealed that the effect of condition (Other vs Self) on the number of optimal choices was significantly mediated by value sensitivity (indirect effect = 0.059, 95% BCa-CI = [0.044, 0.077]). Since the direct effect of condition ceased to be significant (direct effect = 0.014, p = 0.666), this indicated full mediation. In summary, the better performance during prosocial learning (compared with self-relevant learning) could be explained by participants being more sensitive to the subjective values of the symbols during prosocial decisions.
Association between prosocial choice behavior and trait empathy
Since we found higher value sensitivity during prosocial compared with self-relevant learning, we next investigated whether this prosocial preference was associated with empathic traits. We regressed the difference in individual inverse temperature parameter estimates (βOther − βSelf) on the five subscales of the QCAE. All variance-inflation factors were <2, indicating negligible multicollinearity between predictors. We found that the subscales explained a significant amount of variance of this difference score (R2 = 0.183, F(5,81) = 3.62, p = 0.005). On the level of single predictors, emotional contagion had a significant positive association with the difference score (standardized regression coefficient = 0.43, SE = 0.12, t(81) = 3.614, p < 0.001). This subscale measures how strongly individuals automatically share the emotions of others. Moreover, proximal responsivity had a significant negative association with the difference score (standardized regression coefficient = −0.36, SE = 0.13, t(81) = −2.735, p = 0.008). This subscale consists of items that measure the tendency to become upset in response to other individuals' problems. No other subscale was a significant predictor (all p > 0.05; see Table 3). Thus, participants scoring higher in emotional contagion showed higher value sensitivity during prosocial compared with self-relevant learning, and participants who reported a higher tendency toward proximal responsivity displayed a smaller difference in value sensitivity during prosocial versus self-relevant learning.
Table 3.
Regression of difference in value sensitivity (prosocial learning vs self-oriented learning) on empathic traitsa
| Predictor | Standardized regression weight (SE) | VIF | tdf = 81 | p |
|---|---|---|---|---|
| Intercept | −0.066 (0.099) | --- | −0.666 | 0.507 |
| Perspective-taking | 0.133 (0.110) | 1.16 | 1.210 | 0.230 |
| Online simulation | −0.090 (0.114) | 1.30 | −0.784 | 0.436 |
| Emotional contagion | 0.433 (0.120) | 1.40 | 3.614 | <0.001 |
| Proximal responsivity | −0.360 (0.132) | 1.65 | −2.735 | 0.008 |
| Peripheral responsivity | −0.097 (0.114) | 1.25 | −0.850 | 0.398 |
aDependent variable: Difference between inverse temperature parameters (βOther – βSelf). VIF, Variance inflation factor.
Brain activation related to valuation
As we found that participants were more sensitive to differences in subjective values during prosocial learning compared with self-relevant learning, we next investigated whether differences in neural valuation processes might underpin this finding. As a manipulation check, we tested whether the brain regions typically associated with valuation processes were also activated during our task, regardless of condition (Self vs Other). For this, we assessed which areas exhibited activation patterns that were correlated with the trialwise value difference between the chosen symbol and the unchosen symbol (ΔValue), as derived from the computational model. This revealed a significant positive association between value difference and brain activity in anterior and posterior midline structures, including the VMPFC, subgenual ACC, and precuneus, as well as the right hippocampus and the bilateral middle temporal gyrus (contrast ΔValue > 0; Fig. 3A; Table 4). Next, we tested whether valuation-related brain activity was increased during prosocial compared with self-relevant choices, or vice versa. However, we found no differences in average activation between prosocial and self-relevant valuation processes (contrast ΔValue, Other > ΔValue, Self; contrast ΔValue, Self > ΔValue, Other).
Figure 3.

Results of fMRI analyses of brain activity and connectivity during choices in the prosocial learning task. A, Brain activity associated with valuation processes during choices. Depicted are brain areas where activity was significantly and positively correlated with the difference in subjective values of the symbols (ΔValue, value of chosen symbol minus value of unchosen symbol). In these areas, activity was high when the difference between subjective values was high; and low when the value difference was small. B, Brain activity correlated with interindividual differences in prosocial value sensitivity. Depicted are brain areas where the contrast (ΔValue,Other – ΔValue,Self) was significantly correlated with the difference in value sensitivity for other versus self (βOther – βSelf). Participants with higher valuation-related activity in these areas during prosocial learning (compared with self-oriented learning) were also more sensitive to values relevant for the other compared with values relevant for self (as indicated by computational modeling of the behavioral data). C, Scatter plots represent the correlation between (βOther – βSelf) and (ΔValue,Other – ΔValue,Self) at the clusters represented in B. Values were extracted from peak voxels. D, Results of the generalized psychophysiological interaction analysis. A cluster in the right temporoparietal junction shows increased connectivity with the VMPFC (displayed in pink) during choices for the other, compared with choices for self. All results: p < 0.05, FWE-corrected on the cluster-level, cluster-defining threshold p < 0.001 (see also Table 4). L, Left; R, right.
Table 4.
Brain activity and functional connectivity during valuationa
| Contrast and brain region | MNI coordinates |
z | Cluster size | ||
|---|---|---|---|---|---|
| x | y | z | |||
| Parametric modulation by Δvalueb | |||||
| L/R precuneus | 4 | −52 | 18 | 6.57 | 1869 |
| L/R superior frontal gyrus, medial orbital | 0 | 58 | −6 | 5.85 | 991 |
| L middle temporal gyrus | −62 | −32 | 2 | 5.65 | 1635 |
| R superior temporal gyrus | 60 | −26 | 2 | 5.42 | 1363 |
| R fusiform gyrus | 36 | −52 | −4 | 5.22 | 115 |
| L hippocampus | −20 | −16 | −20 | 5.06 | 61 |
| L angular gyrus | −46 | −70 | 24 | 4.97 | 505 |
| L/R olfactory cortex | 0 | 8 | −14 | 4.48 | 78 |
| L superior temporal gyrus | −34 | −22 | 2 | 4.33 | 60 |
| R postcentral gyrus | 48 | −24 | 62 | 4.30 | 72 |
| Correlation [ΔValue, Other – ΔValue, Self] × [βOther – βSelf ] | |||||
| L/R precuneus | 6 | −54 | 24 | 4.82 | 655 |
| L/R superior frontal gyrus, medial orbital | 2 | 52 | −10 | 4.60 | 341 |
| L angular gyrus | −40 | −64 | 24 | 4.49 | 206 |
| gPPI: functional connectivity with VMPFC (Other > Self) | |||||
| R middle temporal gyrus | 46 | −64 | 20 | 4.47 | 93 |
aWe report the first local maximum within each cluster. Effects were tested for significance using cluster inference with a cluster defining threshold of p < 0.001 and a cluster probability of p < 0.05 (FWE-corrected). gPPI, Generalized psychophysiological interaction analysis.
bFor this effect, we list the 10 clusters with the highest peak z values.
We next tested whether the individual differences in value sensitivity (identified by the modeling of the behavioral data) could be explained by differences in brain activity underpinning valuation. For this, we correlated the individual estimates of the contrast (ΔValue, Other > ΔValue, Self) with the difference in inverse temperature parameters (βOther − βSelf). This revealed clusters of positive correlations within the VMPFC, the precuneus, and the left angular gyrus (Fig. 3B,C; Table 4).
In summary, we found that the difference in the subjective values of possible actions was positively associated with activity within the VMPFC and subgenual ACC, the precuneus, and the middle temporal gyrus. Moreover, participants who made more value-sensitive choices for the other compared with for themselves also exhibited increased valuation-related activity within these brain areas during prosocial choices.
Functional connectivity during choices
Since the VMPFC is an area that has consistently been linked to valuation processes in previous research, we focused on connectivity of this area for answering the question whether valuation-related modulation also mediated the communication between brain regions. We found significantly increased functional connectivity of the VMPFC with the posterior right middle temporal gyrus/angular gyrus when choosing for the other than when choosing for oneself (contrast Other > Self; Fig. 3D; Table 4). The cluster corresponded to an area that has been referred to as right TPJ (rTPJ) (Silani et al., 2013; Schurz et al., 2017; Quesque and Brass, 2019). The reverse contrast (Self > Other) revealed no significant connectivity differences.
Brain activation related to outcomes and prediction errors
So far, we found that differences between prosocial and self-relevant learning were visible in the domain of valuation (more optimal choice behavior and higher value sensitivity during prosocial compared with self-relevant learning), but not in the domain of outcome evaluation (same learning rates for prosocial and self-relevant learning). We therefore did not predict fMRI analyses of outcome events to be informative for our research question. Here, we briefly report the basic results of these analyses, and refer the reader to Extended Data Fig. 4-1 and 4-2 for detailed results.
Analyzing brain activity associated with the presentation of outcomes, we found that positive outcomes engaged areas typically associated with reward processing, such as the ventral striatum and VMPFC, to a stronger degree than negative outcomes (contrast Positive > Negative; Fig. 4A; Extended Data Fig. 4-1). These effects were similar for self-relevant and prosocial learning. Negative outcomes, in contrast, led to increased activity in bilateral AI, anterior midcingulate cortex (AMCC), and supramarginal gyrus (contrast Negative > Positive; Fig. 4A; Extended Data Fig. 4-1), and did so to a greater extent during self-relevant than during prosocial learning (contrast (Negative – Positive)Self > (Negative – Positive)Other; Fig. 4B; Extended Data Fig. 4-1). We further analyzed correlations between brain activity and absolute prediction errors derived from the computational model, indicating processes that were specific to unexpected outcomes. Brain areas that were specifically activated by positive and negative prediction errors are listed in Extended Data Figure 4-2. Notably, we found that prediction errors engaged areas within the bilateral dorsomedial PFC and the right orbitofrontal cortex to a greater degree during prosocial learning than during self-relevant learning. We found no brain areas where activity associated with prediction errors was greater during self-relevant than prosocial learning.
Figure 4.

Results of fMRI analyses of brain activity during the presentation of outcomes in the prosocial learning task. A, Effects of outcome valence. Blue-to-white clusters represent areas with increased activity after a positive outcome (i.e., trials in which the choice made would not be followed by painful stimulation). Red-to-yellow clusters represent areas with increased activity after a negative outcome (i.e., trials in which the choice made would be followed by painful stimulation). B, Interaction between outcome valence (positive vs negative) and condition (Self vs Other). Blue-to-white clusters represent areas where the effect of positive outcomes was stronger during self-relevant compared with prosocial learning. Red-to-yellow clusters represent areas where the effect of negative outcomes was stronger during self-relevant compared with prosocial learning. All results: p < 0.05, FWE-corrected based on a cluster-defining threshold of p < 0.001. Results are listed in Extended Data Figure 4-1. Additional results regarding the parametric modulation of outcome-related brain activity by prediction errors are listed in Extended Data Figure 4-2. L, Left; R, right.
Brain activity during the outcome phase. We report the first local maximum within each cluster. Effects were tested for significance using cluster inference with a cluster defining threshold of p < 0.001 and a cluster probability of p < 0.05, FWE-corrected. * For these effects, we list the 10 clusters with the highest peak z values. Download Figure 4-1, DOCX file (16.4KB, docx) .
Parametric modulation during the outcome phase. |PE| = absolute prediction error. Effects were tested by calculating paired-sample t-tests on contrasts of the first-level parameter estimates of the parametric modulator. In the following, |PE|Self,Positive denotes the parameter estimate of the parametric modulator of the absolute prediction error for positive outcomes in the Self condition. The other terms are defined correspondingly.
|PE|Other = (|PE|Other,Positive+|PE|Other,Negative)/2
|PE|Self = (|PE|Self,Positive+|PE|Self,Negative)/2
|PE|Negative = (|PE|Self,Negative+|PE|Other,Negative)/2
|PE|Positive = (|PE|Self,Positive+|PE|Other,Positive)/2
|PE|Mean = (|PE|Self,Positive+|PE|Self,Negative+|PE|Other,Positive+|PE|Other,Negative) /4
We report the first local maximum within each cluster. Effects were tested for significance using cluster inference with a cluster defining threshold of p < 0.001 and a cluster probability of p < 0.05, FWE-corrected. Download Figure 4-2, DOCX file (16.7KB, docx) .
Discussion
Are humans as good at learning to avoid harm to others as they are at learning to avoid self-harm? And if so, which neural processes underpin these two types of learning? Here, we find that participants were, indeed, better at protecting another person from pain than themselves. The higher number of optimal choices for the other was explained by participants being more sensitive to the values of choice options during prosocial, compared with self-relevant learning, and this prosocial preference was significantly associated with empathic traits. On the neural level, higher sensitivity for other-related values was reflected by a stronger engagement of the VMPFC during valuation. Moreover, the VMPFC exhibited a higher connectivity to the rTPJ during choices affecting the other. Together, these findings suggest that humans are particularly adept at learning to protect others. This ability appears implemented by neural mechanisms that overlap with those supporting self-relevant learning, but with the additional recruitment of structures relevant in social cognition.
Previous evidence suggested that humans are inherently egocentric learners, adapting their behavior faster for their own benefit than for others' (Kwak et al., 2014; Lockwood et al., 2016). Importantly, these studies investigated prosocial learning in experimental settings which used monetary outcomes. Our data indicate that the situation might be reversed in the context of harm avoidance. A similar “hyperaltruistic” tendency was reported by Crockett et al. (2014, 2015), who found that individuals chose to spend more money to protect another person from pain than themselves. Our study provides a crucial extension to these findings, demonstrating that individuals act “hyperaltruistically” not only in situations where they can explicitly weigh self- and other-relevant outcomes, but also when the consequences of their behavior have to be learned implicitly. This lends essential support to the notion that prosociality may be an intuitive act (Zaki and Mitchell, 2013).
The higher number of optimal choices for the other was well explained by a greater sensitivity to subjective values during prosocial compared with self-relevant learning. The rate with which participants updated subjective values was not different between the two conditions, though. This implies that prosocial learning differs from self-relevant learning not in the way that information is collected, but in how strongly this information is weighed when choosing between actions. Moreover, we found that this prosocial “bonus” in value sensitivity was related to empathic traits. Participants who reported to strongly share the emotions of others (subscale Emotional Contagion of the QCAE) (Reniers et al., 2011) were also more sensitive to other-related values, implying that individuals who more readily feel what others feel are also more sensitive to the possible consequences of their actions for others. However, the tendency to get distressed by other people's problems (Proximal Responsitivity) appeared detrimental to sensitive valuation, perhaps because of the negative effect of stress on executive functions (Shields et al., 2016). This aligns with the notion that empathic sharing of emotions, but not personal distress, is a key driver of prosocial behavior (Hein et al., 2010; Decety et al., 2016).
In line with previous research (Kable and Glimcher, 2009; Ruff and Fehr, 2014), we found that the VMPFC was engaged during both prosocial and self-relevant valuation. Interestingly, we observed that differences in value sensitivity on the behavioral level were correlated with differences in valuation-related brain activity: Participants who were more sensitive to values during prosocial learning (compared with self-relevant learning) also displayed increased valuation-related VMPFC activity during prosocial choices. Differences in prosocial learning performance may thus be partially explained by differences in VMPFC involvement during valuation, possibly because strongly activated value representations facilitate the readout of values (Grueschow et al., 2015). Another important finding was that the VMPFC exhibited a stronger coupling with the rTPJ during prosocial choices. The rTPJ has been extensively linked to self-other distinction and related social functions (Silani et al., 2013; Schurz et al., 2017; Quesque and Brass, 2019). One function of this area is perspective-taking (Silani et al., 2013; Lamm et al., 2016; Schurz et al., 2017), which also has direct effects on prosocial decision-making (Morishima et al., 2012). Thus, prosocial valuation in our task may be informed by processes that enable participants to take the confederate's perspective, for example, by a mapping of the choice options to their consequences for the other (Hare et al., 2010; Janowski et al., 2013). A complementary interpretation is that the rTPJ engagement reflects the higher demand for self-other distinction during prosocial learning (Lamm et al., 2016; Quesque and Brass, 2019). For instance, the valuation processes in the VMPFC may call for a stronger signaling that the current decision will affect another person, and not oneself (Carter and Huettel, 2013; Tomova et al., 2020).
While these findings suggest a central role of the VMPFC in successfully learning to avoid others' harm, they cannot fully explain the generally higher number of optimal choices during prosocial learning. We did not find higher average activity during prosocial valuation, precluding claims that our sample's better performance for the other could be simply explained by generally stronger VMPFC engagement. It has been shown, though, that the VMPFC can switch dynamically between different frames of reference, such as values relevant for self versus other (Nicolle et al., 2012). This mechanism may mask differences in average activity, making them too subtle to be identified with GLM-based analyses. Further studies tailored for more complex analysis approaches, such as multivariate pattern analysis (Norman et al., 2006) or joint brain-behavior modeling (Palestro et al., 2018), might further elucidate these issues.
Based on the mathematical role of the inverse temperature parameter (see Materials and Methods), we have interpreted β as an indicator of value sensitivity. Importantly, our findings are also consistent with the notion that participants showed less exploratory tendencies during prosocial choices (Humphries et al., 2012; Cinotti et al., 2019), perhaps because of a higher risk aversion when choices might harm the other (Batteux et al., 2019). Future studies could thus optimize their design to differentiate between the roles of valuation and exploration/exploitation during prosocial decisions.
With regards to outcome evaluation, participants weighted positive prediction errors more strongly than negative prediction errors, implying that they tended to learn through successful pain avoidance, rather than through pain itself (Eldar et al., 2016). This result is consistent with recent findings suggesting that higher learning rates for positive outcomes reflect a confirmation bias in learning (Lefebvre et al., 2017; Palminteri et al., 2017; but for contrasting results, see Gershman, 2015). Surprisingly, we found no behavioral evidence that prosocial and self-relevant learning differed in terms of outcome evaluation, which contrasts previous studies of reward or associative learning that find lower learning rates for others (Lockwood et al., 2016, 2018). We did, however, observe significant differences in brain activity evoked by outcomes: while negative outcomes engaged bilateral AI and ACC reliably during prosocial and self-relevant learning, responses were stronger for self-relevant outcomes. This might indicate stronger anticipation of pain (Ploghaus et al., 1999), as self-related negative outcomes also signaled the imminent delivery of painful stimulation. As we found no corresponding difference in behavior, it is possible that the stronger aversive responses did not reflect processes involved in the updating of values.
Several limitations of our study need to be addressed. We only tested men, which possibly limits our conclusions to males. Six of 96 participants reported doubts about the confederate after the second session of the overarching project (i.e., 2 weeks after the session analyzed here). We have no information on whether these doubts were already present during the first session, which precludes to assess whether the observed effects were different in participants who doubted the cover story. It seems unlikely, though, that such a small part of the sample fundamentally affects the results.
Furthermore, participants were instructed that the confederate would know about the outcomes of their choices during both conditions of the task. Thus, it is possible that egocentric motivations, such as care for reputation, contributed to the difference between prosocial and self-relevant learning, as harming others might be seen as more detrimental to social status than harming oneself. We believe that the substantial correlations between prosocial learning performance and empathic traits point toward an important role of prosociality in learning to avoid other's harm. To clearly disentangle the (potentially complementary) roles of “selfish” and prosocial motives, further studies in which social observation is experimentally manipulated are needed. Furthermore, our findings cannot fully answer the question whether the prosocial tendencies we observed are specific to situations in which the other's physical integrity is at risk, or whether similar levels of prosociality would be displayed in situations where the other's “harm” is defined through financial loss. Indeed, previous studies directly comparing selfish tendencies in the domains of monetary rewards compared with protecting others from losses have found that people have a similar selfish bias in both contexts (Lockwood et al., 2017). To examine this further, future studies should vary the modality of harm (e.g., pain, financial loss) within the same design. Finally, our task reflected a situation in which optimal behavior for the other did not preclude optimal behavior for oneself. In many real-life situations, minimizing others' harm and minimizing self-harm are conflicting objectives, with examples ranging from in vivo organ donation (Marsh et al., 2014) to war. Further investigating how such conflicts influence prosocial learning would be of major importance for future research.
In conclusion, our findings support the notion that humans are not always “selfish” learners. Rather, they appear to be particularly good at learning for the benefit of other people when their physical integrity, rather than their financial success, is at risk. Our findings have important implications for future research on prosocial behavior: On the one hand, they highlight the importance of considering different outcomes when investigating learning for others; on the other, they demonstrate that we may show “intuitive prosociality” (Zaki and Mitchell, 2013) not only during explicit decision-making (Crockett et al., 2014, 2015), but also when prosocial actions about harm avoidance depend on implicit learning.
Footnotes
The authors declare no competing financial interests.
This work was supported by Vienna Science and Technology Fund WWTF VRG13-007. We thank Lei Zhang and Nace Mikus for helpful discussions concerning the modeling analyses, and feedback on the manuscript; and David Sastre-Yagüe, Gloria Mittmann, André Lüttig, Sophia Shea, and Leonie Brög for assistance during data collection.
References
- Ahn WY, Haines N, Zhang L (2017) Revealing neurocomputational mechanisms of reinforcement learning and decision-making with the hBayesDM package. Comput Psychiatr 1:24–57. 10.1162/CPSY_a_00002 [DOI] [PMC free article] [PubMed] [Google Scholar]
- Akaike H. (1998) Information theory and an extension of the maximum likelihood principle. In: Selected papers of Hirotogu Akaike, pp 199–213. [Google Scholar]
- Bates D, Mächler M, Bolker B, Walker S (2015) Fitting linear mixed-effects models using lme4. J Stat Softw 67:1–48. [Google Scholar]
- Batteux E, Ferguson E, Tunney RJ (2019) Do our risk preferences change when we make decisions for others? A meta-analysis of self-other differences in decisions involving risk. PLoS One 14:e0216566. [DOI] [PMC free article] [PubMed] [Google Scholar]
- Bauer DJ, Preacher KJ, Gil KM (2006) Conceptualizing and testing random indirect effects and moderated mediation in multilevel models: new procedures and recommendations. Psychol Methods 11:142–163. 10.1037/1082-989X.11.2.142 [DOI] [PubMed] [Google Scholar]
- Behrens TE, Hunt LT, Woolrich MW, Rushworth MF (2008) Associative learning of social value. Nature 456:245–249. 10.1038/nature07538 [DOI] [PMC free article] [PubMed] [Google Scholar]
- Box GE. (1976) Science and statistics. J Am Stat Assoc 71:791–799. 10.1080/01621459.1976.10480949 [DOI] [Google Scholar]
- Carpenter B, Gelman A, Hoffman MD, Lee D, Goodrich B, Betancourt M, Brubaker MA, Guo J, Li P, Riddell A (2017) Stan: a probabilistic programming language. J Stat Softw 76:1–32. [DOI] [PMC free article] [PubMed] [Google Scholar]
- Carter RM, Huettel SA (2013) A nexus model of the temporal-parietal junction. Trends Cogn Sci 17:328–336. 10.1016/j.tics.2013.05.007 [DOI] [PMC free article] [PubMed] [Google Scholar]
- Chen C, Martínez RM, Cheng Y (2018) The developmental origins of the social brain: empathy, morality, and justice. Front Psychol 9:2584. [DOI] [PMC free article] [PubMed] [Google Scholar]
- Chung D, Kadlec K, Aimone JA, McCurry K, King-Casas B, Chiu PH (2017) Valuation in major depression is intact and stable in a non-learning environment. Sci Rep 7:44374 10.1038/srep44374 [DOI] [PMC free article] [PubMed] [Google Scholar]
- Cinotti F, Fresno V, Aklil N, Coutureau E, Girard B, Marchand AR, Khamassi M (2019) Dopamine blockade impairs the exploration-exploitation trade-off in rats. Sci Rep 9:6770 10.1038/s41598-019-43245-z [DOI] [PMC free article] [PubMed] [Google Scholar]
- Cohen J. (2013) Statistical power analysis for the behavioral sciences. San Diego: Academic. [Google Scholar]
- Crockett MJ. (2013) Models of morality. Trends Cogn Sci 17:363–366. 10.1016/j.tics.2013.06.005 [DOI] [PMC free article] [PubMed] [Google Scholar]
- Crockett MJ, Kurth-Nelson Z, Siegel JZ, Dayan P, Dolan RJ (2014) Harm to others outweighs harm to self in moral decision making. Proc Natl Acad Sci USA 111:17320–17325. 10.1073/pnas.1408988111 [DOI] [PMC free article] [PubMed] [Google Scholar]
- Crockett MJ, Siegel JZ, Kurth-Nelson Z, Ousdal OT, Story G, Frieband C, Grosse-Rueskamp JM, Dayan P, Dolan RJ (2015) Dissociable effects of serotonin and dopamine on the valuation of harm in moral decision making. Curr Biol 25:1852–1859. 10.1016/j.cub.2015.05.021 [DOI] [PMC free article] [PubMed] [Google Scholar]
- Davison AC, Hinkley DV (1997) Bootstrap methods and their application. New York: Cambridge UP. [Google Scholar]
- Decety J, Bartal IB, Uzefovsky F, Knafo-Noam A (2016) Empathy as a driver of prosocial behaviour: highly conserved neurobehavioural mechanisms across species. Philos Trans R Soc Lond B Biol Sci 371:20150077. [DOI] [PMC free article] [PubMed] [Google Scholar]
- Decety J, Cowell JM (2018) Interpersonal harm aversion as a necessary foundation for morality: a developmental neuroscience perspective. Dev Psychopathol 30:153–164. 10.1017/S0954579417000530 [DOI] [PubMed] [Google Scholar]
- Den Ouden HE, Daw ND, Fernandez G, Elshout JA, Rijpkema M, Hoogman M, Franke B, Cools R (2013) Dissociable effects of dopamine and serotonin on reversal learning. Neuron 80:1090–1100. 10.1016/j.neuron.2013.08.030 [DOI] [PubMed] [Google Scholar]
- Efron B. (1987) Better bootstrap confidence intervals. J Am Stat Assoc 82:171–185. 10.1080/01621459.1987.10478410 [DOI] [Google Scholar]
- Eldar E, Hauser TU, Dayan P, Dolan RJ (2016) Striatal structure and function predict individual biases in learning to avoid pain. Proc Natl Acad Sci USA 113:4812–4817. 10.1073/pnas.1519829113 [DOI] [PMC free article] [PubMed] [Google Scholar]
- Faul F, Erdfelder E, Lang AG, Buchner A (2007) G*Power 3: a flexible statistical power analysis program for the social, behavioral, and biomedical sciences. Behav Res Methods 39:175–191. 10.3758/BF03193146 [DOI] [PubMed] [Google Scholar]
- Gelman A, Rubin DB (1992) Inference from iterative simulation using multiple sequences. Statist Sci 7:457–472. 10.1214/ss/1177011136 [DOI] [Google Scholar]
- Gelman A, Carlin JB, Stern HS, Dunson DB, Vehtari A, Rubin DB (2013) Bayesian data analysis, Ed 3 Boca Raton, FL: CRC. [Google Scholar]
- Gershman SJ. (2015) Do learning rates adapt to the distribution of rewards? Psychon Bull Rev 22:1320–1327. 10.3758/s13423-014-0790-3 [DOI] [PubMed] [Google Scholar]
- Gray K, Young L, Waytz A (2012) Mind perception is the essence of morality. Psychol Inq 23:101–124. 10.1080/1047840X.2012.651387 [DOI] [PMC free article] [PubMed] [Google Scholar]
- Grueschow M, Polania R, Hare TA, Ruff CC (2015) Automatic versus choice-dependent value representations in the human brain. Neuron 85:874–885. 10.1016/j.neuron.2014.12.054 [DOI] [PubMed] [Google Scholar]
- Hackel LM, Amodio DM (2018) Computational neuroscience approaches to social cognition. Curr Opin Psychol 24:92–97. 10.1016/j.copsyc.2018.09.001 [DOI] [PubMed] [Google Scholar]
- Hare TA, Camerer CF, Knoepfle DT, Rangel A (2010) Value computations in ventral medial prefrontal cortex during charitable decision making incorporate input from regions involved in social cognition. J Neurosci 30:583–590. 10.1523/JNEUROSCI.4089-09.2010 [DOI] [PMC free article] [PubMed] [Google Scholar]
- Hein G, Silani G, Preuschoff K, Batson CD, Singer T (2010) Neural responses to ingroup and outgroup members' suffering predict individual differences in costly helping. Neuron 68:149–160. 10.1016/j.neuron.2010.09.003 [DOI] [PubMed] [Google Scholar]
- Humphries MD, Khamassi M, Gurney K (2012) Dopaminergic control of the exploration-exploitation trade-off via the basal ganglia. Front Neurosci 6:9. 10.3389/fnins.2012.00009 [DOI] [PMC free article] [PubMed] [Google Scholar]
- Janowski V, Camerer C, Rangel A (2013) Empathic choice involves vmPFC value signals that are modulated by social processing implemented in IPL. Soc Cogn Affect Neurosci 8:201–208. 10.1093/scan/nsr086 [DOI] [PMC free article] [PubMed] [Google Scholar]
- Kable JW, Glimcher PW (2009) The neurobiology of decision: consensus and controversy. Neuron 63:733–745. 10.1016/j.neuron.2009.09.003 [DOI] [PMC free article] [PubMed] [Google Scholar]
- Kaelbling LP, Littman ML, Moore AW (1996) Reinforcement learning: a survey. The Journal of Artificial Intelligence Research 4:237–285. 10.1613/jair.301 [DOI] [Google Scholar]
- Kamary K, Mengersen K, Robert CP, Rousseau J (2014) Testing hypotheses via a mixture estimation model. arXiv 1412.2044. [Google Scholar]
- Kass RE, Raftery AE (1995) Bayes factors. J Am Stat Assoc 90:773–795. 10.1080/01621459.1995.10476572 [DOI] [Google Scholar]
- Katahira K. (2015) The relation between reinforcement learning parameters and the influence of reinforcement history on choice behavior. J Math Psychol 66:59–69. 10.1016/j.jmp.2015.03.006 [DOI] [Google Scholar]
- Keller M, Kamary K (2017) Bayesian Model Averaging By Mixture Modeling. arXiv:1711.10016v2. [Google Scholar]
- Kenny DA, Korchmaros JD, Bolger N (2003) Lower level mediation in multilevel models. Psychol Methods 8:115–128. 10.1037/1082-989x.8.2.115 [DOI] [PubMed] [Google Scholar]
- Keum S, Shin HS (2019) Neural basis of observational fear learning: a potential model of affective empathy. Neuron 104:78–86. 10.1016/j.neuron.2019.09.013 [DOI] [PubMed] [Google Scholar]
- Kulkarni S, Gilbert H (2011) The optimal Bayes decision rule. In: An elementary introduction to statistical learning theory, pp 45–54. New York: Wiley. [Google Scholar]
- Kwak Y, Pearson J, Huettel SA (2014) Differential reward learning for self and others predicts self-reported altruism. PLoS One 9:e107621 10.1371/journal.pone.0107621 [DOI] [PMC free article] [PubMed] [Google Scholar]
- Lamm C, Bukowski H, Silani G (2016) From shared to distinct self–other representations in empathy: evidence from neurotypical function and socio-cognitive disorders. Philos Trans R Soc Lond B Biol Sci 371:20150083. 10.1098/rstb.2015.0083 [DOI] [PMC free article] [PubMed] [Google Scholar]
- Lamm C, Rütgen M, Wagner IC (2019) Imaging empathy and prosocial emotions. Neurosci Lett 693:49–53. 10.1016/j.neulet.2017.06.054 [DOI] [PubMed] [Google Scholar]
- Lee D, Seo H, Jung MW (2012) Neural basis of reinforcement learning and decision making. Annu Rev Neurosci 35:287–308. 10.1146/annurev-neuro-062111-150512 [DOI] [PMC free article] [PubMed] [Google Scholar]
- Lefebvre G, Lebreton M, Meyniel F, Bourgeois-Gironde S, Palminteri S (2017) Behavioural and neural characterization of optimistic reinforcement learning. Nat Hum Behav 1:1–9. 10.1038/s41562-017-0067 [DOI] [Google Scholar]
- Lindström B, Haaker J, Olsson A (2018) A common neural network differentially mediates direct and social fear learning. Neuroimage 167:121–129. 10.1016/j.neuroimage.2017.11.039 [DOI] [PubMed] [Google Scholar]
- Lockwood PL, Apps MA, Valton V, Viding E, Roiser JP (2016) Neurocomputational mechanisms of prosocial learning and links to empathy. Proc Natl Acad Sci USA 113:9763–9768. 10.1073/pnas.1603198113 [DOI] [PMC free article] [PubMed] [Google Scholar]
- Lockwood PL, Hamonet M, Zhang SH, Ratnavel A, Salmony FU, Husain M, Apps M AJ (2017) Prosocial apathy for helping others when effort is required. Nature Human Behaviour 1:0131. [DOI] [PMC free article] [PubMed] [Google Scholar]
- Lockwood PL, Wittmann MK, Apps MA, Klein-Flügge MC, Crockett MJ, Humphreys GW, Rushworth MF (2018) Neural mechanisms for learning self and other ownership. Nat Commun 9:11 10.1038/s41467-018-07231-9 [DOI] [PMC free article] [PubMed] [Google Scholar]
- Ly A, Verhagen J, Wagenmakers EJ (2016) An evaluation of alternative methods for testing hypotheses, from the perspective of Harold Jeffreys. J Math Psychol 72:43–55. 10.1016/j.jmp.2016.01.003 [DOI] [Google Scholar]
- Marsh AA, Stoycos SA, Brethel-Haurwitz KM, Robinson P, VanMeter JW, Cardinale EM (2014) Neural and cognitive characteristics of extraordinary altruists. Proc Natl Acad Sci USA 111:15036–15041. 10.1073/pnas.1408440111 [DOI] [PMC free article] [PubMed] [Google Scholar]
- Matuschek H, Kliegl R, Vasishth S, Baayen H, Bates D (2017) Balancing Type I error and power in linear mixed models. J Mem Lang 94:305–315. 10.1016/j.jml.2017.01.001 [DOI] [Google Scholar]
- McLaren DG, Ries ML, Xu G, Johnson SC (2012) A generalized form of context-dependent psychophysiological interactions (gPPI): a comparison to standard approaches. Neuroimage 61:1277–1286. 10.1016/j.neuroimage.2012.03.068 [DOI] [PMC free article] [PubMed] [Google Scholar]
- Morishima Y, Schunk D, Bruhin A, Ruff CC, Fehr E (2012) Linking brain structure and activation in temporoparietal junction to explain the neurobiology of human altruism. Neuron 75:73–79. 10.1016/j.neuron.2012.05.021 [DOI] [PubMed] [Google Scholar]
- Nicolle A, Klein-Flügge MC, Hunt LT, Vlaev I, Dolan RJ, Behrens TE (2012) An agent independent axis for executed and modeled choice in medial prefrontal cortex. Neuron 75:1114–1121. 10.1016/j.neuron.2012.07.023 [DOI] [PMC free article] [PubMed] [Google Scholar]
- Norman KA, Polyn SM, Detre GJ, Haxby JV (2006) Beyond mind-reading: multi-voxel pattern analysis of fMRI data. Trends Cogn Sci 10:424–430. 10.1016/j.tics.2006.07.005 [DOI] [PubMed] [Google Scholar]
- Olsson A, Nearing KI, Phelps EA (2007) Learning fears by observing others: the neural systems of social fear transmission. Soc Cogn Affect Neurosci 2:3–11. 10.1093/scan/nsm005 [DOI] [PMC free article] [PubMed] [Google Scholar]
- Olsson A, McMahon K, Papenberg G, Zaki J, Bolger N, Ochsner KN (2016) Vicarious fear learning depends on empathic appraisals and trait empathy. Psychol Sci 27:25–33. 10.1177/0956797615604124 [DOI] [PMC free article] [PubMed] [Google Scholar]
- Palestro JJ, Bahg G, Sederberg PB, Lu ZL, Steyvers M, Turner BM (2018) A tutorial on joint models of neural and behavioral measures of cognition. J Math Psychol 84:20–48. 10.1016/j.jmp.2018.03.003 [DOI] [Google Scholar]
- Palminteri S, Lefebvre G, Kilford EJ, Blakemore SJ (2017) Confirmation bias in human reinforcement learning: evidence from counterfactual feedback processing. PLoS Comput Biol 13:e1005684. 10.1371/journal.pcbi.1005684 [DOI] [PMC free article] [PubMed] [Google Scholar]
- Ploghaus A, Tracey I, Gati JS, Clare S, Menon RS, Matthews PM, Rawlins JN (1999) Dissociating pain from its anticipation in the human brain. Science 284:1979–1981. 10.1126/science.284.5422.1979 [DOI] [PubMed] [Google Scholar]
- Power JD, Barnes KA, Snyder AZ, Schlaggar BL, Petersen SE (2012) Spurious but systematic correlations in functional connectivity MRI networks arise from subject motion. Neuroimage 59:2142–2154. 10.1016/j.neuroimage.2011.10.018 [DOI] [PMC free article] [PubMed] [Google Scholar]
- Pruim RH, Mennes M, Buitelaar JK, Beckmann CF (2015a) Evaluation of ICA-AROMA and alternative strategies for motion artifact removal in resting state fMRI. Neuroimage 112:278–287. 10.1016/j.neuroimage.2015.02.063 [DOI] [PubMed] [Google Scholar]
- Pruim RH, Mennes M, van Rooij D, Llera A, Buitelaar JK, Beckmann CF (2015b) ICA-AROMA: a robust ICA-based strategy for removing motion artifacts from fMRI data. Neuroimage 112:267–277. 10.1016/j.neuroimage.2015.02.064 [DOI] [PubMed] [Google Scholar]
- Quesque F, Brass M (2019) The role of the temporoparietal junction in self-other distinction. Brain Topogr 32:943–955. 10.1007/s10548-019-00737-5 [DOI] [PubMed] [Google Scholar]
- R Core Team (2020) R: A Language and Environment for Statistical Computing. R Foundation for Statistical Computing. Vienna, Austria; Available at https://www.R-project.org/. [Google Scholar]
- Reniers RL, Corcoran R, Drake R, Shryane NM, Völlm BA (2011) The QCAE: a questionnaire of cognitive and affective empathy. J Pers Assess 93:84–95. 10.1080/00223891.2010.528484 [DOI] [PubMed] [Google Scholar]
- Robert CP. (2016) The expected demise of the Bayes factor. J Math Psychol 72:33–37. 10.1016/j.jmp.2015.08.002 [DOI] [Google Scholar]
- Roy M, Shohamy D, Daw N, Jepma M, Wimmer GE, Wager TD (2014) Representation of aversive prediction errors in the human periaqueductal gray. Nat Neurosci 17:1607–1612. 10.1038/nn.3832 [DOI] [PMC free article] [PubMed] [Google Scholar]
- Ruff CC, Fehr E (2014) The neurobiology of rewards and values in social decision making. Nat Rev Neurosci 15:549–562. 10.1038/nrn3776 [DOI] [PubMed] [Google Scholar]
- Rütgen M, Seidel EM, Riečanský I, Lamm C (2015a) Reduction of empathy for pain by placebo analgesia suggests functional equivalence of empathy and first-hand emotion experience. J Neurosci 35:8938–8947. 10.1523/JNEUROSCI.3936-14.2015 [DOI] [PMC free article] [PubMed] [Google Scholar]
- Rütgen M, Seidel EM, Silani G, Riečanský I, Hummer A, Windischberger C, Petrovic P, Lamm C (2015b) Placebo analgesia and its opioidergic regulation suggest that empathy for pain is grounded in self pain. Proc Natl Acad Sci USA 112:E5638–E5646. 10.1073/pnas.1511269112 [DOI] [PMC free article] [PubMed] [Google Scholar]
- Schurz M, Tholen MG, Perner J, Mars RB, Sallet J (2017) Specifying the brain anatomy underlying temporo-parietal junction activations for theory of mind: a review using probabilistic atlases from different imaging modalities. Hum Brain Mapp 38:4788–4805. 10.1002/hbm.23675 [DOI] [PMC free article] [PubMed] [Google Scholar]
- Seymour B, O'Doherty JP, Dayan P, Koltzenburg M, Jones AK, Dolan RJ, Friston KJ, Frackowiak RS (2004) Temporal difference models describe higher-order learning in humans. Nature 429:664–667. 10.1038/nature02581 [DOI] [PubMed] [Google Scholar]
- Shields GS, Sazma MA, Yonelinas AP (2016) The effects of acute stress on core executive functions: a meta-analysis and comparison with cortisol. Neurosci Biobehav Rev 68:651–668. 10.1016/j.neubiorev.2016.06.038 [DOI] [PMC free article] [PubMed] [Google Scholar]
- Silani G, Lamm C, Ruff CC, Singer T (2013) Right supramarginal gyrus is crucial to overcome emotional egocentricity bias in social judgments. J Neurosci 33:15466–15476. 10.1523/JNEUROSCI.1488-13.2013 [DOI] [PMC free article] [PubMed] [Google Scholar]
- Singmann H, Bolker B, Westfall J, Aust F, Ben-Shachar MS (2020) afex: analysis of factorial experiments. R package version 0.27-2. https://CRAN.R-project.org/package=afex.
- Steyvers M, Lee MD, Wagenmakers EJ (2009) A Bayesian analysis of human decision-making on bandit problems. J Math Psychol 53:168–179. 10.1016/j.jmp.2008.11.002 [DOI] [Google Scholar]
- Sutton R, Barto A (1998) Reinforcement learning: an introduction. Cambridge, MA: Massachusetts Institute of Technology. [Google Scholar]
- Tabor A, Burr C (2019) Bayesian learning models of pain: a call to action. Curr Opin Behav Sci 26:54–61. 10.1016/j.cobeha.2018.10.006 [DOI] [Google Scholar]
- Tomova L, Saxe R, Klöbl M, Lanzenberger R, Lamm C (2020) Acute stress alters neural patterns of value representation for others. Neuroimage 209:116497. 10.1016/j.neuroimage.2019.116497 [DOI] [PubMed] [Google Scholar]
- Tzourio-Mazoyer N, Landeau B, Papathanassiou D, Crivello F, Etard O, Delcroix N, Mazoyer B, Joliot M (2002) Automated anatomical labeling of activations in SPM using a macroscopic anatomical parcellation of the MNI MRI single-subject brain. Neuroimage 15:273–289. 10.1006/nimg.2001.0978 [DOI] [PubMed] [Google Scholar]
- Vlaeyen JW. (2015) Learning to predict and control harmful events. Pain 156:S86–S93. 10.1097/j.pain.0000000000000107 [DOI] [PubMed] [Google Scholar]
- Wiech K, Tracey I (2013) Pain, decisions, and actions: a motivational perspective. Front Neurosci 7:46. 10.3389/fnins.2013.00046 [DOI] [PMC free article] [PubMed] [Google Scholar]
- Zaki J, Mitchell JP (2013) Intuitive prosociality. Curr Dir Psychol Sci 22:466–470. 10.1177/0963721413492764 [DOI] [Google Scholar]
- Zhang L, Lengersdorff L, Mikus N, Gläscher J, Lamm C (2020) Using reinforcement learning models in social neuroscience: frameworks, pitfalls, and suggestions. Soc Cogn Affect Neuosci 15:695–707. [DOI] [PMC free article] [PubMed] [Google Scholar]
Associated Data
This section collects any data citations, data availability statements, or supplementary materials included in this article.
Supplementary Materials
Brain activity during the outcome phase. We report the first local maximum within each cluster. Effects were tested for significance using cluster inference with a cluster defining threshold of p < 0.001 and a cluster probability of p < 0.05, FWE-corrected. * For these effects, we list the 10 clusters with the highest peak z values. Download Figure 4-1, DOCX file (16.4KB, docx) .
Parametric modulation during the outcome phase. |PE| = absolute prediction error. Effects were tested by calculating paired-sample t-tests on contrasts of the first-level parameter estimates of the parametric modulator. In the following, |PE|Self,Positive denotes the parameter estimate of the parametric modulator of the absolute prediction error for positive outcomes in the Self condition. The other terms are defined correspondingly.
|PE|Other = (|PE|Other,Positive+|PE|Other,Negative)/2
|PE|Self = (|PE|Self,Positive+|PE|Self,Negative)/2
|PE|Negative = (|PE|Self,Negative+|PE|Other,Negative)/2
|PE|Positive = (|PE|Self,Positive+|PE|Other,Positive)/2
|PE|Mean = (|PE|Self,Positive+|PE|Self,Negative+|PE|Other,Positive+|PE|Other,Negative) /4
We report the first local maximum within each cluster. Effects were tested for significance using cluster inference with a cluster defining threshold of p < 0.001 and a cluster probability of p < 0.05, FWE-corrected. Download Figure 4-2, DOCX file (16.7KB, docx) .
Data Availability Statement
Custom scripts for the calculation of optimal choices and estimation of Bayesian models in STAN, as well as a documentation of the used priors, are freely accessible on OSF (https://osf.io/53qvd/). Second-level fMRI contrast maps are accessible at the same location.