Molinuevo et al. show a novel control of epidermoid differentiation by the DNA damage response signals and propose a model for automatic cleansing of stratified self-renewal epithelia facing genotoxic agents.
Abstract
How rapid cell multiplication leads to cell differentiation in developing tissues is still enigmatic. This question is central to morphogenesis, cell number control, and homeostasis. Self-renewal epidermoid epithelia are continuously exposed to mutagens and are the most common target of cancer. Unknown mechanisms commit rapidly proliferating cells to post-mitotic terminal differentiation. We have over-activated or inhibited the endogenous DNA damage response (DDR) pathways by combinations of activating TopBP1 protein, specific shRNAs, or chemical inhibitors for ATR, ATM, and/or DNA-PK. The results dissect and demonstrate that these signals control keratinocyte differentiation in proliferating cells independently of actual DNA damage. The DDR limits keratinocyte multiplication upon hyperproliferative stimuli. Moreover, knocking down H2AX, a common target of the DDR pathways, inhibits the epidermoid phenotype. The results altogether show that the DDR is required to maintain the balance proliferation differentiation and suggest that is part of the squamous program. We propose a homeostatic model where genetic damage is automatically and continuously cleansed by cell-autonomous mechanisms.
Introduction
During expansion and regeneration, developing tissues undergo a phase of rapid cell proliferation that eventually needs to cease to ensure tissue integrity and function. Apoptosis is a well-known mechanism that limits proliferation during embryogenesis and adult development (Chen and Zhao, 1998; Glücksmann, 1965; Pampfer and Donnay, 1999). However, apoptosis is not suitable when the tissue expands to accomplish a specialized function. An alternative limit to proliferation is terminal differentiation, whose role in anti-oncogenic protection has been scarcely studied. DNA damage has been shown to induce differentiation in a growing body of systems (Puri et al., 2002; Santos et al., 2014; Wang et al., 2012). The molecular mechanisms determining the time when cell division must lead to terminal differentiation in developing tissues remain obscure yet critical to maintain homeostasis and to avoid carcinogenesis.
Human epidermis is a stratified squamous epithelium with high self-renewal capacity that is continuously developing throughout adult life. As in squamous epithelia of the head and neck, esophagus, or cervix, keratinocytes from the upper layers of the epidermis are continuously replaced by new differentiating cells that emerge from the basal layer. Stem cells in the basal layer are mainly quiescent but undergo a rapid phase of clonal expansion before terminal differentiation (Watt et al., 2006). This transition is concomitant with the down-regulation of p53, the inactivation of cell cycle inhibitor Rb (retinoblastoma), and the induction of the main DNA replication driver, cyclin E (Dazard et al., 2000; Freije et al., 2012; Harvat et al., 1998; Hauser et al., 2004; Paramio et al., 1998; Zanet et al., 2010). In spite of their active proliferative state, these cells are committed to differentiate after only four or five cell divisions (Watt et al., 2006) by unknown mechanisms. Rapidly expanding cells’ commitment to differentiate is key to development and cancer.
We have shown that the balance between proliferation and differentiation upon oncogenic alterations in the epidermis is established by a differentiation-mitosis checkpoint (Freije et al., 2012, 2014; Gandarillas et al., 2015; Gandarillas and Watt, 1997). Cell cycle deregulation by oncogenic alterations promotes replication stress (RS) and induces the DNA damage response (DDR; Macheret and Halazonetis, 2015). The differentiation-mitosis checkpoint is consistent with an oncogene-induced differentiation response that involves accumulation of DNA damage due to RS and the activation of the G2/M checkpoints (Freije et al., 2014; Molinuevo et al., 2017). Activation of the terminal differentiation program during an active cycle renders the mitosis block irreversible and drives keratinocytes to endoreplicate and to increase in size. Hence, the oncogene-induced differentiation response might act as a protective mechanism against oncogenic alterations in the epidermis. However, it remains to be determined whether DNA damage-induced differentiation is part of the natural squamous differentiation program.
Nuclear DNA is continuously damaged in many ways. DNA lesions interfere with DNA replication, transcription, and genome integrity. Propagation of the damage must be avoided to ensure homeostasis and prevention of disease. Activation of the DDR depends on three serine/threonine protein kinases of the phosphoinositide 3-kinase (PI3K)-related kinase family: ataxia-telangiectasia–mutated (ATM), ATM and Rad3–related (ATR), and DNA–protein kinase complex (DNA-PK; Lopez-Contreras and Fernandez-Capetillo, 2012). While ATM and DNA-PK respond primarily to double strand breaks (DSBs), ATR is activated by a wider range of DNA lesions produced during DNA replication, including DSB and single strand breaks (Zou and Elledge, 2003). Upon activation, all the three kinases converge in the phosphorylation of the histone H2AX on serine 139 (γH2AX; Fernandez-Capetillo et al., 2004; Rogakou et al., 1998). γH2AX signaling at the DSB is required for DNA damage signal amplification and subsequent accumulation of numerous DDR proteins (Ciccia and Elledge, 2010). DDR involves DNA lesion recognition and a signaling cascade that arrests the cell cycle and promotes DNA repair. The DDR is also responsible for the induction of senescence or apoptosis in cells with extensive irreparable DNA damage, limiting the propagation of mutated cells (Lopez-Contreras and Fernandez-Capetillo, 2012).
Here we show that the DNA damage produced by loss of cell cycle control in rapidly proliferating human epidermal keratinocytes and the activation of the DDR are an essential part of the keratinocyte squamous differentiation program. We performed gain or loss of functions in the DDR cascade. The results altogether show that DDR mediates the keratinocyte transition from proliferation to differentiation. Accumulation of DNA damage is detected in the skin in situ, at the frontier between the proliferative and differentiated layers of cells. Furthermore, the data suggest that DDR is required for and might be part of the squamous phenotype.
Results
Primary keratinocytes undergo DNA damage during proliferation
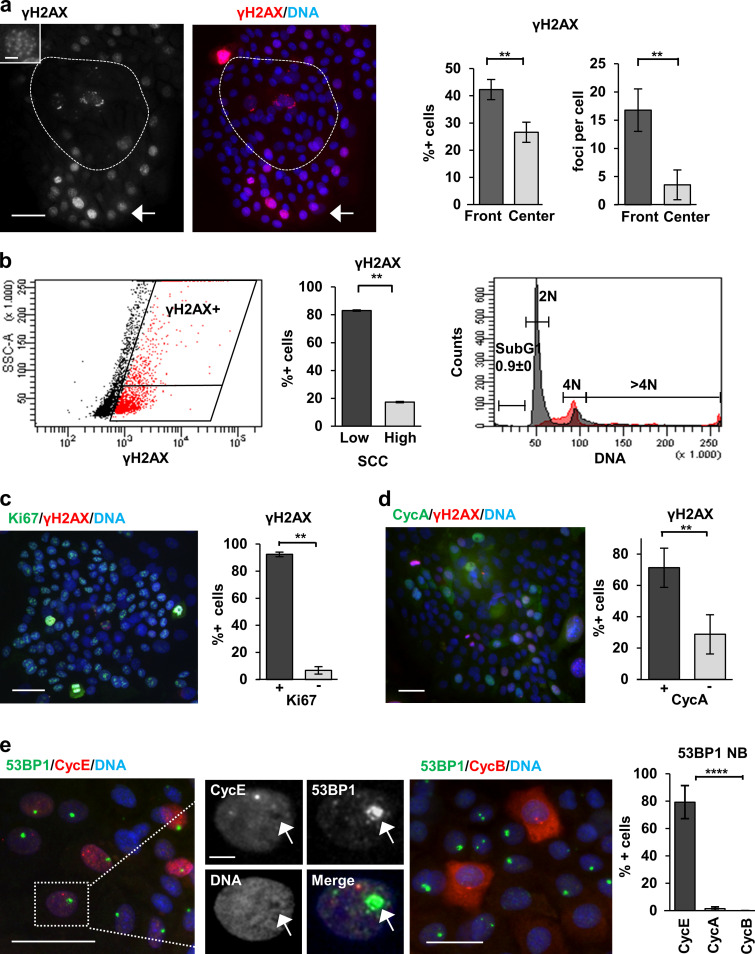
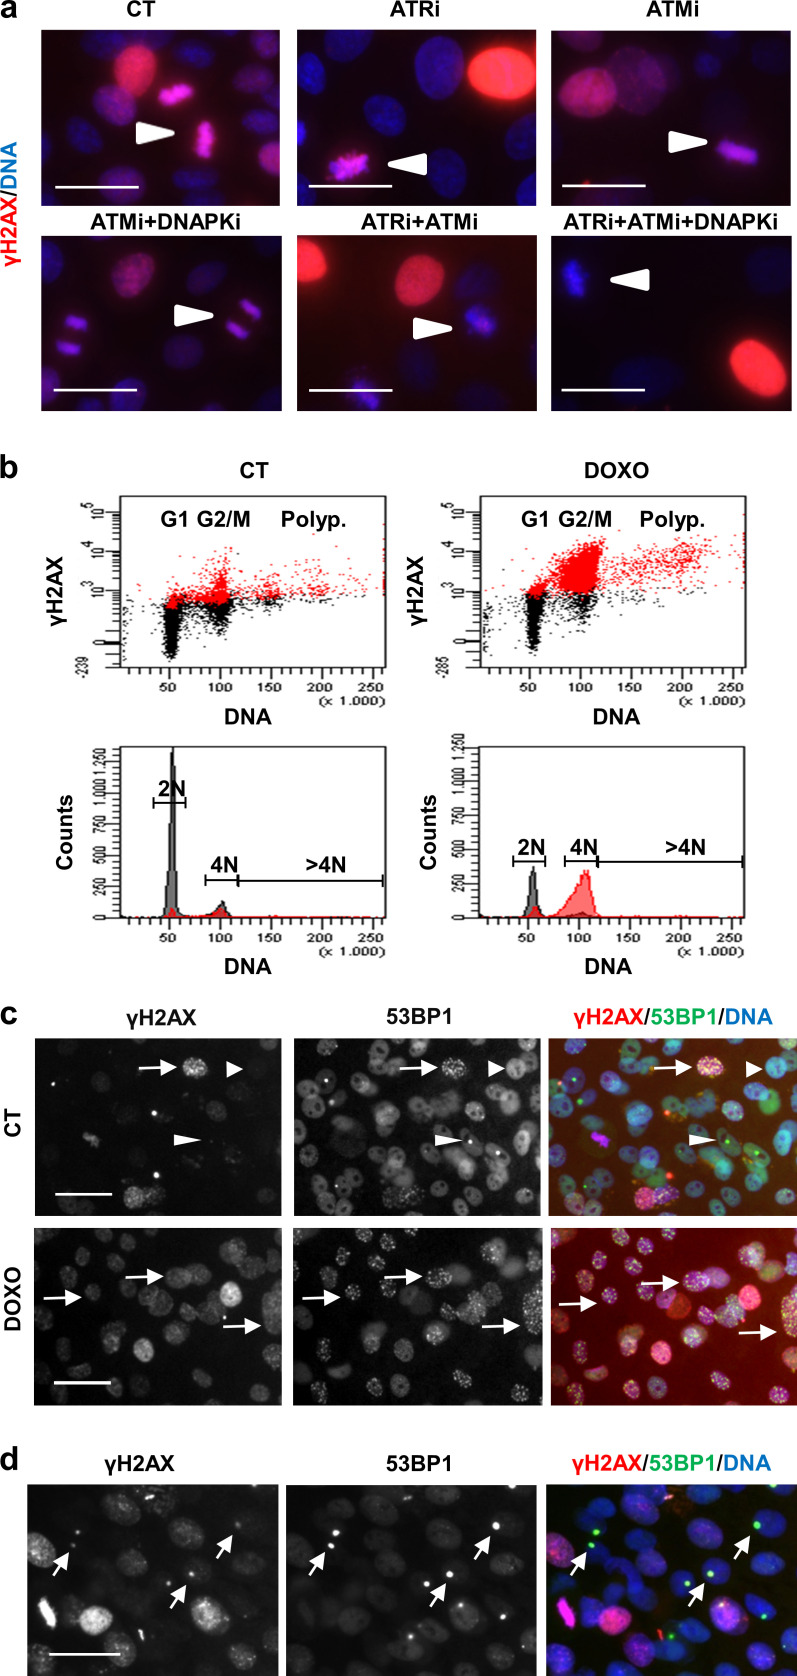
To investigate whether the DDR caused by proliferative RS can drive squamous differentiation, we first determined whether DNA damage occurs in normal keratinocytes in the absence of exogenous genotoxic agents. By immunofluorescence (IF), we detected accumulation of the DNA damage marker γH2AX in the proliferative front of the primary keratinocyte colonies (Fig. 1 a). γH2AX was strikingly strong in metaphasic chromosomes (Fig. S1 a). Consistent with RS (McManus and Hendzel, 2005), the γH2AX signal increased during S phase and peaked at G2/M (Fig. 1 b and Fig. S1 b; 10× increase of antibody signal). In addition, in flow cytometry (FC) γH2AX-positive cells are mostly (average 80/20%, Fig. 1 b) within the small cells with low-scatter parameters compartment (proliferative cells; Jones and Watt, 1993; Sanz-Gómez et al., 2020b).
Figure 1.
DNA damage signaling is active in proliferative human keratinocytes. (a) Detection of γH2AX (red). Note that γH2AX is mostly present in the proliferative fronts of the colonies (arrow). Broken line draws the center of the colony. Bar histograms: percentage of γH2AX-positive cells (left) or foci per cell (right) in the fronts or the center of the colonies. Amplified inset shows the numerous γH2AX foci of a peripheral nucleus. (b) FC analysis of DNA content (PI) and DNA damage (γH2AX) of primary keratinocytes. Dot plot: Side scatter (SCC) versus γH2AX expression. Note that most γH2AX-positive cells (red) display low SCC. Quantitation in bar histogram. Right plot: Cell cycle analysis of γH2AX-positive (red) or -negative (gray) cells. (c and d) Double IF for Ki67 (green, c) or cyclin A (CycA; green, d) and γH2AX (red). Bar histograms show percentage of γH2AX-positive cells that are positive or negative for Ki67 (a) or CycA (d). (e) Double IF for 53BP1 (green) and cyclin E (CycE; red, left panel), or cyclin B1 (CycB; red, right panel). Smaller panels: Separate colors as indicated of amplified region in white box (CycE). Note that 53BP1 NBs are mostly coexpressed with CycE, but they do not colocalize (arrow); they are excluded with mitotic CycB. Bar histogram: 53BP1 NBs positive for CycE, CycA, or CycB. Scale bar, 50 µm; inset scale bar, 10 µm. Blue in microscopy photographs is nuclear DNA by DAPI. Data in a, d, and e are mean ± SEM of at least n = 1,000 (a, d, and e) or n = 500 (c) cells of five or three fields, in b from sextuplicate samples, of representative experiments. Datasets were compared by an unpaired t test (two-sided). **, P < 0.01; ****, P < 10−5. See also Fig. S1, Fig. S2, and Fig. S3.
Figure S1.
DNA damage signal γH2AX in human keratinocytes peaks at metaphase, where it depends on both ATM and ATR. (a) Expression of γH2AX (red) is highest in metaphasic exponentially proliferating keratinocytes treated with DMSO vehicle only (CT, arrowheads). This localization is present upon a single 24-h treatment with ATRi, ATMi, or combined ATMi/DNA-PKi, but is inhibited by combined ATRi/ATMi or by ATRi/ATMi/DNA-PKi. (b) FC analyses of DNA content (PI) and DNA damage (γH2AX) in primary keratinocytes treated with the genotoxic agent DOXO (right) for 24 h. γH2AX-positive cells according to negative isotype antibody (red). DMSO vehicle as CT (left). (c and d) Double IF for γH2AX (red) and 53BP1 (green) in keratinocytes. In c, the three patterns of 53BP1: (i) diffuse in absence of significant DNA damage (arrowhead), (ii) granulated when acute DNA damage (arrow), and (iii) large spots corresponding to unrepaired NBs (thin arrowheads). Note that 53BP1 NBs colocalize with γH2AX spots (arrows in d). Scale bar, 50 µm. Nuclear DNA by DAPI. This figure complements Fig. 1 and Fig. 2.
Keratinocytes are resistant to apoptosis unless they undergo Sunburn (Bell and Megeney, 2017; Sanz-Gómez et al., 2020a). Consistently, no apoptotic sub-G1 cells were detected in the stratifying cultures (Fig. 1 b and Fig. S1 b). Furthermore, there was a strong correlation between expression of γH2AX and proliferative markers Ki67 and cyclin A (Fig. 1, c and d).
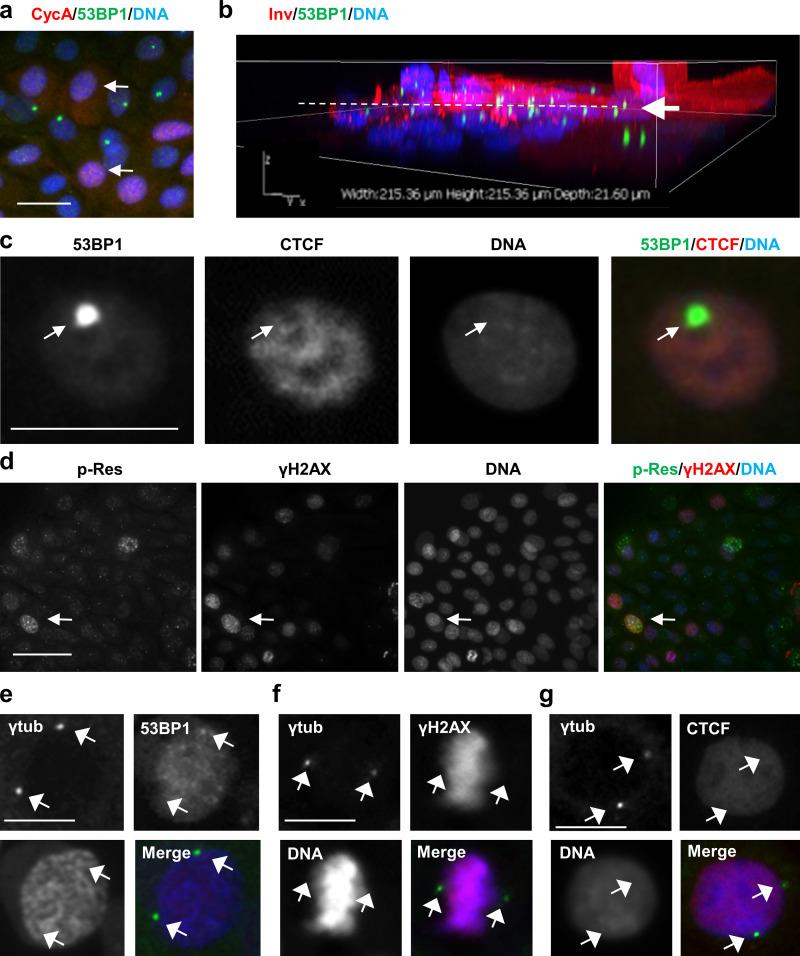
The DNA repair marker protein 53BP1 was profusely detected in primary keratinocytes (Fig. S1, c and d). 53BP1 promotes nonhomologous end-joining–mediated repair of DSB by interacting with DSB-responsive proteins (Fernandez-Vidal et al., 2017). As described in other systems, three patterns of expression of 53BP1 were found: (1) mild and homogenous stain in the whole nucleus, (2) discrete foci, and (3) large single spots (Fig. S1 c, arrows). The first pattern corresponds to the absence of substantial DNA repair. The second pattern corresponds to active DNA repair (Fernandez-Vidal et al., 2017), and it was present in exponentially proliferating keratinocytes and very frequent in keratinocytes treated with the genotoxic agent doxorubicin (DOXO; Fig. S1 c). Large nuclear single spots of 53BP1 (53BP1 nuclear bodies [NBs]) have been associated with mitotic transmission of DNA lesions resulting in unrepaired persistent DNA damage foci that are silenced in order to avoid transcription of aberrant mRNA (Fernandez-Vidal et al., 2017; Lukas et al., 2011; Mata-Garrido et al., 2016; Vancurova et al., 2019). As expected, 53BP1 NBs colocalized with γH2AX foci (Fig. S1 d, arrows). 53BP1 NBs were present mostly in keratinocytes accumulating cyclin E but not in cells expressing cyclin A or cyclin B (Fig. 1 e and Fig. S2 b), suggesting that they are mainly formed in DNA replicating cells. Cyclin E accumulates in postmitotic keratinocytes that have already initiated terminal differentiation and undergo endoreplication (Zanet et al., 2010; Freije et al., 2012). However, 53BP1 and cyclin E did not colocalize within the nucleus (Fig. 1 e, left panel). This further indicates that 53BP1 NBs are excluded from replication. Furthermore, 53BP1 NBs also localized to areas dull for the chromatin insulator CCCTC binding factor CTCF (Fig. S2 c).
Figure S2.
Localization of DNA damage/repair markers in human keratinocytes. (a) Double IF for cyclin A (CycA; red, arrows) and 53BP1 (green). Note that cells displaying 53BP1 NBs are negative for cyclin A. (b) 3D confocal reconstruction of human primary keratinocytes immunostained for Inv (red) and 53BP1 (green). Note that 53BP1 NBs are found mainly in stratifying cells at the transition proliferation/differentiation (arrow and broken line). (c) Double IF for 53BP1 (green) and CTCF (red). Note that 53BP1 NBs colocalize with nuclear regions dull for CTCF (arrow). (d) Double IF for ATR/ATM-phosphorylated target residues (p-Res; green) and γH2AX (red). Note that strong labeling tends to colocalize (arrow), but not all of it does. (e–g) Double IF for centrosomal γ-tubulin (γtub, green, arrows) and 53BP1 (red, e), or γH2AX (red, f) or CTCF (red, g). Nuclear DNA by DAPI (blue). Scale bars, 50 µm (a, b, and g) or 25 µm (d). This figure complements Fig. 1 and Fig. 2.
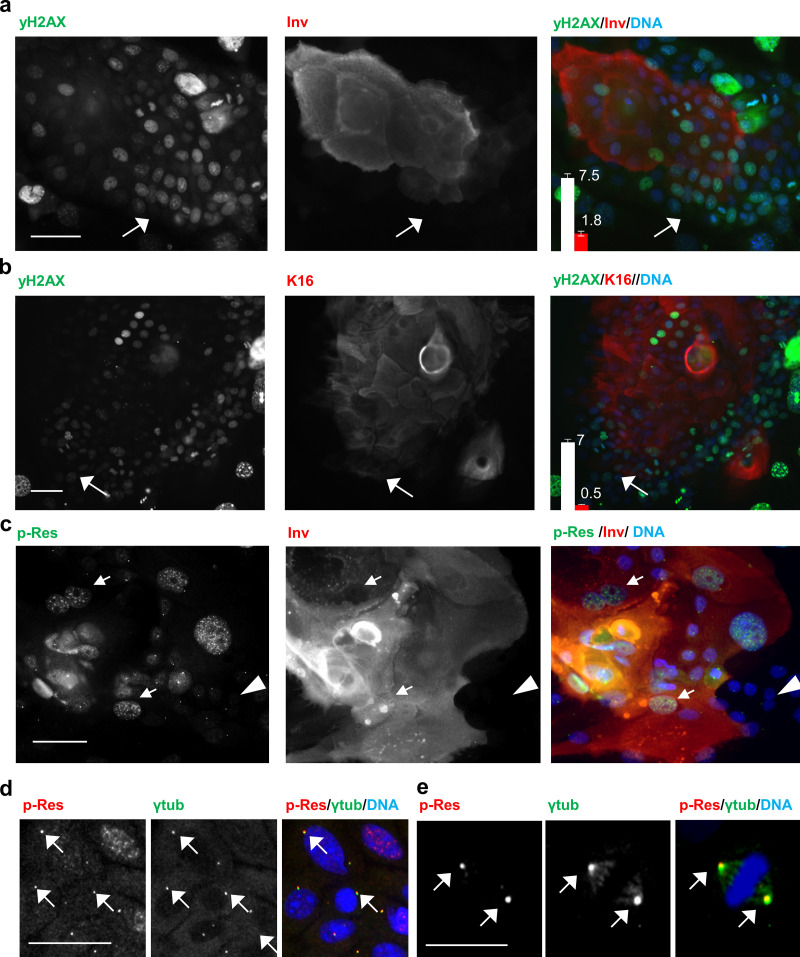
Consistent with DNA damage accumulating in proliferative cells, γH2AX was scarce in suprabasal differentiating cells in the keratinocyte colonies, as monitored by double labeling with involucrin (Inv) or keratin K16 (K16) markers (Fig. 2, a and b). Interestingly, 53BP1 NBs were frequent in stratifying differentiating keratinocytes (Fig. S2 b, arrow), suggesting that these cells accumulate unrepaired DNA damage.
Figure 2.
DNA damage signaling is detected in the keratinocyte transition proliferation/differentiation. (a and b) Double IF for γH2AX (green) and the differentiation markers Inv (a, red) or K16 (b, red). Arrows point at the active front of the colony. Bar graph in the right panel displays the average number of γH2AX foci per nucleus in Inv (a) or K16 (b) negative (white) or positive (red) cells. Data are mean ± SEM of representative experiments. Datasets were compared by an unpaired t test (two-sided). P < 0.0001. (c) Double IF for p-Res (green) and Inv (red). Arrows point at stratifying Inv-positive cells strong for p-Res. Arrowhead basal cells dull for p-Res. (d and e) Double IF for p-Res (red) and γ-tubulin (ytub, green) localizing to interphasic (d) and mitotic (e) centrosomes (arrows). Scale bar, 50 µm. Nuclear DNA in blue by DAPI. See also Fig. S1 and Fig. S2.
By using an antibody that recognizes protein residues phosphorylated by ATM or ATR (p-Res), we further confirmed that the DDR is activated in proliferative keratinocytes (Fig. 2 d). Double staining γH2AX and p-Res show partial colocalization (Fig. S2 d). Interestingly, a strong pan-nuclear p-Res staining was found in stratifying cells expressing the differentiation marker Inv (Fig. 2 c). In contrast, proliferating keratinocytes, negative for Inv expression, displayed scarce p-Res foci (Fig. 2 c, arrowheads). Interestingly, we observed that the p-Res foci colocalized with γ-tubulin in interphasic and mitotic cells (Fig. 2, d and e; and Fig. S2, e–g). We did not detect this colocalization with antibodies to γH2AX or CTCF. Given that γ-tubulin is a main component of the centrosomes and these have a critical function in mitosis (Conduit et al., 2015), this result suggests that the DDR through ATR/ATM substrates might have a function in controlling the keratinocyte mitosis. The p-Res seemed to be surrounded by γ-tubulin and might localize to a discrete regulatory region of the centrosome.
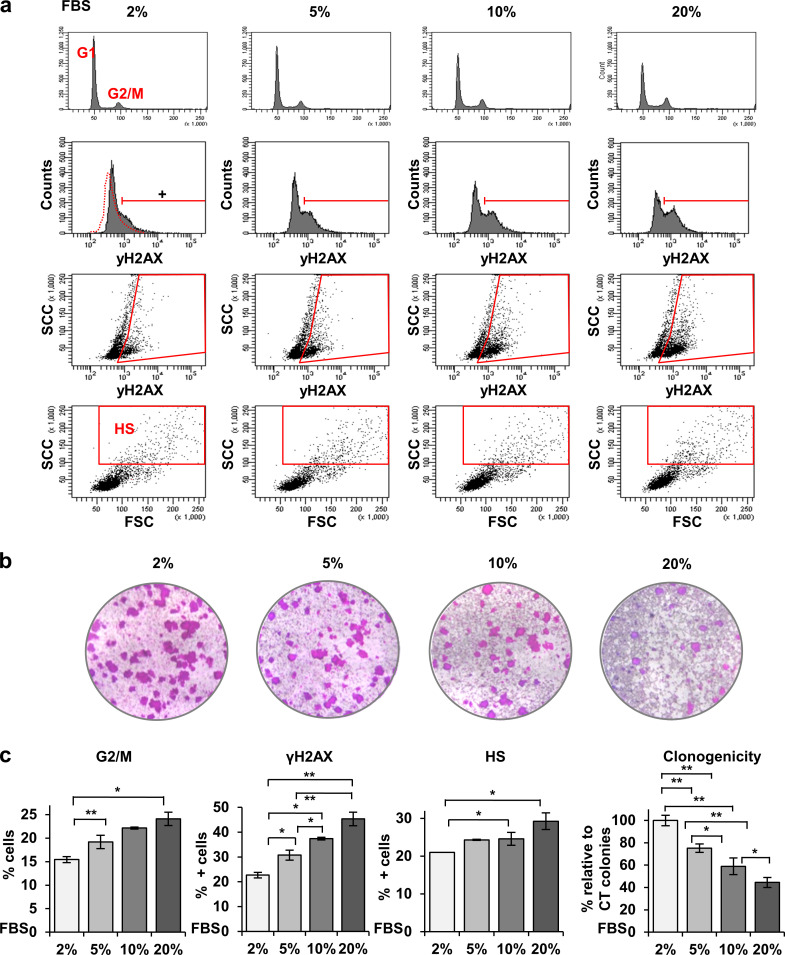
The RS caused by cell cycle acceleration in proliferating keratinocytes likely is responsible for the DNA damage signals described above. Consistently, increasing concentrations of serum proportionally induced the γH2AX signal and paradoxically hampered the clonogenic capacity of keratinocytes (Fig. S3).
Figure S3.
Increasing serum concentration induces γH2AX in human keratinocytes and results in loss of proliferative potential. (a) FC analyses of primary keratinocytes cultured in increasing serum concentrations as indicated, from top to bottom for DNA content by PI, γH2AX (DNA damage), γH2AX versus light side scatter (SCC), SCC versus forward scatter (FSC). Red gate is for γH2AX-positive cells according to negative isotype control, or cells displaying HS typical of squamous differentiation. (b) Clonogenicity assays of keratinocytes cultured in increasing serum concentrations for 9 d. Figure shows representative images of triplicate samples. (c) Quantifications of cells in the G2/M phase of the cell cycle, positive for γH2AX, or displaying HS, according to gates in a. Right last histogram displays number of growing colonies relative to 2% serum in the culture medium. Data are mean ± SEM of triplicate samples. Datasets were compared by an unpaired t test (two-sided). *, P < 0.05; **, P < 0.01. This figure complements Fig. 1.
The ATR pathway activates the squamous differentiation program of primary keratinocytes
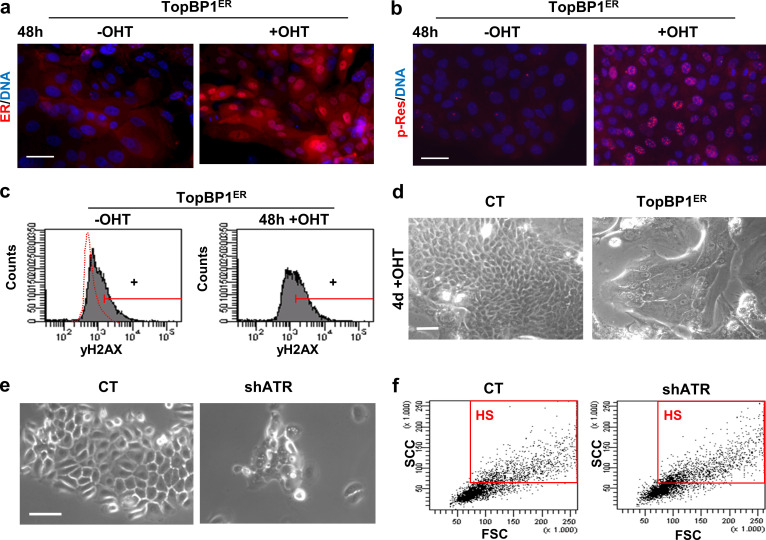
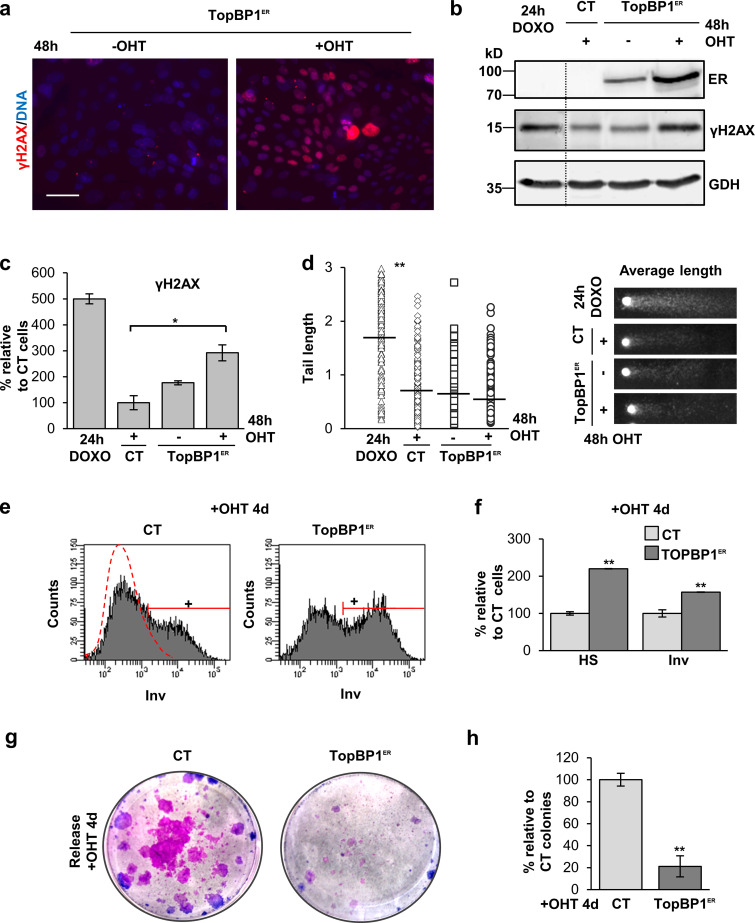
ATR is the main initiator of the DDR cascade upon RS (Flynn and Zou, 2011). The activation of the DDR kinase ATR has been shown to be sufficient to induce senescence even in the absence of DNA damage (Toledo et al., 2008). We aimed to investigate whether there is a relationship between the ATR signaling and the cell decision toward squamous differentiation. To this aim, we made use of a construct carrying a domain of the TopBP1 protein. TopBP1 is upstream of and activates ATR by driving its phosphorylation (Flynn and Zou, 2011). When constitutively expressed, TopBP1 renders ATR active even in the absence of DNA damage (Toledo et al., 2008). We overexpressed a construct carrying TopBP1ER (a fusion protein containing the ATR activating domain of TopBP1 and the mutant domain of estrogen receptor ER) in human primary keratinocytes of the skin. This is a fusion protein containing the ATR activating domain of TopBP1 and the mutant domain of estrogen receptor ER, which is regulatable by 4-hydroxytamoxifen (OHT; Toledo et al., 2008).The exogenous chimeric protein (TopBP1ER) was mainly cytoplasmatic and weakly detectable in the absence of OHT. However, it translocated to the nucleus and was up-regulated 48 h after addition of OHT (Fig. S4 a). The lower level of expression of the protein in the absence of OHT might be due to proteosomal degradation (Herold et al., 2008). We also analyzed the early DNA damage marker γH2AX. H2AX histone is a well characterized target of the DDR kinases (Burma et al., 2001; Ward and Chen, 2001). The phosphorylated form γH2AX increased in response to 48 h OHT in the presence of TopBP1ER (Fig. 3, a–c; and Fig. S4 c), suggesting that TopBP1ER translocation to the nucleus was sufficient for ATR activation. Consistently, p-Res also increased upon addition of OHT, confirming the activation of ATR (Fig. S4 b). TopBP1 is also known to participate in the regulation of DNA replication (Kumagai et al., 2010; Mäkiniemi et al., 2001). Hence, in order to check that the increased γH2AX signal was specifically induced by ATR activation and not by any perturbation produced during DNA replication by TopBP1ER, we performed comet assays to detect actual physical DNA breaks. We did not detect any increase in DNA fragmentation 48 h after OHT treatment, as measured by comet tail length (Fig. 3 d), demonstrating that γH2AX signal upon TopBP1ER was produced by ATR activation and not by increased DNA damage.
Figure S4.
Gain or loss of ATR activity affects terminal keratinocyte differentiation. (a and b) Expression of estrogen receptor (ER, red, a) or p-Res (red, b) in keratinocytes infected with control vector pMXPIE (CT) or with the TopB1PER construct, 48 h in the absence or presence of OHT. (c) γH2AX expression in keratinocytes as in a, by FC (+, positive keratinocytes according to negative isotype antibody control). (d) Phase contrast images of cells in a after 4 d in the presence of OHT, as indicated. (e) Phase contrast images of keratinocytes 4 d after infection with specific shATR or with the corresponding control vector plKO.1 (CT). (f) Light scatter parameters of keratinocytes 4 d after infection with shATR or with CT. Red box gates cells with HS typical of terminal differentiation. Scale bar, 50 µm. This figure complements Fig. 3 and Fig. 4. FSC, forward scatter; SSC, side scatter.
Figure 3.
Activation of ATR itself promotes squamous differentiation in human keratinocytes. (a) IF for γH2AX (red) in primary cells expressing TopBP1ER, after 48 h in the absence or presence of OHT, as indicated. Nuclear DNA by DAPI. Scale bar, 50 µm. (b) Immunodetection of TopBP1ER by an anti-estrogen receptor antibody (ER) or γH2AX by WB in keratinocytes expressing control pMXPIE empty vector (CT) or TopBP1ER, OHT as indicated. GAPDH as loading control. A DOXO 24-h treatment was used as positive control in b–d. (c) Percentage of keratinocytes positive for γH2AX relative to CT + OHT (100%), as determined by FC. OHT as indicated. (d) Quantitation of DNA breaks by comet tail lengths, in pixels, of keratinocytes infected with CT or TopBP1ER, OHT treatment as in a. Plot: Black small bars indicate the tail average length, n = 168 cells of eight fields per slide. Photos: Representative average comets for each treatment. (e) Representative FC for Inv expression in cells infected with CT or TopBP1ER, after 4 d OHT. Positive (+) keratinocytes according to negative isotype antibody control (red broken line). (f) Percentage of keratinocytes in e displaying HS typical of differentiation or Inv expression, relative to CT + OHT. (g) Clonogenicity assays of keratinocytes infected with CT or TopBP1ER vectors and released after 4 d in OHT. Representative images of triplicate samples of representative experiments. (h) Percentage of large proliferative colonies in g, relative to CT + OHT. Data are mean ± SEM of duplicate (c and d) or triplicate (f and h) samples. See also Fig. S4. Datasets were compared by an unpaired t test (two-sided). *, P < 0.05; **, P < 0.01.
Interestingly, ATR activation by TopBP1ER induced a significant 60% of the expression of the squamous differentiation marker Inv (Fig. 3, e and f; see Materials and methods). In agreement with the activation of a differentiation response, the proportion of keratinocytes that increased in size and complexity rose 100% as measured by light scatter parameters (Fig. 3 f and Fig. S4 d). Almost complete loss of clonogenic capacity after addition of OHT for 4 d demonstrated that ATR irreversibly induced post-mitotic terminal differentiation (Fig. 3, g and h). Taken together, the results show that ATR signaling was sufficient for the activation of the squamous differentiation program of keratinocytes, even in a manner independent of actual DNA damage.
ATR silencing leads to DNA damage accumulation and squamous differentiation
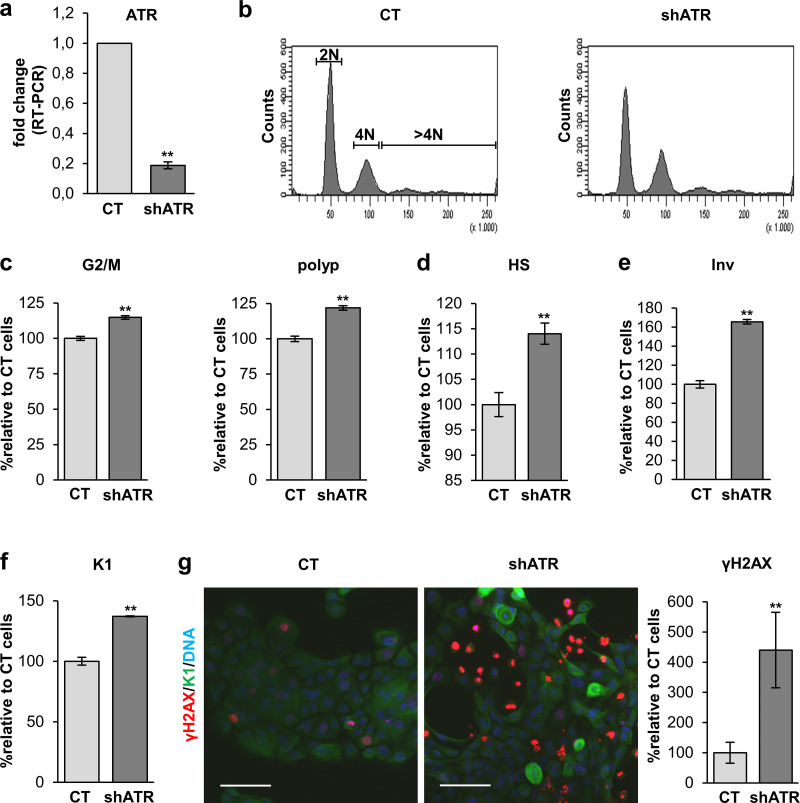
Once we observed that gain of ATR function triggers keratinocyte differentiation, we aimed to achieve the opposite, loss of function, to see whether inhibition of the endogenous pathway would inhibit differentiation. Therefore, we infected primary keratinocytes with a lentiviral construct carrying a specific shRNA against ATR (shATR). We confirmed that ATR expression was efficiently silenced 4 d after infection (Fig. 4 a). Unexpectedly, ATR silencing inhibited proliferation (Fig. S4 e) and increased the percentage of cells blocked at G2/M or entering the polyploid compartment of the cell cycle (Fig. 4, b and c). In agreement with the activation of terminal differentiation, we detected an increase in the percentage of cells displaying high scatter parameters (HS; Fig. 4 d and Fig. S4 f) or expressing Inv (Fig. 4 e) or the postmitotic differentiation marker keratin K1 (K1; Fig. 4, f and g). Also unexpectedly, ATR depletion brought about as a consequence a striking increase in γH2AX signal (Fig. 4 g). Contrary to our expectations, the silencing ATR caused up-regulation of γH2AX and activated the squamous differentiation response of keratinocytes. These results further support a direct relationship between the DDR and terminal differentiation. However, they also suggest that this relationship is not ATR-specific. ATM or DNA-PK might compensate for the loss of ATR. An initial defect in the DDR caused by the inhibition of ATR might impair DNA repair and as a consequence induce ATM and/or DNA-PK.
Figure 4.
ATR silencing triggers squamous differentiation of human keratinocytes. (a) Detection of ATR expression in cells infected with shATR or the empty control vector pLKO1 (CT), by quantitative real-time (RT) PCR, relative to CT. (b) DNA content profile of cells 4 d after infection with the indicated vectors, as analyzed by FC. (c) Percentage of cells in G2/M (4N) or the polyploid (>4N) compartment of the cell cycle, relative to CT. (d) Percentage of cells with HS values relative to CT by FC. (e and f) Percentage of cells positive for Inv (e) or K1 (f) 5 or 4 d after infection with shATR or CT, respectively, as analyzed by FC and relative to CT. (g) Double IF for K1 (green) and γH2AX (red), 4 d after infection with shATR or CT as indicated. Bar histogram displays the percentage of keratinocytes positive for γH2AX as quantitated by IF, relative to CT. Nuclear DNA by DAPI. Scale bar, 50 µm. Data are mean ± SEM of duplicate (e–g) or triplicate (a, c, and d) samples. Datasets were compared by an unpaired t test (two-sided). **, P < 0.01. See also Fig. S4.
Inhibition of the DDR impairs squamous differentiation of primary keratinocytes
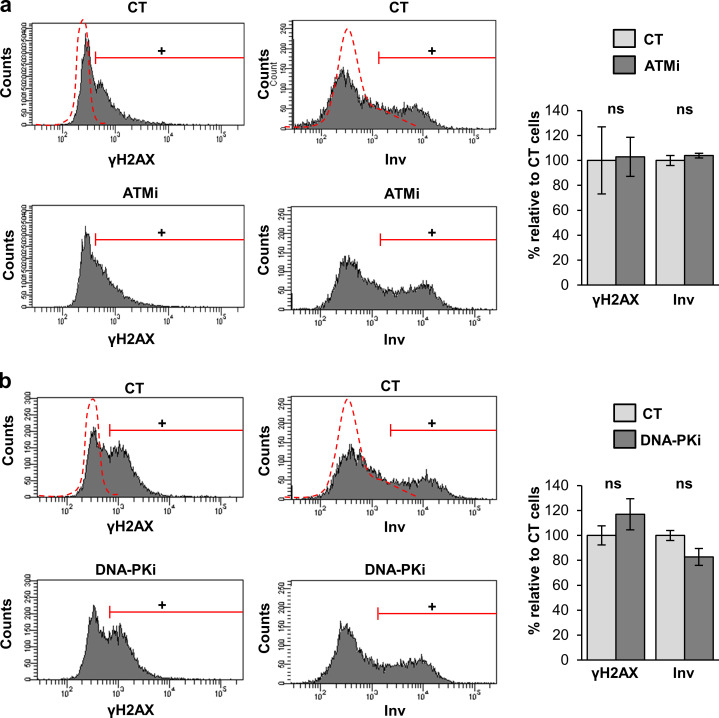
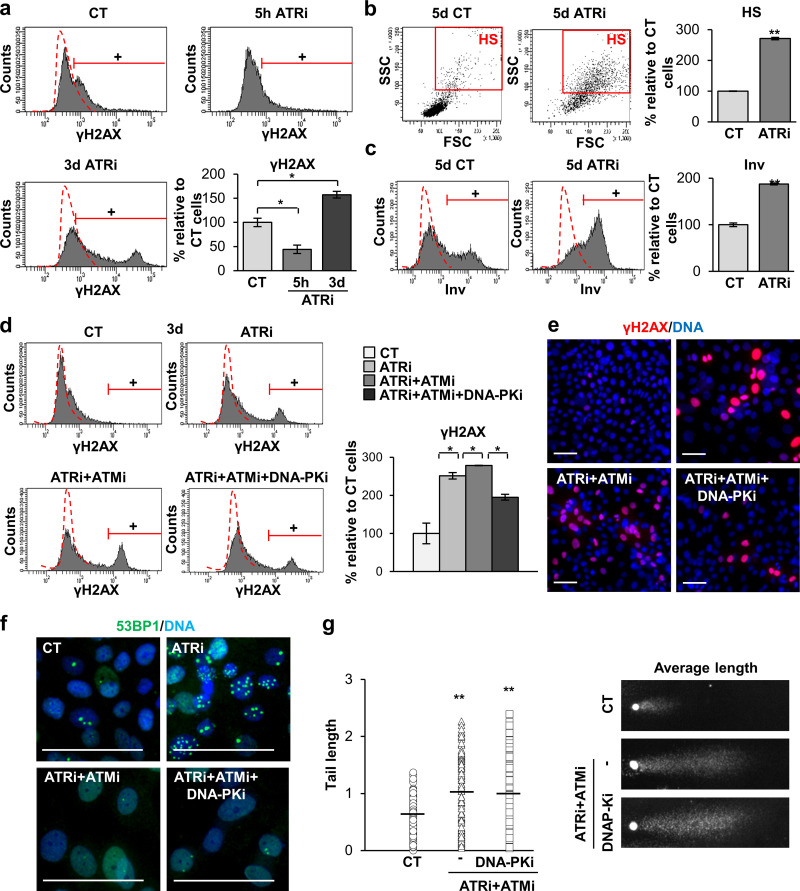
Although ATR, ATM, and DNA-PK respond primarily to different types of DNA damage, they might cooperate actively in the phosphorylation of common substrates and in the activation of the DDR (Lopez-Contreras and Fernandez-Capetillo, 2012). Therefore, we aimed to inhibit ATR, ATM, and DNA-PK simultaneously. Given the difficulty to perform triple lentiviral infections with shRNA against each of these proteins, we made use of commercially available chemical inhibitors. The inhibition of ATM or DNA-PK had no effect individually on γH2AX signal (Fig. S5, a and b) or the differentiation response of keratinocytes (Fig. S5, a and b). By 3 d upon inhibition of ATR (ATRi) with a well-established chemical inhibitor, there was a striking increase in γH2AX (Fig. 5 a). A 3-d ATRi treatment strikingly induced irreversible terminal differentiation 48 h later (day 5), as detected by the increase in the percentage of cells displaying HS (Fig. 5 b) or expressing Inv (Fig. 5 c). This was in agreement with the results above after silencing ATR by use of specific shRNA (Fig. 4). However, a 5-h short treatment with the ATR inhibitor decreased the γH2AX signal in keratinocytes (Fig. 5 a). While 5 h is too short a time to measure differentiation, these results further suggest that the loss of ATR function was being compensated for by another pathway.
Figure S5.
Inhibition of ATM or DNA-PK individually neither induces γH2AX nor affects terminal differentiation in human keratinocytes. Expression of γH2AX (left) or Inv (right) in keratinocytes treated with (a) ATMi or (b) DNA-PKi for 3 or 5 d (γH2AX or Inv, respectively), as measured by FC (+, positive keratinocytes according to negative isotype antibody control: red broken line). DMSO vehicle was used as control (CT). Bar histograms represent the corresponding percentage of keratinocytes expressing γH2AX or Inv relative to CT accordingly to the red gates, as indicated. Data are mean ± SEM of triplicate samples. ns: no statistically significant differences. This figure complements Fig. 5 and Fig. 6.
Figure 5.
Inhibition of the three DDR kinases impairs γH2AX signaling and causes accumulation of DNA damage in human keratinocytes. (a) Detection of γH2AX signal in cells treated with the DMSO vehicle as control (CT) or with ATRi for 5 h or 3 d as indicated, as measured by FC (+, positive cells according to negative isotype antibody control: red broken line). Bar histogram represents the percentage of keratinocytes positive for γH2AX relative to CT. (b) Light scatter parameters of cells treated for 5 d, as indicated. Red box gates HS, quantitated in the bar histogram, relative to CT. (c) Expression of Inv in cells treated for 5 d, as indicated, by FC (+, positive cells as in a, quantitated in the bar histogram, relative to CT). (d) Detection of γH2AX signal in keratinocytes treated with DMSO as indicated (CT), ATRi, ATRi + ATMi, or ATRi + ATMi + DNA-PKi for 3 d, analyzed by FC (+, positive cells as in a, quantitated in the bar histogram, relative to CT). (e) Detection of γH2AX (red) by IF. Scale bar, 50 µm. (f) Detection of 53BP1 (green) by IF in cells treated as in a. Scale bar, 25 µm. Nuclear DNA by DAPI. (g) Left: Quantification of comet tail lengths, in pixels, n = 145 cells of seven fields per slide of keratinocytes treated for 5 d as indicated. Horizontal bars indicate tail length average. Right: Representative average nuclear comets. Data are mean ± SEM of duplicate (b–d and g) or triplicate (a) samples. Datasets were compared by an unpaired t test (two-sided). *, P < 0.05; **, P < 0.01. Scale bar, 50 µm. See also Fig. S5. FSC, forward scatter; SSC, side scatter.
Aiming to identify the pathway compensating for ATR inhibition, we treated keratinocytes simultaneously with ATRi and an ATM inhibitor (ATMi). However, in this case, the γH2AX signal further increased (Fig. 5, d and e). Remarkably, the γH2AX signal decreased when we added a DNA-PK inhibitor (DNA-PKi) to the mix with respect to the effect upon the double inhibition of ATR/ATM (Fig. 5, d and e). Interestingly, the triple inhibition or the double inhibition of ATR/ATM, but not the single inhibition of ATR, impaired the γH2AX signal in metaphasic chromosomes, at the point of the cell cycle at which this signal peaks (Fig. S1 a), suggesting that ATM/ATR are responsible for the metaphase phosphorylation of H2AX. It was previously suggested that ATM is responsible for mitotic activation of H2AX in a variety of cell lines (McManus and Hendzel, 2005). In addition, ATRi induced the formation of 53BP1 foci, whereas ATRi + ATMi impaired it (Fig. 5 f). This effect can be explained by the fact that 53BP1 recruitment to DNA lesions is also dependent on ATM kinase activity (Lee et al., 2009; Schmidt et al., 2014) and might explain the defect in DNA repair, accumulation of unrepaired DNA damage, and subsequent increase of γH2AX. Adding DNA-PKi to the mix did not cause any effect in the capability of 53BP1 to form foci (Fig. 5 f). We confirmed that the partial loss of γH2AX upon the triple inhibition was specifically produced by the inhibition of the DDR and not by an increase in DNA repair, since the levels of DNA fragmentation detected by the comet assay remained high and unchanged with respect to the double inhibition of ATR and ATM (Fig. 5 g). Why a significant γH2AX signal was maintained in spite of the triple inhibition might be explained by an incomplete inhibition of the kinase(s) or by a still unknown additional kinase. Nevertheless, the results indicate that inhibition of ATR, ATM, and DNA-PK simultaneously in keratinocytes attenuated the DDR-associated γH2AX signal.
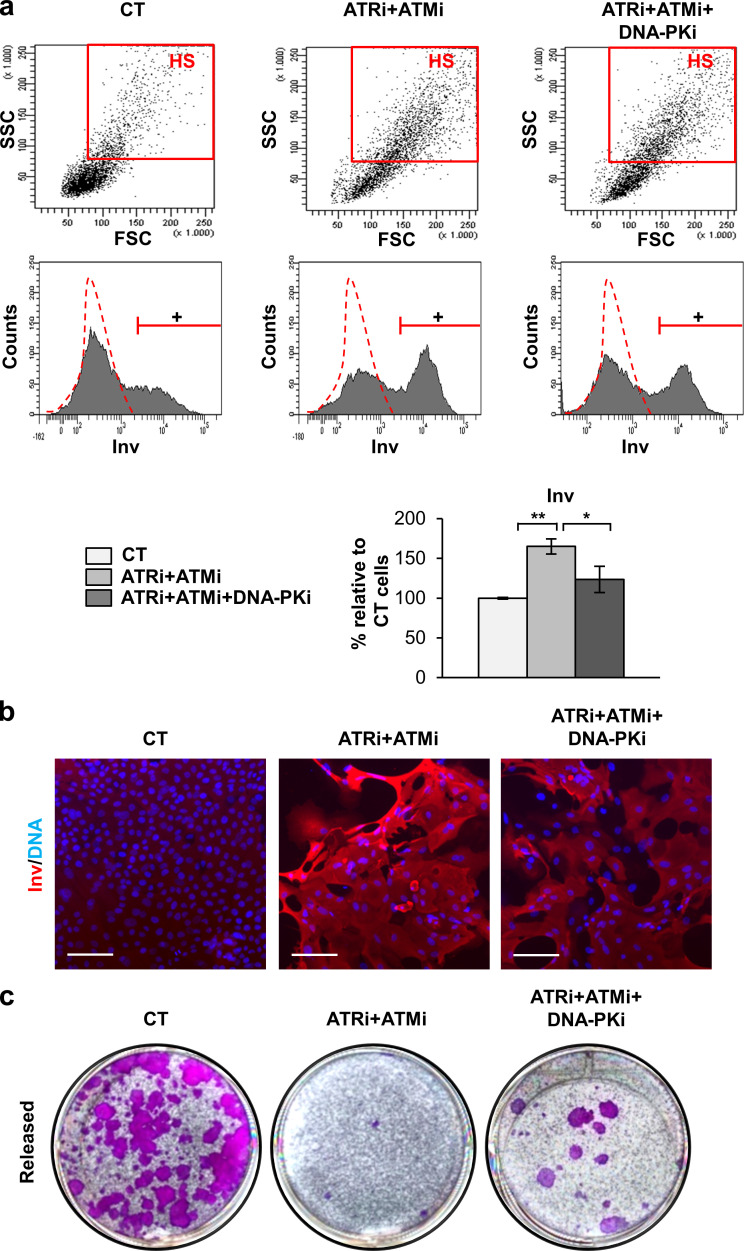
Next, we examined the effect of inhibiting the DDR on the squamous differentiation response. Inhibition of ATR and ATM separately or together induced a striking increase in the percentage of keratinocytes displaying HS (Fig. 6 a) or expressing Inv (Fig. 6, a and b). Of note, although simultaneous inhibition of ATR, ATM, and DNA-PK did not display any effect on light scatter parameters (Fig. 6 a), it decreased the percentage of cells expressing Inv (Fig. 6, a and b). In addition, clonogenicity assays showed that while ATR and ATM inhibition drastically abolished the colony-forming potential of keratinocytes, it was partially rescued by the inhibition of DNA-PK (Fig. 6 c). Although the inhibition of terminal differentiation was not complete, it was proportional to the inhibition of the γH2AX signal. Taken together, the results consistently showed a proportional relationship between the γH2AX signaling and the differentiation response of keratinocytes. It must also be noted that the increase of the serum concentration in the culture medium caused a paradoxical reduction in the clonogenic capacity of keratinocytes that was in agreement with the increase in γH2AX (Fig. S3 b).
Figure 6.
Inhibition of the three DDR kinases attenuates the squamous differentiation response. (a) Dot plots show light scatter parameters of cells 5 d after treatment with DMSO as control (CT), ATRi + ATMi, or ATRi + ATMi + DNA-PKi, as indicated, analyzed by FC. Red box: Cells displaying HS. Cell count histograms (middle lane) show the expression of Inv of cells treated for 5 d as indicated, by FC (+, positive keratinocytes according to negative isotype antibody control: red broken line). Bar histograms represent the percentage of keratinocytes expressing Inv relative to CT. Data are mean ± SEM of triplicate samples. Datasets were compared by an unpaired t test (two-sided). *, P < 0.05; **, P < 0.01. (b) Detection of Inv (red) in keratinocytes treated for 5 d as indicated, by IF. Nuclear DNA by DAPI. Scale bar, 50 µm. (c) Clonogenicity assays of keratinocytes released after 5 d of treatments as indicated. Figure shows representative images of duplicate samples. See also Fig. S5. FSC, forward scatter; SSC, side scatter.
Suppression of H2AX impairs squamous differentiation and induces an epidermal-to-mesenchymal transition
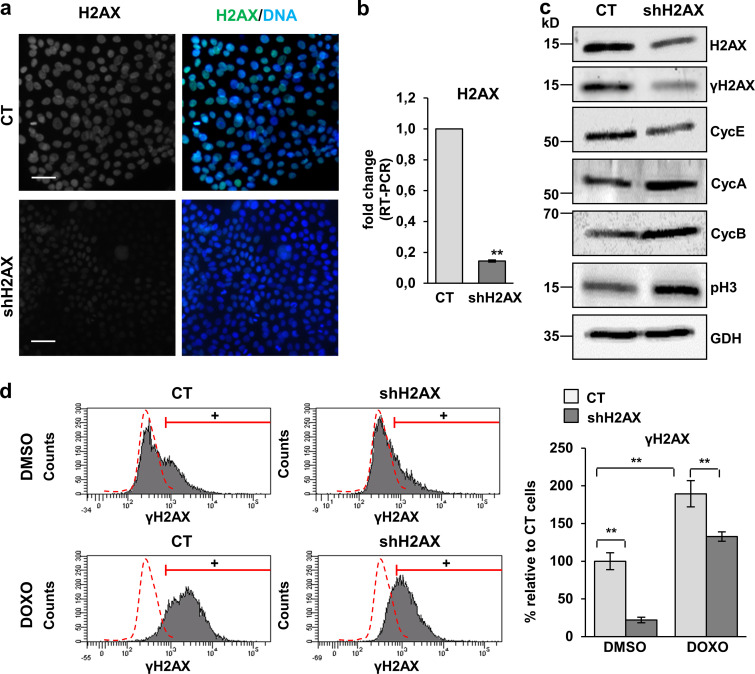
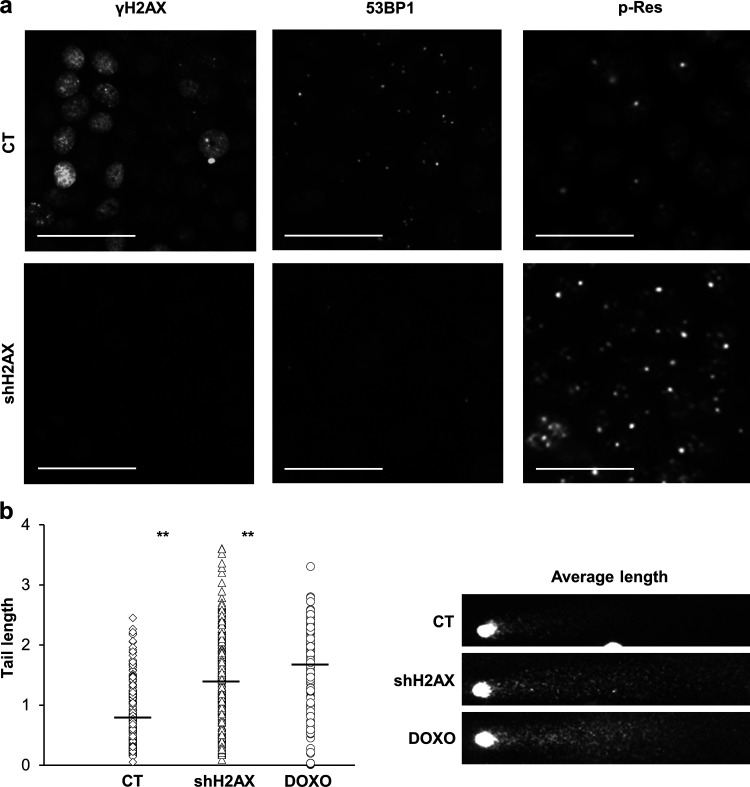
The three DDR pathways ATR, ATM, and DNA-PK converge on the phosphorylation of H2AX, and we found a direct correlation between the γH2AX signal and squamous differentiation. Therefore, it was tempting to inhibit H2AX altogether. We silenced the expression of H2AX by infecting keratinocytes with a lentiviral construct carrying a specific shRNA (shH2AX). Infection with the construct significantly (not completely) suppressed the expression of total H2AX (Fig. 7, a–c) and inhibited the γH2AX signal even when global DNA damage was induced by DOXO (Fig. 7 d), although the inhibition was not complete. The mitotic γH2AX signal was also suppressed (not shown) upon shH2AX, indicating the specificity of the labeling. In agreement with the role of γH2AX in the recruitment of repair factors (Ward et al., 2003), H2AX silencing significantly impaired the formation of 53BP1 foci (Fig. 8 a). In addition, higher levels of DNA fragmentation were detected by comet assay in cells lacking H2AX (Fig. 8 b), likely due to inefficient DNA repair. Similarly, H2AX silencing significantly induced ATM and/or ATR substrate phosphorylation (Fig. 8 a). Therefore, and as expected, H2AX silencing brought about an accumulation of DNA damage.
Figure 7.
Silencing of H2AX in human keratinocytes induces proliferative markers. (a and b) Loss of expression of total H2AX in primary keratinocytes infected with an shRNA against H2AX (shH2AX) or with the corresponding empty control vector pLKO1 (CT), by IF (a) or by real-time (RT) PCR (b, fold change with respect to control empty vector, CT). Data are mean ± SEM of triplicate samples. **, P < 0.01. (c) Detection of total H2AX, γH2AX, cyclin E (CycE), cyclin A (CycA), cyclin B (CycB), and p-histone H3 (p-H3) by WB in cellular protein fractions of shH2AX or CT cells, GAPDH (GDH) as loading control. (d) Expression of γH2AX in CT or shH2AX keratinocytes treated for 48 h with DMSO (top) or DOXO (bottom), as analyzed by FC (+, positive keratinocytes according to negative isotype antibody control: red broken line). Bar histogram displays the percentage of keratinocytes positive for γH2AX relative to CT. Data are mean ± SEM of duplicate (d) or triplicate (b) samples. Datasets were analyzed by an unpaired t test (two-sided). **, P < 0.01. Scale bar, 50 µm. Nuclear DNA by DAPI. RT-PCR, real-time PCR.
Figure 8.
Silencing of H2AX in human keratinocytes inhibits 53BP1 localization and causes DNA breaks. (a) Expression of γH2AX, 53BP1 or p-Res in CT or shH2AX expressing cells, (b) Quantitation of DNA comet tail lengths, in pixels, of CT or shH2AX expressing cells, n = 275 cells of 10 fields per slide. Treatment with DOXO was used as a severe DNA fragmentation control. Black small bars indicate the tail length average in each case. Photographs show representative comet average length for each condition. Data are mean ± SEM of duplicate (b) samples. Datasets were compared by an unpaired t test (two-sided). **, P < 0.01. Scale bar, 50 µm. Nuclear DNA by DAPI.
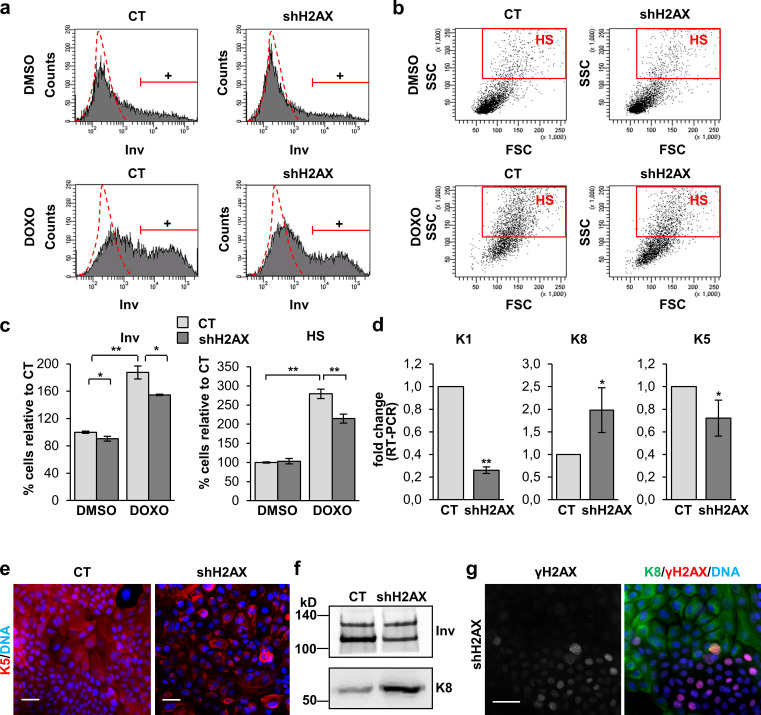
Epidermal keratinocytes are known to differentiate from a mitotic arrest induced by DNA damage (Freije et al., 2012, 2014; Molinuevo et al., 2017). H2AX depletion decreased the expression of the S phase regulator cyclin E and induced the expression of mitotic cyclin A and cyclin B (Fig. 7 c). In addition, it increased the expression of the metaphasic marker histone phospho-H3 (Fig. 7 c). When we examined the effect of H2AX silencing in the squamous differentiation response, we found a decrease in the expression of Inv and K1 (Fig. 9, a–d). H2AX silencing strikingly diminished the percentage of cells displaying HS or expressing Inv after treatment with DOXO (Fig. 9, a–c). Taken together, the results showed that H2AX depletion inhibits keratinocyte squamous differentiation.
Figure 9.
Inhibition of the γH2AX signaling in human keratinocytes inhibits squamous differentiation and the squamous phenotype. (a) Expression of Inv in CT or shH2AX cells treated for 48 h with DMSO or DOXO, by FC (+, positive keratinocytes according to negative isotype antibody control: red broken line). (b) Light scatter parameters of CT or shH2AX keratinocytes treated for 48 h with DMSO or DOXO, by FC. Red box represents cells displaying HS. (c) Percentage of keratinocytes expressing Inv (left) or displaying HS (right) relative to CT keratinocytes. (d) Expression of K1, K8, and K5 in CT or shH2AX keratinocytes, by real-time (RT) PCR (fold change with respect to CT). (e) Expression of K5 (red) in CT or shH2AX keratinocytes, by IF. (f) Expression of Inv and K8 in CT or shH2AX keratinocytes by WB in insoluble protein fractions of cells in a (same number of cells loaded per lane), by IF. (g) Expression of K8 (green) and γH2AX (red) in unselected shH2AX keratinocytes after infections with CT or shH2AX vectors, by IF. Note that expression of K8 in the colonies is excluding with γH2AX. Nuclear DNA in blue by DAPI. Data are mean ± SEM of duplicate (c) or triplicate (d) samples. Datasets were compared by an unpaired t test (two-sided). *, P < 0.05; **, P < 0.01. Scale bar, 50 µm. FSC, forward scatter; SSC, side scatter.
Loss of H2AX not only inhibited keratinocyte terminal differentiation. We also observed loss of the epidermoid markers. We detected an increase in the expression of simple epithelial keratin K8 (K8; Fig. 9, d and f) and a decrease of epidermal keratin K5 (K5; Fig. 9, d and e). Of note, in antibiotic unselected cultures transduced with shH2AX, the expression of K8 was specifically detected in colonies negative for γH2AX signaling and vice versa (Fig. 9 g). K8 is marker of simple epithelia and is expressed in the skin only in epidermoid carcinoma (Caulín et al., 1993; Tiwari et al., 2017).
DNA damage signaling is detected in the epidermis in situ
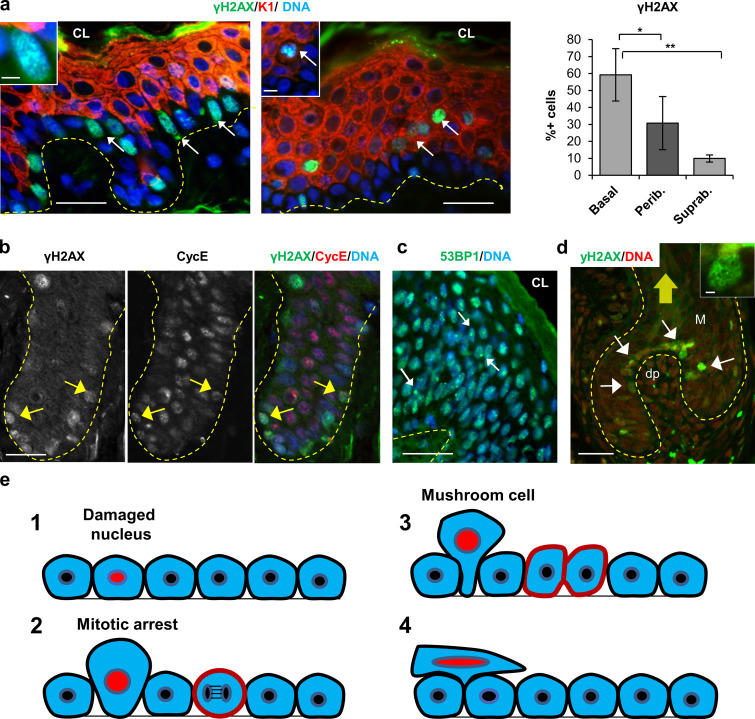
Keratinocytes growing in vitro are stimulated by growth factors driving the cell cycle, and this might cause a higher rate of RS. If the DDR plays a role in normal epidermal homeostasis, then γH2AX should accumulate in cells that proliferate actively in situ. We immunostained human neonatal foreskin and adult facial and back skin for γH2AX. Positive cells for γH2AX signaling were found in basal and peribasal cells, often in patches. These patches were found in the basal layer (Fig. 10 a, left panel) or in the first differentiating suprabasal layers expressing the differentiation marker K1 (Fig. 10 a, right panel). As described above, maximum γH2AX signal is detected during mitosis (McManus and Hendzel, 2005), and we found a strong γH2AX signal in peribasal metaphasic keratinocytes expressing K1 (Fig. 10 a, inset in right panel). Expression of K1 is incompatible with cell division (Kartasova et al., 1992). As observed in vitro, γH2AX was scarcely detected in suprabasal layers (Fig. 10 a). Deregulation of S phase cyclin E causes RS and accumulates in suprabasal layers of the epidermis (Freije et al., 2012; Zanet et al., 2010). It is interesting that cells within the proliferative basal layer accumulating cyclin E also accumulate γH2AX (arrows in Fig. 10 b). In contrast, 53BP1 NBs are detectable in suprabasal layers (Fig. 10 c). Therefore, the results indicate that strong γH2AX in the epidermis, as observed in vitro, takes place at the boundary between proliferation and differentiation. Of note, strong γH2AX are also detected in the highly proliferative germinal matrix of the hair follicle (Fig. 10 d).
Figure 10.
DNA damage signaling is detected in the squamous epithelia of normal skin. (a) Double IF for γH2AX (green) and K1 (red). Note that γH2AX is usually detected in patches of basal proliferative cells (left panel, arrows) or stratifying differentiating cells (right panel; arrows). γH2AX is also detected in mushroom peribasal cells detaching from the basal layer, expressing K1 (inset in right panel). Amplified inset in left panel shows γH2AX foci. Bar histogram shows the percentage of γH2AX-positive cells in basal, peribasal (Perib.), or suprabasal (Suprab.) layers. (b) Double IF for γH2AX (green) and cyclin E (CycE; red), separate channels and merge as indicated. Arrows point at basal cells strong for γH2AX. (c) IF for 53BP1 (green). 53BP1 bodies are evident in peribasal and suprabasal layers. (d) Detection of γH2AX in the hair follicle germinal matrix (arrows) where keratinocytes are hyperproliferative (DAPI in red). White arrows indicate strong γH2AX cells; yellow arrow indicates the direction of the hair shaft where differentiating cells are incorporated to the hair. Broken lines indicate basement membrane. CL, cornified layer; Dp, dermal papilla; M, matrix. Scale bar, 20 µm; inset scale bar, 3 µm. Nuclear DNA by DAPI (blue). In d, DAPI was made red for better visualizing; γH2AX in green. Quantifications in a are mean ± SEM of 100–160 cells from three fields per each section of three different individuals. Datasets were compared by an unpaired t test (two-sided). *, P < 0.05; **, P < 0.01. Scale bar, 50 µm; inset scale bar, 6 µm, left panel, and 5 µm, right panel. (e) Model for automatic cleansing of squamous epithelia. Basal cells in the epidermis are tightly packed and diving cells have no space. DNA-damaged cells due to active proliferation and RS as a DDR (1), block in mitosis by checkpoints and become larger due to prolonged mitotic arrest and (2) due to lateral forces by more adherent neighbor cells when a new cell division occurs even at a distant spot, are pushed (mushroom cell; Régnier et al., 1986) and spilled into suprabasal layers (stratification; 3). For every stratifying cell (4), one cell will be shed from the surface of the epidermis, thus maintaining self-renewal homeostasis (see also Video 1).
Discussion
Continuous self-renewal involves continuous cell multiplication and requires robust mechanisms to maintain the balance between proliferation and differentiation. We uncover a keratinocyte regulation that automatically and cell-autonomously links proliferation with differentiation via RS.
ATR, ATM, and DNA-PK initiate the DDR by triggering a complex signaling cascade with a degree of overlapping (Blackford and Jackson, 2017). We have demonstrated the involvement of the DDR pathway in keratinocyte differentiation by gain and by loss of function: first, by over-activating ATR by overexpression of TopBP1; second, by inhibiting ATR by shRNA; and third, by combinations of inhibitors of either two or the three kinases. The early inhibition but later up-regulation of γH2AX upon suppression of ATR function showed that other kinases were compensating for the loss of function. This was further confirmed as suppression of the three pathways resulted in attenuation of the DNA damage signal and also terminal differentiation.
The implications of these findings are important. We have previously demonstrated that oncogenic or UV irradiation–induced DNA damage or induction of a mitosis block triggers squamous differentiation in keratinocytes of the skin and head and neck in vitro and in vivo (de Pedro et al., 2018; Sanz-Gómez et al., 2018). This response is controlled by mitosis checkpoints and might act as an anti-oncogenic self-protective mechanism (Gandarillas, 2012). The results presented here show that the keratinocyte DDR not only induces differentiation in response to genotoxic or oncogenic damage but also establishes a natural homeostatic link between proliferation and differentiation. This would explain why actively proliferative keratinocytes are committed to terminal differentiation (Watt et al., 2006). For instance, our analyses with increasing serum concentrations show that hyperplastic stimuli result in a loss of clonogenic potential. This resembles physiological squamous hyperplasia, consistently involving expansion of the differentiated layers. This might explain the mechanisms by which cell growth results in differentiation in developing tissues.
It is interesting that we detected ATR/ATM-phosphorylated residues in the keratinocyte centrosomes. Kinases that are essential for mitosis such as Polo-like kinase 1 or Aurora B kinase have been reported to have a function in the centrosome (Conduit et al., 2015). ATR and ATM also localize to the centrosome and might inhibit centrosomal disassembly (Smith et al., 2009; Zhang et al., 2007). Thus, the DDR upon RS might control post-mitotic keratinocyte differentiation not only via the control of cyclin B–dependent Cdk1 but also by directly impairing the centrosome separation required for mitosis.
ATR, ATM, and DNA-PK pathways converge on the phosphorylation of γH2AX. Of note, γH2AX was required for a normal ratio of squamous differentiation. It is therefore possible to propose that the signal resulting from unrepaired DNA damage upon a certain threshold due to RS induces terminal differentiation. In addition, by confocal microscopy, we previously found that strongly positive γH2AX keratinocytes in vitro stratify into the differentiated layers (Freije et al., 2014). Moreover, inhibition of the endogenous DNA repair Poly (ADP-ribose) polymerase in primary keratinocytes enhanced stratification and differentiation, further supporting a role for continuous RS-induced DNA damage in differentiation. Although in our study there was still some degree of differentiation after suppressing H2AX, it might be due to an alternative signal that senses unrepaired DNA damage or to the detectable H2AX still remaining upon the shRNA. Nevertheless, terminal differentiation was systematically proportional to the level of γH2AX. Even more strikingly, the γH2AX signal was sufficient per se to modulate differentiation. Neither the over-activation of ATR nor the inhibition of the three pathways caused real DNA damage in the time frame of the assays, yet they increased or decreased the differentiation outcome, respectively. These findings indicate that it is the DDR signal, rather than actual DNA damage, that drives terminal differentiation. Although the inhibition of the three pathways only attenuated the γH2AX signal and the differentiation response, the result is exciting because it shows that the endogenous DDR signals control differentiation. The imbalance of the DDR signals either positively or negatively seems to result in terminal differentiation, what is possibly a robust self-defense mechanism of a self-renewal tissue continuously exposed to mutagens.
Finally, suppression of H2AX not only diminished the ratio of terminal differentiation but also induced expression of the simple epithelial marker K8 and the mesenchymal marker vimentin. These are changes typical of an epithelial-to-mesenchymal transition (EMT) and suggest that the γH2AX signal is part of the squamous phenotype. It is interesting that we have found loss of the γH2AX signal in aggressive metastatic skin carcinomas (Alonso-Lecue et al., 2017) and that skin carcinogenesis involves an EMT that induces the expression of simple epithelial markers such as K8 (Moll et al., 2008). Interestingly, the inactivation of H2AX has also been shown to induce EMT in a colon cancer cell line (Weyemi et al., 2016). It is also interesting that we found a strong γH2AX signal in metaphase. The role of γH2AX in mitosis is unclear and has been scarcely studied. However, it has been proposed to have an ATM-dependent role in chromosome segregation (McManus and Hendzel, 2005). We also show evidence that mitotic γH2AX might be induced by ATM and found a significant signal of residues phosphorylated by ATR/ATM in the centrosomes. Since, as already discussed, squamous differentiation is controlled by mitotic checkpoints, ATR/ATM might control squamous differentiation by parallel mechanisms: by triggering the mitotic checkpoints due to DNA damage and by controlling chromosome segregation.
The homeostatic control of squamous differentiation by unrepaired DNA damage points at an automatic mechanism for linking rapid proliferation with differentiation and cleansing squamous self-renewal epithelia of mutational burden. Cells bearing irreparable DNA damaged might undergo DDR-induced mitotic block due to the mitotic checkpoints. These mitotically arrested cells become larger, round up, and lose adherence to the basement membrane. By lack of space, these larger cells would be squished and pushed by neighbor more adherent proliferative cells at their base, and the pressure would make them stratify (Fig. 10 e). Stratifying cells in turn push other suprabasal cells upwards as a domino effect, resulting in final cell shedding from the surface of the skin (Video 1). Squished cells might acquire the appearance of a mushroom cell (Fig. 10 e). These cells were previously described in the epidermis to start expressing post-mitotic differentiation keratins in the basal layer (Régnier et al., 1986), and their nature is not well understood. Interestingly, we found that mushroom cells accumulate mitotic markers such as cyclin A or cyclin B (Zanet et al., 2010), further suggesting a natural link between mitosis arrest and differentiation. It is also noteworthy that lack of essential mitotic kinases Aurora B kinase or Polo-like kinase 1 in vivo produces a fully differentiated squamous epithelia (Sanz-Gómez et al., 2020a). The frequent presence of 53BP1 NBs in differentiating cells in vitro and in situ supports the notion that irreparable damage leads to differentiation. 53BP1 NBs are considered areas of the genome-containing lesions that were not repaired, were transmitted through mitosis, and must be under-transcribed (Fernandez-Vidal et al., 2017; Lukas et al., 2011; Mata-Garrido et al., 2016; Vancurova et al., 2019).
Video 1.
Model for automatic cleansing of stratified squamous epithelia. Basal proliferative cells harboring an irreparable mutational burden (red nuclei; damaged nucleus), due to the induction of the mitotic checkpoints by the DDR, block mitosis (G2/M arrest). Basal cells are tightly packed within the tissue. When cells spend a long time in G2/M for DNA repair, they increase in size, lose adherence, and are pushed by more adherent proliferative neighbor cells about to divide, giving the typical mushroom appearance previously described (Régnier et al., 1986). Dividing cells do not have to be next to the mitosis-blocked cell to push a mitotically arrested cell upwards due to transmission of lateral forces. When a basal cell stratifies into the peribasal layer, it pushes other suprabasal cells above so that on the surface of the skin, a cell is detached (shedding). This automatic cell-autonomous mechanism might suffice in a steady-state epidermis or even upon UV light–induced DNA damage, to maintain the balance of the tissue.
Another example of how the DNA damage differentiation response can control homeostasis is the hair follicle. The matrix of the follicle is more actively cycling than normal epidermis. It is unclear where rapid proliferation takes place within the matrix. Strong γH2AX suggests that cells multiply mostly just above the dermal papilla. It is tempting to speculate that RS drives hair cells into the hair by inducing terminal and differentiation stratification as in epidermal cells. Acute DNA damage by chemotherapeutics would drive terminal differentiation in the stem cells, subsequently causing hair loss. Given that we have found a differentiation response to oncogenic or genotoxic damage in head and neck squamous epithelial cells (Sanz-Gómez et al., 2018), we are tempted to propose a homeostatic role of the DNA damage differentiation response in all squamous epithelia. It is further exciting to speculate that the DNA-damaging sources squamous epithelia are exposed to, such as the UV light of the sun, are at the origin of the stratified epithelia that in turn protect the germinative cell pools.
By the automatic cell-autonomous mechanism proposed, the healthy squamous epithelium of the skin, oral cavity, throat, or esophagus would at the same time suppress proliferation of genetically altered cells and, due to the induction of terminal differentiation, maintain tissue homeostasis (Fig. 10 and Video 1). Mutations in the mitosis checkpoints would allow cells with high mutational burden in aged skin to bypass differentiation and give rise to squamous carcinomas. The challenge now is to identify the pathway and molecules that trigger squamous differentiation downstream of the DDR in stratified epithelia, the most frequent target of cancer.
Materials and methods
Cell culture, plasmids, and viral infections
Ethical permission for this study was requested, approved, and obtained from the Ethical Committee for Clinical Research of Cantabria Council, Spain. In all cases, human tissue material discarded after surgery was obtained with written consent presented by clinicians to the patients, and it was treated anonymously.
Primary keratinocytes were isolated from neonatal human foreskin and cultured in the presence of a mitomycin C (MC)–treated mouse fibroblast 3T3 J2 feeder layer in Rheinwald FAD medium (Ham’s F12 medium/DMEM [1:3], 1.8 × 10⁻⁴ M adenine) supplemented with 10% FBS and a cocktail of 0.5 µg/ml of hydrocortisone, 5 µg/ml of insulin, 10−10 M cholera enterotoxin, and 10 ng/ml of epidermal growth factor (1.2 mM Ca2+; Gandarillas and Watt, 1997; Rheinwald, 1989). J2 cells were treated with MC for 2 h to suppress proliferation. Cells were routinely tested for and free of mycoplasma contamination. Low passages (1–4) of four strains of keratinocytes were used.
For gene delivery in primary keratinocytes, the following constructs driven by constitutive promoters were used: (i) retroviral: pMXPIE-empty and pMXPIE-TopBP1ER (kind gift from O. Fernandez-Capetillo, CNIO, Madrid, Spain; Toledo et al., 2008), a TopBP1-activating domain fused to a mutant estrogen receptor that responds to OHT (Sigma-Aldrich); (ii) lentiviral: empty plKO.1 (Sigma-Aldrich, SHC001) and plK0.1 constructs coding for shRNA against ATR (Sigma-Aldrich, shATR, TRCN0000196538; 5′-CCGGGATGAACACATGGGATATTTACTCGAGTAAATATCCCATGTGTTCATCTTTTTTG-3′) or H2AX (Sigma-Aldrich, shH2AX, TRCN0000073281; 5′-CCGGCAACAAGAAGACGCGAATCATCTCGAGATGATTCGCGTCTTCTTGTTGTTTTTG-3′).
Retroviral production and infection of primary keratinocytes for delivery of pMXPIE and pMXPIE-TopBP1ER constructs were performed as follows (Gandarillas and Watt, 1997). The constructs were transfected by calcium phosphate precipitation into ecotropic packaging cells GP+E. 2 d later, 2 µg/ml puromycin was added for selection of vector-expressing cells. The supernatant was centrifuged to remove any cells, and after addition of 8 µg/ml polybrene, it was used to infect AM12 amphotrophic packaging cells. AM12 cells were grown to confluence and treated with MC for 2 h to suppress proliferation. MC-treated AM12 cells and keratinocytes were co-cultured in FAD medium. After 2 d, AM12 cells were removed by use of 250 mM EDTA and replaced with 3T3 J2 (mouse fibroblast feeder layer). 1 d later, 1 µg/ml puromycin (Sigma-Aldrich, P8833) was added for selection of vector expressing keratinocytes. Estrogen receptor fusion proteins are well known to leak, and TopBP1ER leaked without the inducer, OHT. The accumulation of the TopBP1 leak over 4–5 d causes TopBP1ER-expressing cells to be more differentiated without OHT than the empty vector control cells.
Lentiviral production and infection were performed as follows (extended protocols in Freije et al., 2020): a day before transfection, the HEK293T producer cells were plated at 5 × 10⁸ in 100-mm dishes. Transient transfection of HEK293T cells at 70% confluence of was performed with DNA solution: packaging plasmid (psPAX-2, 7.5 µg; Addgene, 12260), envelope vector (VSV-G, 2.5 µg; Addgene, 11653), and the target plasmid (10 µg) using jetPei (VWR, 101-01) as the transfection reagent solution. 24 h after transfection, the lentivirus-containing supernatant was collected. For plKO.1 and shH2AX, keratinocytes were infected in FAD medium. For infections with plKO.1 and shATR, keratinocytes were infected in low-calcium concentration medium (<0.1 mM Ca; keratinocyte media 2 [Promocell]; and defined keratinocyte serum-free medium [Invitrogen]).
Keratinocytes growing in FAD medium were treated with the following inhibitors, as indicated: ATR inhibitor (3 µM; Selleckchem, AZ20), ATM inhibitor (1 µM; Tocris, KU5593), and DNA-PKi (1 µM; Selleckchem, NU7441). For clonogenicity assays, 2,500 cells were plated per T6 well triplicates and cultured in FAD medium. ∼10 d later, the cultures were washed with cold 1× PBS and fixed with 3.7% formaldehyde (Sigma-Aldrich, F8775) for 10 min. Wells were washed with cold PBS and stained with rhodamine-Nile blue solution (1% Rhodamine B [Sigma-Aldrich, R6626]; 1% Nile Blue A [Sigma-Aldrich, N5632]) in distilled water. After staining, tissue wells or dishes were washed three times with distilled water (Jones and Watt, 1993).
Antibodies
The following primary antibodies from Santa Cruz Biotechnology were used: anti–cyclin A2 antibody (rabbit polyclonal, H-432, sc-751, lot F2410; IF and Western blotting [WB]), anti–cyclin B1 (mouse monoclonal, GNS1, sc-245, lot F0313; IF and WB), anti–cyclin E1 (mouse monoclonal, HE12, sc-247, lot H2511; IF and WB), anti-GAPDH (rabbit polyclonal, FL-335, sc-25778, lot E0212; WB), anti–pH3 Ser10 (rabbit polyclonal, sc-8656-R, lot I1415; WB), anti-Ki67 (rabbit polyclonal, C-20, sc-7844; IF), anti-H2AX (goat polyclonal, C-20, sc-54606; IF and WB), anti–estrogen receptor (rabbit polyclonal, MC-20, sc-542, lot K09409; IF and WB), and anti-K16 (mouse monoclonal, sc-53255, lot F2812; IF). The primary antibodies used from Sigma-Aldrich were anti-Inv (mouse monoclonal, SY5, I-9018, lot 071M4784; IF, FC, and WB), anti–γ-tubulin (mouse monoclonal, GTU-88, T6557; IF), anti-K5 (rabbit polyclonal, C-terminal, ESAB450165, lot 310246; IF), anti-IgG (mouse, I-5381; IF, FC, and WB), anti-IgG (rabbit, R9133; IF, FC, and WB), and anti-K8 (mouse monoclonal, M20, C5301; IF and WB). Other antibodies used were anti-γH2AX (mouse monoclonal, Millipore, JBW301, 05–636-I, lot 1997719; IF, FC, and WB), anti-K1 (rabbit polyclonal, Covance, Poly19052, lot 09KCO2022; IF and FC), anti-53BP1 (rabbit polyclonal, Bethyl, A300-272A; IF), anti–phospho-ATR and -ATM substrates (rabbit polyclonal, Cell Signaling Technology, 2851S, lot 7; IF), anti-CTCF (mouse monoclonal, BD Biosciences, 48, 612148; IF), and anti-BrdU (mouse monoclonal, Sigma-Aldrich, B8434).
The following secondary antibodies from Jackson ImmunoResearch were used: Alexa Fluor 488–conjugated goat polyclonal anti-rabbit (111–547-003) or anti-mouse (115–547-003) IgG antibodies (FC and IF); and Alexa Fluor 594–conjugated goat polyclonal anti-rabbit (111–517-003) or anti-mouse (115–517-003) IgG antibodies (IF). HRP-conjugated goat anti-rabbit (170–6515) or anti-mouse (170–6516) IgG antibodies from BioRad were used for WB.
FC
For FC, keratinocytes were harvested by trypsin, washed once with PBS, fixed, and stained with primary and secondary antibodies. For DNA synthesis analyses, keratinocytes were cultured in the presence of BrdU (10 µM, Sigma-Aldrich, B5002) for 1.5 h before harvest, washed twice, centrifuged, and fixed in cold 70% ethanol (Fluka, 02860). Cells were subsequently incubated with anti-BrdU for 1 h at RT, then washed twice with cold washing buffer (5% FBS, 0.5% Tween 20, Sigma-Aldrich, P1379, in PBS) and incubated with secondary antimouse Alexa Fluor 488 for 1 h at RT in the dark, washed twice. Cells were then stained with propidium iodide (PI, 25 µg/ml, Life Technologies, overnight; Gandarillas et al., 2000; Freije et al., 2014).
For Inv staining, cells were fixed in 3.7% paraformaldehyde (Sigma-Aldrich, 158127) for 10 min at RT, washed twice with cold washing buffer (Gandarillas et al., 2000), and permeabilized with cold 6% saponin (Sigma-Aldrich, S4521) PBS for 20 min at RT. Cells were then incubated 1 h at RT with anti-Inv (SY5) in cold PBS/saponin/fetal calf serum (PSF) buffer (0.2% saponin, 0.5% FBS in PBS), washed twice with cold PSF buffer, and incubated with the corresponding secondary anti-mouse Alexa Fluor 488 for 1 h at RT in the dark. After staining, cells were firmly resuspended and filtered through a 70-µM mesh to minimize the presence of aggregates and then analyzed on a Becton Dickinson FACSCanto cytometer. For each sample, 10,000 events were gated and acquired in list mode (Sanz-Gómez et al., 2020b).
For K1 or γH2AX staining, cells were washed and fixed in cold 70% ethanol (Merck), and immediately mixed with mild vortex agitation for 1 min. Cells were then incubated with anti-K1 and anti-γH2AX, respectively, for 1 h at RT and washed twice with cold washing buffer (0.5% FBS, Tween-20 in PBS) and incubated with the secondary anti-rabbit and anti-mouse Alexa Fluor 488 for 1 h at RT in the dark. After staining, cells were analyzed with the cytometer as above.
All antibody staining was controlled by the use of a similar concentration of isotype-negative Igs (mouse IgGs or rabbit serum).
IF on attached cells
For IF on attached cells, keratinocytes were grown on glass coverslips. For Inv detection, cells were fixed with 3.7% formaldehyde in PBS for 10 min and permeabilized with −20°C cold methanol for 5 min. For other proteins, cells were fixed with −20°C cold methanol for 10 min. After fixation, samples were washed twice with PBS and once with PBS 0.05% Tween 20. Cells were incubated 1 h with primary antibodies in a wet chamber at RT. Later, they were washed twice in PBS 0.05% Tween 20 and incubated with the corresponding secondary antibodies (anti-rabbit or anti-mouse IgG, Jackson ImmunoResearch) for 1 h at RT in the dark. Cells were then washed with PBS 0.05% Tween 20, and DAPI (0.2 µg/ml, Sigma-Aldrich, D9542) dye was added for nuclear DNA staining and incubated for 10 min at RT in the dark. Last, coverslips were mounted on slides with Prolong Gold Antifade Mountant Reagent (Life Technologies, P36934).
IF on paraffin-embedded tissue from neonatal foreskin and adult facial and back skin was performed following standard protocols. Sections were de-paraffined and rehydrated. For antigen retrieval, sections were boiled in 1.8% 100 mM monohydrate citric acid and 8.2% 100 mM dehydrate sodium citrate.
The microscope used for IF was a Carl Zeiss Axio Imager.D2 (20°C), coded for transmitted-light bright field, with phototube 30°/25 fitted with Zeiss 10×/0.3 ∞/−, 20×/0.5 ∞/0.17, and 40×/0.75 ∞/0.17 EC Plan Neofluar objectives. The images were acquired with a Zeiss AxioCam MRm Rev3 camera and light source for fluorescence illumination HXP 120C Kubler codex and controlled by Zeiss AxioVision Rel 4.8.25 SP3 software. For FITC fluorescence, Alexa Fluor 488 was excited at ʎ 493 nm and detected at ʎ 519 nm, and Alexa Fluor 594 was excited at ʎ 591 nm and detected at ʎ 614 nm. Images were analyzed by ImageJ software (National Institutes of Health, version 1.4.3.67).
Whole-cell extracts and WB
For determination of soluble protein fraction, cells were harvested by trypsin, washed with PBS, and incubated in cold lysis buffer (100 mM NaCl, 50 mM Tris, pH 7.5, 10 mM EDTA, 1% NP-40, 2.5 mM sodium pyrophosphate, 5 mM NaF, 2.5 mM β-glycerophosphate, and 1 mM DTT supplemented with protease inhibitors of Boehringer Ingelheim) for 20 min on ice and centrifuged. The supernatant was collected as a soluble fraction. Protein quantification was determined by fluorometric system Qubit 4.0 (Life Technologies). 80 µg of protein were separated by SDS-PAGE (10% or 12%) and transferred to nitrocellulose membranes. Membranes were blocked with tris-buffered saline/0.1% Tween 20 5% milk for 1 h at RT, incubated overnight with primary antibodies at 4°C, washed twice with tris-buffered saline/0.1% Tween 20 for 15 min, and incubated with the corresponding secondary antibodies for 1 h. Finally, blots were subjected to enhanced chemiluminescence substrate (Lumi-Light, Roche Applied Science) following the supplier’s protocol, or using the Odyssey Infrared Imaging System (LI-COR; Freije et al., 2012). For detection of proteins in the highly insoluble cellular fraction (K8, Inv), the resultant pellet after lyses was incubated in urea lysis buffer (10 mM Tris, pH 8, 5% SDS, 5% β-mercaptoethanol, 4 M urea; Achtstaetter et al., 1986). The same number of cells was loaded onto the gel in all lanes (8,000).
Confocal microscopy
For 3D confocal reconstruction, keratinocytes were grown on glass coverslips, fixed, and stained. Coverslips were washed with PBS and stained with DAPI dye (0.1 µg/ml). They were mounted with Prolong Gold Antifade Mountant Reagent (Life Technologies, P36934), and visualized and photographed with AxioVision Zeiss fluorescent microscopy (Freije et al., 2014). 28 Z-stack 3D digital images were reconstructed after frame collection every 0.86 µm in the z axis by confocal microscopy (Nikon A1R; 20× NA 0.75) and processed and scaled up 0.5× to 1.92 µm by NIS Elements software (AR, 3.2 64 bits; Nikon).
It must be noted that Inv is not a 100% accurate marker. First, because of the technique, cells have to be permeabilized, negative cells take the antibody nonspecifically, and the positive peak does not separate perfectly from the negative peak. As a result, some positive and negative cells always overlap. Second, the Inv epitope is lost at late differentiation because the protein is cross-linked into the cornified envelope. Therefore, Inv quantification is an underestimation. In addition, primary keratinocytes are never synchronized; there is always a balance between proliferation and differentiation. Results were in histograms normalized to the control (100%) estimated as 20% positive cells. What we do with treatments is drive the balance toward proliferation or differentiation. For all these reasons, we use various different protein markers. We use parallel suprabasal markers K1/keratin K10 or K16 by various techniques. K1, keratin K10, and K16 are suprabasal post-mitotic markers (Sanz-Gómez et al., 2020b). In addition, we analyze the light-scattering properties (size and complexity), which are very reliable and more sensitive (Jones et al., 1995; Jones and Watt, 1993; Sanz-Gómez et al., 2020b), and finally, we subject cells to clonogenicity capacity assays, which are the final proof for terminal differentiation or proliferation (loss or gain of clonogenic capacity). In the experiments performed in this study, the differentiation effects were consistent and striking. In addition, γH2AX is a transient signal, whereas differentiation is permanent until cells eventually detach, and therefore the degree of the induction can be different.
For single or double quantitation of IFs, several fields were scored for total and positive and/or negative cells for a total of 500–1,000 per sample out of at least five different fields in representative experiments. For γH2AX foci, their number was scored in linear nonsaturated images in 50–100 cells per sample out of 5–10 different fields in representative experiments. For in situ tissue staining, 100–160 cells per microsection were scored out of three fields for each of three independent samples from three human individuals.
Real-time PCR
Total RNA was isolated and reverse-transcribed using NucleoSpin RNA (Macherey-Nagel) and the iScript cDNA synthesis kit (Bio-Rad) according to the manufacturer's instructions. The cDNAs (2 µl) were amplified by real-time PCR (Bio-Rad iQ SYBR Green supermix) and normalized to β-actin mRNA levels. Primers used in this study are human ATR, 5′-CGGGAAATACTAGAACCTCA-3′, 5′-CATAATGCTACAGCAGGTGA-3′; human K1, 5′-CCAGCCAGAGTAGGACCAGT-3′, 5′-TGCAGCAAAACAAGGAAATG-3′; human K5, 5′-CAAGCGTACCACTGCTGAGA-3′, 5′-CTATCCAGG TCCAGGTTGCG-3′; human K8, 5′-GGAGAAGCTGAAGCTGGAGG-3′, 5′-CCATGGACAGCACCACAGAT-3′; human H2AX, 5′-CGACAACAAGAAGACGCGAA-3′, 5GGGCCCTCTTAGTACTCCTG-3′; and human α-actin, 5′-AAAATCTGGCACCACACCTTC-3′, 5′-AGCACAGCCTGGATAGCAA-3′.
Comet assay
Alkaline comet assays were performed. Glass slides were previously treated to ensure suitable adhesion of agarose. They were immersed in ether-ethanol (1:2) for 1 h, and ethanol 70% for 30 min, and then dried and covered with normal 0.5% melting agarose (Pronadisa, 8016) for 5 min (65°C). Cells were trypsinized avoiding exposure to light. All incubations were performed in the dark at 4°C. 50,000 cells were resuspended in 20 µl of PBS and 75 µl of 0.5% low melting agarose (Invitrogen, 15517–014) in distilled water and maintained at 37°C. 90 µl of this mix were pipetted on the slide and covered with a coverslip. Slides were incubated for 10 min, and coverslips were removed. Low-melting agarose (0.5%) was added to the slides and covered with new coverslips. Slides were incubated for 10 min. Coverslips were removed, and samples were incubated for 1 h in cold lysis solution (10% DMSO, 1% Triton X-100) and 89% lysis buffer (pH 10, NaCl 2.5 M, EDTA 100 mM, Tris 10 mM, NaOH 200 mM). Samples were incubated in cold electrophoresis buffer (83% EDTA 0.1 M, 17% NaOH 300 mM) for 20 min, and then electrophoresis was applied at 25 V for 20 min at 4°C. Samples were washed twice with neutralizing buffer (pH 7.5, Tris 400 nM) and fixed with absolute ethanol. Samples were dried at RT and stained with RedSafe (1:500; InTron, 21141; Ritchie et al., 2009). For quantitation, the length of the nuclear tails in pixels was determined by ImageJ software (National Institutes of Health, version 1.4.3.67).
Statistical analyses
Data are averages of duplicate or triplicate samples of representative independent experiments. Most assays were performed at least on two human primary cell strains. All results are presented as mean ± SEM. Datasets were compared using an unpaired Student’s t test (two-sided) as indicated in the figure legends. Data distribution was assumed to be normal, but this was not formally tested. A P value <0.05 was considered good statistical significance.
Online supplemental material
Fig. S1 shows that DNA damage signal γH2AX in human keratinocytes peaks at metaphase, where it depends on both ATM and ATR. Fig. S2 shows localization of DNA damage/repair markers in human keratinocytes. Fig. S3 shows that increasing serum concentration induces γH2AX in human keratinocytes and results in loss of proliferative potential. Fig. S4 shows that gain or loss of ATR activity affects terminal keratinocyte differentiation. Fig. S5 shows that inhibition of ATM or DNA-PK individually neither induces γH2AX nor affects terminal differentiation in human keratinocytes. Video 1 shows a model for automatic cleansing of stratified squamous epithelia.
Acknowledgments
We thank Ernesto de Diego for foreskin biopsies, Miguel Lafarga for relevant suggestions, and Oskar Fernández-Capetillo for the TopBP1ER construct and critical reading of the manuscript.
The work was funded by national grants from Instituto de Salud Carlos III-Fondo de Investigaciones Sanitarias/Fondo Europeo de Desarrollo Regional (PI14/0900 and PI17/01307; Spain). R. Molinuevo was supported by laboratory funds. L. Contreras was supported by a scholarship from Consejo Nacional de Ciencia y Tecnología (709426; Mexico).
The authors declare no competing financial interests.
Author contributions: R. Molinuevo contributed experimental design, data acquisition, data analyses, writing the manuscript, and figure making. A Freije contributed experimental design, data acquisition, data analyses, writing the manuscript, and figure making. L. Contreras contributed data acquisition and analyses, writing the manuscript, and figure making. J.R. Sanz provided clinical biopsies, counseling, and characterization. A. Gandarillas contributed obtaining financial support, project and experimental design, photographing, data analyses, animation video making, writing the manuscript, and figure making.
References
- Achtstaetter T., Hatzfeld M., Quinlan R.A., Parmelee D.C., and Franke W.W.. 1986. Separation of cytokeratin polypeptides by gel electrophoretic and chromatographic techniques and their identification by immunoblotting. Methods Enzymol. 134:355–371. 10.1016/0076-6879(86)34102-8 [DOI] [PubMed] [Google Scholar]
- Alonso-Lecue P., de Pedro I., Coulon V., Molinuevo R., Lorz C., Segrelles C., Ceballos L., López-Aventín D., García-Valtuille A., Bernal J.M., et al. . 2017. Inefficient differentiation response to cell cycle stress leads to genomic instability and malignant progression of squamous carcinoma cells. Cell Death Dis. 8 e2901 10.1038/cddis.2017.259 [DOI] [PMC free article] [PubMed] [Google Scholar]
- Bell R.A.V., and Megeney L.A.. 2017. Evolution of caspase-mediated cell death and differentiation: twins separated at birth. Cell Death Differ. 24:1359–1368. 10.1038/cdd.2017.37 [DOI] [PMC free article] [PubMed] [Google Scholar]
- Blackford A.N., and Jackson S.P.. 2017. ATM, ATR, and DNA-PK: The Trinity at the Heart of the DNA Damage Response. Mol. Cell. 66:801–817. 10.1016/j.molcel.2017.05.015 [DOI] [PubMed] [Google Scholar]
- Burma S., Chen B.P., Murphy M., Kurimasa A., and Chen D.J.. 2001. ATM phosphorylates histone H2AX in response to DNA double-strand breaks. J. Biol. Chem. 276:42462–42467. 10.1074/jbc.C100466200 [DOI] [PubMed] [Google Scholar]
- Caulín C., Bauluz C., Gandarillas A., Cano A., and Quintanilla M.. 1993. Changes in keratin expression during malignant progression of transformed mouse epidermal keratinocytes. Exp. Cell Res. 204:11–21. 10.1006/excr.1993.1003 [DOI] [PubMed] [Google Scholar]
- Chen Y., and Zhao X.. 1998. Shaping limbs by apoptosis. J. Exp. Zool. 282:691–702. [DOI] [PubMed] [Google Scholar]
- Ciccia A., and Elledge S.J.. 2010. The DNA damage response: making it safe to play with knives. Mol. Cell. 40:179–204. 10.1016/j.molcel.2010.09.019 [DOI] [PMC free article] [PubMed] [Google Scholar]
- Conduit P.T., Wainman A., and Raff J.W.. 2015. Centrosome function and assembly in animal cells. Nat. Rev. Mol. Cell Biol. 16:611–624. 10.1038/nrm4062 [DOI] [PubMed] [Google Scholar]
- Dazard J.E., Piette J., Basset-Seguin N., Blanchard J.M., and Gandarillas A.. 2000. Switch from p53 to MDM2 as differentiating human keratinocytes lose their proliferative potential and increase in cellular size. Oncogene. 19:3693–3705. 10.1038/sj.onc.1203695 [DOI] [PubMed] [Google Scholar]
- de Pedro I., Alonso-Lecue P., Sanz-Gómez N., Freije A., and Gandarillas A.. 2018. Sublethal UV irradiation induces squamous differentiation via a p53-independent, DNA damage-mitosis checkpoint. Cell Death Dis. 9:1094 10.1038/s41419-018-1130-8 [DOI] [PMC free article] [PubMed] [Google Scholar]
- Fernandez-Capetillo O., Lee A., Nussenzweig M., and Nussenzweig A.. 2004. H2AX: the histone guardian of the genome. DNA Repair (Amst.). 3:959–967. 10.1016/j.dnarep.2004.03.024 [DOI] [PubMed] [Google Scholar]
- Fernandez-Vidal A., Vignard J., and Mirey G.. 2017. Around and beyond 53BP1 Nuclear Bodies. Int. J. Mol. Sci. 18:2611 10.3390/ijms18122611 [DOI] [PMC free article] [PubMed] [Google Scholar]
- Flynn R.L., and Zou L.. 2011. ATR: a master conductor of cellular responses to DNA replication stress. Trends Biochem. Sci. 36:133–140. 10.1016/j.tibs.2010.09.005 [DOI] [PMC free article] [PubMed] [Google Scholar]
- Freije A., Ceballos L., Coisy M., Barnes L., Rosa M., De Diego E., Blanchard J.M., and Gandarillas A.. 2012. Cyclin E drives human keratinocyte growth into differentiation. Oncogene. 31:5180–5192. 10.1038/onc.2012.22 [DOI] [PubMed] [Google Scholar]
- Freije A., Molinuevo R., Ceballos L., Cagigas M., Alonso-Lecue P., Rodriguez R., Menendez P., Aberdam D., De Diego E., and Gandarillas A.. 2014. Inactivation of p53 in Human Keratinocytes Leads to Squamous Differentiation and Shedding via Replication Stress and Mitotic Slippage. Cell Rep. 9:1349–1360. 10.1016/j.celrep.2014.10.012 [DOI] [PubMed] [Google Scholar]
- Freije A., Sanz-Gómez N., and Gandarillas A.. 2020. Genetic Modification of Human Primary Keratinocytes by Lentiviral Vectors. Methods Mol. Biol. 2109:113–123. 10.1007/7651_2019_238 [DOI] [PubMed] [Google Scholar]
- Gandarillas A. 2012. The mysterious human epidermal cell cycle, or an oncogene-induced differentiation checkpoint. Cell Cycle. 11:4507–4516. 10.4161/cc.22529 [DOI] [PMC free article] [PubMed] [Google Scholar]
- Gandarillas A., and Watt F.M.. 1997. c-Myc promotes differentiation of human epidermal stem cells. Genes Dev. 11:2869–2882. 10.1101/gad.11.21.2869 [DOI] [PMC free article] [PubMed] [Google Scholar]
- Gandarillas A., Davies D., and Blanchard J.M.. 2000. Normal and c-Myc-promoted human keratinocyte differentiation both occur via a novel cell cycle involving cellular growth and endoreplication. Oncogene. 19:3278–3289. 10.1038/sj.onc.1203630 [DOI] [PubMed] [Google Scholar]
- Gandarillas A., Molinuevo R., Freije A., and Alonso-Lecue P.. 2015. The mitosis-differentiation checkpoint, another guardian of the epidermal genome. Mol. Cell. Oncol. 2 e997127 10.1080/23723556.2014.997127 [DOI] [PMC free article] [PubMed] [Google Scholar]
- Glücksmann A. 1965. Cell death in normal development. Arch. Biol. (Liege). 76:419–437. [PubMed] [Google Scholar]
- Harvat B.L., Wang A., Seth P., and Jetten A.M.. 1998. Up-regulation of p27Kip1, p21WAF1/Cip1 and p16Ink4a is associated with, but not sufficient for, induction of squamous differentiation. J. Cell Sci. 111:1185–1196. [DOI] [PubMed] [Google Scholar]
- Hauser P., Ma L., Agrawal D., Haura E., Cress W.D., and Pledger W.J.. 2004. Efficient down-regulation of cyclin A-associated activity and expression in suspended primary keratinocytes requires p21(Cip1). Mol. Cancer Res. 2:96–104. [PubMed] [Google Scholar]
- Herold S., Hock A., Herkert B., Berns K., Mullenders J., Beijersbergen R., Bernards R., and Eilers M.. 2008. Miz1 and HectH9 regulate the stability of the checkpoint protein, TopBP1. EMBO J. 27:2851–2861. 10.1038/emboj.2008.200 [DOI] [PMC free article] [PubMed] [Google Scholar]
- Jones P.H., and Watt F.M.. 1993. Separation of human epidermal stem cells from transit amplifying cells on the basis of differences in integrin function and expression. Cell. 73:713–724. 10.1016/0092-8674(93)90251-K [DOI] [PubMed] [Google Scholar]
- Jones P.H., Harper S., and Watt F.M.. 1995. Stem cell patterning and fate in human epidermis. Cell. 80:83–93. 10.1016/0092-8674(95)90453-0 [DOI] [PubMed] [Google Scholar]
- Kartasova T., Roop D.R., and Yuspa S.H.. 1992. Relationship between the expression of differentiation-specific keratins 1 and 10 and cell proliferation in epidermal tumors. Mol. Carcinog. 6:18–25. 10.1002/mc.2940060105 [DOI] [PubMed] [Google Scholar]
- Kumagai A., Shevchenko A., Shevchenko A., and Dunphy W.G.. 2010. Treslin collaborates with TopBP1 in triggering the initiation of DNA replication. Cell. 140:349–359. 10.1016/j.cell.2009.12.049 [DOI] [PMC free article] [PubMed] [Google Scholar]
- Lee H., Kwak H.J., Cho I.T., Park S.H., and Lee C.H.. 2009. S1219 residue of 53BP1 is phosphorylated by ATM kinase upon DNA damage and required for proper execution of DNA damage response. Biochem. Biophys. Res. Commun. 378:32–36. 10.1016/j.bbrc.2008.10.150 [DOI] [PubMed] [Google Scholar]
- Lopez-Contreras A.J., and Fernandez-Capetillo O.. 2012. Signalling DNA Damage In Protein Phosphorylation in Human Health. Huang C., editor. InTech, London: pp. 233–262. [Google Scholar]
- Lukas C., Savic V., Bekker-Jensen S., Doil C., Neumann B., Pedersen R.S., Grøfte M., Chan K.L., Hickson I.D., Bartek J., et al. . 2011. 53BP1 nuclear bodies form around DNA lesions generated by mitotic transmission of chromosomes under replication stress. Nat. Cell Biol. 13:243–253. 10.1038/ncb2201 [DOI] [PubMed] [Google Scholar]
- Macheret M., and Halazonetis T.D.. 2015. DNA replication stress as a hallmark of cancer. Annu. Rev. Pathol. 10:425–448. 10.1146/annurev-pathol-012414-040424 [DOI] [PubMed] [Google Scholar]
- Mäkiniemi M., Hillukkala T., Tuusa J., Reini K., Vaara M., Huang D., Pospiech H., Majuri I., Westerling T., Mäkelä T.P., et al. . 2001. BRCT domain-containing protein TopBP1 functions in DNA replication and damage response. J. Biol. Chem. 276:30399–30406. 10.1074/jbc.M102245200 [DOI] [PubMed] [Google Scholar]
- Mata-Garrido J., Casafont I., Tapia O., Berciano M.T., and Lafarga M.. 2016. Neuronal accumulation of unrepaired DNA in a novel specific chromatin domain: structural, molecular and transcriptional characterization. Acta Neuropathol. Commun. 4:41 10.1186/s40478-016-0312-9 [DOI] [PMC free article] [PubMed] [Google Scholar]
- McManus K.J., and Hendzel M.J.. 2005. ATM-dependent DNA damage-independent mitotic phosphorylation of H2AX in normally growing mammalian cells. Mol. Biol. Cell. 16:5013–5025. 10.1091/mbc.e05-01-0065 [DOI] [PMC free article] [PubMed] [Google Scholar]
- Molinuevo R., Freije A., de Pedro I., Stoll S.W., Elder J.T., and Gandarillas A.. 2017. FOXM1 allows human keratinocytes to bypass the oncogene-induced differentiation checkpoint in response to gain of MYC or loss of p53. Oncogene. 36:956–965. 10.1038/onc.2016.262 [DOI] [PMC free article] [PubMed] [Google Scholar]
- Moll R., Divo M., and Langbein L.. 2008. The human keratins: biology and pathology. Histochem. Cell Biol. 129:705–733. 10.1007/s00418-008-0435-6 [DOI] [PMC free article] [PubMed] [Google Scholar]
- Pampfer S., and Donnay I.. 1999. Apoptosis at the time of embryo implantation in mouse and rat. Cell Death Differ. 6:533–545. 10.1038/sj.cdd.4400516 [DOI] [PubMed] [Google Scholar]
- Paramio J.M., Laín S., Segrelles C., Lane E.B., and Jorcano J.L.. 1998. Differential expression and functionally co-operative roles for the retinoblastoma family of proteins in epidermal differentiation. Oncogene. 17:949–957. 10.1038/sj.onc.1202031 [DOI] [PubMed] [Google Scholar]
- Puri P.L., Bhakta K., Wood L.D., Costanzo A., Zhu J., and Wang J.Y.. 2002. A myogenic differentiation checkpoint activated by genotoxic stress. Nat. Genet. 32:585–593. 10.1038/ng1023 [DOI] [PubMed] [Google Scholar]
- Régnier M., Vaigot P., Darmon M., and Pruniéras M.. 1986. Onset of epidermal differentiation in rapidly proliferating basal keratinocytes. J. Invest. Dermatol. 87:472–476. 10.1111/1523-1747.ep12455517 [DOI] [PubMed] [Google Scholar]
- Rheinwald J.G. 1989. Methods for clonal growth and serial cultivation of normal human epidermal keratinocytes and mesothelial cells. In Cell growth and division. A Practical Approach. Baserga R., editor. IRL Press, Oxford: 81–94. [Google Scholar]
- Ritchie A., Gutierrez O., and Fernandez-Luna J.L.. 2009. PAR bZIP-bik is a novel transcriptional pathway that mediates oxidative stress-induced apoptosis in fibroblasts. Cell Death Differ. 16:838–846. 10.1038/cdd.2009.13 [DOI] [PubMed] [Google Scholar]
- Rogakou E.P., Pilch D.R., Orr A.H., Ivanova V.S., and Bonner W.M.. 1998. DNA double-stranded breaks induce histone H2AX phosphorylation on serine 139. J. Biol. Chem. 273:5858–5868. 10.1074/jbc.273.10.5858 [DOI] [PubMed] [Google Scholar]
- Santos M.A., Faryabi R.B., Ergen A.V., Day A.M., Malhowski A., Canela A., Onozawa M., Lee J.E., Callen E., Gutierrez-Martinez P., et al. . 2014. DNA-damage-induced differentiation of leukaemic cells as an anti-cancer barrier. Nature. 514:107–111. 10.1038/nature13483 [DOI] [PMC free article] [PubMed] [Google Scholar]
- Sanz-Gómez N., Freije A., Ceballos L., Obeso S., Sanz J.R., García-Reija F., Morales-Angulo C., and Gandarillas A.. 2018. Response of head and neck epithelial cells to a DNA damage-differentiation checkpoint involving polyploidization. Head Neck 40:2487–2497. 10.1002/hed.25376 [DOI] [PubMed]
- Sanz-Gómez N., de Pedro I., Ortigosa B., Santamaria D., Malumbres M., de Carcer G., and Gandarillas A.. 2020a Squamous differentiation requires G2/mitosis slippage to avoid apoptosis. Cell Death Differ. 27:2451–2467. [DOI] [PMC free article] [PubMed] [Google Scholar]
- Sanz-Gómez N., Freije A., and Gandarillas A.. 2020b Keratinocyte Differentiation by Flow Cytometry. Methods Mol. Biol. 2109:83–92. 10.1007/7651_2019_237 [DOI] [PubMed] [Google Scholar]
- Schmidt L., Wiedner M., Velimezi G., Prochazkova J., Owusu M., Bauer S., and Loizou J.I.. 2014. ATMIN is required for the ATM-mediated signaling and recruitment of 53BP1 to DNA damage sites upon replication stress. DNA Repair (Amst.). 24:122–130. 10.1016/j.dnarep.2014.09.001 [DOI] [PMC free article] [PubMed] [Google Scholar]
- Smith E., Dejsuphong D., Balestrini A., Hampel M., Lenz C., Takeda S., Vindigni A., and Costanzo V.. 2009. An ATM- and ATR-dependent checkpoint inactivates spindle assembly by targeting CEP63. Nat. Cell Biol. 11:278–285. 10.1038/ncb1835 [DOI] [PubMed] [Google Scholar]
- Tiwari R., Sahu I., Soni B.L., Sathe G.J., Datta K.K., Thapa P., Sinha S., Vadivel C.K., Dhaka B., Gowda H., et al. . 2017. Quantitative phosphoproteomic analysis reveals system-wide signaling pathways regulated by site-specific phosphorylation of Keratin-8 in skin squamous cell carcinoma derived cell line. Proteomics. 17:17. [DOI] [PubMed] [Google Scholar]
- Toledo L.I., Murga M., Gutierrez-Martinez P., Soria R., and Fernandez-Capetillo O.. 2008. ATR signaling can drive cells into senescence in the absence of DNA breaks. Genes Dev. 22:297–302. 10.1101/gad.452308 [DOI] [PMC free article] [PubMed] [Google Scholar]
- Vancurova M., Hanzlikova H., Knoblochova L., Kosla J., Majera D., Mistrik M., Burdova K., Hodny Z., and Bartek J.. 2019. PML nuclear bodies are recruited to persistent DNA damage lesions in an RNF168-53BP1 dependent manner and contribute to DNA repair. DNA Repair (Amst.). 78:114–127. 10.1016/j.dnarep.2019.04.001 [DOI] [PubMed] [Google Scholar]
- Wang J., Sun Q., Morita Y., Jiang H., Gross A., Lechel A., Hildner K., Guachalla L.M., Gompf A., Hartmann D., et al. . 2012. A differentiation checkpoint limits hematopoietic stem cell self-renewal in response to DNA damage. Cell. 148:1001–1014. 10.1016/j.cell.2012.01.040 [DOI] [PubMed] [Google Scholar]
- Ward I.M., and Chen J.. 2001. Histone H2AX is phosphorylated in an ATR-dependent manner in response to replicational stress. J. Biol. Chem. 276:47759–47762. 10.1074/jbc.C100569200 [DOI] [PubMed] [Google Scholar]
- Ward I.M., Minn K., Jorda K.G., and Chen J.. 2003. Accumulation of checkpoint protein 53BP1 at DNA breaks involves its binding to phosphorylated histone H2AX. J. Biol. Chem. 278:19579–19582. 10.1074/jbc.C300117200 [DOI] [PubMed] [Google Scholar]
- Watt F.M., Lo Celso C., and Silva-Vargas V.. 2006. Epidermal stem cells: an update. Curr. Opin. Genet. Dev. 16:518–524. 10.1016/j.gde.2006.08.006 [DOI] [PubMed] [Google Scholar]
- Weyemi U., Redon C.E., Choudhuri R., Aziz T., Maeda D., Boufraqech M., Parekh P.R., Sethi T.K., Kasoji M., Abrams N., et al. . 2016. The histone variant H2A.X is a regulator of the epithelial-mesenchymal transition. Nat. Commun. 7:10711 10.1038/ncomms10711 [DOI] [PMC free article] [PubMed] [Google Scholar]
- Zanet J., Freije A., Ruiz M., Coulon V., Sanz J.R., Chiesa J., and Gandarillas A.. 2010. A mitosis block links active cell cycle with human epidermal differentiation and results in endoreplication. PLoS One. 5 e15701 10.1371/journal.pone.0015701 [DOI] [PMC free article] [PubMed] [Google Scholar]
- Zhang S., Hemmerich P., and Grosse F.. 2007. Centrosomal localization of DNA damage checkpoint proteins. J. Cell. Biochem. 101:451–465. 10.1002/jcb.21195 [DOI] [PubMed] [Google Scholar]
- Zou L., and Elledge S.J.. 2003. Sensing DNA damage through ATRIP recognition of RPA-ssDNA complexes. Science. 300:1542–1548. 10.1126/science.1083430 [DOI] [PubMed] [Google Scholar]


