Abstract
Hepatitis B virus (HBV) infection is a leading cause of hepatocellular carcinoma (HCC), but HBV-HCC related prognosis signature remains rarely investigated. This study was to identify an integrated long non-coding RNAs-messenger RNAs (lncRNA-mRNA) signature for prediction of overall survival (OS) and explore their underlying functions.
One RNA-sequencing dataset (training set, n = 95) and one microarray dataset E-TABM-36 (validation set, n = 44) were collected. Least absolute shrinkage and selection operator analysis was performed to identify an lncRNA-mRNA prognosis signature. The OS difference of patients in the high-risk and low-risk risk groups was evaluated by Kaplan–Meier curve. Area under the receiver operating characteristic curve (AUC), Harrell concordance index (C-index) calculation, and multivariate analyses with clinical characteristics were used to determine the prognostic ability. Furthermore, a coexpression network was constructed to interpret the functions.
Nine signature genes (3 lncRNAs and 6 mRNAs) were selected to generate the risk score model. Patients belonging to the high-risk group showed a significantly shorter survival than those of the low-risk group. The prediction accuracy of the risk score for 5-year OS was 0.936 and 0.905 for the training set and validation set, respectively. Also, this risk score was independent of various clinical variables for the prognosis prediction. Incorporation of the risk score remarkably increased the predictive power of the routine clinical prognostic factors (vascular invasion status, tumor recurrence status) (AUC = 0.942 vs 0.628; C-index = 0.7997 vs 0.6908). Furthermore, LncRNA insulin-like growth factor 2 antisense RNA (IGF2-AS) and long intergenic non-protein coding RNA 342 (LINC00342) were predicted to exert tumor suppression effects by regulating homeobox D1 (HOXD1) and secreted frizzled related protein 5 (SFRP5), respectively; while lncRNA rhophilin Rho GTPase binding protein 1 antisense RNA 1 (RHPN1-AS1) may possess carcinogenic potential by promoting the transcription of chromobox 2 (CBX2), cell division cycle 20 (CDC20), matrix metallopeptidase 12 (MMP12), stratifin (SFN), tripartite motif containing 16 (TRIM16), and uroplakin 3A (UPK3A). These mRNAs may be associated with cell proliferation or apoptosis related pathways.
This study may provide a novel, effective prognostic biomarker, and some therapeutic targets for HBV-HCC patients.
Keywords: coexpression, hepatitis B virus, hepatocellular carcinoma, overall survival, signature
1. Introduction
Although great progressions have been made in screening, diagnosis, and treatment of liver cancer, it remains the leading cause of cancer death worldwide.[1] Prior exposure to hepatitis B virus (HBV) infection is believed as the major contributor to the development of hepatocellular carcinoma (HCC).[2,3] Therefore, novel prognostic biomarkers are still required for patients with HBV-associated HCC in order to closely monitor the high-risk patients to improve their prognosis.
Recently, there have some molecular models developed to predict the overall survival (OS) of patients with HBV-HCC, including messenger RNAs (mRNAs) and long non-coding RNAs (lncRNAs). For example, Yang et al[4] used the microarray dataset GSE14520 and univariate/multivariate Cox proportional hazards regression analysis to identify a 3-gene (SPP2, CDC37L1, and ECHDC2) prognostic signature. This signature can significantly divide the patients into the high-risk group (lower OS ratio) and low-risk group (lower mortality). Liu et al[5] utilized the RNA-sequencing data extracted from The Cancer Genome Atlas (TCGA) database to screen a 9-lncRNA combination (DGCR9, GBA3, HCG4, NAT8B, NBR2, PART1, RFPL1S, SLC22A18AS, and TCL6), which was demonstrated to significantly distinguish the OS ratio between the high-risk and low-risk groups, with the accuracy of 95.3%. Zhu et al[6] identified a 9-gene signature (consisting of ZC2HC1A, MARCKSL1, PTGS1, CDKN2B, CLEC10A, PRDX3, PRKCH, MPEG1, and LMO2) using microarray and TCGA datasets and demonstrated this signature was independent from clinical parameters for prediction of OS in HBV-related HCC patients. However, specific prognostic signatures for HBV-HCC patients remain rarely reported. Furthermore, some scholars attempted to integrate the lncRNAs and mRNAs as a prognostic signature for other cancers[7,8] and the results implicated the multi-mRNA/lncRNA-based classifier may be more effective than the risk score model constructed only by multi-lncRNA or multi-mRNA in prediction of OS.[9,10] Therefore, it may be more clinically valuable to develop an integrated prognostic signature for HBV-HCC.
In this study, we aimed to collect the transcriptome profiles (including lncRNAs and mRNAs) from TCGA and The European Bioinformatics Institute (EMBL-EBI) and develop a new multi-RNA-type signature for the prediction of OS in HBV-HCC patients.
2. Materials and methods
2.1. Data source
The mRNA sequencing data (level 3, normalized expression values) were downloaded from TCGA database (https://portal.gdc.cancer.gov) on August 25, 2019 using the search word of “hepatocellular carcinoma.” A total of 423 samples (including 373 HCC samples and 50 normal liver controls) were obtained, in which only 95 HCC samples were used for the following analysis because they were HBV-positive and had complete clinical prognosis information. This dataset was used as the training set.
In addition, EMBL-EBI database (https://www.ebi.ac.uk/arrayexpress/) was also searched to screen another dataset with HBV-HCC samples. As a result, a microarray dataset under accession number E-TABM-36[11] was obtained, in which 44 of 65 samples were HBV-positive and had survival information. This dataset was used as the validation set.
2.2. Screening of mRNAs and lncRNAs differentially expressed
The annotation of lncRNAs and protein-coding mRNAs were obtained from HUGO Gene Nomenclature Committee (HGNC; http://www.genenames.org/) database.[12] Differentially expressed genes (DEGs) and lncRNAs (DELs) between HBV-HCC samples and normal controls were identified by using the Linear Models for Microarray Data (LIMMA) method (version 3.34.7; https://bioconductor.org/packages/release/bioc/html/limma.html).[13] False discovery rate (FDR) < 0.05 and at least 2-fold change (FC) (|log2FC|>1) were chosen as the cut-off criteria. Heat maps was created using pheatmap R package (version: 1.0.8; https://cran.r-project.org/web/packages/pheatmap) to observe the clustering effects of DEGs and DELs.
2.3. Identification of an lncRNA-mRNA signature for prognosis prediction in the training dataset
Univariate Cox regression analysis was performed for the 95 samples in the training dataset to preliminarily examine DEGs and DELs that were significantly associated with OS (log-rank P-value <.05) using the survival package (version 2.41-1; http://bioconductor.org/packages/survivalr/). Then, multivariate Cox regression analysis was used to screen independent prognostic DEGs and DELs. In order to further capture a more perfect signature combination, least absolute shrinkage and selection operator (LASSO), an L1 norm minimization statistical model, was applied for the genes screened by multivariate Cox regression analysis using the penalized package (version, 0.9–5; http://bioconductor.org/packages/penalized/).[14,15] The risk score model of lncRNA-mRNA signature was established based on the expression of lncRNAs-mRNAs (ExplncRNA-mRNA) and their LASSO Cox regression coefficients (ΣβlncRNA-mRNA): Risk score = ΣβlncRNA-mRNA × Exp lncRNA-mRNA.
According to the median risk score, the HBV-HCC patients were divided into the low-risk and high-risk groups. Kaplan–Meier (KM) survival curve was drawn to measure the OS differences between the high-risk and low-risk groups. The area under the receiver operating characteristic (ROC) curve (AUC) was utilized to evaluate the prognostic accuracy of this risk score.
2.4. Validation of the prognostic lncRNA-mRNA signature in the validation dataset
According to corresponding median risk score in the validation dataset, patients were also divided into the high-risk and low-risk groups. The KM survival and ROC curves were then analyzed to further validate the prognostic effects of the risk score.
2.5. The prognostic independence of this lncRNA-mRNA signature
Univariate and multivariate Cox regression analyses were conducted to determine whether the prognostic ability of this risk score was independent of other clinical pathological characteristics using the survival package (version 2.41-1; http://bioconductor.org/packages/survivalr/). The threshold of statistical significance was set as log-rank P < .05. The association between the risk score and other independent clinical characteristics was further estimated by stratification analysis, nomogram formulation using rms package (version 5.1-2; https://cran.r-project.org/web/packages/rms/index.html) and Harrell concordance index (C-index) calculation by survcomp package in R (version 1.34.0; http://www.bioconductor.org/packages/release/bioc/html/survcomp.html).
2.6. Identification of lncRNA-mRNA signature associated functions
To understand possible roles of DELs, an lncRNA-mRNA coexpressed network was constructed. The correlation between DELs and DEGs was estimated using tcor.test function (https://stat.ethz.ch/R-manual/R-devel/library/stats/html/cor.test.html) in R, by which Pearson correlation coefficients (PCC) were obtained. The PCC > 0.5 was set for the criterion and the network was visualized using Cytoscape (version 3.4; www.cytoscape.org/). The functions of DEGs in this network were predicted using the Database for Annotation, Visualization, and Integrated Discovery (DAVID) (v6.8; http://david.abcc.ncifcrf.gov), including Gene Ontology (GO) biological process terms and Kyoto Encyclopedia of Genes and Genomes (KEGG) pathways. Statistical significance was set at P < .05 for the function enrichment results.
3. Results
3.1. Identification of survival-related mRNAs and lncRNAs
After removal of the expression median value of zero, 13,454 mRNAs, and 1238 lncRNAs were finally re-annotated by HGNC database. The DEGs and DELs were analyzed in 95 HBV-HCC tissues and 50 controls of the training dataset using the LIMMA method. Based on the given threshold, 682 differentially expressed RNAs were identified, including 640 DEGs and 42 DELs (Fig. 1A). These differentially expressed RNAs were demonstrated to obviously cluster the samples into 2 groups (Fig. 1B).
Figure 1.
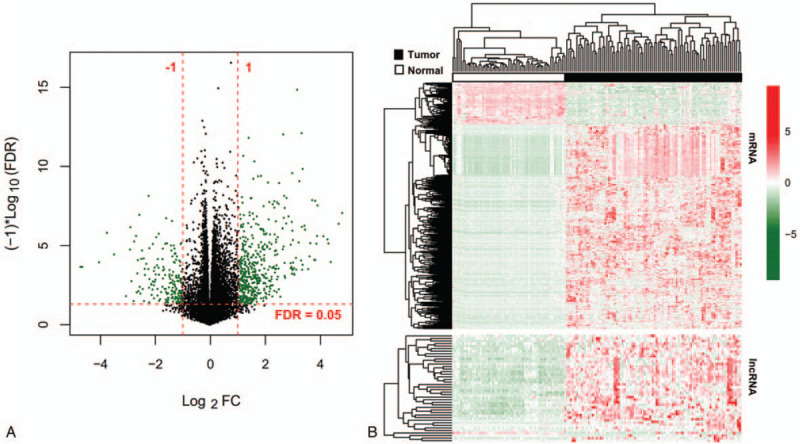
Identification of differentially expressed RNAs between 95 HBV-HCC tissues and 50 controls. A, Volcano plot was drawn to indicate the distribution of differentially expressed RNAs. Green dots represent significant RNAs. B, Heat map of differentially expressed lncRNAs and mRNAs. Red, high expression; green, low expression. FC = fold change; FDR = false discovery rate; lncRNAs = long non-coding RNAs; mRNAs = messenger RNAs.
Univariate Cox regression analysis was performed for these 682 differentially expressed RNAs to explore whether they were survival-related. As a result, 128 of them (including 108 DEGs and 20 DELs) were found to meet the statistical threshold value. Then, multivariate Cox regression analysis was carried out to identify independent survival factors, which yielded 28 genes, including 15 DEGs and 13 DELs. To narrow down the panel, LASSO model was implemented, by which 9 of 28 genes were considered as the optimal prognostic signature, including 6 DEGs (CBX2, chromobox 2; CDC20, cell division cycle 20; MMP12, matrix metallopeptidase 12; SFN, stratifin; TRIM16, tripartite motif containing 16; and UPK3A, uroplakin 3A) and 3 DELs (IGF2-AS, insulin-like growth factor 2 antisense RNA; LINC00342, long intergenic non-protein coding RNA 342; and RHPN1-AS1, rhophilin Rho GTPase binding protein 1 antisense RNA 1) (Table 1).
Table 1.
Prognostic signature screened.

A shown in Table 1, the hazard ratio (HR) and LASSO coefficients of IGF2-AS and LINC00342 were respectively <1 and negative, which indicated they may be tumor suppressor genes and their high expression predicted good OS; while contrast results were obtained for the remaining genes, suggesting they were oncogenic and anti-survival. These explanations were proved by the KM survival curve analysis (Fig. 2).
Figure 2.
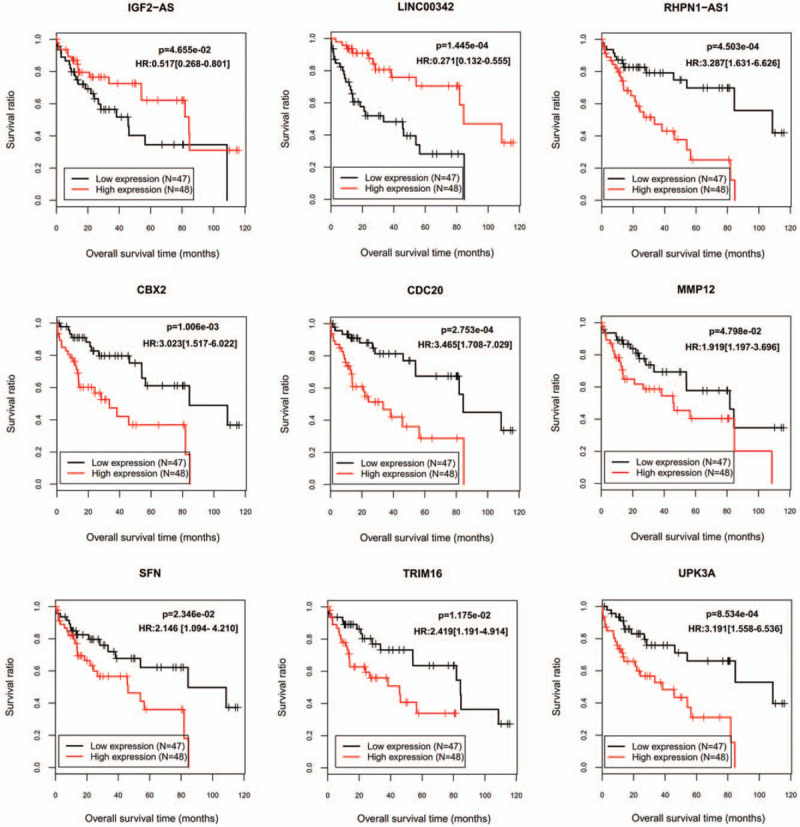
Kaplan–Meier plots to display the prognosis values of 9 signature genes. HR = hazard ratio.
3.2. Prognostic assessment of the risk score in the training dataset
A risk score model was developed using the expression and LASSO coefficients according to the corresponding formula described in the method. Then, it was calculated for each patient. Using a cut-off point of median risk score, the patients fell into 2 categories: high-risk group (≥median; n = 48) and low-risk group (<median; n = 47) (Fig. 3A). KM survival curve analysis showed the OS was significantly differential between the high-risk group and low-risk group (HR = 5.887; P = 2.379e–06), with the high-risk group exhibiting lower OS ratio (Fig. 3B). ROC analysis also suggested the risk score model had a good prognostic value (1-year OS: AUC = 0.938; 3-year OS: AUC = 0.939; 5-year OS: AUC = 0.936) (Fig. 3C).
Figure 3.
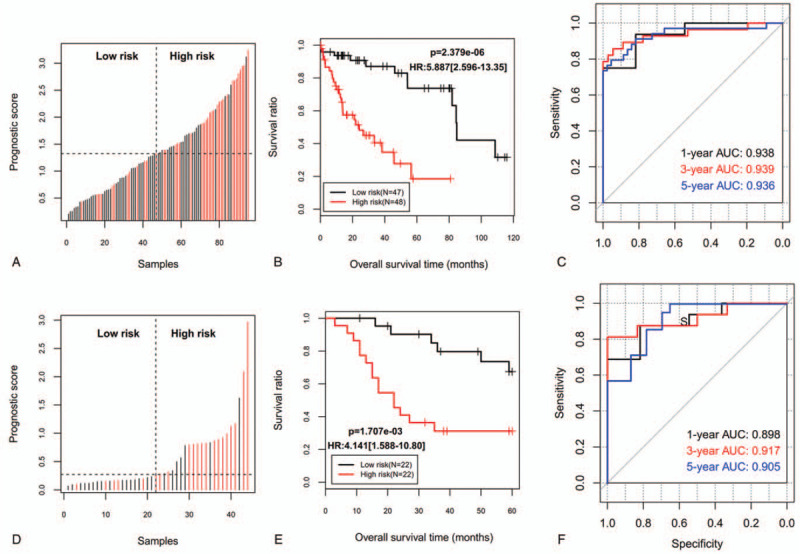
The prognosis of patients in high-risk and low-risk groups divided according to the risk score. A, D: Distribution of risk score of training set (A) and validation set (D); B, E: Kaplan–Meier survival analysis between patients at a low and high risk of death for the training set (B) and validation set (E); C, F: time dependent ROC curves at 1-, 3-, and 5-years for the training set (C) and validation set (F). AUC = the area under the ROC curve; HR = hazard ratio; ROC = receiver operating characteristic curve.
3.3. External validation of the prognostic value of the risk score
The predictive performance of the 9-gene signature screened in the training set was further evaluated using another validation set collected from EMBL-EBI database. The patients in the validation set were also classified into the high-risk (n = 22) and low-risk groups (n = 22) according to its cut-off (Fig. 3D). Consistent with the result of the training dataset, OS was also shown to be significantly lower in the high-risk group than that in the low-risk group (HR = 4.141; P = 1.707e–03) (Fig. 3E). KM-AUC values were 0.898, 0.917, and 0.905 for 1-year, 3-year, and 5-year OS (Fig. 3F).
3.4. Independence evaluation of this risk score
To evaluate the independent power of this risk score, univariate and multivariate Cox regression analyses were also performed using the clinicopathological factors and our risk score. The results revealed that our risk score was independent of other clinicopathological factors to predict the OS (Table 2). Furthermore, we also conducted risk stratification analyses in HBV-HCC patients with vascular invasion and tumor recurrence status which were also independent factors in multivariate analysis. As shown in Fig. 4, patients in the high-risk group had significantly worse OS than those in the low-risk group in subgroups of without vascular invasion (P = 1.664e–04), vascular invasion (P = 5.507e–04), without tumor recurrence (P = 1.875e–03) and tumor recurrence (P = 3.635e–04). These stratification results indicated that the lncRNA-mRNA based prognostic model had better predictive performance than these 2 independent clinical risk factors. To further compare the prediction advantage of the risk score to clinical factors, time-dependent ROC analysis and C-index calculation were executed. As expected, the AUC (0.921) and C-index (0.7727) of lncRNA-mRNA based risk score were higher than those of vascular invasion (AUC = 0.642; C-index = 0.6401) and tumor recurrence status (AUC = 0.658; C-index = 0.6288) alone, and even combination of them (AUC = 0.628; C-index = 0.6908) (Fig. 5A). Of course, integration of the risk score with clinical factors may be the most effective for prediction of OS (AUC = 0.942; C-index = 0.7997), which can also be observed in the calibration curve of the nomogram, showing a good agreement between predicted and observed OS (Fig. 5B and C).
Table 2.
Univariate and multivariate analysis to confirm the independence of signature.

Figure 4.
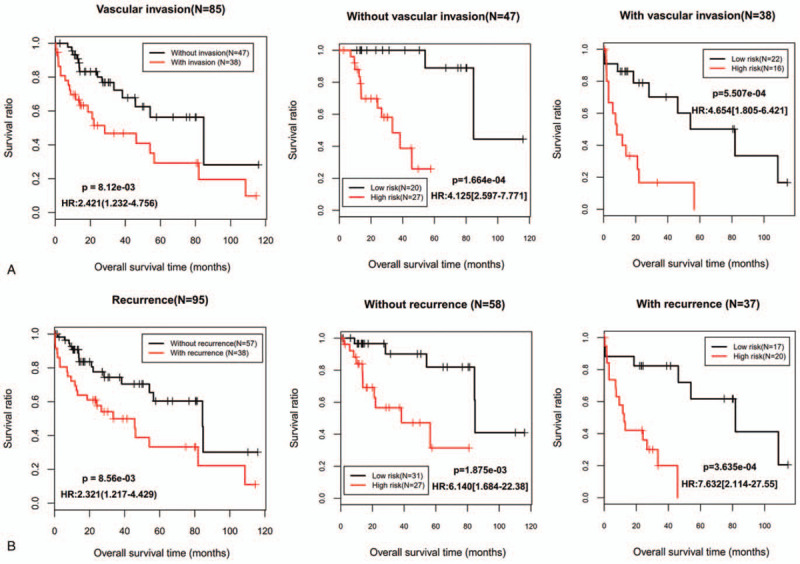
Kaplan–Meier survival analyses for the patients with vascular invasion (A) and tumor recurrence status (B) in the training dataset. HR = hazard ratio.
Figure 5.
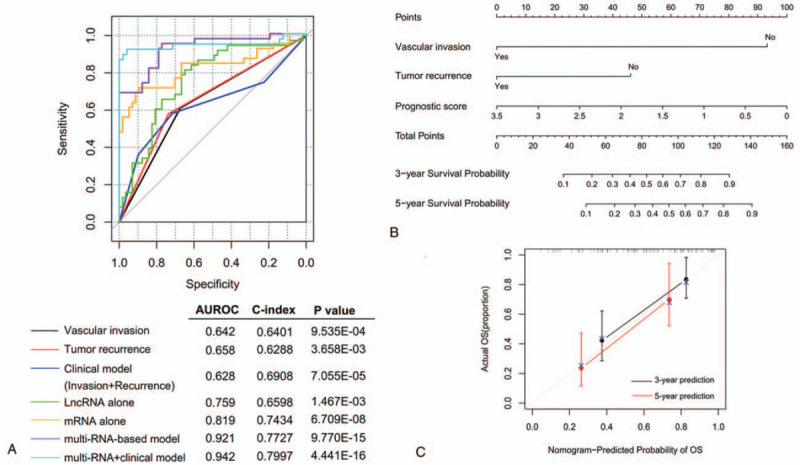
Comparison of the prediction advantage of risk score with clinical factors. A, Time-dependent ROC curves; B, a nomogram containing clinical factors and risk score; C, the calibration plots for predicting 3- and 5-year overall survival. AUROC = the area under the receiver operating characteristic curve; OS = overall survival.
3.5. Functional annotation for signature genes
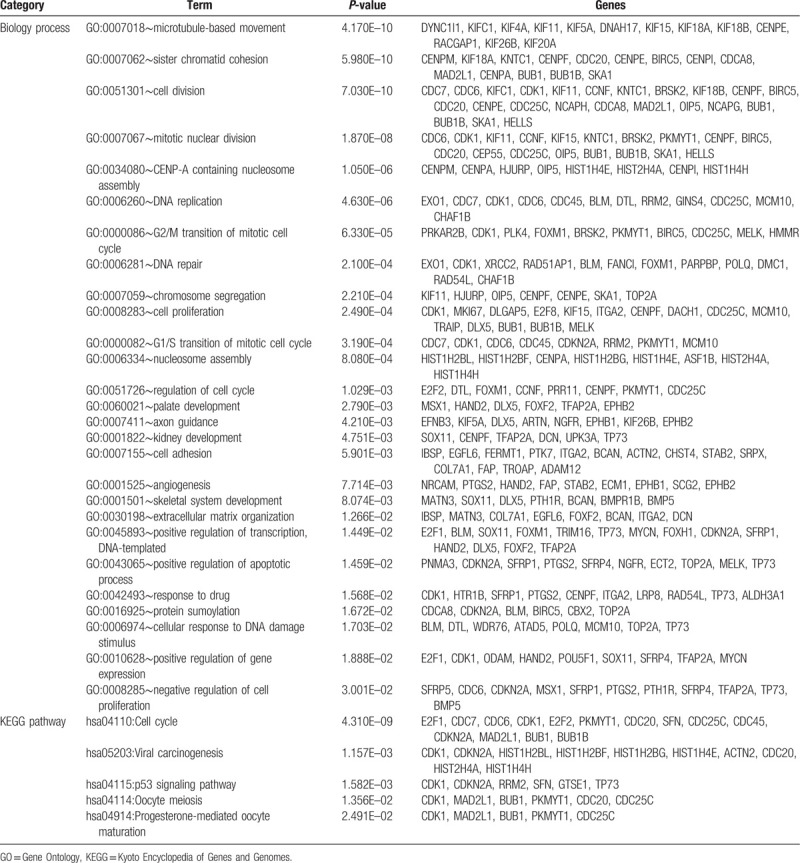
In order to interpret the biological functions and pathways of the signature lncRNAs and mRNAs, a coexpression network was first established using all DELs and DEGs and then the relevant DEGs were subjected to DAVID database. Based on the cut-off point of PCC > 0.5, 437 coexpression pairs were obtained between 35 DELs and 230 DEGs (such as IGF2-AS-HOXD1 [homeobox D1], LINC00342- SFRP5 [secreted frizzled related protein 5], RHPN1-AS1-CBX2/CDC20/SFN/TRIM16/UPK3A/MMP12) which were used to construct a coexpression network (Fig. 6). The enriched KEGG pathways for these genes in the network included “hsa04110:Cell cycle (CDC20, SFN),” “hsa04115:p53 signaling pathway (SFN),” and “hsa04114:Oocyte meiosis (CDC20).” The main enriched GO biological processes included “GO:0051301∼cell division (CDC20),” “GO:0001822∼kidney development (UPK3A),” “GO:0045893∼positive regulation of transcription, DNA-templated (TRIM16),” “GO:0016925∼protein sumoylation (CBX2),” and “GO:0008285∼negative regulation of cell proliferation (SFRP5)” (Table 3).
Figure 6.
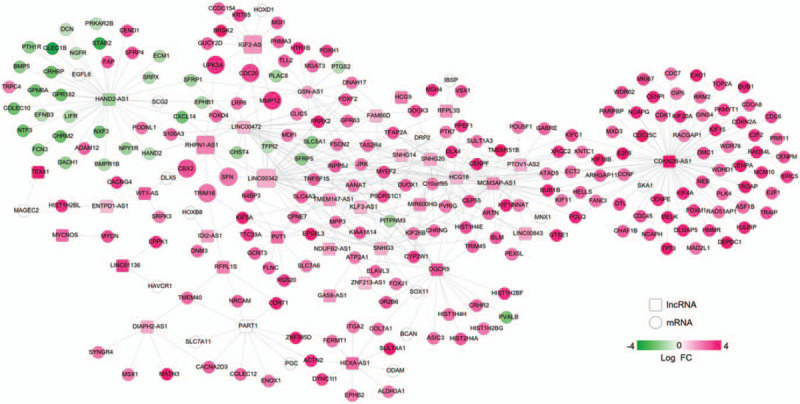
A coexpression network established between differentially expressed lncRNAs and mRNAs. Red, upregulated; green, downregulated. FC = fold change; lncRNAs = long non-coding RNAs; mRNAs = messenger RNAs.
Table 3.
Function enrichment for genes in the coexpression network.
4. Discussion
Using 2 datasets, we identified and validated a novel integrated lncRNA-mRNA signature (3-lncRNA: IGF2-AS, LINC00342 and RHPN1-AS1; 6-mRNA: CBX2, CDC20, MMP12, SFN, TRIM16 and UPK3A) for prediction of OS in HBV-positive HCC patients. This 9-lncRNA/mRNA signature was demonstrated to be more accurate for prognostic prediction when compared with only lncRNAs or mRNAs (AUC = 0.921 vs 0.759 or 0.819, respectively; C-index = 0.7727 vs 0.6598 or 0.7434, respectively), which was in line with the study of Wang et al.[16] Stratified by vascular invasion and tumor recurrence status, this integrated lncRNA-mRNA signature still significantly distinguished the OS ratio of the high-risk and low-risk groups, suggesting our molecular signature can be used to further refine these 2 clinical prognostic systems.[17,18] The prognostic benefit of the risk score given to the vascular invasion and tumor recurrence status can also be seen from the AUC of time-dependent ROC curve (0.942 vs 0.642 or 0.658, respectively), C-index (0.7997 vs 0.6401 or 0.6288, respectively), and calibration curve of the nomogram. Although TNM stage has been extensively believed as an important predictor to evaluate patients’ survival time, univariate, and multivariate Cox regression analyses in this study did not find a statistical significance with OS, including whole TNM stage and individual pathologic M, T, and N stage, implying the limited prognostic power of TNM staging, which was in accordance with the previous studies.[10,19]
IGF2-AS was reported to be upregulated in a dose-dependent manner in retinal pigment epithelial ARPE-19 cells that underwent high-glucose induced apoptosis. After IGF2-AS was silenced, the apoptosis of ARPE-19 cells was ameliorated.[20] This protective effects of IGF2-AS inhibition on cell apoptosis was also observed in dorsal root ganglion neuron.[21] Inhibition of IGF2-AS was also demonstrated to augment proliferation and invasion in myocardial microvascular endothelial cells of Goto-Kakizaki rats by upregulating pro-angiogenic IGF2 and vascular endothelial growth factor (VEGF) at both molecular and protein levels.[22] These findings suggested IGF2-AS may be a tumor suppressor. This hypothesis had also been implicated in some cancers. For example, Chen et al[23] observed lentivirus-mediated overexpression of IGF2-AS suppressed prostate cancer cell proliferation and invasion in vitro, and xenograft development in vivo via downregulation of IGF2. Similarly, Zhang et al[24] detected upregulation of IGF2-AS had anti-cancer effects by inhibiting non-small cell lung cancer (NSCLC) cell proliferation, migration in vitro, and explant growth in vivo through reducing oncogenic IGF2, VEGF, and bFGF (basic fibroblast growth factor). Moreover, high expression of IGF2-AS was significantly correlated with longer OS in patients with NSCLC. In agreement with these studies, we also found IGF2-AS may be a protective factor for HBV-HCC (HR < 1), showing the OS was higher in patients having high levels than those with lower expressions of IGF2-AS. However, its downstream mechanisms remain not well understood in addition to pro-angiogenic factors. In this study, we predicted IGF2-AS may regulate HOXD1. A previous study showed small interfering RNA-mediated knockout of HOXD1 remarkably enhanced breast cancer cell migration, invasion and cell adhesion,[25] indicating HOXD1 may also be a tumor suppressor gene, not similar to its other family members.[26] Thus, as a protective response mechanism, high expressed IGF2-AS may inhibit the development of HBV-HCC by upregulating HOXD1.
Although several studies had proved lncRNA LINC00342 promoted proliferation, colony formation, migration, and invasion for NSCLC[27] and infantile hemangioma,[28] our results showed patients with high expression of LINC00342 had longer OS than those with lower expression of LINC00342, implying LINC00342 may have an anti-tumor activity in HBV-HCC specifically. Furthermore, we predicted LINC00342 may exert tumor suppression effects by downregulating SFRP5. SFRP5 is an endogenous inhibitor of Wnt signaling (activation of which had been linked to HBV-induced carcinogenesis[29,30]). Thus, SFRP5 may function as a tumor suppressor gene. This hypothesis had been verified in several cancers. For example, the study results of Xu et al[31] showed overexpression of SFRP5 significantly suppressed the proliferation, colony formation, and invasion, but induced cell cycle arrest and apoptosis of prostate cancer cells, compared with vector-transfected control cells. In vivo studies also confirmed that overexpression of SFRP5 significantly blocked the growth of xenograft tumors and increased terminal deoxynucleotidyl transferasebiotin-dUTP nick end labeling-positive cells (apoptosis). Sheng et al[32] reported epigenetic silencing of SFRP5 promoted the metastasis and invasion of chondrosarcoma by expression inhibition and Wnt signaling pathway activation. Xie et al[33] revealed HBV X protein induced the downregulation of SFRP5 to trigger the development of HCC, which was significantly correlated with overexpression of DNA methyltransferase 1. In accordance with these studies, we also identified SFRP5 was lower expressed in HBV-HCC samples and SFRP5 was enriched in process of negative regulation of cell proliferation.
There was increasing evidence that RHPN1-AS1 was a critical modulator of cancers. It was significantly upregulated in various cancer cells and tissues (including uveal melanoma,[34] breast cancer,[35] head and neck squamous cell carcinoma,[36] cervical cancer,[37] and HCC[38,39]) compared with controls. Knockdown of RHPN1-AS1 significantly inhibited cancer cell proliferation, migration, and invasion in vitro and reduced tumor growth in xenograft models in vivo.[36,37,38,39,40] Moreover, RHPN1-AS1 was revealed to be a significant and independent predictor of prognosis, showing that patients with low expression of RHPN1-AS1 had much longer OS than those with high expression of RHPN1-AS1,[38,39,40] including HCC. Our results seemed to be consistent with these studies, which also showed RHPN1-AS1 was high expressed in HBV-HCC patients and associated with poor OS. The above studies have attempted the downstream mechanisms of RHPN1-AS1 in cancers, consisting of activation of epithelial-to-mesenchymal transition[36,40] or modulation of miR-299-3p/FGF2,[37] miR-485/CDCA5,[38] miR-596/IGF2BP2[39] axes, but it remains completely unclear. In this study, we predicted RHPN1-AS1 may promote the transcription of 6 prognostic genes (CBX2, CDC20, MMP12, SFN, TRIM16, and UPK3A). Existing studies also indicated 4 of 6 genes played oncogenic functions in HCC. For example, Mao et al[41] used immunohistochemical staining to find CBX2 expression was higher in HCC tissues than that of adjacent liver tissues and associated with poor prognosis in HCC patients. Knockdown of CBX2 inhibited the proliferation and increased apoptosis of HCC cells. Using the TCGA dataset, Liao et al[42] also identified CBX2 as one member of a prognostic signature for HCC patients, with lower OS in patients having high expression of CBX2 by KM survival curve analysis. Li et al[43] performed immunohistochemistry in 132 matched tissues to demonstrate CDC20 expression was upregulated in HCC tissues. High expression levels of CDC20 were positively correlated with the expression of proliferation marker Ki-67. CDC20 siRNA decreased cell proliferation and increased cell cycle arrest at G2/M-phase. Several bioinformatic analyses of microarray or TCGA datasets also revealed CDC20 was a hub gene for the development of HCC and overexpression of CDC20 in HCC tissues accounted for poorer OS in HCC patients,[44,45] including HBV-HCC.[46] PCR analysis determined MMP-12 mRNA was significantly elevated in tumor liver tissues of HCC patients compared with non-tumor and normal liver tissues.[47] Overexpression of MMP-12 mRNA was significantly correlated with poor overall survival for HCC patients in an independent manner.[47,48] Wang et al[49] screened SFN as an up-regulated gene in HCC and high expression level of SFN was associated with worse prognosis (HR = 1.777; adjusted P-value = .005). In accordance with these studies, we also found CBX2, CDC20, MMP12, and SFN were risk factors for the poor OS in HBV-HCC samples (HR > 1). Most of them were enriched in cell cycle, proliferation or apoptosis related biological processes or pathways. A recent study found TRIM16 may be a tumor suppressor in HCC, knockdown of which promoted epithelial-mesenchymal transition and then cell migration and invasion in vitro and in vivo.[50] However, in our study, we identified TRIM16 was upregulated in HBV-HCC and positively associated with shorter OS. These inconsistent results may be possibly resulted from the difference of dry and wet experiments (quantitative reverse transcription-polymerase chain reaction [RT-PCR]). Furthermore, there were also studies on gastric cancer to illustrate upregulated TRIM16 could promote cell invasion and migration,[51] suggesting TRIM16 may have dual functions in cancer. Thus, the expression and roles of TRIM16 should be further validated in the future. No studies reported the roles of UPK3A in HCC until now, but the related research on bladder cancer may indirectly clarify its possible oncogenic functions: UPK3A levels in serum, plasma, and urine were shown to be elevated in patients compared with healthy controls and associated with muscle-invasive status, high grade, lymphovascular invasion, and cancer-specific mortality.[52,53]
There were still some limitations in this study. First, the sample size of our collected datasets from public databases was not large due to the fact that this study specifically focused on HBV-HCC, not overall HCC. More newly hospitalized HBV-HCC patients and controls in our institution should be prospectively included confirm the OS prediction ability of our lncRNA-mRNA signature. Second, the clinical information (such as therapies) were not detail for patients in TCGA database and thus, the influences of other clinical factors on the prognosis of HBV-HCC patients have to be confirmed using new case series. Third, quantitative PCR should be performed to examine the expression of lncRNAs and mRNAs at RNA levels, while western blotting or immunohistochemistry should be conducted to determine the protein levels of mRNAs because RNA-sequencing or microarray results seemed not to be completely consistent with these wet experiments. Fourth, although we preliminarily predicted the functions of lncRNAs in HBV-HCC based on the coexpression mechanisms with mRNAs, their interaction relationships still need experimental confirmation, such as coimmunoprecipitation. Furthermore, the roles of lncRNAs and mRNAs for HBV-HCC also require in vitro (overexpression or knockdown of lncRNAs and mRNAs, followed by cell proliferation, apoptosis, invasion, and metastasis assays) and in vivo validation (tumor growth in xenograft models). Fifth, lncRNAs can act as competing endogenous RNAs to indirectly regulate mRNAs by sponging miRNAs.[37,38,39] Several studies also suggested miRNAs were important biomarkers for prognosis prediction in HCC patients.[54,55,56,57] Therefore, lncRNA-miRNA-mRNA signature may also be effective for prognosis prediction, which may be a potential direction in our subsequent studies. Sixth, the prognosis potential of other DEGs (such as Dickkopf-1, another important wnt pathway gene[58]) and DELs that were not included in the risk score should be independently confirmed using clinical samples to supplement our conclusions.
5. Conclusion
Through a series of bioinformatics analyses, we preliminarily established a 9-lncRNA/mRNA risk score model which may be potentially effective and independent biomarkers for prediction of OS in HBV-HCC patients by dividing them into the high-risk and low-risk groups and then guide therapeutic schedule. Furthermore, in routine clinical practice, high-risk patients of cancer-related death may be better recognized by the nomogram that incorporated the risk score model and clinical prognostic systems (vascular invasion and tumor recurrence status). By constructing the lncRNA-mRNA coexpression and function annotation analysis, we predicted high expressed IGF2-AS and LINC00342 may exert tumor suppression effects by regulating HOXD1 and SFRP5, respectively; while high expressed RHPN1-AS1 may possess carcinogenic potential by promoting the transcription of CBX2, CDC20, MMP12, SFN, TRIM16, and UPK3A. These mRNAs were all associated with cell proliferation or apoptosis related pathways. These results may also provide underlying therapeutic targets for HBV-HCC.
Author contributions
Conceptualization: Zhenzi Bai, Xiaonan Zhao.
Data curation: Zhenzi Bai, Hongyan Li.
Formal analysis: Zhenzi Bai.
Investigation: Chenghua Li, Chuanlun Sheng.
Methodology: Hongyan Li.
Resources: Chenghua Li.
Software: Chuanlun Sheng.
Supervision: Xiaonan Zhao.
Validation: Xiaonan Zhao.
Writing – original draft: Zhenzi Bai.
Writing – review & editing: Xiaonan Zhao.
Footnotes
Abbreviations: AUC = area under the ROC, CBX2 = chromobox 2, CDC20 = cell division cycle 20, C-index = Harrell concordance index, DAVID = Database for Annotation, Visualization, and Integrated Discovery, DEGs = differentially expressed genes, DELs = differentially expressed lncRNAs, EMBL-EBI = The European Bioinformatics Institute, FC = fold change, FDR = false discovery rate, GO = Gene Ontology, HBV = hepatitis B virus, HCC = hepatocellular carcinoma, HGNC = HUGO Gene Nomenclature Committee, HOXD1 = homeobox D1, HR = hazard ratio, IGF2-AS = insulin-like growth factor 2 antisense RNA, KEGG = Kyoto Encyclopedia of Genes and Genomes, KM = Kaplan–Meier, LASSO = least absolute shrinkage and selection operator, LIMMA = Linear Models for Microarray Data, LINC00342 = long intergenic non-protein coding RNA 342, lncRNAs = long non-coding RNAs, MMP12 = matrix metallopeptidase 12, mRNAs = messenger RNAs, NSCLC = non-small cell lung cancer, OS = overall survival, PCC = Pearson correlation coefficients, RHPN1-AS1 = rhophilin Rho GTPase binding protein 1 antisense RNA 1, ROC = receiver operating characteristic curve, RT-PCR = reverse transcription-polymerase chain reaction, SFN = stratifin, SFRP5 = secreted frizzled related protein 5, TCGA = The Cancer Genome Atlas, TRIM16 = tripartite motif containing 16, UPK3A = uroplakin 3A, VEGF = vascular endothelial growth factor.
How to cite this article: Bai Z, Li H, Li C, Sheng C, Zhao X. Integrated analysis identifies a long non-coding RNAs-messenger RNAs signature for prediction of prognosis in hepatitis B virus-hepatocellular carcinoma patients. Medicine. 2020;99:40(e21503).
ZB and HL have contributed equally to this work.
Funding: None.
Availability of data and materials: The RNA-seq data were downloaded from the TCGA (https://portal.gdc.cancer.gov/) and EMBL-EBI (https://www.ebi.ac.uk/arrayexpress/).
Ethics approval and consent to participate: As the data used in this study was downloaded from EMBL-EBI or TCGA database and no human experiment was involved in this study, there was no informed consent.
Consent for publication: Not applicable.
The authors have no conflicts of interest to disclose.
The datasets generated during and/or analyzed during the current study are publicly available.
References
- [1].Siegel RL, Miller KD, Jemal A. Cancer statistics, 2019. CA Cancer J Clin 2019;69: suppl: 7–34. [DOI] [PubMed] [Google Scholar]
- [2].Yang F, Ma L, Yang Y, et al. Contribution of Hepatitis B Virus infection to the aggressiveness of primary liver cancer: a clinical epidemiological study in eastern china. Front Oncol 2019;9:370. [DOI] [PMC free article] [PubMed] [Google Scholar]
- [3].Xie Y. Hepatitis B virus-associated hepatocellular carcinoma. Adv Exp Med Biol 2017;1018:11–21. [DOI] [PubMed] [Google Scholar]
- [4].Yang Y, Lu Q, Shao X, et al. Development of a three-gene prognostic signature for hepatitis b virus associated hepatocellular carcinoma based on integrated transcriptomic analysis. J Cancer 2018;9:1989–2002. [DOI] [PMC free article] [PubMed] [Google Scholar]
- [5].Liu H, Zhao P, Jin X, et al. A 9-lncRNA risk score system for predicting the prognosis of patients with hepatitis B virus-positive hepatocellular carcinoma. Mol Med Rep 2019;20:573–83. [DOI] [PMC free article] [PubMed] [Google Scholar]
- [6].Zhu GQ, Yang Y, Chen EB, et al. Development and validation of a new tumor-based gene signature predicting prognosis of HBV/HCV-included resected hepatocellular carcinoma patients. J Transl Med 2019;17:203. [DOI] [PMC free article] [PubMed] [Google Scholar]
- [7].Shi YM, Li YY, Lin JY, et al. The discovery of a novel eight-mRNA-lncRNA signature predicting survival of hepatocellular carcinoma patients. J Cell Biochem 2019;120:7539–50. [DOI] [PubMed] [Google Scholar]
- [8].He SY, Xi WJ, Wang X, et al. Identification of a combined RNA prognostic signature in adenocarcinoma of the lung. Med Sci Monit 2019;25:3941–56. [DOI] [PMC free article] [PubMed] [Google Scholar]
- [9].Xiong Y, Wang R, Peng L, et al. An integrated lncRNA, microRNA and mRNA signature to improve prognosis prediction of colorectal cancer. Oncotarget 2017;8:85463–78. [DOI] [PMC free article] [PubMed] [Google Scholar]
- [10].Xiang Y, Li C, Liao Y, et al. An integrated mRNA-lncRNA signature for relapse prediction in laryngeal cancer. J Cell Biochem 2019;120:15883–90. [DOI] [PubMed] [Google Scholar]
- [11].Kim SM, Leem SH, Chu IS, et al. Sixty-five gene-based risk score classifier predicts overall survival in hepatocellular carcinoma. Hepatology 2012;55:1443–52. [DOI] [PMC free article] [PubMed] [Google Scholar]
- [12].Povey S, Lovering R, Bruford E, et al. The HUGO Gene Nomenclature Committee (HGNC). Hum Genet 2001;109:678–80. [DOI] [PubMed] [Google Scholar]
- [13].Ritchie ME, Phipson B, Wu D, et al. limma powers differential expression analyses for RNA-sequencing and microarray studies. Nucleic Acids Res 2015;43:e47. [DOI] [PMC free article] [PubMed] [Google Scholar]
- [14].Goeman JJ. L1 penalized estimation in the Cox proportional hazards model. Biom J 2010;52:70–84. [DOI] [PubMed] [Google Scholar]
- [15].Tibshirani R. The lasso method for variable selection in the Cox model. Stat Med 1997;16:385–95. [DOI] [PubMed] [Google Scholar]
- [16].Wang Z, Wu Q, Feng S, et al. Identification of four prognostic LncRNAs for survival prediction of patients with hepatocellular carcinoma. PeerJ 2017;5:e374. [DOI] [PMC free article] [PubMed] [Google Scholar]
- [17].Hu H, Han XK, Long XR, et al. Prognostic nomogram for post-surgical treatment with adjuvant TACE in hepatitis B virus-related hepatocellular carcinoma. Oncotarget 2016;7:58302–14. [DOI] [PMC free article] [PubMed] [Google Scholar]
- [18].Zhou L, Rui JA, Wang SB, et al. Risk factors of microvascular invasion, portal vein tumor thrombosis and poor post-resectional survival in HBV-related hepatocellular carcinoma. Hepatogastroenterology 2014;61:1696–703. [PubMed] [Google Scholar]
- [19].Dai W, Feng Y, Mo S, et al. Transcriptome profiling reveals an integrated mRNA-lncRNA signature with predictive value of early relapse in colon cancer. Carcinogenesis 2018;39:1235–44. [DOI] [PubMed] [Google Scholar]
- [20].Yu X, Luo Y, Chen G, et al. Long noncoding RNA IGF2AS regulates high-glucose induced apoptosis in human retinal pigment epithelial cells. IUBMB Life 2019;71:1611–8. [DOI] [PubMed] [Google Scholar]
- [21].Zhang X, Chen K, Song C, et al. Inhibition of long non-coding RNA IGF2AS has profound effect on inducing neuronal growth and protecting local-anesthetic induced neurotoxicity in dorsal root ganglion neurons. Biomed Pharmacother 2016;82:298–303. [DOI] [PubMed] [Google Scholar]
- [22].Zhuo Z, Liu B, Bo L, et al. Inhibition of long noncoding RNA IGF2AS promotes angiogenesis in type 2 diabetes. Biomed Pharmacother 2017;92:445–50. [DOI] [PubMed] [Google Scholar]
- [23].Chen Q, Sun T, Wang F, et al. Long noncoding RNA IGF2AS is acting as an epigenetic tumor suppressor in human prostate cancer. Urology 2019;124:310e1–8. [DOI] [PubMed] [Google Scholar]
- [24].Zhang X, Zhang X, Hu R, et al. Prognostic implication and functional role of long noncoding RNA IGF2AS in human non-small cell lung cancer. J Cell Biochem 2017;doi: 10.1002/jcb.26113. [DOI] [PubMed] [Google Scholar]
- [25].Li X, Zheng L, Zhang F, et al. STARD13-correlated ceRNA network inhibits EMT and metastasis of breast cancer. Oncotarget 2016;7:23197–211. [DOI] [PMC free article] [PubMed] [Google Scholar]
- [26].Zha Y, Ding E, Yang L, et al. Functional dissection of HOXD cluster genes in regulation of neuroblastoma cell proliferation and differentiation. PLoS One 2012;7:e40728. [DOI] [PMC free article] [PubMed] [Google Scholar]
- [27].Chen QF, Kong JL, Zou SC, et al. LncRNA LINC00342 regulated cell growth and metastasis in non-small cell lung cancer via targeting miR-203a-3p. Eur Rev Med Pharmacol Sci 2019;23:7408–18. [DOI] [PubMed] [Google Scholar]
- [28].Liu Z, Kang Z, Dai Y, et al. Long noncoding RNA LINC00342 promotes growth of infantile hemangioma by sponging miR-3619-5p from HDGF. Am J Physiol Heart Circ Physiol 2019;317:H830–9. [DOI] [PubMed] [Google Scholar]
- [29].Daud M, Rana MA, Husnain T, et al. Modulation of Wnt signaling pathway by hepatitis B virus. Arch Virol 2017;162:2937–47. [DOI] [PubMed] [Google Scholar]
- [30].Zheng BY, Gao WY, Huang XY, et al. HBx promotes the proliferative ability of HL-7702 cells via the COX-2/Wnt/β-catenin pathway. Mol Med Rep 2018;17:8432–8. [DOI] [PubMed] [Google Scholar]
- [31].Xu Q, Lü Z, Wang X, et al. Secreted frizzled-related protein 5 suppresses aggressive phenotype and reverses docetaxel resistance in prostate cancer. J Investig Med 2019;67:1009–17. [DOI] [PubMed] [Google Scholar]
- [32].Sheng W, Zhang ZC, Shi DY, et al. Epigenetic silencing of SFRP5 promotes the metastasis and invasion of chondrosarcoma by expression inhibition and Wnt signaling pathway activation. Chem Biol Interact 2018;296:1–8. [DOI] [PubMed] [Google Scholar]
- [33].Xie Q, Chen L, Shan X, et al. Epigenetic silencing of SFRP1 and SFRP5 by hepatitis B virus X protein enhances hepatoma cell tumorigenicity through Wnt signaling pathway. Int J Cancer 2014;135:635–46. [DOI] [PubMed] [Google Scholar]
- [34].Lu L, Yu X, Zhang L, et al. The Long Non-Coding RNA RHPN1-AS1 promotes uveal melanoma progression. Int J Mol Sci 2017;18:226. [DOI] [PMC free article] [PubMed] [Google Scholar]
- [35].Zhu P, Li Y, Li P, et al. c-Myc induced the regulation of long non-coding RNA RHPN1-AS1 on breast cancer cell proliferation via inhibiting P53. Mol Genet Genomics 2019;294:1219–29. [DOI] [PubMed] [Google Scholar]
- [36].Qiu X, Lei Z, Wang Z, et al. Knockdown of LncRNA RHPN1-AS1 inhibits cell migration, invasion and proliferation in head and neck squamous cell carcinoma. J Cancer 2019;10:4000–8. [DOI] [PMC free article] [PubMed] [Google Scholar]
- [37].Duan H, Li X, Chen Y, et al. LncRNA RHPN1-AS1 promoted cell proliferation, invasion and migration in cervical cancer via the modulation of miR-299-3p/FGF2 axis. Life Sci 2019;13:116856. [DOI] [PubMed] [Google Scholar]
- [38].Zhang X, Yan Z, Wang L, et al. STAT1-induced upregulation of lncRNA RHPN1-AS1 predicts a poor prognosis of hepatocellular carcinoma and contributes to tumor progression via the miR-485/CDCA5 axis. J Cell Biochem 2020;doi: 10.1002/jcb.29689. [DOI] [PubMed] [Google Scholar]
- [39].Fen H, Hongmin Z, Wei W, et al. RHPN1-AS1 drives the progression of hepatocellular carcinoma via regulating miR-596/IGF2BP2 axis. Curr Pharm Des 2020;25:4630–40. [DOI] [PubMed] [Google Scholar]
- [40].Zheng S, Lv P, Su J, et al. Silencing of the long non-coding RNA RHPN1-AS1 suppresses the epithelial-to-mesenchymal transition and inhibits breast cancer progression. Am J Transl Res 2019;11:3505–17. [PMC free article] [PubMed] [Google Scholar]
- [41].Mao J, Tian Y, Wang C, et al. CBX2 regulates proliferation and apoptosis via the phosphorylation of YAP in hepatocellular carcinoma. J Cancer 2019;10:2706–19. [DOI] [PMC free article] [PubMed] [Google Scholar]
- [42].Liao X, Wang X, Huang K, et al. Integrated analysis of competing endogenous RNA network revealing potential prognostic biomarkers of hepatocellular carcinoma. J Cancer 2019;10:3267–83. [DOI] [PMC free article] [PubMed] [Google Scholar]
- [43].Li J, Gao JZ, Du JL, et al. Increased CDC20 expression is associated with development and progression of hepatocellular carcinoma. Int J Oncol 2014;45:1547–55. [DOI] [PubMed] [Google Scholar]
- [44].Zhuang L, Yang Z, Meng Z. Upregulation of BUB1B, CCNB1, CDC7, CDC20, and MCM3 in tumor tissues predicted worse overall survival and disease-free survival in hepatocellular carcinoma patients. Biomed Res Int 2018;2018:7897346. [DOI] [PMC free article] [PubMed] [Google Scholar]
- [45].Li L, Lei Q, Zhang S, et al. Screening and identification of key biomarkers in hepatocellular carcinoma: evidence from bioinformatic analysis. Oncol Rep 2017;38:2607–18. [DOI] [PMC free article] [PubMed] [Google Scholar]
- [46].Chen Z, Chen J, Huang X, et al. Identification of potential key genes for Hepatitis B virus-associated hepatocellular carcinoma by bioinformatics analysis. J Comput Biol 2019;26:485–94. [DOI] [PubMed] [Google Scholar]
- [47].Ng KT, Qi X, Kong KL, et al. Overexpression of matrix metalloproteinase-12 (MMP-12) correlates with poor prognosis of hepatocellular carcinoma. Eur J Cancer 2011;47:2299–305. [DOI] [PubMed] [Google Scholar]
- [48].He MK, Le Y, Zhang YF, et al. Matrix metalloproteinase 12 expression is associated with tumor FOXP3+ regulatory T cell infiltration and poor prognosis in hepatocellular carcinoma. Oncol Lett 2018;16:475–82. [DOI] [PMC free article] [PubMed] [Google Scholar]
- [49].Wang X, Zhou X, Liu J, et al. Genome-wide investigation of the clinical implications and molecular mechanism of long noncoding RNA LINC00668 and protein-coding genes in hepatocellular carcinoma. Int J Oncol 2019;55:860–78. [DOI] [PMC free article] [PubMed] [Google Scholar]
- [50].Li L, Dong L, Qu X, et al. Tripartite motif 16 inhibits hepatocellular carcinoma cell migration and invasion. Int J Oncol 2016;48:1639–49. [DOI] [PubMed] [Google Scholar]
- [51].Yan Y, Shen Z, Gao Z, et al. Long noncoding ribonucleic acid specific for distant metastasis of gastric cancer is associated with TRIM16 expression and facilitates tumor cell invasion in vitro. J Gastroenterol Hepatol 2015;30:1367–75. [DOI] [PubMed] [Google Scholar]
- [52].Hideyasu T, Kazumasa M, Masaomi I, et al. High expression level of preoperative serum Uroplakin III is associated with biologically aggressive bladder cancer. Asian Pac J Cancer Prev 2015;16:1539–43. [DOI] [PubMed] [Google Scholar]
- [53].Szymańska B, Matuszewski M, Dembowski J, et al. Uroplakin IIIa is a marker in bladder cancer but seems not to reflect chemical carcinogenesis. Biomed Res Int 2018;2018:8315410. [DOI] [PMC free article] [PubMed] [Google Scholar]
- [54].Li P, Fan H, He Q. Investigation of the clinical significance and prognostic value of microRNA-145 in human hepatocellular carcinoma. Medicine (Baltimore) 2018;97:e13715. [DOI] [PMC free article] [PubMed] [Google Scholar]
- [55].Zhang Y, Li Y, Jiang W, et al. The clinical significance of microRNA-122 in predicting the prognosis of patients with hepatocellular carcinoma: a meta-analysis validated by the Cancer Genome Atlas dataset. Medicine (Baltimore) 2019;98:e14810. [DOI] [PMC free article] [PubMed] [Google Scholar]
- [56].Shi W, Zhang Z, Yang B, et al. Overexpression of microRNA let-7 correlates with disease progression and poor prognosis in hepatocellular carcinoma. Medicine (Baltimore) 2017;96:e7764. [DOI] [PMC free article] [PubMed] [Google Scholar]
- [57].Elhendawy M, Abdul-Baki EA, Abd-Elsalam S. MicroRNA signature in hepatocellular carcinoma patients: identification of potential markers. Mol Biol Rep 2020;47:4945–53. [DOI] [PubMed] [Google Scholar]
- [58].Watany M, Badawi R, Elkhalawany W, et al. Study of Dickkopf-1 (DKK-1) gene expression in hepatocellular carcinoma patients. J Clin Diagn Res 2017;11:OC32–4. [DOI] [PMC free article] [PubMed] [Google Scholar]


