

Abstract
The micropeptide adropin encoded by the clock-controlled energy homeostasis–associated gene is implicated in the regulation of glucose metabolism. However, its links to rhythms of nutrient intake, energy balance, and metabolic control remain poorly defined. Using surveys of Gene Expression Omnibus data sets, we confirm that fasting suppresses liver adropin expression in lean C57BL/6J (B6) mice. However, circadian rhythm data are inconsistent. In lean mice, caloric restriction (CR) induces bouts of compulsive binge feeding separated by prolonged fasting intervals, increasing NAD-dependent deacetylase sirtuin-1 signaling important for glucose and lipid metabolism regulation. CR up-regulates adropin expression and induces rhythms correlating with cellular stress-response pathways. Furthermore, adropin expression correlates positively with phosphoenolpyruvate carboxokinase-1 (Pck1) expression, suggesting a link with gluconeogenesis. Our previous data suggest that adropin suppresses gluconeogenesis in hepatocytes. Liver-specific adropin knockout (LAdrKO) mice exhibit increased glucose excursions following pyruvate injections, indicating increased gluconeogenesis. Gluconeogenesis is also increased in primary cultured hepatocytes derived from LAdrKO mice. Analysis of circulating insulin levels and liver expression of fasting-responsive cAMP-dependent protein kinase A (PKA) signaling pathways also suggests enhanced responses in LAdrKO mice during a glucagon tolerance test (250 µg/kg intraperitoneally). Fasting-associated changes in PKA signaling are attenuated in transgenic mice constitutively expressing adropin and in fasting mice treated acutely with adropin peptide. In summary, hepatic adropin expression is regulated by nutrient- and clock-dependent extrahepatic signals. CR induces pronounced postprandial peaks in hepatic adropin expression. Rhythms of hepatic adropin expression appear to link energy balance and cellular stress to the intracellular signal transduction pathways that drive the liver fasting response.
Keywords: circadian rhythm, diet, glucagon, insulin, hepatocyte, glucose metabolism, peptide hormone, stress response, signal transduction
The human genome contains thousands of short ORFs (sORFs) predicted to encode “micropeptides” of <100 amino acids (1–3). The translation and functions of most have not been studied. Early studies indicate that micropeptides can function as “fine-tuners” of homeostatic processes and are potential leads for developing treatments against the metabolic diseases of obesity (2–4).
Adropin is a micropeptide translated from a unique highly conserved sORF in mammalian genomes (5). The 76-amino acid sORF (adropin1–76) is situated in exon 2 of the energy homeostasis–associated (ENHO) gene (5, 6). Bioinformatic analysis suggest adropin1–33 is a signal peptide targeting the secretory pathway (5, 7). Adropin34–76 is predicted to be released by proteolysis and is biologically active in rodents and cultured cells (5, 8). Experiments using RNAi knockdown suggest the orphan G protein–coupled receptor GPR19 is required for biological responses to adropin34–76 (9–11). However, the coupling of adropin34–76 with GPR19 is controversial (12). Yeast two-hybrid protein screens also identified an interaction between adropin30–76 and NB3/Contactin6, a noncanonical membrane-tethered Notch1 ligand, that may regulate neural development (13). The identity, binding, and signal transduction characteristics of cell-surface receptor(s) that mediate adropin's physiological actions remain under investigation.
The discovery of adropin was driven by liver transcriptomic data from C57BL/6J (B6) mice (5). Adropin expression is suppressed by diet-induced or genetically induced obesity at least in part by an increase in miR29b-directed degradation of Enho mRNA (5, 14, 15). The link to miR29b is interesting as the miR29 family also regulates liver lipid metabolism (16) and liver insulin sensitivity (17). Early studies of liver adropin expression identified rapid changes due to energy deficit and food intake (5). Enho transcription also appears to be controlled by regulatory components of the circadian clock driving rhythms in glucose and lipid metabolism (18). However, the impact of energy balance on liver adropin expression and its significance is controversial. For example, liver adropin expression in teleosts (bony fish) increases with fasting (19). Moreover, whether the sORF encoding adropin is translated in the liver is unclear (13). And whereas caloric restriction (CR) is an energy deficit, it increases plasma adropin concentrations in mice (20).
Several studies have implicated adropin in the control of glucose metabolism. In mouse and cell-based models, adropin regulates glucose production by the liver and fuel selection (glucose versus fat oxidation) in cardiac and skeletal muscles (5, 6, 11, 21–27). These results linking adropin to metabolic processes appear clinically relevant. Nonhuman primate (NHP) models are more closely related to humans compared with rodents (28). In rhesus macaques, fasting plasma adropin concentrations correlate with indices of liver glucose and lipid metabolism (29–31). The expression of ENHO in NHP liver suggests daytime peaks that anticipate nutrient intake and co-regulation with enzymes involved in carbohydrate and lipid metabolism (29). Plasma adropin concentrations in NHP also appear to peak during the daytime (18). Plasma adropin concentrations in NHP correlate with indices of metabolic dysregulation that indicate increased risk for type 2 diabetes and cardiovascular disease in humans (29). The relationship between plasma adropin concentrations and metabolism in humans is less clear. However, several groups have observed correlations with various indices of glucose and hepatic lipid metabolism (18, 32–38).
The current investigation had two objectives. First, open access liver transcriptome (RNA-Seq) data were used to further define the relationship between energy balance, circadian rhythm, and fed-fasting cycles on hepatic Enho expression. Whether the suppression of adropin expression in the liver has a causal relationship with the dysregulation of carbohydrate and lipid metabolism in obesity is not known. Thus, the second objective was to investigate the phenotype of liver-specific adropin knockout (LAdrKO) mice developed using B6 mice with a floxed adropin coding sequence (6).
Results
Fasting suppresses liver adropin expression
Our prior analysis used housekeeping genes to normalize Enho expression (5, 18). The technical limitations of using housekeeping genes to normalize gene expression are well-known (39, 40). Open access transcriptomic data (GSE107787) (41) verified that a 24-h fast suppresses hepatic Enho expression (Fig. S1A; mean ± S.E. in RPKM for fed, 22.8 ± 1.2; fasted, 7.6 ± 0.7; p < 0.001, n = 18/group). However, whereas our recent data suggest a circadian profile (18), there was no evidence of rhythms in liver Enho expression (Fig. S1B).
Whether adropin protein is expressed in the liver is controversial (13). Using GSE73554 (42), we profiled liver expression of mature Enho mRNA (Fig. S2A), intronic sequence indicating transcription (Fig. S2B), and mRNA in ribosomal fractions indicating translation (Fig. S2C) over a 24-h period. A modest but significant accumulation of mature Enho mRNA occurred late in the dark period (Fig. S2A), correlating with transcription (Fig. S2B; ρ = 0.534 between intronic and exonic Enho sequence, p < 0.001). Enho sequence was also detected in the ribosomal fraction at all zeitgeber time (ZT) points, suggesting translation of the adropin1–76 sORF at all times of the day (Fig. S2C).
Liver adropin expression requires extrahepatic clock activity
GSE73554 includes Bmal1/Arntl knockout mice lacking functional circadian clocks (42). Liver Enho expression was suppressed in Bmal1/Arntl knockout mice in this study in the fed condition. Another independent experiment also observed lower expression in Bmal1/Arntl mutants fed ad libitum (GSE117134) (43). GSE117134 included data from liver-specific rescue of Bmal1/Arntl (Liver-RE). Restoring Bmal/Arntl expression did not rescue Enho expression (mean ± S.E. for 24-h expression in controls, 18.3 ± 1.4; Bmal1/Arntl knockout, 5.2 ± 0.6; Liver-RE, 6.0 ± 0.7; effect of genotype, p < 0.001; p < 0.001 controls versus knockout and Liver-RE; n = 18/group) (Fig. S3A). There were significant differences in Enho expression between ZTs (p < 0.05) in this study, but no interaction between ZT and genotype (Fig. S3B).
CR up-regulates and enhances rhythms in liver adropin expression
Mice will exhibit feeding behavior throughout the light and dark cycle when given free access to food. Subjecting mice to CR induces compulsive “binge” feeding in which 90% of the calories provided are consumed within 1–2 h, leading to prolonged intervals of fasting (44–46). The current study used open access transcriptome data from mice exhibiting profound changes in liver gene expression, NADH (NAD) metabolism, and protein acetylation (GSE93903) (47). Liver samples were collected at 4-h intervals from “young” (19–29 weeks of age) and “middle-aged” (55–69 weeks of age) B6 mice of mixed sex (n = 3–6/group). Control mice were provided “normal diet” (ND) ad libitum, and other mice were adapted to a CR protocol providing 70% of normal calories at ZT12 for 25 weeks. Enho expression data were extracted and analyzed using a three-way analysis of variance (fixed variables: feeding condition, age, ZT).
CR increased the 24-h average for hepatic Enho expression (estimated marginal means, S.E., and 95% confidence interval for the effects of diet on Enho expression: ND mice, 90.1 ± 6.7 (76.8–103.5), n = 48; CR mice, 201.0 ± 6.3 (188.6–213.5), n = 56; p < 0.001). Aging is associated with a modest but significant increase in hepatic Enho expression (156.9 ± 6.8 (143.3–170.5), n = 46 for old versus 134.3 ± 6.1 (122.1–146.4), n = 58 for young, p = 0.005). CR effects on Enho expression were not significantly affected by age, and there was no significant effect of ZT per se.
There was a significant interaction between feeding condition (ND versus CR) and ZT (p = 0.001). CR induced a peak in Enho expression 8–12 h after food presentation (ZT20 and ZT24) (Fig. 1, A and B). Post hoc analysis using ND or CR data alone indicated significant differences of expression between ZT in the CR group only (p < 0.05) (Fig. 1B).
Figure 1.

A and B, liver Enho expression in B6 mice allowed unrestricted access to ND (A) (n = 56) or subject to CR (B) for 25 weeks (n = 47). C, heatmap of genes showing positive or negative correlations with Enho expression in the liver. The data shown in A–C are from young (Y, 19–29 weeks of age) or older (O, 55–69 weeks of age) mice subjected to ND or CR conditions. Liver samples were collected at the ZT indicated on the x axis (n = 3–6/group). Enho expression correlates positively with phosphoenolpyruvate carboxykinase (Pck1), which is rate-limiting for gluconeogenesis (D) but is incompatible with expression of genes involved de novo lipogenesis, such as fatty acid synthase (Fasn) (E). Note that the units of expression in D and E are z scores used for the heatmaps shown in C, whereas in A and B, Enho expression is shown as probe intensity. F, Enho expression relative to vehicle control in B6 mice 24 h after treatment with low, medium, or high doses of acetaminophen (APAP; at 169, 225, or 300 mg/kg), isoniazid (INZ; at 22, 44, or 88 g/kg), or paraquat (PQ; at 12.5, 25, or 50 mg/kg) (n = 5/group). Data in A–F were drawn from GSE93903, and data in G are from GSE51969. Correlation coefficients are shown for all data and for ND or CR separately. a, p < 0.05 versus ZT12, ZT16; b, p ≤ 0.05 versus ZT12, ZT16. In C, the heatmap was generated using z scores. In D and E, the values shown are z scores. *, p < 0.05 versus vehicle; **, p < 0.01 versus vehicle.
Liver adropin expression correlates with cellular stress responses
Two complementary studies were performed to identify metabolic pathways correlating with low or high Enho expression. In the first study, a correlation matrix was computed using a correlation co-efficient of 0.6 as a cut-off. This approach identified 64 genes positively correlated with that of Enho and 253 genes whose expression correlated negatively. The biological functions of these genes were queried against the ToppGene server (RRID:SCR_005726), which returned the lists of enriched genes and pathways under a low false discovery rate, p ≤0.05 cut-off level (Fig. S4, A and B).
Genes positively associated with Enho regulate enzymatic protein cleavage/degradation and amino acid biosynthesis. Taking a candidate gene approach, a strong positive correlation was observed between Enho and phosphoenolpyruvate carboxykinase 1 (Pck1), the main control point in the regulation of gluconeogenesis induced during energy deficit (Fig. 1, C and D). Other genes correlating positively associate with insulin sensitivity and immune responses (Fig. 1D). Genes negatively associated with adropin are involved in triglyceride metabolism (Fig. 1, C and E). Increases in Enho expression with CR thus correlate with the suppression of lipogenic pathways that occurs with CR (47). Other genes of interest that exhibit strong negative correlations are involved in glycogen synthesis, glycolysis, and appetite control (Fig. 1C).
A limitation of this approach is the arbitrary selection of cut-off values and that it only identifies “enriched” and not “depleted” genes. To further validate the results and allow unbiased discovery of enriched and depleted genes, we performed a genome-wide gene set enrichment analysis using the “fgsea” package in R as described above. Four independent studies were performed using (i) all 5529 biological gene sets and subsets belonging to (ii) REACTOME, (iii) KEGG, or (iv) the remaining lists of the genes. The top 20 enriched (normalized enrichment score > 0) and/or depleted gene lists/pathways are shown in Fig. S4 (C–E).
This analysis also found that liver Enho expression is incompatible with lipid and triglyceride metabolism. It also correlates positively with amino acid metabolism, translation, and ribosomal functions. Interestingly, Enho expression also correlates with genes that respond to viral infection, supporting a role as part of the cellular stress response.
To further investigate the relationship between liver Enho expression and stress responses, we analyzed data from B6 mice treated with acetaminophen, isoniazid, or paraquat (GSE51969) (48). Acetaminophen and paraquat trigger production of reactive oxygen species, oxidative stress, and mitochondrial dysfunction (49, 50). Isoniazid-induced liver toxicity is still not well-understood, but it also results from mitochondrial dysfunction and inflammatory responses (51). Treatment with acetaminophen or paraquat resulted in dose-dependent increases in liver Enho expression (Fig. 1F).
Deletion of liver Enho expression
To investigate the physiological functions of liver adropin, the adropin1–76 sORF in exon 2 of the Enho gene was targeted using the Cre/LoxP system (Fig. 2A) (6). Expression in hepatocytes was suppressed using B6.Cg-Speer6-ps1Tg(Alb-cre)21Mgn/J transgenic mice (52). Liver Enho gene expression was reduced ∼80% in LAdrKO mice relative to Enhofl/fl WT controls; expression in other tissues was normal (Fig. 2B). Adropin immunoreactivity is detected in crude brain lysate by Western blotting (Fig. 2C) (53); adropin immunoreactivity could be detected using immunoprecipitation in WT but not LAdrKO liver samples (Fig. 2C). LAdrKO mice have normal body mass and composition determined by NMR (Fig. 3, A and B). Liver weight and histology were also normal in LAdrKO (data not shown), indicating that adropin is not essential for normal liver development. Adropin expression is highest in the nervous system (5, 13, 53–56), with low expression in the liver. Fasting plasma adropin concentrations were similar in LAdrKO and control mice, suggesting compensation from adropin secreted by other tissues (data not shown).
Figure 2.

A, targeting strategy for using Cre/loxP to suppress liver Enho expression. A pair of loxP sites were inserted 5′ and 3′ of the adropin sORF in exon 2. A Frt-flanked neomycin cassette used to select recombinant embryonic stem cells was used for blastocyst injections. This was removed from founder mice using B6;SJL-Tg(ACTFLPe)9205Dym/J mice expressing FLP recombinase in all cell types. ACTFLPe;Enhofl/+ offspring were then crossed with WT B6 mice to remove the transgene. For the current study, Enhofl/+ mice were crossed with Alb-Cre mice; subsequent generations were mated to produce Enhofl/fl mice (controls) and Alb-Cre; Enhofl/fl (LAdrKO) mice. B, comparison of Enho expression in liver, skeletal muscle (SM), hindbrain (HB), and forebrain (FB) in LAdrKO and littermate control mice. Data are expressed related to controls. ***, p < 0.001; *, p < 0.05; n = 8/group. C, immunoprecipitation using a monoclonal adropin antibody detected adropin protein in liver from WT mice, but not from LAdrKO mice.
Figure 3.

Suppression of hepatic adropin expression associates with dysregulation of glucose metabolism in the absence of changes in body weight or composition. A and B, body weight and composition in adult (9–10-month) male (n = 9 for control, n = 8 for LAdrKO mice) and female (B, n = 8/group) animals. FFM, fat-free mass; FM, fat mass. C–G, pyruvate tolerance test data showing increased glucose excursion in LAdrKO compared with control mice. Data were collected at baseline and after i.p. injection of pyruvate (2 g/kg) in males (C–E) and female (F and G) mice fasted for 6 h. C and F, fasting blood glucose; D, blood glucose and increase in blood glucose above baseline; E and G, area under the curve. H–L, glucose tolerance test (2 g/kg injected i.p. after a 6-h fast) results for males (H–J) and females (K and L). H and K, fasting blood glucose; I, blood glucose and increase in blood glucose above baseline (D); J and K, area under the curve. For males, n = 8 for controls, n = 7 for LAdrKO mice; for females, n = 8/group. D and I, Error bars, S.E.
Whereas gene expression data suggest an association with stress responses and lipid metabolism, there was no evidence of dyslipidemia or liver injury in LAdrKO mice fed low- or high-fat diets (data not shown). Expression of genes involved in de novo lipogenesis and triglyceride production, circulating lipids, and plasma markers of liver injury (alanine aminotransferase and aspartate transaminase) were normal in LAdrKO mice (data not shown).
Increased glucose production in LAdrKO mice
Based on data showing that adropin34–76 suppresses gluconeogenesis in primary cultured hepatocytes (23, 27, 57), we hypothesized that suppressing liver adropin expression would dysregulate glucose metabolism. As predicted, glucose excursions following i.p. injections of pyruvate in male and female LAdrKO mice were more pronounced (Fig. 3, C–G). A modest but significant impairment of glucose tolerance was also observed in females (Fig. 3, H–L). Expression of Pck1 was increased in LAdrKO mice of both sexes compared with age-matched controls (Fig. S5A). The effect of genotype on Pck1 expression cannot be attributed to differences in fasting-responsive pancreatic hormones. Fasting plasma glucagon and insulin levels were normal in LAdrKO mice (Fig. S5B and data not shown). Endogenous glucose production was also increased by approximately one-third in hepatocytes cultured from LAdrKO mice (Fig. 4A).
Figure 4.

Increased glucose production by primary cultured mouse hepatocytes derived from LAdrKO compared with floxed control mice. A, comparison of glucose production induced by glucagon and pyruvate in control and LAdrKO mice. Two doses were used for the study shown (10 and 100 ng/ml), both with 5 mm pyruvate. *, p < 0.05 versus controls. (All), combined data from 10 and 100 ng/ml doses of glucagon. B and C, gene expression data for primary cultured hepatocytes from LAdrKO and control mice. Data shown are at baseline (0 ng/ml glucagon) or treated with 100 ng/ml glucagon. B, Enho expression is reduced by >90% in primary cultured hepatocytes from LAdrKO mice compared with floxed WT controls. C, Pck1 expression is increased by ∼40% in primary cultured hepatocytes from LAdrKO compared with floxed controls. D, PGC1A expression is increased with glucagon treatment, but this response is not significantly different between primary cultured hepatocytes from LAdrKO and floxed WT controls.
Gene expression data from primary cultured hepatocytes confirmed suppression of Enho expression in LAdrKO mice (Fig. 4B). We next measured expression of gluconeogenic enzymes (fructose-1,6-bisphosphatase 1 and 2, Pck1, and glucose-6-phosphatase), glycolysis (hexokinase-2), and membrane transport of glucose (Slc2a2). Pck1 expression was increased by about one-third in LAdrKO primary hepatocytes, irrespective of glucagon treatment (Fig. 4C). Hexokinase-2 expression (Hk2) was similarly increased in LAdrKO mice (data not shown). However, expression of the other genes in LAdrKO mice was normal.
The liver gluconeogenic response to fasting is regulated by several signal transduction pathways affecting gene transcription. The NAD-dependent deacetylase sirtuin-1 (SIRT1) has been implicated in the control of gluconeogenesis (58, 59). The transcriptional co-activator peroxisome proliferator–activated receptor γ co-activator 1-α (PGC1A) has a critical role in the liver response to fasting, promoting gluconeogenesis and lipid catabolism (60, 61). Whereas both SIRT1 and PGC1A expression increased with glucagon treatment, this response was not affected by genotype (Fig. 4D and data not shown).
Adropin deficiency enhances hepatic responses to glucagon in vivo
The primary cultured hepatocyte data suggest an enhanced response of gluconeogenic enzymes to glucagon. Whether liver adropin deficiency alters glucagon signaling in vivo was investigated using a modified glucagon tolerance test (62). Food was removed for 1 h, and mice were then administered an i.p. injection of glucagon (250 µg/kg). Tissue and blood samples were collected at baseline (t = 0 min) and then after 60 or 180 min. Insulin and glucose data were assessed using a two-way analysis of covariance (fixed variables: genotype and treatment; covariates: age and body weight (for glucose), age, body weight, and glucose (for insulin)). Age and body weight data for the mice used in the experiment are provided as supporting information (Table S1). The groups were evenly matched for age and body weight.
Glucagon treatment significantly increased blood glucose concentrations (p < 0.001) and plasma insulin concentrations (p < 0.05) (Fig. 5, A–D). Whereas there was no effect of genotype, there was a trend (p = 0.09) for an interaction between treatment and genotype for insulin values. Depletion of liver glycogen due to increased glycogenolysis was not significantly different between genotypes (Fig. S6).
Figure 5.
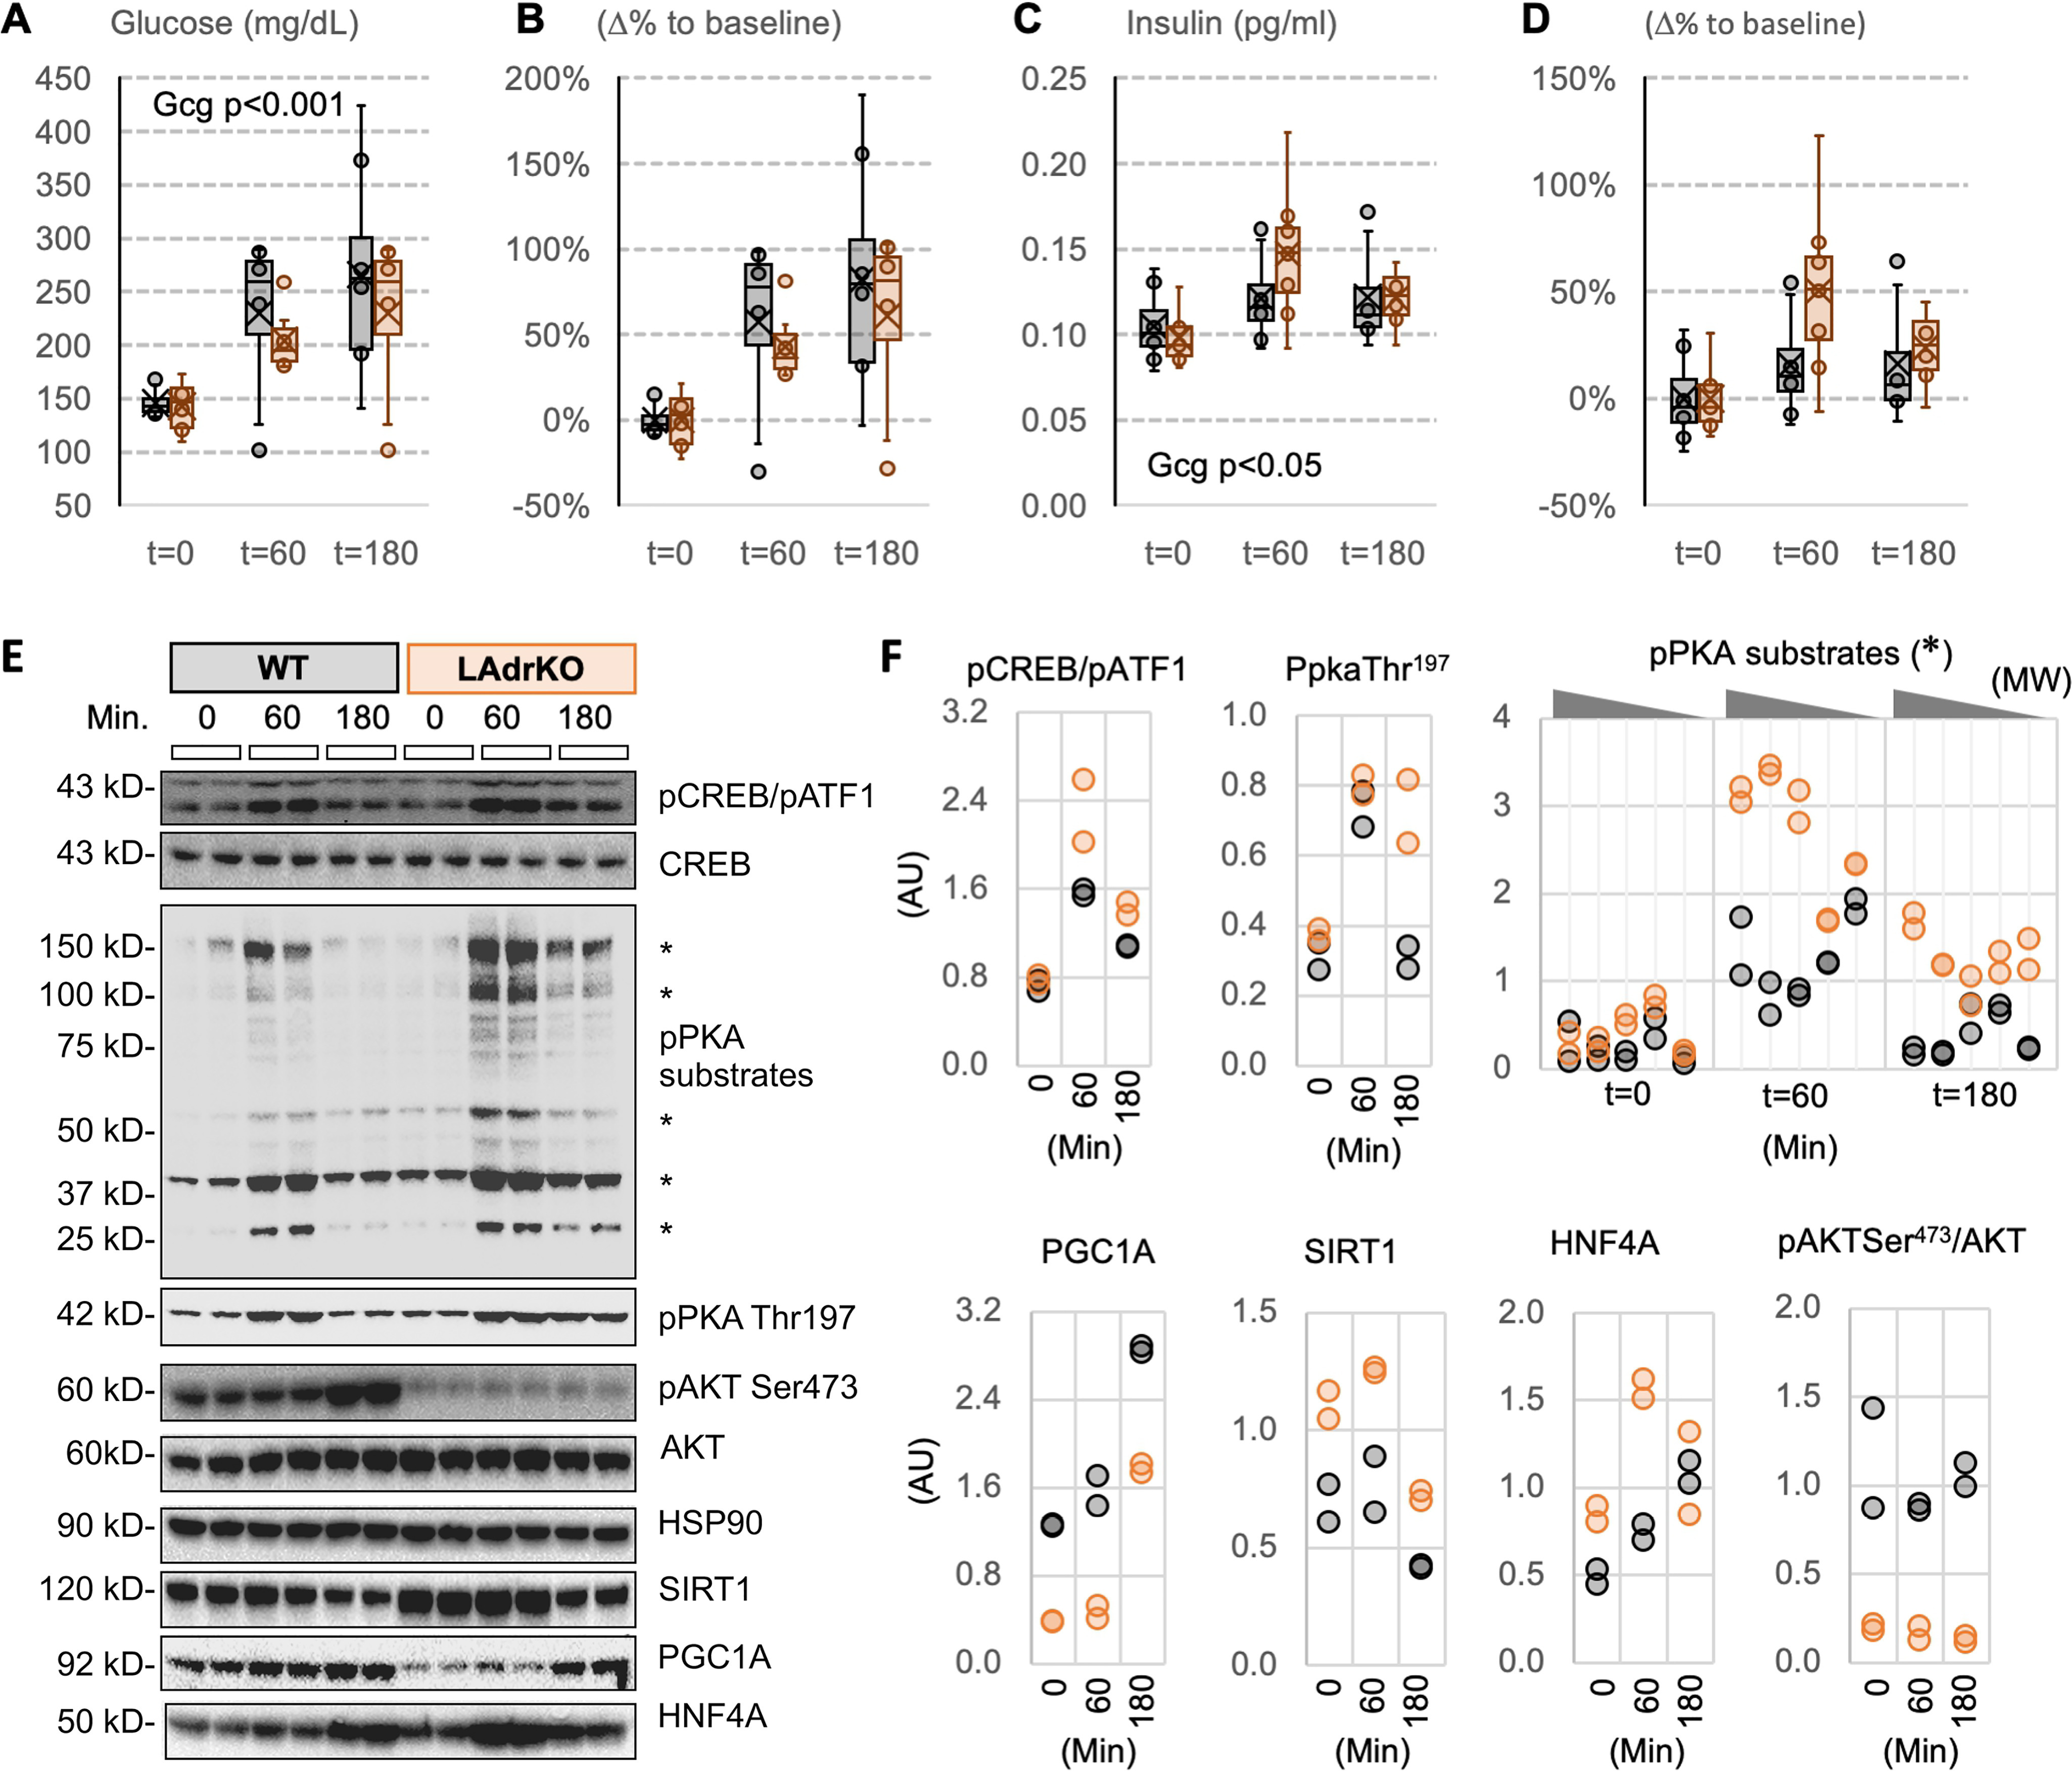
Liver fasting-responsive intracellular signaling pathways exhibit enhanced sensitivity in LAdrKO mice during a glucagon tolerance test. Male LAdrKO and WT control mice were food-deprived for 1 h and then administered an i.p. injection of glucagon (250 µg/kg). Blood and tissue samples were collected at the times indicated. A and B, blood glucose levels (A) and percentage change in blood glucose levels relative to baseline within genotype (B). C and D, plasma insulin concentration (C) and percentage change in plasma insulin concentration within genotype (D). E, Western blotting data showing changes in activity of fasting-responsive signaling pathways in liver at baseline (t = 0) and 60 or 180 min after glucagon injections. HSP90 was used as a loading control. Note the two bands recognized by the pCREB antibody; the top band is pCREB-Ser133, and the bottom band is the phosphorylated form of a CREB-related protein (ATF-1). F, scatterplots of quantified data expressed as a ratio; pCREB Ser133 and pATK Ser473 are normalized against total protein, and other proteins measured are normalized using HSP90. Phosphorylation of proteins with PKA consensus sequences following glucagon treatment was more robust in liver lysates from LAdrKO mice (bands used for quantitation are indicated by asterisks in E). Phosphorylation of Thr197 of PKA required for activation remained elevated at the 180-min time point. AKT activity was markedly reduced in LAdrKO, irrespective of glucagon treatment, indicated by low phosphorylation of Ser473. Glucagon treatment increased expression of PGC1A and HNF4A. These effects on PGC1A and HNF4A protein levels were preserved in LAdrKO mice. However, PGC1A protein levels were lower at all time points, whereas HNF4A and SIRT1 expression were initially higher in LAdrKO mice.
Glucagon receptors (GCGRs) couple to G protein complexes containing stimulatory (Gs) subunits (63). GCGR activation increases adenylate cyclase activity, accumulation of cAMP, and activation of cAMP-dependent protein kinase A (PKA) signal transduction (63). Whereas the specific mechanism remains unclear, adropin34–76 appears to suppress cAMP-dependent PKA signal transduction in primary cultured hepatocytes (23). Analysis of PKA signaling using a PKA substrate–specific antibody indicated an enhanced response in livers of LAdrKO mice at t = 60 min and t = 180 min (Fig. 5, E and F). Phosphorylation of CREB on Ser133, a PKA substrate, also appeared to be higher at t = 60 min and t = 180 min (Fig. 5, E and F). Phosphorylation of PKA on Thr197 in the activation loop of the catalytic subunit is required for normal function (64). Glucagon treatment increased Thr197 phosphorylation in this study, and this effect was prolonged in LAdrKO mice (Fig. 5, E and F).
SIRT1 protein expression was increased in LAdrKO mice compared with controls at baseline and t = 60 min (Fig. 5, E and F). HNF4A and FOXO1 protein levels were also increased in LAdrKO, particularly at baseline and t = 60 min (Fig. 5 (E and F) and data not shown). However, whereas glucagon treatment appears to increase PGC1A protein irrespective of genotype, overall expression levels were lower in LAdrKO mice (Fig. 5, E and F).
At the level of gene expression, there was an effect of genotype on Pgc1a mRNA expression (25% increase) but no effect of glucagon treatment (Fig. 6A). Whereas glucagon treatment appeared to increase the expression of SIRT1 (Fig. 6B) and HNF4A (Fig. 6C), the differences were not statistically significant. Most of the genes involved in gluconeogenesis and glycolysis were expressed at similar levels (Fig. S7).
Figure 6.

Expression of transcription factors regulating fasting responses during the glucagon tolerance test in control and LAdrKO mice. The liver samples were from the same animals shown in Fig. 5. Data are expressed as a ratio of WT controls at baseline. Statistical analysis used a two-way analysis of variance (time after injection, genotype) adjusted for age and body weight.
Activation of protein kinase B/AKT is essential for insulin to reduce glucose production by the liver (65). Adropin34–76 treatment improves hepatic insulin sensitivity in diet-induced obese B6 mice, activating AKT as indicated by phosphorylation on Ser473 (8, 23). Ser473-phosphorylated AKT expression was lower in livers of LAdrKO mice, irrespective of glucagon challenge (Fig. 5E).
Constitutive adropin expression dysregulates the liver fasting response
We next compared PKA signaling in transgenic mice constitutively expressing adropin (AdrTG) and WT littermates in fed and fasted conditions. There was a trend (p < 0.1) for higher Enho expression in AdrTG; however, this relatively short-term fast did not significantly affect liver Enho expression (Fig. 7A). It did, however, increase Pck1 expression nearly 2-fold, irrespective of genotype (Fig. 7A). There was an increase in Thr197 phosphorylation of PKA as well as in the phosphorylation of several PKA substrates, including CREB (Fig. 7, B and C). This response was not observed in AdrTG mice. This phenotype was not limited to PKA signaling, as fasting-induced increases in HNF4A and FOXO1 were also prevented in AdrTG mice (Fig. 7, B and C). However, this deficit does not translate to major changes in circulating insulin or glucagon concentrations in fed or fasted conditions (Fig. 7, D and E). Fasting had no significant effect on circulating glucagon concentrations. This finding is consistent with a previous study reporting that fasting of 24 h is required to increase glucagon concentrations in lean B6 mice (66). However, there was a trend (p < 0.1) for lower plasma glucose levels in AdrTG mice (Fig. 7F). Administration of adropin34–76 to fasted mice resulted in a similar outcome, disrupting the normal responses of PKA signaling to fasting (Fig. 8, A and B).
Figure 7.

Constitutive expression of adropin dysregulates signal transduction pathways involved in the liver fasting response. Adropin transgenic (AdrTG) and WT littermate control (WT) mice were provided ad libitum access to regular chow (Fed) or fasted for 6 h (Fast). A, measurement of liver Enho and Pck1 mRNA expression. There was a trend (p < 0.1) for increased Enho expression in AdrTG; Pck1 expression increased with fasting (p < 0.001), but there was no significant effect of genotype. B and C, analysis of signaling pathways involved in the fasting response showed changes predicted to occur with fasting in WT but not AdrTG mice. B, Western blotting; C, scatterplots showing quantitation of the indicated bands. Fasting increased CREB Ser133 and ATF-1 phosphorylation, phosphorylation of proteins on Ser/Thr residues with Arg at the −3 position (pPKA substrates indicated by the asterisk), and phosphorylation of PKA on Thr197. Fasting also increased levels of HNF4A and FOXO1. The response of these proteins in AdrTG mice to fasting was atypical, whereas PGC1A expression declined with fasting in WT mice it declines in AdrTG; the increase in FOXO1 in WT mice with fasting was also not observed in AdrTG mice. The effects of genotype and fasting on serum concentrations of insulin (D), glucagon (E), and glucose (F) are shown. AdrTG mice exhibit a trend for lower glucose levels irrespective of fed condition. For D and E, n = 7/group. The mice used for this experiment were females.
Figure 8.

A single injection of adropin34–76 leads to an atypical response of the cAMP-PKA signaling pathways during fasting. A, Western blotting showing expression of the proteins indicated to the right. B, scatterplots of quantitated data. The box and whisker graph below the plot titled pPKA substrates shows data for all bands grouped by genotype and treatment (fed or fasted with or without adropin treatment). This graph shows the clear effect of fasting to increase the phosphorylation of PKA substrates and shows that this effect is attenuated with adropin34–76 treatment. For the experiment, six WT littermates and six LAdrKO mice (males) were fed ad libitum (Fed, n = 2) or fasted for 6 h (n = 4). Mice indicated by the plus sign received a single i.p. injection of 450 nmol/kg adropin34–76 or vehicle (0.9% saline plus 0.1% BSA) 1 h before tissue collection.
The AdrTG transgene uses a ubiquitously active promoter that will induce expression in the pancreas. Whereas circulating insulin levels appeared to be normal, we investigated whether adropin regulates glucose-stimulated insulin secretion. However, no significant effect was observed in the response of glucose-stimulated insulin secreted of cultured islets to 10 ng/ml adropin34–76 (data not shown).
Discussion
These results support the hypothesis that adropin expressed by hepatocytes is a critical modulator of the liver fasting response. Open access liver transcriptome data indicate that liver adropin expression is labile in response to transitions between different states of energy balance. They also indicate that nutrient intake and cellular stress are positive signals. Data from the phenotyping of LAdrKO mice indicate that adropin may function to regulate liver responses to fasting, acting to moderate glucagon action in the liver. The absence of a response of cAMP-PKA pathways in the liver of AdrTG to systemic signals of energy deficit is also remarkable. These observations suggest a heretofore unrecognized critical regulator of signaling pathways mediating adaptive changes in liver metabolism during transitions between energy deficit and nutrient sufficiency.
Our recent investigations of adropin function suggest that it acts as a co-regulator of liver glucose production (23). This previous study primarily examined the effects of pharmacological doses on liver metabolism in the context of diet-induced obesity and insulin resistance. However, the role of adropin in the liver in the homeostatic control of glucose production in physiological conditions has remained poorly defined. The current study therefore had two primary objectives. The first was to verify that liver adropin expression is indeed responsive to changes in energy balance. This goal was achieved by surveying open access transcriptome databases. One strength of this approach is that combining data from independent laboratories controls for stochastic variables such as diet, climate, housing, and microbiota that can influence the metabolic phenotype of inbred mouse strains. The second goal was to determine whether loss of adropin expression in hepatocytes affects glucose homeostasis. This goal was achieved using the Cre/LoxP system to suppress adropin synthesis in the liver.
Liver adropin expression is sensitive to energy deficit and cellular stress responses
Results from our analysis of transcriptome data verified that the adropin sORF is translated in the liver. Moreover, liver adropin expression rapidly responds to changes in the balance of energy intake and expenditure. The expression profile of the Enho transcript in the liver is however complex. Previous investigations suggested effects of energy balance, dietary macronutrients, and regulatory elements of circadian clocks (5, 18). The current study confirms that energy balance has a significant role in determining adropin expression in the liver.
Our assessment of liver adropin expression in animals experiencing a range of conditions suggests that increases in expression correlate with cellular stress responses. This finding is consistent with other data suggesting a role for adropin in situations of oxidative stress. Adropin has been reported to protect against diet-induced nonalcoholic steatohepatitis by activating Nrf2 (67). Adropin also protects the vascular endothelium during ischemia/reperfusion, activating the reperfusion injury salvage kinase pathway (68). Whereas adropin expression appears to be incompatible with situations where liver de novo lipogenesis is stimulated, loss of adropin in the liver does not appear to result in marked changes of lipid metabolism as assessed by measurement of gene expression or plasma lipid load.
Most investigations of adropin expression in the liver have used mouse models. It is important to distinguish between experiments that investigated acute responses and those that examined the consequences of long-term exposure to diets differing in macronutrient composition. Studies investigating responses to fasting and refeeding suggest that stimulation is most pronounced with high-energy (high-fat/high-sucrose) diets and that this difference can persist for up to 4 weeks (5). In rodent models, the consumption of high-energy refined diets rich in dietary fats and refined sugars results in dysregulation of metabolism and oxidative stress (69). In the current study, the analysis of adropin expression in mice fed ad libitum or CR and responses to drug-induced liver injury suggests a positive correlation with cellular stress responses. At one level, increases in liver adropin synthesis may therefore be a response to nutrient load and oxidative stress.
On the other hand, chronic consumption of high-fat/high-sucrose diets resulting in hepatic insulin resistance suppresses liver adropin expression (5, 14). Adropin expression is also suppressed in genetic models of obesity, a response that is prevented by reducing calories to delay obesity onset (5). These results indicate that chronic excess consumption and caloric overload lead to a dysregulation of adropin expression. A recent study provided a mechanism for the suppression of liver adropin expression in obesity. A microRNA (miR29) up-regulated in multiple rodent models targets the Enho transcript for degradation (15). Collectively, these suggest a decline in expression as obesity develops. Moreover, Enho expression is regulated at the level of transcription and mRNA stability. The phenotype of LAdrKO mice suggests that the suppression of adropin synthesis in the liver is consequential and could contribute to the dysregulation of glucose metabolism.
The expression profile of adropin during CR suggests dynamic responses to shifts in energy balance. Expression clearly peaks after food presentation and late in the dark phase and then declines during the period of fasting. Overall, the 24-h average of adropin expression appears to increase during CR. Indeed, CR has also been reported to increase circulating adropin levels (20). These observations suggest that factors other than signals of energy balance drive adropin expression and could indicate a role for adropin in signaling metabolic adaptations to CR. Indeed, consumption of a single large meal corresponding to 90% of daily caloric intake could place the liver under duress requiring adaptation, when compared with processing several small meals throughout the day.
The parent study used for comparing Enho expression in ad libitum and CR conditions compared B6 mice from different age groups (47). At termination, mice in the “young” age group were 10–12 months old, whereas mice in the “old” age group were 18–22 months old. In human terms, 10–12 months is considered middle-aged, whereas 18–22 months is considered old. Surprisingly, there was a modest (15%) but significant increase in liver Enho expression in the old group. The significance of this finding is not clear. There was, however, no significant impact of age group in the response of liver Enho expression to CR.
Two families of nuclear receptors appear to regulate Enho transcription (18). The retinoid acid receptor–related orphan receptors (RORs) are transcriptional activators that appear to activate Enho transcription. The transcriptional repressor Rev-erb was proposed to inhibit Enho transcript expression by competing for binding to ROR response elements. RORs and Rev-erb function as regulatory elements of the circadian clock and also work to regulate rhythms in the expression of genes encoding enzymes involved in liver carbohydrate and lipid metabolism (70). We reported a modest rhythm in liver adropin expression with a peak late in the dark period in male AKR/J mice, (18). However, the evidence for a circadian profile in the GSE databases explored herein is weak. This discrepancy could be due to differences between mouse strains (AKR/J versus B6) and in methods of measuring gene expression (transcriptomic data versus normalizing using a single housekeeping gene).
Adropin expression in the liver is markedly reduced in mice lacking functioning clocks. However, a functioning liver clock is not sufficient to restore normal expression. The liver clock is also not sufficient to restore expression of a large number of liver genes normally exhibiting circadian profiles (43). Rhythmicity in the expression of these genes has been suggested to be dependent on cues emanating from other tissues. It is therefore possible that suppression of adropin expression in clock-deficient mice does not reflect regulation by the circadian clock expressed in hepatocytes.
B6 mice lacking the CLOCK transcription factor develop a metabolic disorder that includes obesity and hepatic steatosis (71). Suppression of Bmal1/Arnlt results in fasting hyperglycemia and insulin resistance (72–74) and an accelerated aging phenotype that includes increases in oxidative stress and inflammation (75). Suppression of liver adropin expression in clock mutant mice may therefore be a secondary consequence of metabolic dysregulation.
Adropin expressed in hepatocytes regulates the fasting response
Targeted deletion of adropin from the mouse liver results in increased gluconeogenesis. Data supporting this conclusion came from live mice and from primary cultured hepatocytes. Surprisingly, however, this phenotype appears to occur in the context of a paradoxical reduction of PGC1A expression. PGC1A protein levels were markedly reduced in the liver of LAdrKO (Fig. 5E). PGC1A is a transcriptional co-activator that regulates the expression of genes involved in glucose and lipid metabolism during fasting. PGC1A expression in the liver is increased in mouse models of type 2 diabetes (61). Conversely, suppression of PGC1A in the liver using RNAi results in fasting hypoglycemia (76). The increases in glucose production thus cannot be explained by increased expression of PGC1A. How reduced PGC1A expression would impact other aspect of liver metabolism was also not determined.
In our laboratory conditions, glucagon treatment increased PGC1A protein levels in vivo and PGC1A mRNA expression in primary cultured hepatocytes, irrespective of genotype. The lower levels of PGC1A protein observed in the liver of LAdrKO mice are thus not explained by reduced mRNA levels. The mechanisms explaining lower PGC1A protein expression in the liver of LAdrKO mice were not determined in this study. However, PGC1A protein levels are regulated post-translationally. For example, nuclear PGC1A is targeted for degradation in proteasomes after activation by acute oxidative stress (77).
It is also important to acknowledge that other interpretations of the pyruvate tolerance test results are possible (78). Pyruvate is a substrate in many tissues and could alter glucose concentrations by competing for oxidative processes. However, the PTT data are supported by other observations that are consistent with our interpretation of increased glucose production. LAdrKO mice exhibit changes in their responses of plasma insulin, blood glucose, and expressions of liver signaling enzymes, suggesting enhanced glucagon responses. In addition, primary cultured hepatocytes from LAdrKO mice also exhibit increased glucose production.
Another intriguing observation is that the responses of canonical liver signal transduction pathways regulating the fasting response are essentially absent in mice constitutively expressing adropin. The fasting response of the liver involving increases in HN4A and FOXO1 protein expression and activation of PKA were clearly suppressed in LAdrKO mice. A decline in AKT activity indicated by Ser473 phosphorylation was also attenuated. Indeed, AKT activity appears to be lower in LAdrKO mice. This suggests that adropin expressed in hepatocytes is required to maintain normal AKT signaling. Moreover, this could also indicate a state of insulin resistance, given AKT's role in mediating insulin action (65).
The changes observed in signal transduction pathways implicated in glycemic control did not affect circulating levels of pancreatic hormones or glucose. This finding has precedent, as several studies have suggested that mice can compensate for profound changes in liver signal transduction pathways. The control of hepatic glucose metabolism by insulin involves direct and indirect pathways (79). Constitutive activation of PKA in the liver results in fasting hyperglycemia and evidence of increased glycogenolysis and gluconeogenesis (80). However, suppression of PKA activity by overexpression of inhibitory subunits has no effect on fasting-induced changes in Pck1, Pgc1A, G6pase, or Gck expression; circulating levels of insulin, NEFA, and TG were also normal in the fasted condition and after refeeding (81). Inhibition of liver PKA can result in lower glucose levels (79, 81). Compensatory mechanisms thus allow for normal fasting and fed levels of glucose, insulin, and lipids. A trend for lower fasting glucose was observed in AdrTG mice. However, whether this results from reduced glucose production or increased clearance was not determined.
The suppression of liver adropin expression with fasting suggests an association with catabolic processes. Declining adropin expression during fasting is associated with suppression of lipogenesis and activation of glucose production. However, when data from mice fed ad libitum and CR are viewed collectively, adropin expression correlates negatively with lipogenesis and positively with glucose production. This comparison draws from data in mice responding to a range of conditions (fasting, normal voluntary feeding behavior, binge feeding leading to overconsumption). Adopin expression thus appears to associate with conditions where the liver could be producing glucose. Elevated adropin expression may thus correlate with situations in which glucose production is increased. In this situation, adropin may function to “fine-tune” the response of liver to signals regulating gluconeogenesis. It is however important to note that this correlation is limited to gene expression.
Dysregulation of liver gluconeogenesis is a major contributor to fasting and postprandial hyperglycemia observed in type 2 diabetes (82–84). This facet of type 2 diabetes has been attributed to insulin resistance in hepatocytes (83, 84) and hyperglucagonemia resulting from dysregulation of pancreatic α-cells (85). The current results are therefore important for advancing understanding of a potential “local modulator” of the liver's responses to fasting signals. Moreover, they suggest that suppression of liver adropin expression in obesity may contribute to dysregulation of signal transduction pathways that control glucose metabolism.
In summary, the current findings suggest that adropin expressed in the liver functions as a nutrient-sensing modulator of the fasting response (Fig. 9). The findings indicate a model where the response of the liver to “master regulators” of anabolic (insulin) and catabolic (glucagon) responses to changes of energy balance can be fine-tuned by a local micropeptide.
Figure 9.

Model integrating adropin expressed by hepatocytes into the control of glucose metabolism by pancreatic hormones. In this model, adropin expression in the liver is affected by dietary nutrients and cellular stress responses and serves to moderate the response of the liver to regulatory inputs from the pancreas. Euglycemia requires the coordinated release of insulin (INS) and glucagon (GCG) from β-cells and α-cells located in pancreatic islets. INS and GCG released in a pulsatile secretory pattern (88) travel to liver sinusoids via the hepatic portal vein. In the liver, INS and GCG have opposing actions on glucose metabolism in hepatocytes. INS suppresses glucose production, whereas GCG enhances glucose production. The results of the current study and our previous publication (23) suggest that adropin34–76 expressed by hepatocytes suppresses glucose production in part by cross-talk with GCGR. However, a recent study suggests that adropin34–76 suppresses hepatic glucose production independently of GCG (27). The current study indicates that adropin expressed by hepatocytes has a tonic inhibitory effect and is required for normal regulation. Adropin may also act to enhance or complement INS signaling, particularly in situations of metabolic stress that can disrupt INS signaling (23, 27). Suppression of adropin expression with prolonged fasting or metabolic dysregulation in situations of obesity and/or disruption of circadian rhythms may enhance GCG signaling while limiting INS action. However, it should be noted that both GCG and INS action in liver are disrupted in the context of diet-induced obesity (89). Both INS and GCG regulate glycogen and lipid metabolism via pathways that are not shown here; the role of adropin in modulating these actions requires further investigation. It should also be noted that the model incorporates data from the current work and other sources (6, 22, 23, 27).
Experimental procedures
For animal studies and experiments using primary cultured hepatocytes, adropin34–76 was purchased from ChinaPeptides (Shanghai, China) in batches of 100 µg; the lyophilized peptide was resuspended on the day of use in sterile 0.9% saline. For islet studies, adropin34–76 was purchased from Phoenix Pharmaceuticals and was reconstituted in water.
Animals
Experiments using mice were reviewed and approved by the Institutional Animal Care and Use Committees of Saint Louis University. The mouse Enho gene was altered by introducing loxP sites to flank the ORF (ORF) in exon 2. The neomycin cassette flanked by Frt sites was removed using ACTB-Flpe transgenic mice; the resulting strain (Enhofl/fl) was crossed with mice expressing Cre under the control of an albumin promoter/enhancer (B6.Cg-Tg(Alb-cre)21Mgn/J; also known as Albumin-Cre). The Albumin-Cre transgene was crossed onto the Enhofl/fl background; offspring used for these studies were produced by mating Enhofl/fl mice with Albumin-Cre; Enhofl/fl mice, resulting in 50% Enhofl/fl mice (WT) and 50% Albumin-Cre; Enhofl/fl mice (LAdrKO).
Body composition was analyzed by NMR using BioSpin LF50 body composition analyzer (Bruker). Mice were housed under 12-h light/dark conditions with access to standard rodent chow and water.
Tolerance tests using glucose, pyruvate, or glucagon
Mice were fasted for 6 h for glucose tolerance tests (glucose, 2 mg/g fat-free mass), 16 h for pyruvate tolerance tests (sodium pyruvate from Sigma, 2 mg/g fat-free mass), and 1 h for glucagon tolerance tests. Blood was collected by tail nicks at different time points after intraperitoneal injection for glucose tolerance tests and pyruvate tolerance tests. Blood glucose levels were monitored using OneTouch blood glucose meters (LifeScan Europe) at the times indicated. Plasma insulin levels were measured using an Ultrasensitive Mouse Insulin ELISA kit (Crystal Chem, Downers Grove, IL). Glucagon was measured using an ELISA (Mercodia Developing Diagnostics).
Primary hepatocyte culture
Primary hepatocytes were isolated using the protocol described previously (23, 86). Experiments were performed 12–16 h after plating cells. Hepatocytes were washed twice with PBS and incubated in Hanks' balanced salt solution (HBSS, pH 7.4) for 2 h and then washed with fresh HBSS. Finally, cells were incubated for 3 h in HBSS with 100 ng/ml glucagon and 5 mm pyruvate in the presence or absence of 100 nm freshly prepared adropin34–76. At the end of a 3-h incubation, medium was collected and assayed for glucose concentrations with a glucose oxidase–based glucose assay kit (Sigma GAGO kit). Rates of glucose production were expressed as µg of glucose/mg of cell protein/h.
RNA extraction, cDNA synthesis, and real-time quantitative RT-PCR
The extraction of the total RNA from was performed by using kits from Applied Biosystems. cDNA was synthesized with a cDNA reverse transcription kit from Quanta. PCR was conducted using a QuantStudio Realtime PCR machine (Applied Systems), using primers from Integrated DNA Technology. Data were normalized using three reference genes (hprt1, 36b4, and ppib) (87).
Immunoblotting
Standard immunoblotting procedures were performed as described previously (23, 25, 26). Lysate was quantitated using BCA, and an equal amount of protein was loaded and blotted using antibodies listed in Table S2.
Mouse islet isolation
C57BL/6J male mice at 8 weeks of age were anesthetized with ketamine/xylazine (0.18/0.012 mg/g of animal) by intraperitoneal injection. The pancreas was perfused with collagenase (0.21 mg/ml of Liberase TL (Roche Applied Science)) through the common bile duct prior to euthanasia (by incision of the chest cavity to produce a bilateral pneumothorax). After verification of death, the pancreas was removed from the animal. Islets from three mice per experiment (six independent experiments were conducted) were isolated and pooled after pancreas digestion (37 °C for 14 min), followed by Histopaque® 1077 (Sigma) density gradient separation and handpicked purification. Islets were incubated for 24 h in RPMI 1640 medium containing 11.2 mmol/liter glucose, 10% fetal bovine serum, 110 µg/ml sodium pyruvate, 110 units/ml penicillin, and 110 µg/ml streptomycin.
Glucose-stimulated insulin secretion
Five islets per condition (in triplicate) were incubated for 24 h at 37 °C in RPMI 1640 medium (containing 11.2 mmol/liter glucose, 10% fetal bovine serum, 110 µg/ml sodium pyruvate, 110 units/ml penicillin, and 110 µg/ml streptomycin) under the following conditions: control (no addition of adropin34–76), 10 ng/ml adropin34–76, and 100 ng/ml adropin34–76.
After 24 h of treatment, islets were washed for 1 h by incubating with Krebs-Ringer-Hepes buffer (137 mmol/liter NaCl, 4.8 mmol/liter KCl, 1.2 mmol/liter KH2PO4, 1.2 mmol/liter MgSO4, 2.5 mmol/liter CaCl2, 5 mmol/liter NaHCO3, 16 mmol/liter HEPES, and 0.1% BSA) at 2.8 mmol/liter glucose, and supernatant was eliminated. Islets were incubated for 1 h with Krebs-Ringer-Hepes buffer, 2.8 mmol/liter glucose, followed by a 1-h incubation at 16.7 mmol/liter glucose. Supernatants were collected after each 1-h period. All incubations were performed at 37 °C and 5% CO2. At the end of the experiment, islets were lysed in HCl-ethanol. Supernatants and lysates were stored at −20 °C for later insulin determination by a commercial ELISA (Merck–Millipore). Insulin secretion is expressed as a percentage of total insulin content (i.e. intracellular insulin + extracellular insulin after basal and glucose-stimulated insulin secretion incubation).
After a 24-h incubation with or without adropin34–76, cell death was assessed by chemiluminescent quantification of adenylate kinase activity (Toxilight, Lonza Group) in medium. Data were normalized to intracellular insulin content. A muscle lysate was used as a positive death control. All experiments were run in triplicate.
Analysis of open access data sets
Enho expression data were extracted from GSE107787, GSE73554, and GSE51969 data sets and managed in .xl files. For pathway analysis, the public liver gene expression data set, GSE93903, which contains 21,261 probe IDs corresponding to 20,832 unique genes, was downloaded and analyzed using Bioconductor in R. We first performed quality control analyses using the genefilter package, and the results confirmed that the data set has been log2-transformed and properly normalized. Enho, measured with the 1428739_PM_at probe, showed an interesting, cyclic pattern of expression across the 103 samples, under different time points, ZT4, ZT8, ZT12, ZT16, ZT0, ZT20, and feeding conditions. Enho thus showed a strong variation in the expression across different samples, providing a good opportunity to analyze adropin-regulated genes and related pathways, both positively and negatively correlated with Enho expression. To best capture these genes and pathways, we used all samples to perform the pathway analysis.
Genome-wide gene set enrichment analysis based on a scaled correlation matrix
Gene set enrichment analysis is an algorithm to evaluate the degree of enrichment or depletion of a given gene set relative to one of the two functional states that are distantly connected by a gradient of preranked genes based a measurable activity. Typically, these states are defined by deferentially expressed genes. In our analysis, we adopted this algorithm to reveal the function of Enho. We defined the two states as the one associated with Enho expression and the other antagonistic/incompatible with Enho expression. We ranked the 20,832 genes based on their Pearson correlation coefficients as defined by Enho. This was further scaled to enhance the detection sensitivity. The preranked matrix was then used to search for enriched or depleted gene sets of experimentally verified biological pathways from a total of 5529 downloaded.
Statistical analysis
All mouse data were analyzed using Microsoft Excel, GraphPad Prism or SPSS software. All cell culture experiments were repeated three times with similar outcomes; one representative experiment is presented. Unless stated otherwise, data are shown as box-and-whisker plots with individual data points shown. *, p < 0.05; **, p < 0.01; ***, p < 0.001.
Data availability
The transcriptome data used for these studies are open access data sets managed by the NCBI that were deposited by the authors of the published studies. All data are contained within this article and supporting information.
Supplementary Material
Acknowledgments
The authors thanks Dr. Joel Eissenberg for assistance with manuscript preparation and Dr. Anutosh Chakraborty and Dr. Colin Flaveny for technical assistance.
This article contains supporting information.
Author contributions—S. B., S. Ghoshal, J. R. S., M. C.-S., M. L. M., C. G., K. G. K., J. E. G., M. L. N., S. A. F., J. Z., and A. A. B. data curation; S. B., C. G., J. Z., and A. A. B. formal analysis; S. B., S. Ghoshal, J. R. S., K. S. M., M. L. M., K. G. K., J. E. G., S. A. F., and J. Z. methodology; S. B., S. Ghoshal, J. R. S., S. Gao, S. A. F., and J. Z. writing-review and editing; S. Ghoshal, J. R. S., K. S. M., S. Gao, M. C.-S., M. L. M., C. G., K. G. K., J. E. G., M. L. N., S. A. F., J. Z., and A. A. B. investigation; K. S. M. and A. A. B. resources; S. Gao and A. A. B. conceptualization; C. G., J. E. G., S. A. F., and A. A. B. supervision; A. A. B. funding acquisition; A. A. B. visualization; A. A. B. writing-original draft; A. A. B. project administration.
Funding and additional information—A. A. B. was supported by National Institutes of Health Grant R21NS108138 and funding from the American Diabetes Association and NovoNordisk. K. S. M. was supported by National Institutes of Health Grant R00 HL136658. The content is solely the responsibility of the authors and does not necessarily represent the official views of the National Institutes of Health.
Conflict of interest—The authors declare that they have no conflicts of interest with the contents of this article.
- sORF
- short ORF
- i.p.
- intraperitoneal(ly)
- CR
- caloric restriction
- NHP
- nonhuman primate
- LAdrKO
- liver-specific adropin knockout
- ZT
- zeitgeber time
- ND
- normal diet
- GCGR
- glucagon receptor
- PKA
- cAMP-dependent protein kinase A
- ROR
- retinoid acid receptor–related orphan receptor
- HBSS
- Hanks' balanced salt solution
- INS
- insulin
- GCG
- glucagon
- RPKM
- reads per kilobase of transcript per million mapped reads.
References
- 1. Carvunis A. R., Rolland T., Wapinski I., Calderwood M. A., Yildirim M. A., Simonis N., Charloteaux B., Hidalgo C. A., Barbette J., Santhanam B., Brar G. A., Weissman J. S., Regev A., Thierry-Mieg N., Cusick M. E., et al. (2012) Proto-genes and de novo gene birth. Nature 487, 370–374 10.1038/nature11184 [DOI] [PMC free article] [PubMed] [Google Scholar]
- 2. Saghatelian A., and Couso J. P. (2015) Discovery and characterization of smORF-encoded bioactive polypeptides. Nat. Chem. Biol. 11, 909–916 10.1038/nchembio.1964 [DOI] [PMC free article] [PubMed] [Google Scholar]
- 3. Khitun A., Ness T. J., and Slavoff S. A. (2019) Small open reading frames and cellular stress responses. Mol. Omics 15, 108–116 10.1039/c8mo00283e [DOI] [PMC free article] [PubMed] [Google Scholar]
- 4. Makarewich C. A., and Olson E. N. (2017) Mining for micropeptides. Trends Cell Biol. 27, 685–696 10.1016/j.tcb.2017.04.006 [DOI] [PMC free article] [PubMed] [Google Scholar]
- 5. Kumar K. G., Trevaskis J. L., Lam D. D., Sutton G. M., Koza R. A., Chouljenko V. N., Kousoulas K. G., Rogers P. M., Kesterson R. A., Thearle M., Ferrante A. W. Jr., Mynatt R. L., Burris T. P., Dong J. Z., Halem H. A., et al. (2008) Identification of adropin as a secreted factor linking dietary macronutrient intake with energy homeostasis and lipid metabolism. Cell Metab. 8, 468–481 10.1016/j.cmet.2008.10.011 [DOI] [PMC free article] [PubMed] [Google Scholar]
- 6. Ganesh Kumar K., Zhang J., Gao S., Rossi J., McGuinness O. P., Halem H. H., Culler M. D., Mynatt R. L., and Butler A. A. (2012) Adropin deficiency is associated with increased adiposity and insulin resistance. Obesity (Silver Spring) 20, 1394–1402 10.1038/oby.2012.31 [DOI] [PMC free article] [PubMed] [Google Scholar]
- 7. Wang P., Tang W., Li Z., Zou Z., Zhou Y., Li R., Xiong T., Wang J., and Zou P. (2019) Mapping spatial transcriptome with light-activated proximity-dependent RNA labeling. Nat. Chem. Biol. 15, 1110–1119 10.1038/s41589-019-0368-5 [DOI] [PubMed] [Google Scholar]
- 8. Lovren F., Pan Y., Quan A., Singh K. K., Shukla P. C., Gupta M., Al-Omran M., Teoh H., and Verma S. (2010) Adropin is a novel regulator of endothelial function. Circulation 122, S185–S192 10.1161/CIRCULATIONAHA.109.931782 [DOI] [PubMed] [Google Scholar]
- 9. Stein L. M., Yosten G. L., and Samson W. K. (2016) Adropin acts in brain to inhibit water drinking: potential interaction with the orphan G protein-coupled receptor, GPR19. Am. J. Physiol. Regul. Integr. Comp. Physiol. 310, R476–R480 10.1152/ajpregu.00511.2015 [DOI] [PMC free article] [PubMed] [Google Scholar]
- 10. Rao A., and Herr D. R. (2017) G protein-coupled receptor GPR19 regulates E-cadherin expression and invasion of breast cancer cells. Biochim. Biophys. Acta Mol. Cell Res. 1864, 1318–1327 10.1016/j.bbamcr.2017.05.001 [DOI] [PubMed] [Google Scholar]
- 11. Thapa D., Stoner M. W., Zhang M., Xie B., Manning J. R., Guimaraes D., Shiva S., Jurczak M. J., and Scott I. (2018) Adropin regulates pyruvate dehydrogenase in cardiac cells via a novel GPCR-MAPK-PDK4 signaling pathway. Redox Biol. 18, 25–32 10.1016/j.redox.2018.06.003 [DOI] [PMC free article] [PubMed] [Google Scholar]
- 12. Foster S. R., Hauser A. S., Vedel L., Strachan R. T., Huang X. P., Gavin A. C., Shah S. D., Nayak A. P., Haugaard-Kedstrom L. M., Penn R. B., Roth B. L., Brauner-Osborne H., and Gloriam D. E. (2019) Discovery of human signaling systems: pairing peptides to G protein-coupled receptors. Cell 179, 895–908.e21 10.1016/j.cell.2019.10.010 [DOI] [PMC free article] [PubMed] [Google Scholar]
- 13. Wong C. M., Wang Y., Lee J. T., Huang Z., Wu D., Xu A., and Lam K. S. (2014) Adropin is a brain membrane-bound protein regulating physical activity via the NB-3/Notch signaling pathway in mice. J. Biol. Chem. 289, 25976–25986 10.1074/jbc.M114.576058 [DOI] [PMC free article] [PubMed] [Google Scholar]
- 14. Partridge C. G., Fawcett G. L., Wang B., Semenkovich C. F., and Cheverud J. M. (2014) The effect of dietary fat intake on hepatic gene expression in LG/J AND SM/J mice. BMC Genomics 15, 99 10.1186/1471-2164-15-99 [DOI] [PMC free article] [PubMed] [Google Scholar]
- 15. Hung Y. H., Kanke M., Kurtz C. L., Cubitt R., Bunaciu R. P., Miao J., Zhou L., Graham J. L., Hussain M. M., Havel P., Biddinger S., White P. J., and Sethupathy P. (2019) Acute suppression of insulin resistance-associated hepatic miR-29 in vivo improves glycemic control in adult mice. Physiol. Genomics 51, 379–389 10.1152/physiolgenomics.00037.2019 [DOI] [PMC free article] [PubMed] [Google Scholar]
- 16. Hung Y. H., Kanke M., Kurtz C. L., Cubitt R. L., Bunaciu R. P., Zhou L., White P. J., Vickers K. C., Hussain M. M., Li X., and Sethupathy P. (2019) MiR-29 regulates de novo lipogenesis in the liver and circulating triglyceride levels in a Sirt1-dependent manner. Front. Physiol. 10, 1367 10.3389/fphys.2019.01367 [DOI] [PMC free article] [PubMed] [Google Scholar]
- 17. Dooley J., Garcia-Perez J. E., Sreenivasan J., Schlenner S. M., Vangoitsenhoven R., Papadopoulou A. S., Tian L., Schonefeldt S., Serneels L., Deroose C., Staats K. A., Van der Schueren B., De Strooper B., McGuinness O. P., Mathieu C., et al. (2016) The microRNA-29 family dictates the balance between homeostatic and pathological glucose handling in diabetes and obesity. Diabetes 65, 53–61 10.2337/db15-0770 [DOI] [PMC free article] [PubMed] [Google Scholar]
- 18. Ghoshal S., Stevens J. R., Billon C., Girardet C., Sitaula S., Leon A. S., Rao D. C., Skinner J. S., Rankinen T., Bouchard C., Nuñez M. V., Stanhope K. L., Howatt D. A., Daugherty A., Zhang J., et al. (2018) Adropin: an endocrine link between the biological clock and cholesterol homeostasis. Mol. Metab. 8, 51–64 10.1016/j.molmet.2017.12.002 [DOI] [PMC free article] [PubMed] [Google Scholar]
- 19. Lian A., Wu K., Liu T., Jiang N., and Jiang Q. (2016) Adropin induction of lipoprotein lipase expression in tilapia hepatocytes. J. Mol. Endocrinol. 56, 11–22 10.1530/JME-15-0207 [DOI] [PubMed] [Google Scholar]
- 20. Kuhla A., Hahn S., Butschkau A., Lange S., Wree A., and Vollmar B. (2014) Lifelong caloric restriction reprograms hepatic fat metabolism in mice. J. Gerontol. A Biol. Sci. Med. Sci. 69, 915–922 10.1093/gerona/glt160 [DOI] [PubMed] [Google Scholar]
- 21. Thapa D., Xie B., Zhang M., Stoner M. W., Manning J. R., Huckestein B. R., Edmunds L. R., Mullett S. J., McTiernan C. F., Wendell S. G., Jurczak M. J., and Scott I. (2019) Adropin treatment restores cardiac glucose oxidation in pre-diabetic obese mice. J. Mol. Cell Cardiol. 129, 174–179 10.1016/j.yjmcc.2019.02.012 [DOI] [PMC free article] [PubMed] [Google Scholar]
- 22. Thapa D., Xie B., Manning J. R., Zhang M., Stoner M. W., Huckestein B. R., Edmunds L. R., Zhang X., Dedousis N. L., O'Doherty R. M., Jurczak M. J., and Scott I. (2019) Adropin reduces blood glucose levels in mice by limiting hepatic glucose production. Physiol. Rep. 7, e14043 10.14814/phy2.14043 [DOI] [PMC free article] [PubMed] [Google Scholar]
- 23. Gao S., Ghoshal S., Zhang L., Stevens J. R., McCommis K. S., Finck B. N., Lopaschuk G. D., and Butler A. A. (2019) The peptide hormone adropin regulates signal transduction pathways controlling hepatic glucose metabolism in a mouse model of diet-induced obesity. J. Biol. Chem. 294, 13366–13377 10.1074/jbc.RA119.008967 [DOI] [PMC free article] [PubMed] [Google Scholar]
- 24. Altamimi T. R., Gao S., Karwi Q. G., Fukushima A., Rawat S., Wagg C. S., Zhang L., and Lopaschuk G. D. (2019) Adropin regulates cardiac energy metabolism and improves cardiac function and efficiency. Metabolism 98, 37–48 10.1016/j.metabol.2019.06.005 [DOI] [PubMed] [Google Scholar]
- 25. Gao S., McMillan R. P., Zhu Q., Lopaschuk G. D., Hulver M. W., and Butler A. A. (2015) Therapeutic effects of adropin on glucose tolerance and substrate utilization in diet-induced obese mice with insulin resistance. Mol. Metab. 4, 310–324 10.1016/j.molmet.2015.01.005 [DOI] [PMC free article] [PubMed] [Google Scholar]
- 26. Gao S., McMillan R. P., Jacas J., Zhu Q., Li X., Kumar G. K., Casals N., Hegardt F. G., Robbins P. D., Lopaschuk G. D., Hulver M. W., and Butler A. A. (2014) Regulation of substrate oxidation preferences in muscle by the peptide hormone adropin. Diabetes 63, 3242–3252 10.2337/db14-0388 [DOI] [PMC free article] [PubMed] [Google Scholar]
- 27. Chen X., Chen S., Shen T., Yang W., Chen Q., Zhang P., You Y., Sun X., Xu H., Tang Y., Mi J., Yang Y., and Ling W. (2020) Adropin regulates hepatic glucose production via PP2A/AMPK pathway in insulin-resistant hepatocytes. FASEB J. 10.1096/fj.202000115rr [DOI] [PubMed] [Google Scholar]
- 28. Havel P. J., Kievit P., Comuzzie A. G., and Bremer A. A. (2017) Use and importance of nonhuman primates in metabolic disease research: current state of the field. ILAR J. 58, 251–268 10.1093/ilar/ilx031 [DOI] [PMC free article] [PubMed] [Google Scholar]
- 29. Butler A. A., Zhang J., Price C. A., Stevens J. R., Graham J. L., Stanhope K. L., King S., Krauss R. M., Bremer A. A., and Havel P. J. (2019) Low plasma adropin concentrations increase risks of weight gain and metabolic dysregulation in response to a high-sugar diet in male nonhuman primates. J. Biol. Chem. 294, 9706–9719 10.1074/jbc.RA119.007528 [DOI] [PMC free article] [PubMed] [Google Scholar]
- 30. Bremer A. A., Stanhope K. L., Graham J. L., Cummings B. P., Ampah S. B., Saville B. R., and Havel P. J. (2014) Fish oil supplementation ameliorates fructose-induced hypertriglyceridemia and insulin resistance in adult male rhesus macaques. J. Nutr. 144, 5–11 10.3945/jn.113.178061 [DOI] [PMC free article] [PubMed] [Google Scholar]
- 31. Butler A. A., Graham J. L., Stanhope K. L., Wong S., King S., Bremer A. A., Krauss R. M., Hamilton J., and Havel P. J. (2020) Role of angiopoietin-like protein 3 in sugar-induced dyslipidemia in rhesus macaques: suppression by fish oil or RNAi. J. Lipid Res. 61, 376–386 10.1194/jlr.ra119000423 [DOI] [PMC free article] [PubMed] [Google Scholar]
- 32. Butler A. A., Tam C. S., Stanhope K. L., Wolfe B. M., Ali M. R., O'Keeffe M., St-Onge M. P., Ravussin E., and Havel P. J. (2012) Low circulating adropin concentrations with obesity and aging correlate with risk factors for metabolic disease and increase after gastric bypass surgery in humans. J. Clin. Endocrinol. Metab. 97, 3783–3791 10.1210/jc.2012-2194 [DOI] [PMC free article] [PubMed] [Google Scholar]
- 33. Celik E., Yilmaz E., Celik O., Ulas M., Turkcuoglu I., Karaer A., Simsek Y., Minareci Y., and Aydin S. (2013) Maternal and fetal adropin levels in gestational diabetes mellitus. J. Perinat. Med. 41, 375–380 10.1515/jpm-2012-0227 [DOI] [PubMed] [Google Scholar]
- 34. St-Onge M. P., Shechter A., Shlisky J., Tam C. S., Gao S., Ravussin E., and Butler A. A. (2014) Fasting plasma adropin concentrations correlate with fat consumption in human females. Obesity (Silver Spring) 22, 1056–1063 10.1002/oby.20631 [DOI] [PMC free article] [PubMed] [Google Scholar]
- 35. Butler A. A., St-Onge M. P., Siebert E. A., Medici V., Stanhope K. L., and Havel P. J. (2015) Differential responses of plasma adropin concentrations to dietary glucose or fructose consumption in humans. Sci. Rep. 5, 14691 10.1038/srep14691 [DOI] [PMC free article] [PubMed] [Google Scholar]
- 36. Stevens J. R., Kearney M. L., St-Onge M. P., Stanhope K. L., Havel P. J., Kanaley J. A., Thyfault J. P., Weiss E. P., and Butler A. A. (2016) Inverse association between carbohydrate consumption and plasma adropin concentrations in humans. Obesity (Silver Spring) 24, 1731–1740 10.1002/oby.21557 [DOI] [PMC free article] [PubMed] [Google Scholar]
- 37. Chang J. B., Chu N. F., Lin F. H., Hsu J. T., and Chen P. Y. (2018) Relationship between plasma adropin levels and body composition and lipid characteristics amongst young adolescents in Taiwan. Obes. Res. Clin. Pract. 12, 101–107 10.1016/j.orcp.2017.03.001 [DOI] [PubMed] [Google Scholar]
- 38. Zang H., Jiang F., Cheng X., Xu H., and Hu X. (2018) Serum adropin levels are decreased in Chinese type 2 diabetic patients and negatively correlated with body mass index. Endocr. J. 65, 685–691 10.1507/endocrj.EJ18-0060 [DOI] [PubMed] [Google Scholar]
- 39. Nolan T., Hands R. E., and Bustin S. A. (2006) Quantification of mRNA using real-time RT-PCR. Nat. Protoc. 1, 1559–1582 10.1038/nprot.2006.236 [DOI] [PubMed] [Google Scholar]
- 40. Naoumov N. V. (2014) Cyclophilin inhibition as potential therapy for liver diseases. J. Hepatol. 61, 1166–1174 10.1016/j.jhep.2014.07.008 [DOI] [PubMed] [Google Scholar]
- 41. Kinouchi K., Magnan C., Ceglia N., Liu Y., Cervantes M., Pastore N., Huynh T., Ballabio A., Baldi P., Masri S., and Sassone-Corsi P. (2018) Fasting imparts a switch to alternative daily pathways in liver and muscle. Cell Rep. 25, 3299–3314.e6 10.1016/j.celrep.2018.11.077 [DOI] [PMC free article] [PubMed] [Google Scholar]
- 42. Atger F., Gobet C., Marquis J., Martin E., Wang J., Weger B., Lefebvre G., Descombes P., Naef F., and Gachon F. (2015) Circadian and feeding rhythms differentially affect rhythmic mRNA transcription and translation in mouse liver. Proc. Natl. Acad. Sci. U. S. A. 112, E6579–E6588 10.1073/pnas.1515308112 [DOI] [PMC free article] [PubMed] [Google Scholar]
- 43. Koronowski K. B., Kinouchi K., Welz P. S., Smith J. G., Zinna V. M., Shi J., Samad M., Chen S., Magnan C. N., Kinchen J. M., Li W., Baldi P., Benitah S. A., and Sassone-Corsi P. (2019) Defining the independence of the liver circadian clock. Cell 177, 1448–1462.e14 10.1016/j.cell.2019.04.025 [DOI] [PMC free article] [PubMed] [Google Scholar]
- 44. Girardet C., Mavrikaki M. M., Stevens J. R., Miller C. A., Marks D. L., and Butler A. A. (2017) Melanocortin-3 receptors expressed in Nkx2.1(+ve) neurons are sufficient for controlling appetitive responses to hypocaloric conditioning. Sci. Rep. 7, 44444 10.1038/srep44444 [DOI] [PMC free article] [PubMed] [Google Scholar]
- 45. Bruss M. D., Khambatta C. F., Ruby M. A., Aggarwal I., and Hellerstein M. K. (2010) Calorie restriction increases fatty acid synthesis and whole body fat oxidation rates. Am. J. Physiol. Endocrinol. Metab. 298, E108–E116 10.1152/ajpendo.00524.2009 [DOI] [PMC free article] [PubMed] [Google Scholar]
- 46. Begriche K., Marston O. J., Rossi J., Burke L. K., McDonald P., Heisler L. K., and Butler A. A. (2012) Melanocortin-3 receptors are involved in adaptation to restricted feeding. Genes Brain Behav. 11, 291–302 10.1111/j.1601-183X.2012.00766.x [DOI] [PMC free article] [PubMed] [Google Scholar]
- 47. Sato S., Solanas G., Peixoto F. O., Bee L., Symeonidi A., Schmidt M. S., Brenner C., Masri S., Benitah S. A., and Sassone-Corsi P. (2017) Circadian reprogramming in the liver identifies metabolic pathways of aging. Cell 170, 664–677.e11 10.1016/j.cell.2017.07.042 [DOI] [PMC free article] [PubMed] [Google Scholar]
- 48. Driessen M., Vitins A. P., Pennings J. L., Kienhuis A. S., Water B., and van der Ven L. T. (2015) A transcriptomics-based hepatotoxicity comparison between the zebrafish embryo and established human and rodent in vitro and in vivo models using cyclosporine A, amiodarone and acetaminophen. Toxicol. Lett. 232, 403–412 10.1016/j.toxlet.2014.11.020 [DOI] [PubMed] [Google Scholar]
- 49. McGill M. R., and Jaeschke H. (2019) Animal models of drug-induced liver injury. Biochim. Biophys. Acta Mol. Basis Dis. 1865, 1031–1039 10.1016/j.bbadis.2018.08.037 [DOI] [PMC free article] [PubMed] [Google Scholar]
- 50. Castello P. R., Drechsel D. A., and Patel M. (2007) Mitochondria are a major source of paraquat-induced reactive oxygen species production in the brain. J. Biol. Chem. 282, 14186–14193 10.1074/jbc.M700827200 [DOI] [PMC free article] [PubMed] [Google Scholar]
- 51. Low E. X. S., Zheng Q., Chan E., and Lim S. G. (2020) Drug induced liver injury: East versus West—a systematic review and meta-analysis. Clin. Mol. Hepatol. 26, 142–154 10.3350/cmh.2019.1003 [DOI] [PMC free article] [PubMed] [Google Scholar]
- 52. Postic C., Shiota M., Niswender K. D., Jetton T. L., Chen Y., Moates J. M., Shelton K. D., Lindner J., Cherrington A. D., and Magnuson M. A. (1999) Dual roles for glucokinase in glucose homeostasis as determined by liver and pancreatic beta cell-specific gene knock-outs using Cre recombinase. J. Biol. Chem. 274, 305–315 10.1074/jbc.274.1.305 [DOI] [PubMed] [Google Scholar]
- 53. Yang C., DeMars K. M., and Candelario-Jalil E. (2018) Age-dependent decrease in adropin is associated with reduced levels of endothelial nitric oxide synthase and increased oxidative stress in the rat brain. Aging Dis. 9, 322–330 10.14336/AD.2017.0523 [DOI] [PMC free article] [PubMed] [Google Scholar]
- 54. Fagerberg L., Hallström B. M., Oksvold P., Kampf C., Djureinovic D., Odeberg J., Habuka M., Tahmasebpoor S., Danielsson A., Edlund K., Asplund A., Sjöstedt E., Lundberg E., Szigyarto C. A., Skogs M., et al. (2014) Analysis of the human tissue-specific expression by genome-wide integration of transcriptomics and antibody-based proteomics. Mol. Cell. Proteomics 13, 397–406 10.1074/mcp.M113.035600 [DOI] [PMC free article] [PubMed] [Google Scholar]
- 55. Yue F., Cheng Y., Breschi A., Vierstra J., Wu W., Ryba T., Sandstrom R., Ma Z., Davis C., Pope B. D., Shen Y., Pervouchine D. D., Djebali S., Thurman R. E., Kaul R., et al. (2014) A comparative encyclopedia of DNA elements in the mouse genome. Nature 515, 355–364 10.1038/nature13992 [DOI] [PMC free article] [PubMed] [Google Scholar]
- 56. Yu Y., Fuscoe J. C., Zhao C., Guo C., Jia M., Qing T., Bannon D. I., Lancashire L., Bao W., Du T., Luo H., Su Z., Jones W. D., Moland C. L., Branham W. S., et al. (2014) A rat RNA-Seq transcriptomic BodyMap across 11 organs and 4 developmental stages. Nat. Commun. 5, 3230 10.1038/ncomms4230 [DOI] [PMC free article] [PubMed] [Google Scholar]
- 57. Zhang C., Zhang Q., Huang Z., and Jiang Q. (2020) Adropin inhibited tilapia hepatic glucose output and triglyceride accumulation via AMPK activation. J. Endocrinol. 246, 109–122 10.1530/JOE-20-0077 [DOI] [PubMed] [Google Scholar]
- 58. Rodgers J. T., and Puigserver P. (2007) Fasting-dependent glucose and lipid metabolic response through hepatic sirtuin 1. Proc. Natl. Acad. Sci. U. S. A. 104, 12861–12866 10.1073/pnas.0702509104 [DOI] [PMC free article] [PubMed] [Google Scholar]
- 59. Rodgers J. T., Lerin C., Haas W., Gygi S. P., Spiegelman B. M., and Puigserver P. (2005) Nutrient control of glucose homeostasis through a complex of PGC-1α and SIRT1. Nature 434, 113–118 10.1038/nature03354 [DOI] [PubMed] [Google Scholar]
- 60. Estall J. L., Kahn M., Cooper M. P., Fisher F. M., Wu M. K., Laznik D., Qu L., Cohen D. E., Shulman G. I., and Spiegelman B. M. (2009) Sensitivity of lipid metabolism and insulin signaling to genetic alterations in hepatic peroxisome proliferator-activated receptor-γ coactivator-1α expression. Diabetes 58, 1499–1508 10.2337/db08-1571 [DOI] [PMC free article] [PubMed] [Google Scholar]
- 61. Yoon J. C., Puigserver P., Chen G., Donovan J., Wu Z., Rhee J., Adelmant G., Stafford J., Kahn C. R., Granner D. K., Newgard C. B., and Spiegelman B. M. (2001) Control of hepatic gluconeogenesis through the transcriptional coactivator PGC-1. Nature 413, 131–138 10.1038/35093050 [DOI] [PubMed] [Google Scholar]
- 62. Burcelin R., Uldry M., Foretz M., Perrin C., Dacosta A., Nenniger-Tosato M., Seydoux J., Cotecchia S., and Thorens B. (2004) Impaired glucose homeostasis in mice lacking the α1b-adrenergic receptor subtype. J. Biol. Chem. 279, 1108–1115 10.1074/jbc.M307788200 [DOI] [PubMed] [Google Scholar]
- 63. Wakelam M. J., Murphy G. J., Hruby V. J., and Houslay M. D. (1986) Activation of two signal-transduction systems in hepatocytes by glucagon. Nature 323, 68–71 10.1038/323068a0 [DOI] [PubMed] [Google Scholar]
- 64. Steinberg R. A., Cauthron R. D., Symcox M. M., and Shuntoh H. (1993) Autoactivation of catalytic (Cα) subunit of cyclic AMP-dependent protein kinase by phosphorylation of threonine 197. Mol. Cell Biol. 13, 2332–2341 10.1128/mcb.13.4.2332 [DOI] [PMC free article] [PubMed] [Google Scholar]
- 65. Cho H., Mu J., Kim J. K., Thorvaldsen J. L., Chu Q., Crenshaw E. B. 3rd, Kaestner K. H., Bartolomei M. S., Shulman G. I., and Birnbaum M. J. (2001) Insulin resistance and a diabetes mellitus-like syndrome in mice lacking the protein kinase Akt2 (PKBβ). Science 292, 1728–1731 10.1126/science.292.5522.1728 [DOI] [PubMed] [Google Scholar]
- 66. Stern J. H., Smith G. I., Chen S., Unger R. H., Klein S., and Scherer P. E. (2019) Obesity dysregulates fasting-induced changes in glucagon secretion. J. Endocrinol. 243, 149–160 10.1530/JOE-19-0201 [DOI] [PMC free article] [PubMed] [Google Scholar]
- 67. Chen X., Xue H., Fang W., Chen K., Chen S., Yang W., Shen T., Chen X., Zhang P., and Ling W. (2019) Adropin protects against liver injury in nonalcoholic steatohepatitis via the Nrf2 mediated antioxidant capacity. Redox Biol. 21, 101068 10.1016/j.redox.2018.101068 [DOI] [PMC free article] [PubMed] [Google Scholar]
- 68. Wu L., Fang J., Yuan X., Xiong C., and Chen L. (2019) Adropin reduces hypoxia/reoxygenation-induced myocardial injury via the reperfusion injury salvage kinase pathway. Exp. Ther. Med. 18, 3307–3314 10.3892/etm.2019.7937 [DOI] [PMC free article] [PubMed] [Google Scholar]
- 69. Kakimoto P. A., and Kowaltowski A. J. (2016) Effects of high fat diets on rodent liver bioenergetics and oxidative imbalance. Redox Biol. 8, 216–225 10.1016/j.redox.2016.01.009 [DOI] [PMC free article] [PubMed] [Google Scholar]
- 70. Bass J., and Lazar M. A. (2016) Circadian time signatures of fitness and disease. Science 354, 994–999 10.1126/science.aah4965 [DOI] [PubMed] [Google Scholar]
- 71. Turek F. W., Joshu C., Kohsaka A., Lin E., Ivanova G., McDearmon E., Laposky A., Losee-Olson S., Easton A., Jensen D. R., Eckel R. H., Takahashi J. S., and Bass J. (2005) Obesity and metabolic syndrome in circadian Clock mutant mice. Science 308, 1043–1045 10.1126/science.1108750 [DOI] [PMC free article] [PubMed] [Google Scholar]
- 72. Liu J., Zhou B., Yan M., Huang R., Wang Y., He Z., Yang Y., Dai C., Wang Y., Zhang F., and Zhai Q. (2016) CLOCK and BMAL1 regulate muscle insulin sensitivity via SIRT1 in male mice. Endocrinology 157, 2259–2269 10.1210/en.2015-2027 [DOI] [PubMed] [Google Scholar]
- 73. Lee J., Kim M. S., Li R., Liu V. Y., Fu L., Moore D. D., Ma K., and Yechoor V. K. (2011) Loss of Bmal1 leads to uncoupling and impaired glucose-stimulated insulin secretion in beta-cells. Islets 3, 381–388 10.4161/isl.3.6.18157 [DOI] [PMC free article] [PubMed] [Google Scholar]
- 74. Zhou B., Zhang Y., Zhang F., Xia Y., Liu J., Huang R., Wang Y., Hu Y., Wu J., Dai C., Wang H., Tu Y., Peng X., Wang Y., and Zhai Q. (2014) CLOCK/BMAL1 regulates circadian change of mouse hepatic insulin sensitivity by SIRT1. Hepatology 59, 2196–2206 10.1002/hep.26992 [DOI] [PubMed] [Google Scholar]
- 75. Kondratov R. V., Kondratova A. A., Gorbacheva V. Y., Vykhovanets O. V., and Antoch M. P. (2006) Early aging and age-related pathologies in mice deficient in BMAL1, the core component of the circadian clock. Genes Dev. 20, 1868–1873 10.1101/gad.1432206 [DOI] [PMC free article] [PubMed] [Google Scholar]
- 76. Koo S. H., Satoh H., Herzig S., Lee C. H., Hedrick S., Kulkarni R., Evans R. M., Olefsky J., and Montminy M. (2004) PGC-1 promotes insulin resistance in liver through PPAR-α-dependent induction of TRB-3. Nat. Med. 10, 530–534 10.1038/nm1044 [DOI] [PubMed] [Google Scholar]
- 77. Anderson R. M., Barger J. L., Edwards M. G., Braun K. H., O'Connor C. E., Prolla T. A., and Weindruch R. (2008) Dynamic regulation of PGC-1α localization and turnover implicates mitochondrial adaptation in calorie restriction and the stress response. Aging Cell 7, 101–111 10.1111/j.1474-9726.2007.00357.x [DOI] [PMC free article] [PubMed] [Google Scholar]
- 78. Hughey C. C., Wasserman D. H., Lee-Young R. S., and Lantier L. (2014) Approach to assessing determinants of glucose homeostasis in the conscious mouse. Mamm. Genome 25, 522–538 10.1007/s00335-014-9533-z [DOI] [PMC free article] [PubMed] [Google Scholar]
- 79. Titchenell P. M., Quinn W. J., Lu M., Chu Q., Lu W., Li C., Chen H., Monks B. R., Chen J., Rabinowitz J. D., and Birnbaum M. J. (2016) Direct hepatocyte insulin signaling is required for lipogenesis but is dispensable for the suppression of glucose production. Cell Metab. 23, 1154–1166 10.1016/j.cmet.2016.04.022 [DOI] [PMC free article] [PubMed] [Google Scholar]
- 80. Niswender C. M., Willis B. S., Wallen A., Sweet I. R., Jetton T. L., Thompson B. R., Wu C., Lange A. J., and McKnight G. S. (2005) Cre recombinase-dependent expression of a constitutively active mutant allele of the catalytic subunit of protein kinase A. Genesis 43, 109–119 10.1002/gene.20159 [DOI] [PubMed] [Google Scholar]
- 81. Willis B. S., Niswender C. M., Su T., Amieux P. S., and McKnight G. S. (2011) Cell-type specific expression of a dominant negative PKA mutation in mice. PLoS ONE 6, e18772 10.1371/journal.pone.0018772 [DOI] [PMC free article] [PubMed] [Google Scholar]
- 82. Rizza R. A. (2010) Pathogenesis of fasting and postprandial hyperglycemia in type 2 diabetes: implications for therapy. Diabetes 59, 2697–2707 10.2337/db10-1032 [DOI] [PMC free article] [PubMed] [Google Scholar]
- 83. Sargsyan A., and Herman M. A. (2019) Regulation of glucose production in the pathogenesis of type 2 diabetes. Curr. Diab. Rep. 19, 77 10.1007/s11892-019-1195-5 [DOI] [PMC free article] [PubMed] [Google Scholar]
- 84. Roden M., and Shulman G. I. (2019) The integrative biology of type 2 diabetes. Nature 576, 51–60 10.1038/s41586-019-1797-8 [DOI] [PubMed] [Google Scholar]
- 85. Unger R. H., and Cherrington A. D. (2012) Glucagonocentric restructuring of diabetes: a pathophysiologic and therapeutic makeover. J. Clin. Invest. 122, 4–12 10.1172/JCI60016 [DOI] [PMC free article] [PubMed] [Google Scholar]
- 86. McCommis K. S., Chen Z., Fu X., McDonald W. G., Colca J. R., Kletzien R. F., Burgess S. C., and Finck B. N. (2015) Loss of mitochondrial pyruvate carrier 2 in the liver leads to defects in gluconeogenesis and compensation via pyruvate-alanine cycling. Cell Metab. 22, 682–694 10.1016/j.cmet.2015.07.028 [DOI] [PMC free article] [PubMed] [Google Scholar]
- 87. Vandesompele J., De Preter K., Pattyn F., Poppe B., Van Roy N., De Paepe A., and Speleman F. (2002) Accurate normalization of real-time quantitative RT-PCR data by geometric averaging of multiple internal control genes. Genome Biol. 3, RESEARCH0034 10.1186/gb-2002-3-7-research0034 [DOI] [PMC free article] [PubMed] [Google Scholar]
- 88. Menge B. A., Gruber L., Jorgensen S. M., Deacon C. F., Schmidt W. E., Veldhuis J. D., Holst J. J., and Meier J. J. (2011) Loss of inverse relationship between pulsatile insulin and glucagon secretion in patients with type 2 diabetes. Diabetes 60, 2160–2168 10.2337/db11-0251 [DOI] [PMC free article] [PubMed] [Google Scholar]
- 89. Wewer Albrechtsen N. J., Pedersen J., Galsgaard K. D., Winther-Sørensen M., Suppli M. P., Janah L., Gromada J., Vilstrup H., Knop F. K., and Holst J. J. (2019) The liver-α-cell axis and type 2 diabetes. Endocr. Rev. 40, 1353–1366 10.1210/er.2018-00251 [DOI] [PubMed] [Google Scholar]
Associated Data
This section collects any data citations, data availability statements, or supplementary materials included in this article.
Supplementary Materials
Data Availability Statement
The transcriptome data used for these studies are open access data sets managed by the NCBI that were deposited by the authors of the published studies. All data are contained within this article and supporting information.