Abstract
Comprehensive non-destructive testing (NDT) for pipelines is a critical and challenging task. This paper proposes a novel physic perspective fusion NDT method of electromagnetic acoustic transducer (EMAT) and pulsed Eddy current testing (PECT) for detecting hybrid defects. This transceiver-integrated fusion sensor structure can simultaneously excite ultrasound and pulsed eddy current. Therefore, the generated ultrasound is applied to detect deep defects, while the eddy current detects surface defects. The theoretical derivation of EMAT and PECT fusion mechanism has been developed for analysis and interpretation of the results. In addition, numerical simulation on the detection of hybrid defects including surface defects with different width, depth and multiple bottom-thinning defects has been conducted. Experiments on both ferromagnetic and non-ferromagnetic material verify the feasibility of composite detection. Finally, tests have been validated on pipeline with weld defects, and the results show that the composite inspection method is capable of monitoring thickness variations and inspecting surface defects.
This article is part of the theme issue ‘Advanced electromagnetic non-destructive evaluation and smart monitoring’.
Keywords: non-destructive testing, physic perspective fusion, electromagnetic acoustic transducer, pulsed eddy current testing
1. Introduction
With the rapid development of the gas transmission industry, there is an increasing requirement for non-destructive testing (NDT) to detect and characterize the degradation damage to safeguard the integrity of the pipeline [1]. Pulsed eddy current testing (PECT), magnetic particle testing (MT), ray testing (RT), magnetic flux leakage (MFL), piezoelectric ultrasonic testing (UT) and electromagnetic acoustic transducer (EMAT) have been applied in the pipeline industry [2]. PECT is sensitive to surface and near-surface crack detection. However, it is difficult to detect internal failure due to the skin effect [3–5]. MT is effective at detecting surface crack for ferromagnetic material while the detection procedure is complicated and may cause pollution [6]. RT can obtain interior information whereas the radiation leads to a potential safety problem [7,8]. MFL has low requirements for the surface condition of the testing pieces. However, the resolution of defects is limited and the detection is easily affected [9,10]. The traditional piezoelectric ultrasonic technique (UT) has the advantages of direct quantification and high excitation signal intensity. However, it requires the filling of coupling medium for propagation [11–13]. EMAT is an emerging NDT technique based on electromagnetic induction which can generate and detect ultrasound in metals. Compared with the traditional UT method, it has the benefits of non-contact, fast detection speed and no couplant required. Thus, EMAT can be used in the field of fault inspection and thickness measurement of metal pipes and plates [14–17]. However, because of the inherent shortcoming of blind detection area, the near-surface defect is difficult to detect by EMAT. Eddy current testing (ECT) is a traditional NDT method for detecting the surface or near-surface defects for conductive materials. It has the advantages of non-contact detection, being capable of working at high temperatures and sensitive to surface defects [18–21]. As a branch of ECT applications, PECT not only has the advantages of ECT but also retains a certain range of continuous multi-frequency spectrum carrying wide information on the specimen on account of the different penetration depth [22].
Different NDT techniques have their own advantages and drawbacks where multiphysics NDT can compensate the limitation from individual inspection methods. Therefore, by combining different NDT techniques, the reliability and effects of inspection can be improved [23,24]. There have been many studies on hybrid testing. Pohl et al. adopted the fusion method of UT and ECT to detect train wheels and lead rails [25]. Lamarre et al. combined phased array ultrasound (PAUT) with eddy current array (ECAT) to detect friction stir welds of aluminium specimens [26]. Liu et al. combined the traditional ECT and PECT to detect the hidden corrosion defects of an aircraft’s structure [27]. Gupta et al. combined microwave and ECT to detect corrosion defects in riveted multilayer structures of aircraft [28]. EMAT with bulk wave demonstrates the ability to detect cracks in deep areas rather than near surface. On the contrary, PECT can effectively detect the defects in the shallow area while it is incapable of detecting deep defects. In addition, both EMAT and PECT are based on the principle of electromagnetic induction to generate eddy current without contacting on the surface of the material. From the perspective of inspection range, principle and efficiency, both methods can be mechanically combined to achieve complementary detection results.
There are two modes of combining EMAT with PECT: mechanism fusion and system fusion. The mechanism fusion refers to the fusion of two detection methods into one sensor according to the same mechanism. The system fusion strategy mainly aims at the integration of the EMAT system and PECT system by means of software and hardware. There have been several research studies for dealing with the system fusion. Niese et al. presented a wall thickness measurement sensor for pipelines by using EMAT. ECT and MFL are combined with EMAT for detecting metal loss [29]. Willems et al. developed a composite detection device based on PECT, MFL and EMAT for in-line inspection of pipes [30]. Edwards et al. combined an EMAT with ECT probe to evaluate surface defects [31]. Urayama et al. proposed a novel dual sensor structure combining an EMAT and ECT probe to monitor pipe wall thinning in a high-temperature environment [32]. Uchimoto et al. developed an EMAT-ECT dual probe to assess wall thinning compatible with EMAT and ECT modes [33]. There are fewer reports on the mechanism fusion of EMAT and ECT. Xie et al. proposed a hybrid method combining PECT and EMAT by using filter strategies to separate the detected signals [34].
However, most of the above studies are based on the system fusion. In order to improve the inspection efficiency, save costs and achieve the comprehensive detection of pipelines, this paper proposes a novel mechanism fusion sensor structure combining the EMAT and PECT. In particular, the new sensor structure can excite longitudinal waves to detect internal flaws while surface defects can be detected by the pulsed eddy current. The FEM simulation of PECT and EMAT composite inspection is carried out. The feasibility of EMAT and PECT fusion detection has been demonstrated through the experimental study of ferromagnetic and non-ferromagnetic flat materials and pipe with weld defects.
2. Methodology
The basic principle of PECT and EMAT bulk waves is shown in figure 1. When a high-frequency, transient current is applied to the coil, the electromagnetic fields occur and the pulsed eddy current is excited in the skin depth of the specimen [16,34]. While defects occur on or near the surface of the conductor, the intensity and distribution of the pulsed eddy current are affected, as well as the voltage and the impedance of the coil. By detecting it, the existence of defects in the conductor can be found. On the other hand, under the action of the static bias magnetic field, the pulsed eddy current generates Lorentz force. The changing force generates an ultrasonic wave in the solid. Besides Lorentz force, there exists the magnetostriction force and the magnetization force in ferromagnetic. When the weak static bias magnetic field is applied to the ferromagnetic material, the magnetostriction force is the main cause of the ultrasonic wave, and the magnetization force is relatively small. With the gradual enhancement of the magnetic field, the ferromagnetic material tends to be magnetically saturated, and the Lorentz force plays a major role in the excitation of the ultrasonic wave [35–37]. The receiving process of EMAT is just the opposite of the excitation process. When the ultrasonic wave propagates near the receiving coil, the moving charged particles in the conductor will generate a dynamic current under the action of external bias magnetic field. The dynamic current generates a dynamic magnetic field inside and around the specimen, and the EMAT receiving coil in this dynamic magnetic field will generate a dynamic induced electromotive force, which is the received signal of the coil.
Figure 1.
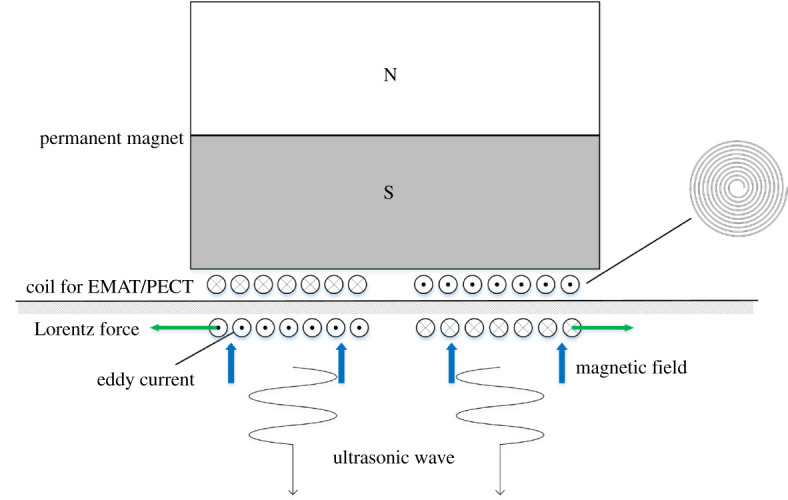
The principle of pulsed eddy current and ultrasonic bulk waves. (Online version in colour.)
3. Numerical simulation
In order to verify the detectability of mechanism fusion of EMAT and PECT, the simulation study is conducted. The COMSOL Multiphysics of physics modules, including electromagnetic field and solid mechanics, are applied for simulation study. In particular, all of the simulation results are on the basis of 2D modelling in order to speed up the calculation.
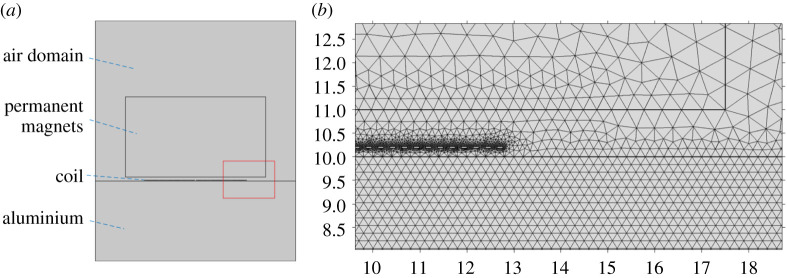
Figure 2a shows the diagram of the fusion sensor, which contains the tested specimen, the permanent magnet, the coil and the air. Figure 2b shows the FEM mesh diagram of the red frame position in figure 2a. The material of the permanent magnet is NdFeB, the lift-off distance is 1 mm and the residual magnetism is 1.2 T. The material of the coil is copper and the lift-off distance is 0.2 mm. The diameter of the coil is 25.4 mm. The specimen is aluminium and its thickness is 20 mm. At present, only the FEM simulation of the ultrasonic shear wave with Lorentz force is considered. From the later experimental verification, the results of non-ferromagnetic and ferromagnetic materials are similar. The specific simulation parameters are shown in table 1. The electromagnetic field module and the solid mechanics module are used in the simulation, in which the electromagnetic field module calculates the static magnetic field of the permanent magnet and the dynamic magnetic field generated by the coil. The solid mechanics module calculates the sound field generated by the pulse eddy in the aluminium plate.
Figure 2.
Simulation settings. (a) The composite sensor geometry, (b) the FEM mesh diagram. (Online version in colour.)
Table 1.
Simulation parameters.
| coil | permanent magnet | aluminium plate | |
|---|---|---|---|
| width (mm) | 0.127 | 35 | 50 |
| height (mm) | 0.035 | 20 | 20 |
| conductivity (S m−1) | 5.998 × 10⁷ | 2.03 × 10⁶ | 3.774 × 10⁷ |
| turns | 50 | — | — |
| lift-off (mm) | 0.2 | 1 | — |
| Young’s modulus (Pa) | — | — | 70 × 109 |
| density (kg m−3) | — | — | 2700 |
| Poisson’s ratio | — | — | 0.33 |
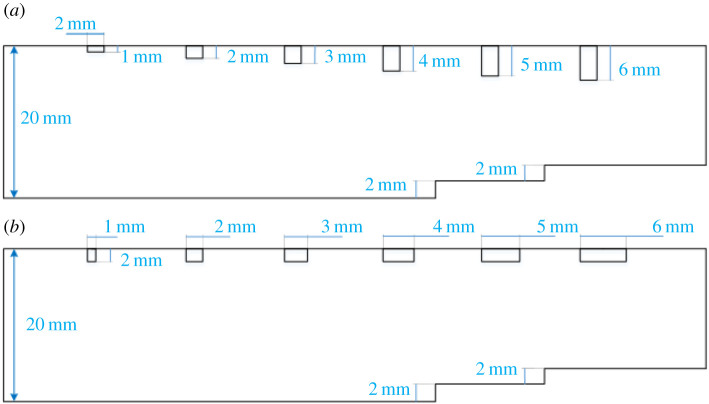
Two hybrid defect models have been established. They have both surface defects and bottom thinning defects. The variation of the defects is shown in figure 3. To simplify the simulation process, the fusion probes are placed directly above the surface defects. Therefore, the ultrasonic echo signal and pulsed eddy current signal are collected simultaneously.
Figure 3.
Hybrid defect model. (a) Surface defects with varying depth and bottom thinning defects. (b) Surface defects with varying width and bottom thinning defects. (Online version in colour.)
(a). Analysis of the pulsed eddy current
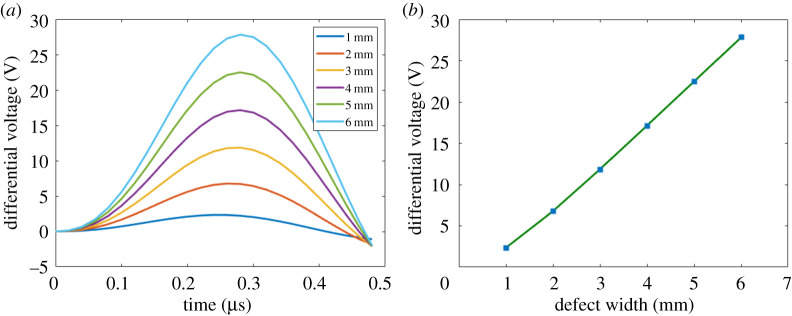
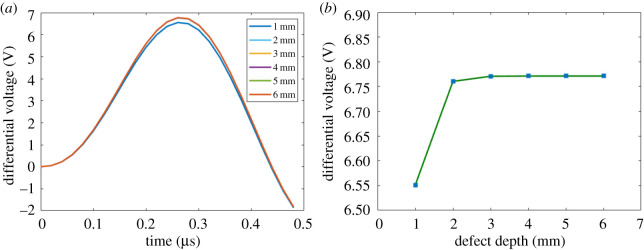
Surface defects of different sizes are settled to study the response of the pulsed eddy current. The differential results of the pulsed eddy current signal are shown in figures 4a and 5a, which are obtained by the difference between the defect signal and the non-defect signal. By extracting the maximum absolute values of the differential signals, the relationship between the defect size and the response is illustrated in figures 4b and 5b, respectively.
Figure 4.
Surface defect with varying width. (a) The differential results of pulsed eddy current signal, (b) the relationship between the defect width and the differential amplitude. (Online version in colour.)
Figure 5.
Surface defect with varying depth. (a) The differential results of pulsed eddy current signal, (b) the relationship between the defect depth and the differential amplitude. (Online version in colour.)
As can be seen in figure 4a, the response amplitude increases linearly with the increase of defect width from 1 mm to 6 mm. A perfect linear relation can be observed in figure 4b, while the effect of the variation of defect depth on the signal is less sensitive. Figure 5b illustrates that when the defect depth exceeds 3 mm, the response differential amplitude remains the same. This is because the high excitation frequency results in small skin-effect depth. Thus, with the increase of defect depth, the strength of the eddy current decreases exponentially. Beyond a certain depth, the signal is retained.
(b). Analysis of ultrasonic wave
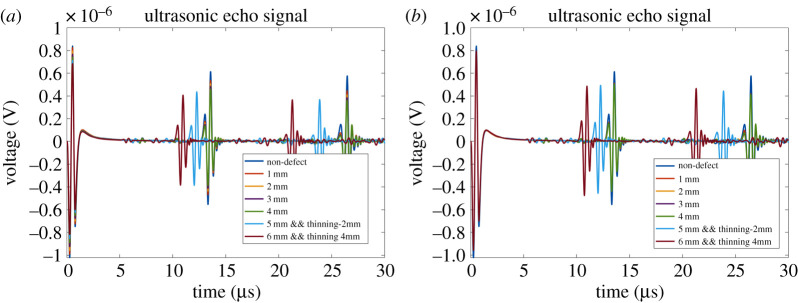
While the pulsed eddy current is generated, the ultrasound is also excited in the specimen. Figure 6 shows the sound field displacement at different times in the aluminium and the propagation process of the ultrasonic wave can be clearly seen. The ultrasonic echo signals at different locations in figure 3 are shown in figure 7. The propagation velocity of ultrasonic can be calculated from the time of flight (ToF) between the two shear waves and the thickness of the aluminium. It can be seen that the ultrasonic signal does not change at the position of the non-defect region and surface defects regions. In the case of bottom thinning defects, the ultrasonic echo is advanced, and the bottom thinning information can be obtained by calculating the time difference of the echo signals. Table 2 shows the analysis results. The sound velocity is obtained by averaging the ToF of multiple standard thicknesses, and the error here represents the calculation error of ToF.
Figure 6.
Sound field displacement at different times. (a) 1 μs, (b) 5 μs, (c) 9 μs, (d) 13 μs. (Online version in colour.)
Figure 7.
Ultrasonic echo signals at different locations. (a) Surface defect with varying width and bottom thinning defect, (b) surface defect with varying depth and bottom thinning defect. (Online version in colour.)
Table 2.
Bottom thinning defect analysis.
| time (μs) | velocity (m s−1) | calculated thickness (mm) | actual thickness (mm) | error rate (%) |
|---|---|---|---|---|
| 11.79 | 3058.10 | 18.03 | 18.00 | 0.17 |
| 10.51 | 3058.10 | 16.07 | 16.00 | 0.44 |
4. Experimental validation
(a). The system of fusion electromagnetic acoustic transducer/pulsed eddy current testing
The EMAT and PECT mechanism fusion system is shown in figure 8. The transceiver integrated fusion probe is placed above the conductor, which simultaneously excites and receives the ultrasonic signal and the eddy current signal. Figure 9 shows the circuit diagram for the separation of fusion signals. Firstly, the superimposed magnetic field information of PECT is immediately obtained, while the typical time response of EMAT is usually a few μs, as it is obviously longer than that of PECT. In addition, due to the high excitation voltage, the signal amplitude of the eddy current will reach hundreds of volts. However, the conversion efficiency of EMAT is low, the echo voltage amplitude is approximately μV. The signals reflected by EMAT and PECT are different in time and space. Using the difference between the signal timing and amplitude, the fusion signals are sent to the PECT channel and the EMAT channel for further signal processing, respectively.
Figure 8.
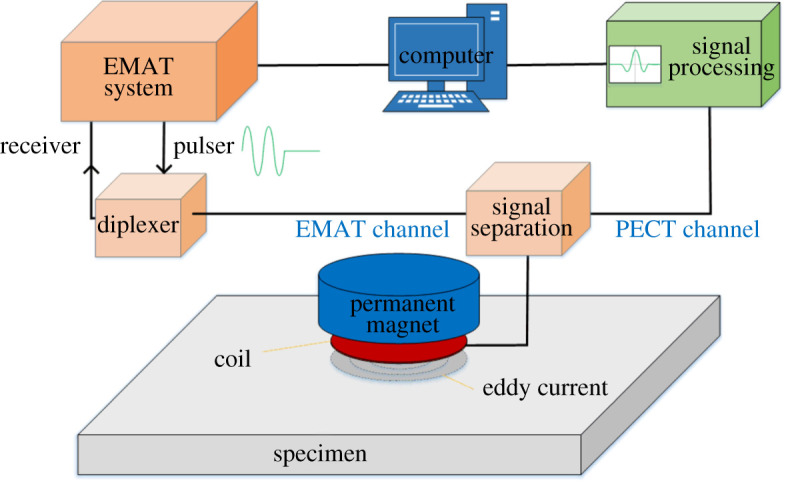
The EMAT and PECT fusion system. (Online version in colour.)
Figure 9.
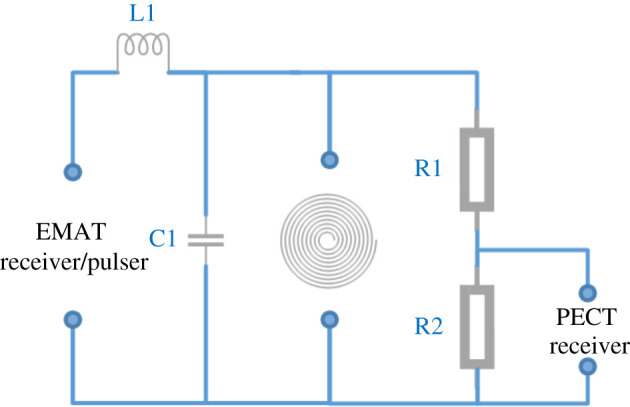
Circuit diagram for fusion signals separation. (Online version in colour.)
(b). Experimental platform and specimen
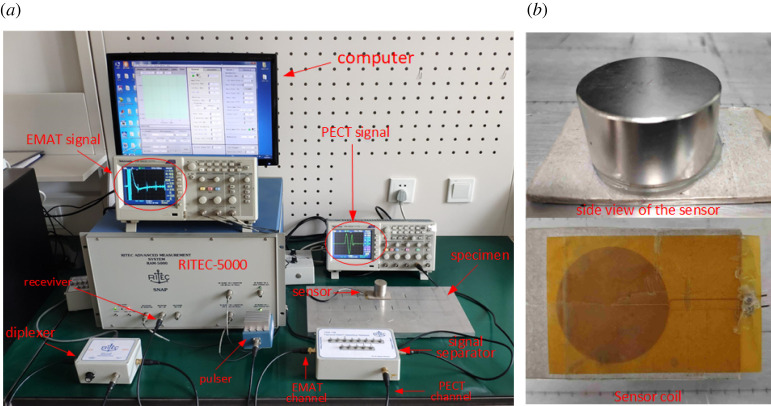
In order to verify the above simulation studies, validation experiments are implemented. The experimental platform and the sensor are shown in figure 10. The composite sensor consists of a spiral coil and an NdFeB permanent magnet, where the coil is made of flexible printed circuit (FPC) and its radius is 16 mm, with 60 turns. The radius of the magnet is 17.5 mm, the height is 19 mm and the residual magnetism is 1.2 T. The RITEC-5000 provides excitation and processes EMAT signal including limiting, multistage amplification and bandpass filtering. The excitation frequency is 2 MHz. Two oscilloscopes receive EMAT and PECT signals and display, respectively. Both signals are collected into the computer for further analysis.
Figure 10.
Experimental setup and sensor. (a) Experiment platform, (b) sensor. (Online version in colour.)
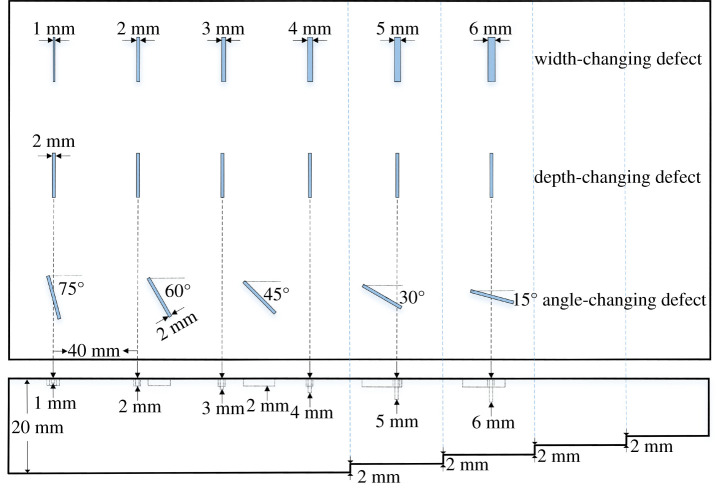
Two kinds of materials are used for experimental verification, which are non-ferromagnetic aluminium and ferromagnetic # 45 steel, respectively. The diagram of these specimens is shown in figure 11. The thickness is 20 mm. The artificial surface defects with different width, depth and angle are settled. All surface defects are 20 mm in length, with different widths from 1 mm to 6 mm, different depths from 1 mm to 6 mm, and different angles from 15° to 75°. On the reverse of the specimen, there are four bottom thinning defects of different thicknesses, from 18 mm to 12 mm. The scanning direction of the sensor is perpendicular to the central axis of the surface defects and a total of 75 points are sampled every 5 mm for each type of defect. The ultrasonic signals and eddy current signals are recorded simultaneously at each scanning point.
Figure 11.
Front and side views of specimen with diverse defects. (Online version in colour.)
(c). Experimental result analysis of the pulsed eddy current
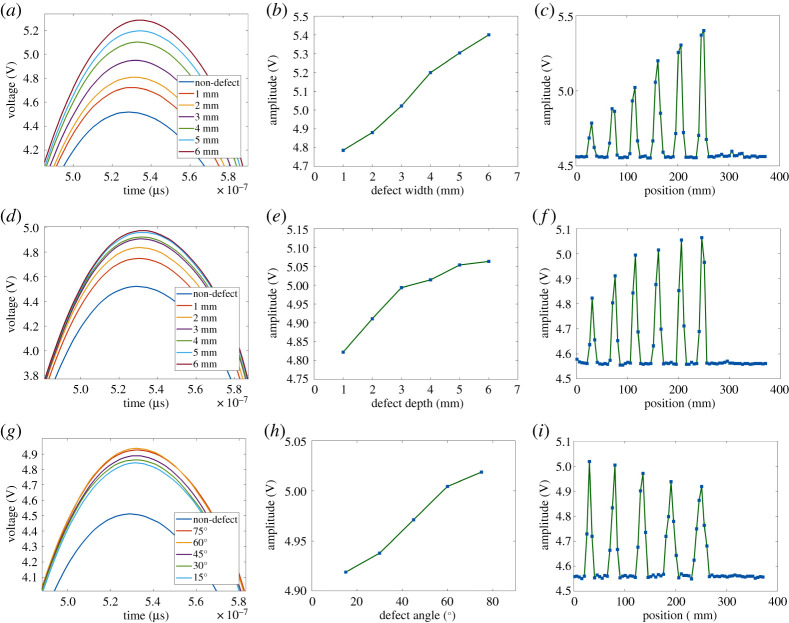
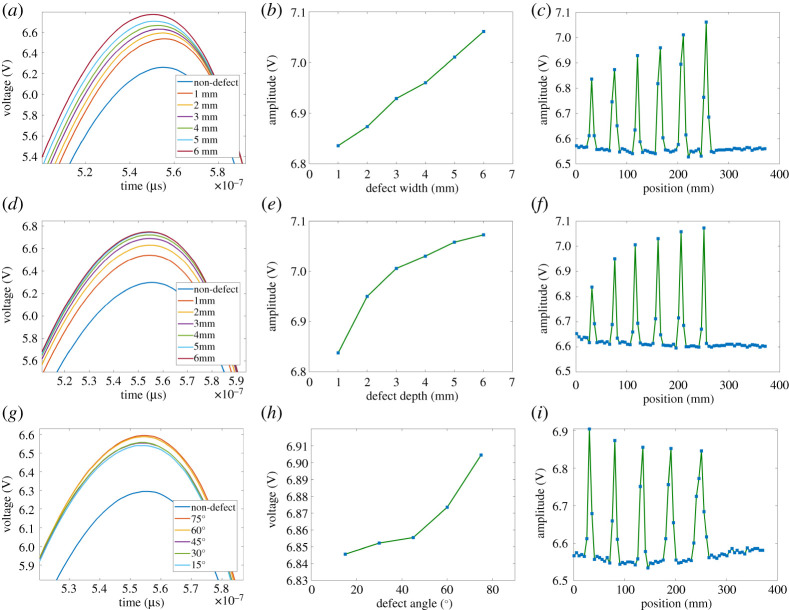
The peak value is used as the feature to evaluate the relation of different types of defects. Figure 12 shows analysis results of different width, depth and angle of surface defects in the aluminium plate. In figure 12a,b, the signal at maximum amplitude of different defects is obtained. A linear relation can be observed with defect width change, which is consistent with the simulation results. The signal peak amplitude with a defect is significantly larger than that of defect-free. Similar results can be observed from figure 12d,e. In particular, with the increase of defect depth, the increase of signal peak amplitude gradually decreases. It can be explained in principle that when the defect width changes, the distribution of the pulsed eddy current is greatly affected. According to the skin effect, the eddy current density in the conductor surface is the largest and decreases exponentially with depth. Therefore, as the defect depth increases, its effect on the pick-up signal becomes smaller, which does not show a linear relationship as with the width change. The relationship between the defect angle and the signal peak amplitude is shown in figure 12g,h. The defects owing to different angles cause the different eddy current, which alters the receiving response. Figure 12c,f ,i draws the peak amplitudes of all scanning signals for the width-changing, depth-changing, angle-changing defects separately, from which the location of different defects can be seen.
Figure 12.
Surface defects detection with varying width (12a, 12b, 12c), depth (12d, 12e, 12f ), angle (12g, 12h, 12i) in the aluminium plate; 12a 12d 12g is the signals at maximum amplitude of different defects; 12b 12e 12h is the relationship between the defect size and the peak amplitude; 12c 12f 12i is the peak amplitude of PECT at different locations. (Online version in colour.)
Similarly, figure 13 demonstrates the surface defects detection with a varying width, depth, and angle in #45 steel plate. The result of the #45 steel flat is similar to that for aluminium. However, there is a smaller signal amplitude difference between different defects in #45 steel, which means that the sensitivity will be smaller. The reason for this phenomenon is that the magnetic permeability of ferromagnetic materials is greater than the value of non-ferromagnetic materials before the magnetic saturation, and it concentrates the primary magnetic field of the coil. The increase in the primary magnetic field overshadows the secondary magnetic field of the eddy currents. Then the eddy current induced in the coil is reduced.
Figure 13.
Surface defects detection with varying width (13a, 13b, 13c), depth (13d, 13e, 13f ), angle (13g, 13h, 13i) in 45# steel plate; 13a 13d 13g is the signals at maximum amplitude of different defects; 13b 13e 13h is the relationship between the defect size and the peak amplitude; 13c 13f 13i is the peak amplitude of PECT at different locations. (Online version in colour.)
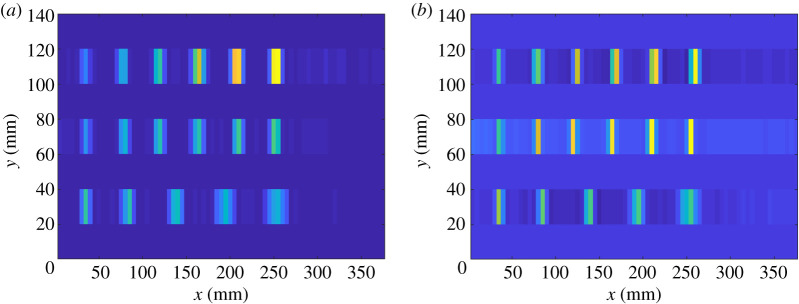
Figure 14 visualizes the results to see the change more clearly. It converts PECT peak amplitude at each position into a different colour: the higher the peak value, the brighter the colour. The brighter areas indicate that there is a defect in this place, which is consistent with the actual defect location.
Figure 14.
Surface defects imaging with PECT peak amplitude at each position. (a) Aluminium plate, (b) 45# steel plate. (Online version in colour.)
(d). Experimental result analysis of the ultrasonic wave
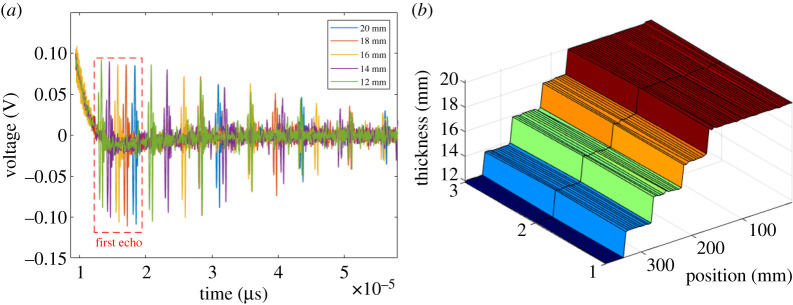
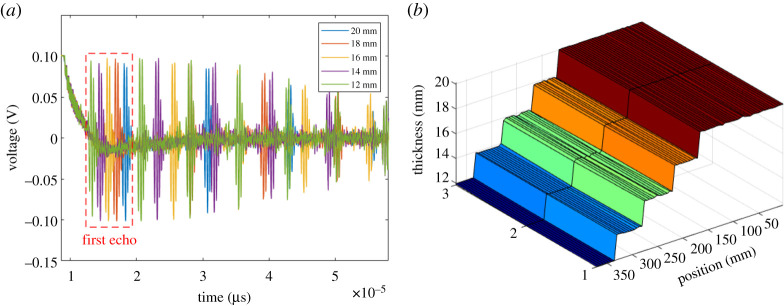
While the pulsed eddy current signal is obtained, the ultrasonic signal is collected simultaneously. Figures 15a and 16a show the ultrasonic echo signals at different thicknesses in aluminium and #45 steel, respectively. It can be seen that as the thickness decreases, the time of the first echo is also advanced. Table 3 describes experimental ultrasonic velocity analysis of these two materials. Information about the thickness of the specimen can be obtained by the product of ultrasonic velocity and the time of flight. Figures 15b and 16b demonstrate the three-dimensional thickness image of three sets of scanning data in the aluminium and # 45 steel. The position and thickness variation of the specimen can be seen from it. Table 4 shows the statistical analysis of thickness measurement of each bottom-thinning defect in aluminium. It can be seen that each time the thickness change is detected, and the maximum error does not exceed 1%. It can be concluded that the detection of thickness by EMAT works well.
Figure 15.
Ultrasonic signal analysis of aluminium plate. (a) Ultrasonic echo signals of different thicknesses, (b) three-dimensional imaging of thickness. (Online version in colour.)
Figure 16.
Ultrasonic signal analysis of 45# steel plate. (a) Ultrasonic echo signals of different thicknesses, (b) three-dimensional imaging of thickness. (Online version in colour.)
Table 3.
Ultrasonic velocity analysis.
| material | time (μs) | thickness (mm) | experimental velocity (m s−1) | theoretical velocity (m s−1) |
|---|---|---|---|---|
| aluminium | 12.63 | 20.00 | 3167.60 | 3050.00 |
| 45 steel | 12.42 | 20.00 | 3220.00 | 3200.00 |
Table 4.
Bottom-thinning defect analysis.
| average | velocity | calculated | actual | ||
|---|---|---|---|---|---|
| time (μs) | (m s−1) | thickness (mm) | thickness (mm) | error rate (%) | s.d. (mm) |
| 11.35 | 3167.60 | 17.98 | 18.00 | 0.11 | 0.088 |
| 10.15 | 3167.60 | 16.07 | 16.00 | 0.44 | 0.059 |
| 8.85 | 3167.60 | 14.01 | 14.00 | 0.07 | 0.026 |
| 7.52 | 3167.60 | 11.92 | 12.00 | 0.67 | 0.015 |
(e). Experiment on pipes
In addition, experiments have been performed on actual oil–gas pipelines in order to verify the effectiveness of the method. One piece of testing pipe is shown in figure 17. This sample is welded from two pieces of X70 steel with different thicknesses. There are six artificial defects with different directions in the weld region. The dimensions and numbers of weld defects are shown in table 5. All defect depths are 2 mm. In the experiment, C-scan was performed on the area within the red marked frame.
Figure 17.
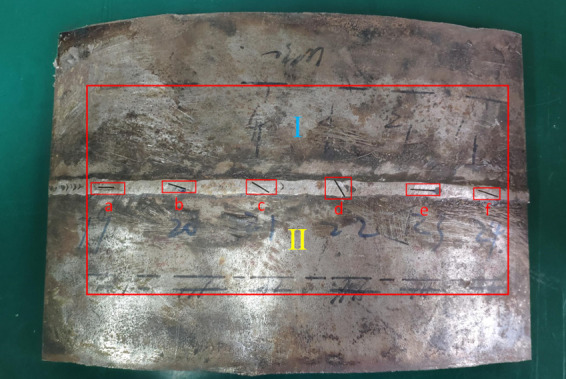
Pipe piece with weld defect. (Online version in colour.)
Table 5.
Dimensions and numbers of weld defects.
| number | length (mm) | width (mm) | angle |
|---|---|---|---|
| a | 15 | 1 | 0° |
| b | 15 | 1 | 15° |
| c | 15 | 1 | 30° |
| d | 15 | 1 | 60° |
| e | 20 | 1 | 0° |
| f | 20 | 1 | 15° |
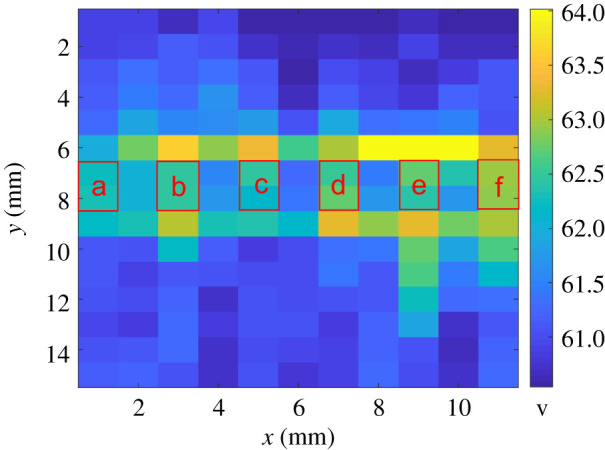
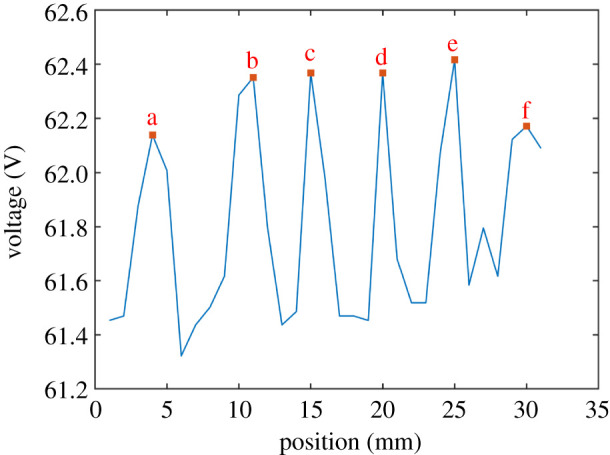
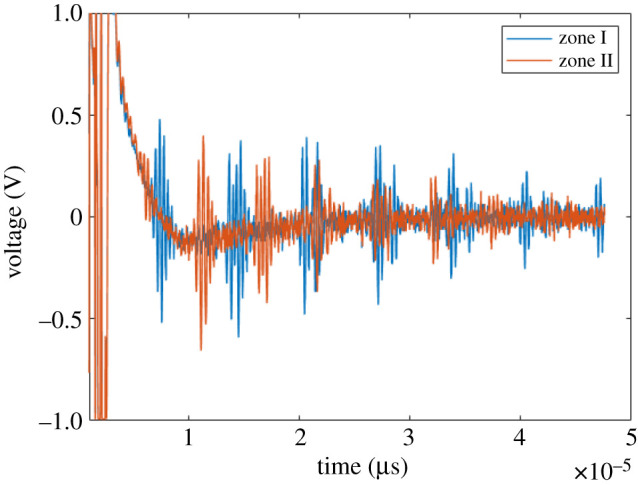
Shown in figure 18 is the C-scan result of the pulsed eddy current. The colour of each point is represented by the peak value of the PECT signal at the current position. The brighter the colour, the stronger the eddy current signal. Since the weld area is higher than the normal area (zone I, zone II) and rugged, it can be seen that the sudden amplitude increase in the PECT at the edge of the weld (above and below a, b, c, d, e, f, 6 mm and 9 mm of Y coordinate in figure 18) is due to the unevenness. This is because the sensor is equivalent to changing the lift-off when detecting uneven surfaces. However, there still exists a difference between the defective and non-defective signals on the weld region. The red frame in figure 18 is the PECT signal of the weld defect, and it is brighter than its front and rear regions, which represent defective and non-defective areas. Figure 19 illustrates the detailed difference. It can be seen that although the eddy current signal at the weld is more complicated, by comparing the intensity of the signal on the weld, it is still possible to detect defects on the weld. The EMAT results are shown in figure 20. There is a time difference between the ultrasonic echoes in zone I and zone II which indicates that the thickness of the two areas is different. Table 6 shows the analysis between the calculated average thickness and the actual measured thickness. The change in the thickness of the pipe can still be detected, and the error is within 0.1 mm. However, unlike the standard specimen tested above, the EMAT bulk wave signal is almost lost in the weld area of the pipe. This is because the complex surface shape of the weld area makes it difficult for the sensor to form a bulk wave with steady direction and concentrated energy. Therefore, the EMAT bulk wave can accurately measure the thickness change of the non-welded area in the pipeline, whereas it cannot help the weld area. In addition, the information of the welding area can be obtained by the PECT signal. The combination of the two detection methods can monitor the thickness change and surface defect information of the pipe.
Figure 18.
The C-scan result of PECT signal. (Online version in colour.)
Figure 19.
Change of PECT signal on the weld region. (Online version in colour.)
Figure 20.
Ultrasound signals in different areas of the pipeline. (Online version in colour.)
Table 6.
Pipe thickness analysis.
| time (μs) | velocity (m s−1) | calculated thickness (mm) | actual thickness (mm) | error rate (%) |
|---|---|---|---|---|
| 7.10 | 3220.00 | 11.43 | 11.40 | 0.26 |
| 5.63 | 3220.00 | 9.06 | 9.00 | 0.67 |
From the analysis of the detection results of PECT and EMAT, it can be concluded that EMAT can well detect the change in the thickness of the pipeline. For surface defects, PECT has the capability to detect the abnormality between the defective and non-defective signals on the weld region. However, in the weld region, the EMAT signal is almost lost and the PECT signal has suffered a strong interference. This is mainly due to the unevenness of the weld region.
5. Conclusion and future work
In this paper, a novel mechanism fusion NDT method of EMAT and PECT has been proposed for simultaneously detecting surface and bottom defects. This transceiver-integrated fusion sensor structure increases the inspection range, reliability and efficiency. The principle of EMAT and PECT fusion is investigated by FEM simulation, and the ability to detect hybrid defects in both non-ferromagnetic and ferromagnetic materials is verified. It is evident that all works have an excellent reaction among the response and surface defects of different width, depth, orientation and multivariable bottom defects. The smallest size of the surface crack with a width of 1 mm and length of 20 mm can be detected, while a bottom-thinning defect of 2 mm is accurately measured. In addition, experiments are carried out on pipe with weld defect. It shows that the proposed method can sense changes in pipe wall-thickness and surface defects. However, the effect on weld defects is not obvious due to the complexity and unevenness of the weld region. Future research will focus on the composite detection capability of fusion sensors with flexible array structures.
Acknowledgements
The work was supported by state administration of quality supervision, inspection and quarantine (grant no. 2017QK042), supported by National Natural Science Foundation of China(grant no. 61527803), supported by Science and Technology Department of Sichuan, China (grant no. 2018GZ0047 and grant no. 2018JY0655).
Data accessibility
This article has no additional data.
Authors' contributions
W.G. and B.G. jointly created the idea and wrote and refined the paper. G.T. refined the paper and D.S. did the signal processing.
Competing interests
We declare we have no competing interests.
Funding
No funding has been received for this article.
Reference
- 1.Nestleroth J. 2006. Pipeline in-line inspection challenges to ndt. Insight-Non-Destr. Testing Cond. Monit. 48, 524–524 ( 10.1784/insi.2006.48.9.524) [DOI] [Google Scholar]
- 2.Datta S, Sarkar S. 2016. A review on different pipeline fault detection methods. J. Loss Prev. Process Ind. 41, 97–106. ( 10.1016/j.jlp.2016.03.010) [DOI] [Google Scholar]
- 3.Sophian A, Tian GY, Taylor D, Rudlin J. 2003. A feature extraction technique based on principal component analysis for pulsed eddy current NDT. NDT & E Int. 36, 37–41. ( 10.1016/S0963-8695(02)00069-5) [DOI] [Google Scholar]
- 4.Tian GY, He Y, Adewale I, Simm A. 2013. Research on spectral response of pulsed eddy current and NDE applications. Sens. Actuators, A 189, 313–320. ( 10.1016/j.sna.2012.10.011) [DOI] [Google Scholar]
- 5.Xie L, Gao B, Tian G, Tan J, Feng B, Yin Y. 2019. Coupling pulse eddy current sensor for deeper defects ndt. Sens. Actuators, A 293, 189–199. ( 10.1016/j.sna.2019.03.029) [DOI] [Google Scholar]
- 6.Fukuoka K, Noma S, Kobayashi M, Ozaki T, Oikawa Y. 2016. Consideration of multi-coil type magnetizer for detection of omnidirectional crack in magnetic particle testing. Int. J. Appl. Electromagn. Mech 52, 1537–1543. ( 10.3233/JAE-162174) [DOI] [Google Scholar]
- 7.Shafeek H, Gadelmawla E, Abdel-Shafy A, Elewa I. 2004. Automatic inspection of gas pipeline welding defects using an expert vision system. NDT E Int. 37, 301–307. ( 10.1016/j.ndteint.2003.10.004) [DOI] [Google Scholar]
- 8.Gou R, Zhang Y, Xu X, Sun L, Yang Y. 2011. Residual stress measurement of new and in-service x70 pipelines by X-ray diffraction method. NDT E Int. 44, 387–393. ( 10.1016/j.ndteint.2011.03.003) [DOI] [Google Scholar]
- 9.Bubenik T, Nestlroth J, Eiber R, Saffell B. 1997. Magnetic flux leakage (MFL) technology for natural gas pipeline inspection. NDT E Int. 1, 36 ( 10.1016/S0963-8695(97)80865-1) [DOI] [Google Scholar]
- 10.Shi Y, Zhang C, Li R, Cai M, Jia G. 2015. Theory and application of magnetic flux leakage pipeline detection. Sensors 15, 31 036–31 055. ( 10.3390/s151229845) [DOI] [PMC free article] [PubMed] [Google Scholar]
- 11.Lee J-R, Jeong H, Ciang CC, Yoon D-J, Lee S-S. 2010. Application of ultrasonic wave propagation imaging method to automatic damage visualization of nuclear power plant pipeline. Nucl. Eng. Des. 240, 3513–3520. ( 10.1016/j.nucengdes.2010.06.011) [DOI] [Google Scholar]
- 12.Alobaidi WM. 2015. Applications of ultrasonic techniques in oil and gas pipeline industries: a review. Am. J. Oper. Res. 5, 274 ( 10.4236/ajor.2015.54021) [DOI] [Google Scholar]
- 13.Chapuis B, Jenson F, Calmon P, DiCrisci G, Hamilton J, Pomié L. 2014. Simulation supported pod curves for automated ultrasonic testing of pipeline girth welds. Weld. World 58, 433–441. ( 10.1007/s40194-014-0125-z) [DOI] [Google Scholar]
- 14.Frost HM. 1979. Electromagnetic–ultrasound transducers: principles, practice, and applications. In Physical acoustics, vol. 14, pp. 179–275. Elsevier.
- 15.Hirao M, Ogi H. 2013. EMATs for science and industry: noncontacting ultrasonic measurements. Berlin, Germany: Springer Science & Business Media. [Google Scholar]
- 16.Dhayalan R, Balasubramaniam K. 2010. A hybrid finite element model for simulation of electromagnetic acoustic transducer (EMAT) based plate waves. NDT E Int. 43, 519–526. ( 10.1016/j.ndteint.2010.05.008) [DOI] [Google Scholar]
- 17.Huang S, Zhao W, Zhang Y, Wang S. 2009. Study on the lift-off effect of emat. Sens. Actuators, A 153, 218–221. ( 10.1016/j.sna.2009.05.014) [DOI] [Google Scholar]
- 18.Rebican M, Chen Z, Yusa N, Janousek L, Miya K. 2006. Shape reconstruction of multiple cracks from ECT signals by means of a stochastic method. IEEE Trans. Magn. 42, 1079–1082. ( 10.1109/TMAG.2006.870967) [DOI] [Google Scholar]
- 19.Chen Z, Janousek L, Yusa N, Miya K. 2007. A nondestructive strategy for the distinction of natural fatigue and stress corrosion cracks based on signals from eddy current testing.
- 20.Song K, Kang Y, Zhang L, PENG X. 2015. Research progress in magnetic properties of steel pipe on the eddy current testing signal [j]. J. Mater. Eng. 43, 106–112. [Google Scholar]
- 21.Obeid S, Tranjan FM, Dogaru T. 2007. Eddy current testing for detecting small defects in thin films. In AIP Conf. Proc., vol. 894, pp. 340–345. American Institute of Physics.
- 22.Majidnia S, Rudlin J, Nilavalan R. 2014. A pulsed eddy current system for flaw detection using an encircling coil on a steel pipe.
- 23.Light G, Fisher J, Tennis R, Stolte J, Hendrix G. 1996. Detection and sizing of defects in control rod drive mechanism penetrations using eddy current and ultrasonics.
- 24.Nishimizu A. et al. 2008. Development of eddy current testing system for complicated-shaped components. Trans. Atomic Energy Soc. Japan 7, 142–151. ( 10.3327/taesj.J07.013) [DOI] [Google Scholar]
- 25.Pohl R, Erhard A, Montag H-J, Thomas H-M, Wüstenberg H. 2004. NDT techniques for railroad wheel and gauge corner inspection. NDT E Int. 37, 89–94. ( 10.1016/j.ndteint.2003.06.001) [DOI] [Google Scholar]
- 26.Lamarre A, Dupuis O, Moles M, Tech D. 2006. Complete inspection of friction stir welds in aluminum using ultrasonic and eddy current arrays. In Trends in Welding Research: Proc. of the 7th Int. Conf., p. 219. ASM International.
- 27.Liu Z, Forsyth D, Lepine B, Safizadeh S, Fahr A. 2004. Quantifying aircraft hidden corrosion by using multi-modal NDI techniques. In AIP Conf. Proc., vol. 700, pp. 1355–1362. American Institute of Physics.
- 28.Gupta K. et al. 2007. Fusion of microwave and eddy current data for a multi-modal approach in evaluating corrosion under paint and in lap joints. In AIP Conf. Proc., vol. 894, pp. 611–618. American Institute of Physics.
- 29.Niese F, Yashan A, Willems H. 2006. Wall thickness measurement sensor for pipeline inspection using EMAT technology in combination with pulsed eddy current and MFL. In 9th European Conf. on NDT, Berlin, vol. 18, pp. 45–52.
- 30.Willems H, Jaskolla B, Sickinger T, Barbian O, Niese F. 2010. Advanced possibilities for corrosion inspection of gas pipelines using EMAT-technology. In Tenth European Conf. on Non-Destructive Testing, ECNDT, vol. 1, p. 24.
- 31.Edwards R, Sophian A, Dixon S, Tian G-Y, Jian X. 2006. Dual EMAT and PEC non-contact probe: applications to defect testing. NDT E Int. 39, 45–52. ( 10.1016/j.ndteint.2005.06.001) [DOI] [Google Scholar]
- 32.Urayama R, Uchimoto T, Takagi T. 2010. Application of EMAT/EC dual probe to monitoring of wall thinning in high temperature environment. Int. J. Appl. Electromagnet Mech 33, 1317–1327. ( 10.3233/JAE-2010-1256) [DOI] [Google Scholar]
- 33.Uchimoto T, Guy P, Takagi T, Courbon J. 2014. Evaluation of an EMAT–EC dual probe in sizing extent of wall thinning. NDT E Int. 62, 160–166. ( 10.1016/j.ndteint.2013.12.007) [DOI] [Google Scholar]
- 34.Xie S, Tian M, Xiao P, Pei C, Chen Z, Takagi T. 2017. A hybrid nondestructive testing method of pulsed eddy current testing and electromagnetic acoustic transducer techniques for simultaneous surface and volumetric defects inspection. NDT E Int. 86, 153–163. ( 10.1016/j.ndteint.2016.12.006) [DOI] [Google Scholar]
- 35.Ribichini R, Cegla F, Nagy P, Cawley P. 2012. Experimental and numerical evaluation of electromagnetic acoustic transducer performance on steel materials. NDT E Int. 45, 32–38. ( 10.1016/j.ndteint.2011.08.007) [DOI] [Google Scholar]
- 36.Ribichini R, Nagy P, Ogi H. 2012. The impact of magnetostriction on the transduction of normal bias field EMATS. NDT E Int. 51, 8–15. ( 10.1016/j.ndteint.2012.06.004) [DOI] [Google Scholar]
- 37.Ding X, Wu X, Wang Y. 2014. Bolt axial stress measurement based on a mode-converted ultrasound method using an electromagnetic acoustic transducer. Ultrasonics 54, 914–920. ( 10.1016/j.ultras.2013.11.003) [DOI] [PubMed] [Google Scholar]
Associated Data
This section collects any data citations, data availability statements, or supplementary materials included in this article.
Data Availability Statement
This article has no additional data.


