

Key Points
Question
What are trends in optic neuritis (ON) incidence and prevalence and the associations with systemic and neurologic disease?
Findings
This cohort study of more than 11 million patients found an ON incidence of 3.7 per 100 000 person-years, affecting 115 per 100 000 population in 2018 (76 279 people in the United Kingdom). Case-control and matched cohort analyses identify a strong association with multiple sclerosis (MS) and weaker associations with Behçet disease, sarcoidosis, and Sjögren syndrome, among others.
Meaning
The incidence of ON is stable and predominantly associated with MS. Numerous other disease associations, individually rare, indicate that a significant number of patients without MS but with ON require urgent management to preserve sight.
Abstract
Importance
Epidemiologic data on optic neuritis (ON) incidence and associations with immune-mediated inflammatory diseases (IMIDs) are sparse.
Objective
To estimate 22-year trends in ON prevalence and incidence and association with IMIDs in the United Kingdom.
Design, Setting, and Participants
This cohort study analyzed data from The Health Improvement Network from January 1, 1995, to September 1, 2019. The study included 10 937 511 patients 1 year or older with 75.2 million person-years’ follow-up. Annual ON incidence rates were estimated yearly (January 1, 1997, to December 31, 2018), and annual ON prevalence was estimated by performing sequential cross-sectional studies on data collected on January 1 each year for the same period. Data for 1995, 1996, and 2019 were excluded as incomplete. Risk factors for ON were explored in a cohort analysis from January 1, 1997, to December 31, 2018. Matched case-control and retrospective cohort studies were performed using data from January 1, 1995, to September 1, 2019, to explore the odds of antecedent diagnosis and hazard of incident diagnosis of 66 IMIDs in patients compared with controls.
Exposures
Optic neuritis.
Main Outcomes and Measures
Annual point prevalence and incidence rates of ON, adjusted incident rate ratios (IRRs) for risk factors, and adjusted odds ratios (ORs) and adjusted hazard ratios (HRs) for 66 IMIDs.
Results
A total of 10 937 511 patients (median [IQR] age at cohort entry, 32.6 [18.0-50.4] years; 5 571 282 [50.9%] female) were studied. A total of 1962 of 2826 patients (69.4%) with incident ON were female and 1192 of 1290 92.4%) were White, with a mean (SD) age of 35.6 (15.6) years. Overall incidence across 22 years was stable at 3.7 (95% CI, 3.6-3.9) per 100 000 person-years. Annual point prevalence (per 100 000 population) increased with database maturity, from 69.3 (95% CI, 57.2-81.3) in 1997 to 114.8 (95% CI, 111.0-118.6) in 2018. The highest risk of incident ON was associated with female sex, obesity, reproductive age, smoking, and residence at higher latitude, with significantly lower risk in South Asian or mixed race/ethnicity compared with White people. Patients with ON had significantly higher odds of prior multiple sclerosis (MS) (OR, 98.22; 95% CI, 65.40-147.52), syphilis (OR, 5.76; 95% CI, 1.39-23.96), Mycoplasma (OR, 3.90; 95% CI, 1.09-13.93), vasculitis (OR, 3.70; 95% CI, 1.68-8.15), sarcoidosis (OR, 2.50; 95% CI, 1.21-5.18), Epstein-Barr virus (OR, 2.29; 95% CI, 1.80-2.92), Crohn disease (OR, 1.97; 95% CI, 1.13-3.43), and psoriasis (OR, 1.28; 95% CI, 1.03-1.58). Patients with ON had a significantly higher hazard of incident MS (HR, 284.97; 95% CI, 167.85-483.81), Behçet disease (HR, 17.39; 95% CI, 1.55-195.53), sarcoidosis (HR, 14.80; 95% CI, 4.86-45.08), vasculitis (HR, 4.89; 95% CI, 1.82-13.10), Sjögren syndrome (HR, 3.48; 95% CI, 1.38-8.76), and herpetic infection (HR, 1.68; 95% CI, 1.24-2.28).
Conclusions and Relevance
The UK incidence of ON is stable. Even though predominantly associated with MS, ON has numerous other associations with IMIDs. Although individually rare, together these associations outnumber MS-associated ON and typically require urgent management to preserve sight.
This cohort study estimates 22-year trends in optic neuritis prevalence and incidence and association with immune-mediated inflammatory disease in the United Kingdom.
Introduction
Epidemiologic data on optic neuritis (ON) and ON-associated diseases are sparse. Incidence rates (per 100 000 person-years) vary more than 5-fold, between 0.83 (Singapore, 2009)1 and 5.36 (Barcelona, Spain, 2008-2012).2 One possible explanation is variation in the prevalence of multiple sclerosis (MS) and other immune-mediated inflammatory disease (IMID). In this study, we consider IMID as a final common pathway for inciting infectious and noninfectious (autoimmune and autoinflammatory) pathologic changes. Delayed diagnosis and initiation of high-dose glucocorticoid therapy in ON cases not associated with atypical MS may result in irreversible sight loss.3,4 Population-level data on the prior probability of ON-associated IMIDs would inform cross-specialty awareness of ON and support workforce planning, better-informed investigation, and demand modeling for high-cost immunosuppressive therapy.
A National Health Service primary care electronic patient record database, The Health Improvement Network (THIN), provides an opportunity to interrogate the epidemiology of ON and its associated IMIDs. The most frequent associations are with autoimmune disease, extending from MS and neuromyelitis optica (NMO) to include anti–myelin oligodendrocyte glycoprotein ON, and many rarer associations.5 Optic neuritis also develops in the context of reactive, primary, and secondary vasculitides, infection, postinfectious autoimmune reactions (including with human coronavirus disease 2019 [COVID-19]),6 recent vaccination, and medication (eg, anti–tumor necrosis factor α therapy).5 In addition, ON develops in conjunction with other ocular presentations, including uveitis7,8 and scleritis.9
This study has 2 aims. The first is to ascertain 22-year trends in the incidence and prevalence of ON in the general UK population and risk factors for incident ON. The second aim is to explore the strength of the association between ON and 66 IMIDs.5
Methods
Data Source
We analyzed The Health Improvement Network (THIN) data from January 1, 1995, to September 1, 2019. THIN is a UK national population–representative database of electronic primary care records.10,11 It contains anonymized, coded information for more than 15 million patients from 808 primary care general practices, including patient demographics, diagnoses, drug prescriptions, and laboratory test results. This work used deidentified data provided by patients as a part of their routine primary care. No individual-level prospective consent was obtained in the creation of the THIN database. This study was approved by the UK Research Ethics Committee. In accordance with this approval, the study protocol was reviewed and approved by an independent Scientific Review Committee. This study followed the Strengthening the Reporting of Observational Studies in Epidemiology (STROBE) reporting guideline.
Design
We estimated annual ON incidence rates through yearly (January 1 to December 31) cohort studies for 1997 to 2018. We estimated annual ON prevalence by performing sequential cross-sectional studies on data collected on January 1 each year for the same period. Data for 1995, 1996, and 2019 were excluded as incomplete. Risk factors for ON were explored in a cohort analysis from 1997 to 2018. We performed matched case-control and retrospective cohort studies using data from January 1, 1995, to September 1, 2019, to explore the odds of antecedent diagnosis and the hazard of incident diagnosis of 66 IMIDs in patients with ON compared with controls.
Study Population
General practices were eligible for inclusion 1 year after commencing electronic medical record use and 1 year after reporting acceptable mortality rates (a data quality indicator). We included patients 1 year or older who were registered with an eligible general practice at least 1 year before cohort entry (to ensure documentation of important baseline covariates).
In the United Kingdom, ON is diagnosed exclusively by hospital specialists. Diagnosis is communicated to general practitioners, who enter the clinical (Read) code into the electronic medical record. eTable 1 in the Supplement reports the Read codes included in our case definition.
For the matched case-control and cohort studies, we randomly matched patients with incident (newly diagnosed during the study period) ON with 4 controls selected from a pool of age-, sex-, region-, and Townsend Deprivation Index (TDI)–matched patients without ON.12,13 We used an established method for randomization to identify matched controls.14 Index dates for patients with ON were the ON diagnosis dates. The same index date was assigned to the corresponding matched controls to avoid immortal time bias.15 We matched age at index date to within 1 year. Patients with ON and controls were followed up from the index date until the earliest of the following events: incident IMID diagnosis, defined using Read codes for each disease; death; patient leaving the general practice; general practice ceasing database contributions; or study end. Where TDI was missing, we matched patients with ON with a control in whom it was also missing.
Statistical Analysis
We estimated annual ON incidence rates with 95% CIs by dividing the number of patients with newly diagnosed ON by the total person-years at risk. Across the entire study period, we estimated overall incidence rates stratified by age and sex. For point prevalence, we calculated the proportion of eligible patients with ON on January 1 each year.
To explore risk factors for ON, we performed univariable and multivariable Poisson regression analyses to estimate crude and adjusted incidence rate ratios (aIRRs), offsetting for person-years of follow-up. The adjustment variables we considered included age category at index date, sex, race/ethnicity, smoking category, body mass index (BMI) category, nation, and TDI.12,13 We created a separate category for missing data. We included variables with a significance at 2-sided P < .10 in single variable analyses in multivariable models. All variables were recorded at cohort entry and summarized using descriptive statistics: mean (SD) or median (interquartile range [IQR]) for continuous variables and number (percentage) for categorical variables.
We performed a case-control and matched cohort study on patients presenting between January 1, 1995, and September 1, 2019. For patients with ON compared with matched controls, we calculated the odds of prior diagnosis and hazard of incident diagnosis of each IMID, excluding patients with prior diagnosis at baseline from the latter. We performed logistic regression analysis to obtain crude and adjusted odds ratios (ORs) for each IMID at baseline, comparing patients with and without ON. We estimated adjusted hazard ratios (HRs) using Cox proportional hazards regression models for each IMID. The adjustment variables were the same as those selected for the multivariable Poisson model. We checked model assumptions using log-log plots and the Schoenfeld residuals test. We used the Nelson-Aalen cumulative hazard function to plot cumulative hazard of these outcomes. Analyses were performed with Stata IC, version 15.1 (StataCorp LLC). We set statistical significance at 2-sided P < .05.
Results
Incidence and Prevalence
The cross-sectional and retrospective cohort studies included 10 937 511 patients (median [IQR] age at cohort entry, 32.6 [18.0-50.4] years; 5 571 282 [50.9%] female) with 75.2 million person-years of follow-up. Annual ON incidence remained stable, with an overall rate across the 22-year period of 3.7 (95% CI, 3.6-3.8) per 100 000 person-years (Figure 1A and eTable 2 in the Supplement). This overall rate comprised an incidence of 0.77 (95% CI, 0.64-0.90) per 100 000 person-years in children (1-17 years of age) and 4.5 (95% CI, 4.3-4.6) per 100 000 person-years in adults. Figure 1B illustrates incidence stratified by age at ON onset and sex. The prevalence of ON (per 100 000 population) increased from 69.3 (95% CI, 57.2-81.3) in 1997 to 114.8 (95% CI, 111.0-118.6) in 2018 (eFigure 1 and eTable 2 in the Supplement), with an estimated 76 279 (95% CI, 73 744-78 814) patients in the UK in 2018.16
Figure 1. Incidence of Optic Neuritis (ON) in the UK Population From 1997 to 2018.
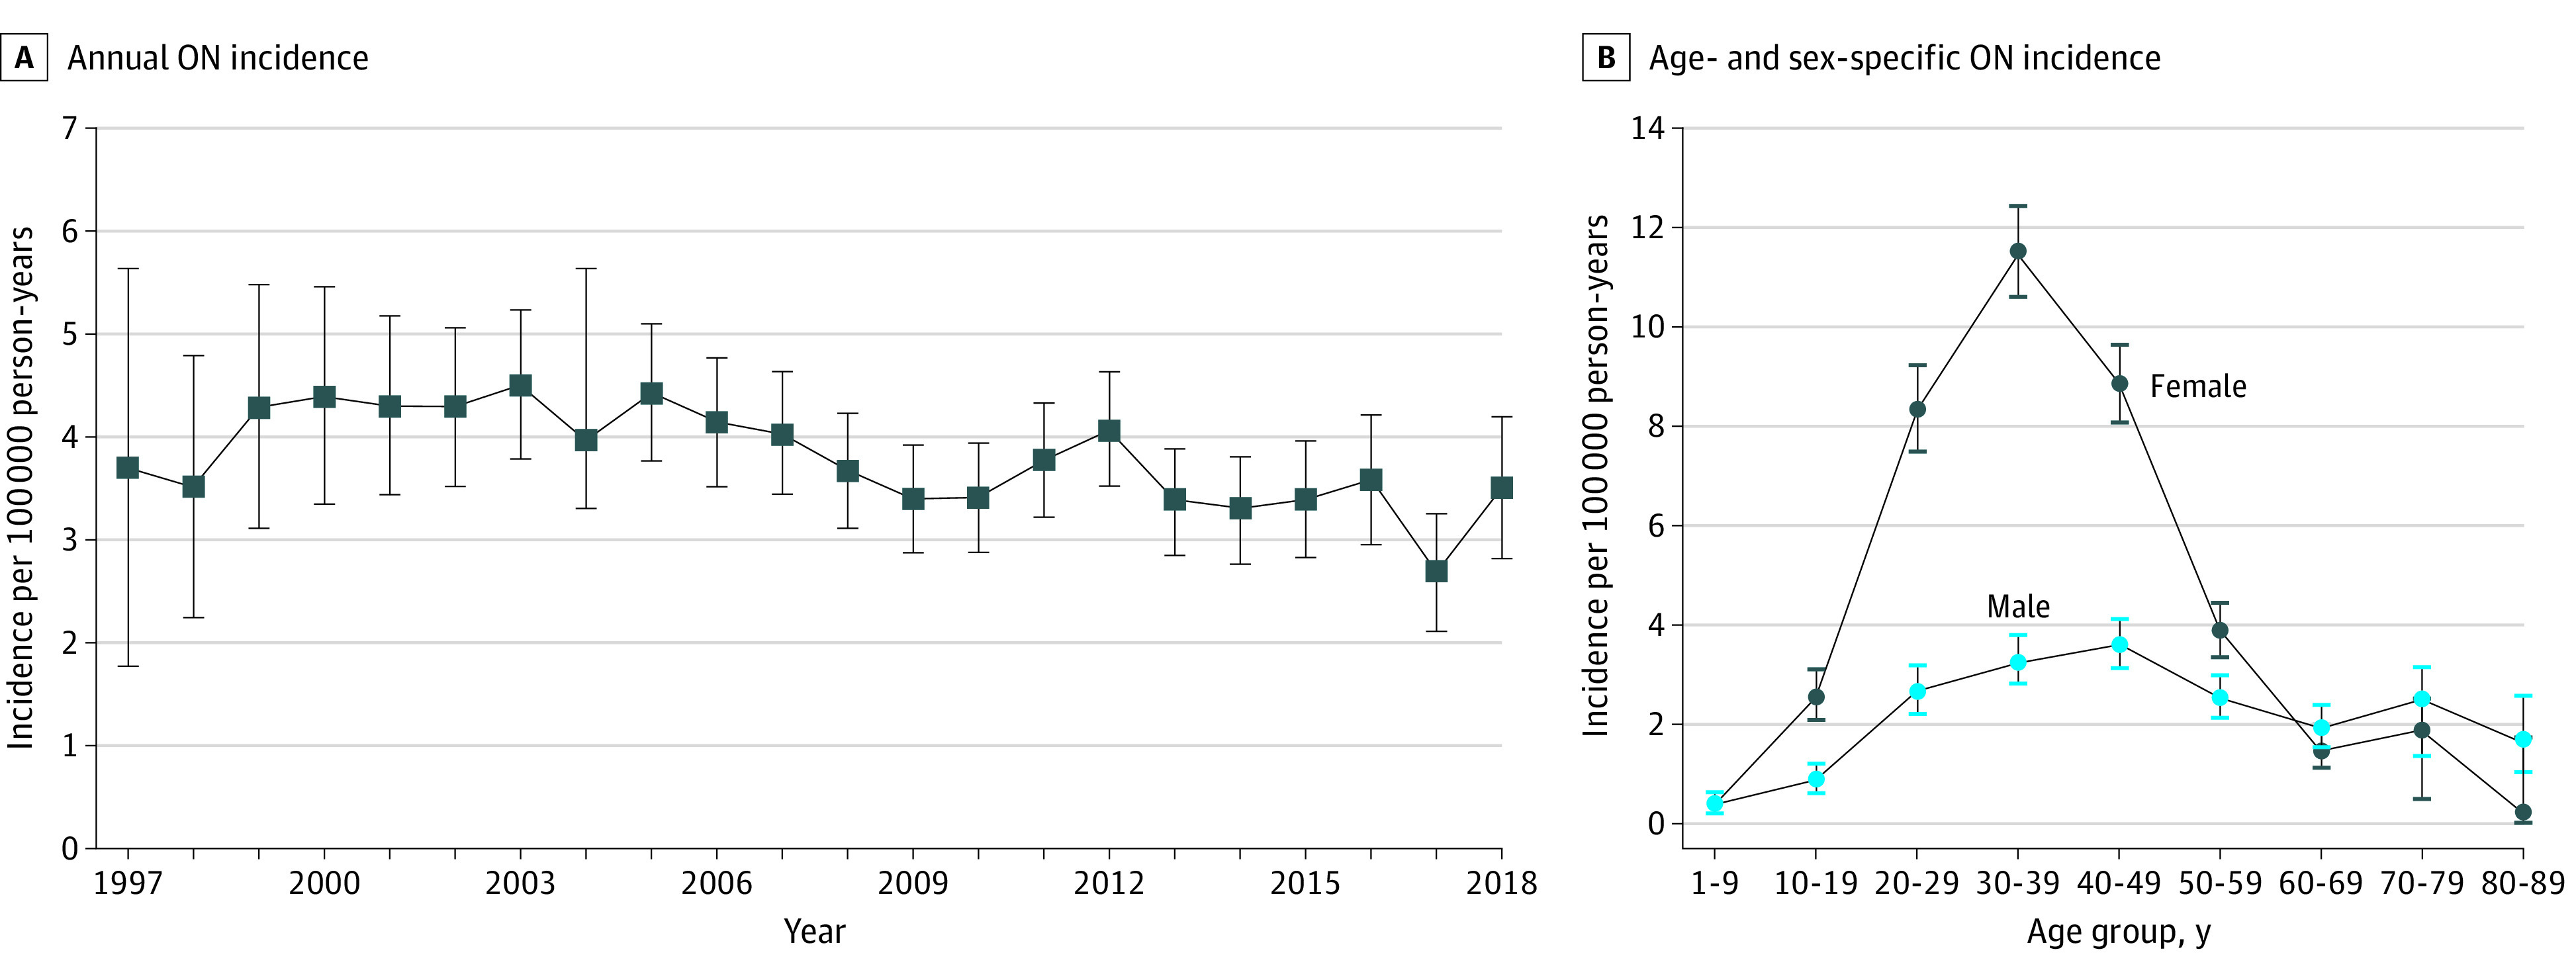
Error bars indicate 95% CIs.
Risk Factors for Incident ON
Table 1 compares the characteristics of 2826 patients with incident ON and the general population without ON. Of the patients with incident ON, 1962 (69.4%) were female, the mean (SD) age at study entry was 35.6 (15.6) years (range, 2-94 years), 1192 of 1290 (92.4%) were White, 1013 of 2178 (46.5%) were smokers or ex-smokers, 599 of 2359 (25.4%) were from TDI category 1 (least deprived), and 1943 (68.8%) resided in England. The mean (SD) BMI at study entry was 26.3 (5.9) (calculated as weight in kilograms divided by height in meters squared) (missing n = 915).
Table 1. Comparison of the UK Population Exposed and Not Exposed to Incident ON.
| Characteristic at baseline | ON, No. (%) | Single-variable IRR (95% CI) | P value | aIRR (95% CI) | P value | |
|---|---|---|---|---|---|---|
| Yes (n = 2826) | No (n = 10 934 685) | |||||
| Female sex | 1962 (69.4) | 5 569 320 (50.9) | 2.26 (2.09-2.45) | <.001 | 2.26 (2.08-2.45) | <.001 |
| Age group at cohort entry, y | ||||||
| 1-10 | 121 (4.3) | 2 070 338 (19.9) | 1 [Reference] | NA | 1 [Reference] | NA |
| 11-20 | 284 (10.1) | 1 081 405 (9.9) | 4.56 (3.69-5.64) | <.001 | 4.53 (3.65-5.62) | <.001 |
| 21-30 | 704 (24.9) | 1 984 337 (18.2) | 7.81 (6.44-9.47) | <.001 | 6.80 (5.50-8.40) | <.001 |
| 31-40 | 796 (28.2) | 1 814 484 (16.6) | 6.98 (5.77-8.45) | <.001 | 6.04 (4.89-7.46) | <.001 |
| 41-50 | 473 (16.7) | 1 324 681 (12.1) | 4.84 (3.97-5.91) | <.001 | 4.15 (3.33-5.16) | <.001 |
| 51-60 | 235 (8.3) | 1 045 254 (9.6) | 2.92 (2.35-3.64) | <.001 | 2.45 (1.93-3.10) | <.001 |
| 61-70 | 125 (4.4) | 765 334 (7.0) | 2.21 (1.72-2.83) | <.001 | 1.82 (1.39-2.38) | <.001 |
| 71-80 | 67 (2.4) | 526 666 (4.8) | 2.08 (1.55-2.81) | <.001 | 1.69 (1.24-2.31) | <.001 |
| 81-90 | 21 (0.7) | 270 755 (2.5) | 2.11 (1.33-3.36) | .002 | 1.68 (1.05-2.69) | <.001 |
| 91-100 | 0 | 50 687 (0.5) | NA | NA | NA | NA |
| ≥101 | 0 | 744 (0.0) | NA | NA | NA | NA |
| Nation | ||||||
| England | 1943 (68.8) | 7 790 740 (71.3) | 1 [Reference] | NA | 1 [Reference] | NA |
| Scotland | 452 (16.0) | 1 538 041 (14.1) | 1.22 (1.10-1.35) | <.001 | 1.19 (1.08-1.32) | .001 |
| Wales | 285 (10.1) | 1 203 405 (11.0) | 0.91 (0.81-1.04) | .16 | 0.91 (0.80-1.03) | .15 |
| Northern Ireland | 146 (5.2) | 402 499 (3.4) | 1.07 (0.90-1.26) | .44 | 1.08 (0.91-1.28) | .38 |
| Townsend Deprivation Index quintile | ||||||
| 1 (Least deprived) | 599 (21.2) | 1 984 597 (18.2) | 1 [Reference] | NA | NI | NI |
| 2 | 511 (18.1) | 1 807 282 (16.5) | 0.99 (0.88-1.11) | .84 | ||
| 3 | 513 (18.2) | 1 910 584 (17.5) | 1.01 (0.90-1.14) | .87 | ||
| 4 | 434 (15.4) | 1 783 263 (16.3) | 0.98 (0.87-1.11) | .76 | ||
| 5 (Most deprived) | 302 (10.7) | 1 314 297 (12.0) | 0.95 (0.83-1.10) | .51 | ||
| Missing | 467 (16.5) | 2 134 662 (19.5) | 1.03 (0.91-1.16) | .65 | ||
| Race/ethnicity | ||||||
| White | 1192 (42.2) | 4 262 489 (39.0) | 1 [Reference] | NA | 1 [Reference] | NA |
| Black | 42 (1.5) | 177 881 (1.6) | 1.21 (0.89-1.65) | .22 | 1.16 (0.85-1.58) | .34 |
| Mixed | 12 (0.4) | 131 325 (1.2) | 0.58 (0.33-1.03) | .06 | 0.52 (0.30-0.92) | .02 |
| Other | 13 (0.5) | 70 383 (0.6) | 1.05 (0.61-1.81) | .86 | 1.14 (0.66-1.97) | .64 |
| South Asian | 31 (1.1) | 262 376 (2.4) | 0.55 (0.39-0.79) | .001 | 0.56 (0.39-0.80) | .001 |
| Missing | 1536 (54.4) | 6 030 231 (55.2) | 0.87 (0.81-0.94) | <.001 | 0.97 (0.89-1.05) | .40 |
| BMI at cohort entry | ||||||
| Underweight (<18.5) | 46 (1.6) | 182 124 (1.7) | 0.96 (0.71-1.29) | .77 | 0.83 (0.61-1.11) | .21 |
| Normal (18.5-24.9) | 906 (32.1) | 2 795 714 (25.6) | 1 [Reference] | NA | 1 [Reference] | NA |
| Overweight (25.0-29.9) | 549 (19.4) | 1 918 201 (17.5) | 0.81 (0.73-0.91) | <.001 | 1.04 (0.94-1.16) | .44 |
| Obese (30.0-34.9) | 259 (9.2) | 733 314 (6.7) | 1.03 (0.90-1.19) | .64 | 1.27 (1.11-1.46) | .001 |
| Morbidly obese (>35.0) | 151 (5.3) | 355 770 (3.2) | 1.30 (1.10-1.55) | .003 | 1.37 (1.15-1.63) | <.001 |
| Missing BMI | 915 (32.4) | 4 949 562 (45.3) | 0.54 (0.49-0.59) | <.001 | 0.92 (0.82-1.04) | .18 |
| Smoking status at cohort entry | ||||||
| Never smoker | 1165 (41.2) | 4 229 870 (38.7) | 1 [Reference] | NA | 1 [Reference] | NA |
| Ex-smoker | 312 (11.0) | 1 158 945 (10.6) | 1.03 (0.91-1.17) | .66 | 1.19 (1.05-1.35) | .007 |
| Current smoker | 701 (24.8) | 1 852 089 (16.9) | 1.37 (1.25-1.50) | <.001 | 1.32 (1.20-1.45) | <.001 |
| Missing | 648 (22.9) | 3 693 781 (33.8) | 0.56 (0.51-0.62) | <.001 | 1.09 (0.95-1.24) | .22 |
Abbreviations: aIRR, adjusted incident rate ratio; BMI, body mass index (calculated as weight in kilograms divided by height in meters squared); NA, not applicable; NI, not included in model; ON, optic neuritis.
In a multivariable Poisson regression model (Table 1), significant factors associated with incident ON included age category at study entry (peak difference in the 21- to 30-year-old group compared with the reference group [1-10 years] of 24.9% vs 18.2%; aIRR, 6.80; 95% CI, 5.50-8.40; P < .001), female sex (69.4% vs 50.9%; aIRR, 2.26; 95% CI, 2.08-2.45; P < .001), residence in Scotland compared with England (aIRR, 1.19; 95% CI, 1.08-1.32; P = .001), obesity (aIRR, 1.27; 95% CI, 1.11-1.46; P = .001) or morbid obesity (aIRR, 1.37; 95% CI, 1.15-1.63; P < .001) compared with normal weight, and ex-smoker (aIRR, 1.19; 95% CI, 1.05-1.35; P = .007) or current smoker (aIRR, 1.32; 95% CI, 1.20-1.45; P < .001) compared with never smoking, with no association with TDI. Compared with White race, risk of incident ON was lower in patients of mixed race/ethnicity (aIRR, 0.52; 95% CI, 0.30-0.92; P = .02) or South Asian ethnicity (aIRR, 0.56; 95% CI, 0.39-0.80; P = .001).
Matched Case-Control and Matched Cohort Studies
We included 2894 patients with incident ON (113 with onset age ≤17 years) and 11 576 controls (January 1, 1995, to September 1, 2019). At first diagnosis, 1944 cases of ON (67.2%) were idiopathic, 449 (15.5%) were associated with a baseline non-MS IMID diagnosis, 415 (14.3%) were associated with baseline MS, and 86 (3.0%) were associated with both MS and 1 or more IMID (most frequently Epstein-Barr virus, psoriasis, and herpetic infection). In addition, associated inflammatory ocular phenotypes were not uncommon: uveitis was diagnosed in 37 idiopathic ON cases (1.9%), 21 non-MS IMID ON cases (4.5%), 12 ON cases (2.9%) associated with MS, and 8 cases (9.3%) with both MS and another IMID ON; scleritis was diagnosed in 6 idiopathic ON cases (0.3%) and 10 cases (2.2%) with baseline non-MS IMID ON.
In a series of adjusted logistic regression analyses, we compared patients with and without ON and found that baseline IMID diagnosis was more common in patients with ON (Table 2 and Figure 2). Patients with ON had significantly higher odds of baseline diagnosis of MS, syphilis, Mycoplasma, vasculitis, sarcoidosis, Epstein-Barr virus, Crohn disease, and psoriasis (by decreasing strength of association). In addition, diagnoses of NMO (n = 6 [0.21%]), granulomatosis with polyangiitis (n = 5 [0.17%]), Behçet disease (n = 3 [0.10%]), and Cogan syndrome (n = 1 [0.03%]) were observed in patients with ON but not controls.
Table 2. Association of ON With IMIDs Among Patients With and Without ON .
| Associated conditiona | Case-control analysis | Retrospective matched cohort analysisb | ||||||
|---|---|---|---|---|---|---|---|---|
| No. (%) | Adjusted OR (95% CI)c | P value | No. (%) | Adjusted HR (95% CI)c | P value | |||
| Cases (n = 2894) | Controls (n = 11 576) | Patients with ON (n = 2893) | Controls (n = 11 576) | |||||
| Associated inflammatory ocular clinical phenotypes | ||||||||
| Scleritis | 0.55 (16) | 0.06 (7) | 10.07 (4.04-25.12) | <.001 | 0.07 (2) | 0.03 (4) | 2.49 (0.44-14.23) | .30 |
| Uveitis | 2.70 (78) | 0.58 (67) | 4.79 (3.42-6.72) | <.001 | 0.75 (21) | 0.19 (22) | 5.06 (3.21-7.97) | <.001 |
| Autoimmune and autoinflammatory IMIDs | ||||||||
| Antiphospholipid syndrome | 0.21 (6) | 0.01 (1) | 0.70 (0.08-6.04) | .74 | 0.07 (2) | 0.03 (4) | 2.39 (0.33-17.17) | .39 |
| Behçet disease | 0.10 (3) | 0.00 (0) | Not estimable | 0.07 (2) | 0.01 (1) | 17.39 (1.55-195.53) | .02 | |
| Cogan syndrome | 0.03 (1) | 0 | Not estimable | 0 | 0 | No data | ||
| CREST syndrome | 0 | 0 | No data | 0.03 (1) | 0 | Not estimable | ||
| Crohn disease | 0.69 (20) | 0.33 (38) | 1.97 (1.13-3.43) | .02 | 0.21 (6) | 0.10 (12) | 1.39 (0.66-2.90) | .39 |
| Dermatomyositis or polymyositis | 0.07 (2) | 0.03 (3) | 2.93 (0.46-18.53) | .25 | 0.03 (1) | 0.02 (2) | 4.57 (0.25-84.43) | .31 |
| Giant cell arteritis | 0.90 (26) | 0.07 (8) | 16.16 (6.92-37.75) | <.001 | 0.56 (16) | 0.03 (4) | 27.04 (10.28-71.09) | <.001 |
| Granulomatosis with polyangiitis | 0.17 (5) | 0 | Not estimable | 0.14 (4) | 0 | Not estimable | ||
| Henoch-Schönlein purpura | 0.07 (2) | 0.19 (22) | 0.31 (0.07-1.33) | .11 | 0.03 (1) | 0 | Not estimable | |
| Juvenile idiopathic arthritis | 0.03 (1) | 0.03 (4) | 0.74 (0.07-7.38) | .80 | 0 | 0 | No data | |
| Kawasaki syndrome | 0 | 0.02 (2) | Not estimable | 0 | 0 | No data | ||
| Paraneoplastic disorder | 0 | 0 | No data | 0.07 (2) | 0 | Not estimable | ||
| Polyarteritis nodosum | 0 | 0.02 (2) | Not estimable | 0 | 0 | No data | ||
| Polymyalgia rheumatica | 0.62 (18) | 0.28 (32) | 2.14 (1.17-3.92) | .01 | 0.45 (13) | 0.25 (29) | 2.05 (1.14-3.71) | .02 |
| Psoriasis | 4.28 (124) | 3.08 (357) | 1.28 (1.03-1.58) | .02 | 1.16 (32) | 0.85 (95) | 1.04 (0.77-1.41) | .79 |
| Reiter syndrome | 0.07 (2) | 0.02 (2) | 4.68 (0.60-36.41) | .14 | 0 | 0 | No data | |
| Rheumatoid arthritis | 0.69 (20) | 0.54 (63) | 1.13 (0.67-1.88) | .65 | 0.42 (12) | 0.35 (40) | 0.90 (0.55-1.48) | .68 |
| Sarcoidosis | 0.45 (13) | 0.16 (18) | 2.50 (1.21-5.18) | .01 | 0.49 (14) | 0.03 (4) | 14.80 (4.86-45.08) | <.001 |
| Sjogren syndrome | 0.10 (3) | 0.08 (9) | 1.22 (0.32-4.62) | .76 | 0.24 (7) | 0.07 (8) | 3.48 (1.38-8.76) | .008 |
| Systemic lupus erythematosus | 0.17 (5) | 0.27 (31) | 0.67 (0.26-1.73) | .40 | 0.24 (7) | 0.09 (10) | 2.12 (0.87-5.15) | .10 |
| Systemic sclerosis | 0 | 0.03 (3) | Not estimable | 0 | 0.01 (1) | Not estimable | ||
| Ulcerative colitis | 0.41 (12) | 0.32 (37) | 1.42. (0.73-2.76) | .30 | 0.17 (5) | 0.12 (14) | 1.08 (0.43-2.69) | .88 |
| Vasculitis, other | 0.45 (13) | 0.11 (13) | 3.70 (1.68-8.15) | .001 | 0.28 (8) | 0.05 (6) | 4.89 (1.82-13.10) | .002 |
| Diagnosed IMIDsa | ||||||||
| Neurologic IMIDs | ||||||||
| Multiple sclerosis | 17.31 (501) | 0.22 (25) | 98.22 (65.40-147.52) | <.001 | 22.36 (535) | 0.08 (9) | 284.97 (167.85-483.81) | <.001 |
| Neuromyelitis optica | 0.21 (6) | 0 | Not estimable | 1.18 (34) | 0 | Not estimable | ||
| Infections or infectious IMIDs | ||||||||
| Brucellosis | 0.03 (1) | 0 | Not estimable | 0 | 0 | No data | ||
| Cytomegalovirus | 0.03 (1) | 0 | Not estimable | 0 | 0 | No data | ||
| Dengue fever | 0.03 (1) | 0.01 (1) | 16.6 (0.33-746.03) | .16 | 0 | 0 | No data | |
| Epstein-Barr virus | 3.80 (110) | 1.73 (200) | 2.29 (1.80-2.92) | <.001 | 0.07 (2) | 0.10 (11) | 0.67 (0.15-3.06) | .61 |
| Hepatitis B | 0.24 (7) | 0.23 (27) | 1.05 (0.45-2.45) | .91 | 0.03 (1) | 0.04 (5) | 1.12 (0.10-12.02) | .93 |
| Hepatitis C | 0.03 (1) | 0.08 (9) | 0.41 (0.05-3.26) | .40 | 0 | 0.03 (3) | Not estimable | |
| Herpetic infection | 4.08 (118) | 3.19 (369) | 1.22 (0.98-1.51) | .07 | 1.80 (50) | 1.05 (118) | 1.68 (1.24-2.28) | .001 |
| HIV | 0.07 (2) | 0.07 (8) | 0.88 (0.17-4.52) | .88 | 0 | 0.03 (3) | Not estimable | |
| Lyme disease | 0.03 (1) | 0.01 (1) | 75.99 (0.12-48 418.89) | .19 | 0.03 (1) | 0 | Not estimable | |
| Measles | 1.21 (35) | 1.14 (132) | 1.06 (0.72-1.55) | .76 | 0.03 (1) | 0.01 (1) | 118.41 (0.00-993 247) | .41 |
| Mumps | 1.38 (40) | 1.26 (146) | 1.08 (0.75-1.54) | .68 | 0.07 (2) | 0.06 (7) | 1.02 (0.20-5.08) | .98 |
| Mycoplasma | 0.17 (5) | 0.04 (5) | 3.90 (1.09-13.93) | .04 | 0 | 0 | No data | |
| Rubella | 0.73 (21) | 0.81 (94) | 0.91 (0.56-1.47) | .69 | 0 | 0.03 (4) | Not estimable | |
| Syphilis | 0.21 (6) | 0.03 (3) | 5.76 (1.39-23.96) | .02 | 0.03 (1) | 0 | Not estimable | |
| Tick-borne fever | 0 | 0.03 (3) | Not estimable | 0 | 0 | No data | ||
| Tuberculosis | 0.31 (9) | 0.48 (55) | 0.69 (0.33-1.41) | .30 | 0.14 (4) | 0.09 (10) | 1.44 (0.44-4.66) | .54 |
| Toxoplasmosis | 0.14 (4) | 0.04 (5) | 2.63 (0.69-10.02) | .15 | 0.10 (3) | 0 | Not estimable | |
| Yaws | 0 | 0.01 (1) | Not estimable | 0 | 0 | No data | ||
Abbreviations: CREST, calcinosis, Raynaud disease, esophageal dysfunction, sclerodactyly, telangiectasia; HR, hazard ratio; IMIDs, immune-mediated inflammatory diseases; ON, optic neuritis; OR, odds ratio.
Diseases (n = 15) for which Read code data were available in The Health Improvement Network (THIN) but no data present in patients with ON or controls (and thus excluded from analysis): ankylosing spondylitis, Vogt-Koyanagi-Harada disease, Churg-Strauss syndrome, chikungunya virus, Coxiella virus, histoplasmosis, leprosy, microscopic polyangiitis, Susac syndrome, Takayasu arteritis, toxocariasis, typhus, West Nile virus, Whipple disease, and Zika virus. Diseases for which no Read codes were recorded in the THIN data set (n = 8): anti–myelin oligodendrocyte glycoprotein associated optic neuritis, Blau syndrome, ehrlichiosis, Inoue-Melnick virus, Bartonella or cat scratch disease, hypertrophic pachymeningitis, human herpesvirus 6, and human coronaviruses. There was also no specific Read code for cytoplasmic or perinuclear antineutrophil cytoplasmic antibody positivity, but these conditions were likely captured under a combination of Read codes, grouped here as vasculitis, other.
Patients with a record of the comorbidity at baseline were excluded for the corresponding follow-up analysis estimating adjusted incident rate ratios.
All models were adjusted for sex, age category, ethnicity, body mass index category, smoking category, country, and Townsend Deprivation Index.
Figure 2. Forest Plots of the Adjusted Odds Ratio (aOR) of a Prevalent Diagnosis of an Immune-Mediated Inflammatory Disease (IMID) at Baseline Optic Neuritis (ON) Diagnosis and Adjusted Hazard Ratio (aHR) of an Incident Diagnosis of an IMID During Follow-up After ON Diagnosis.
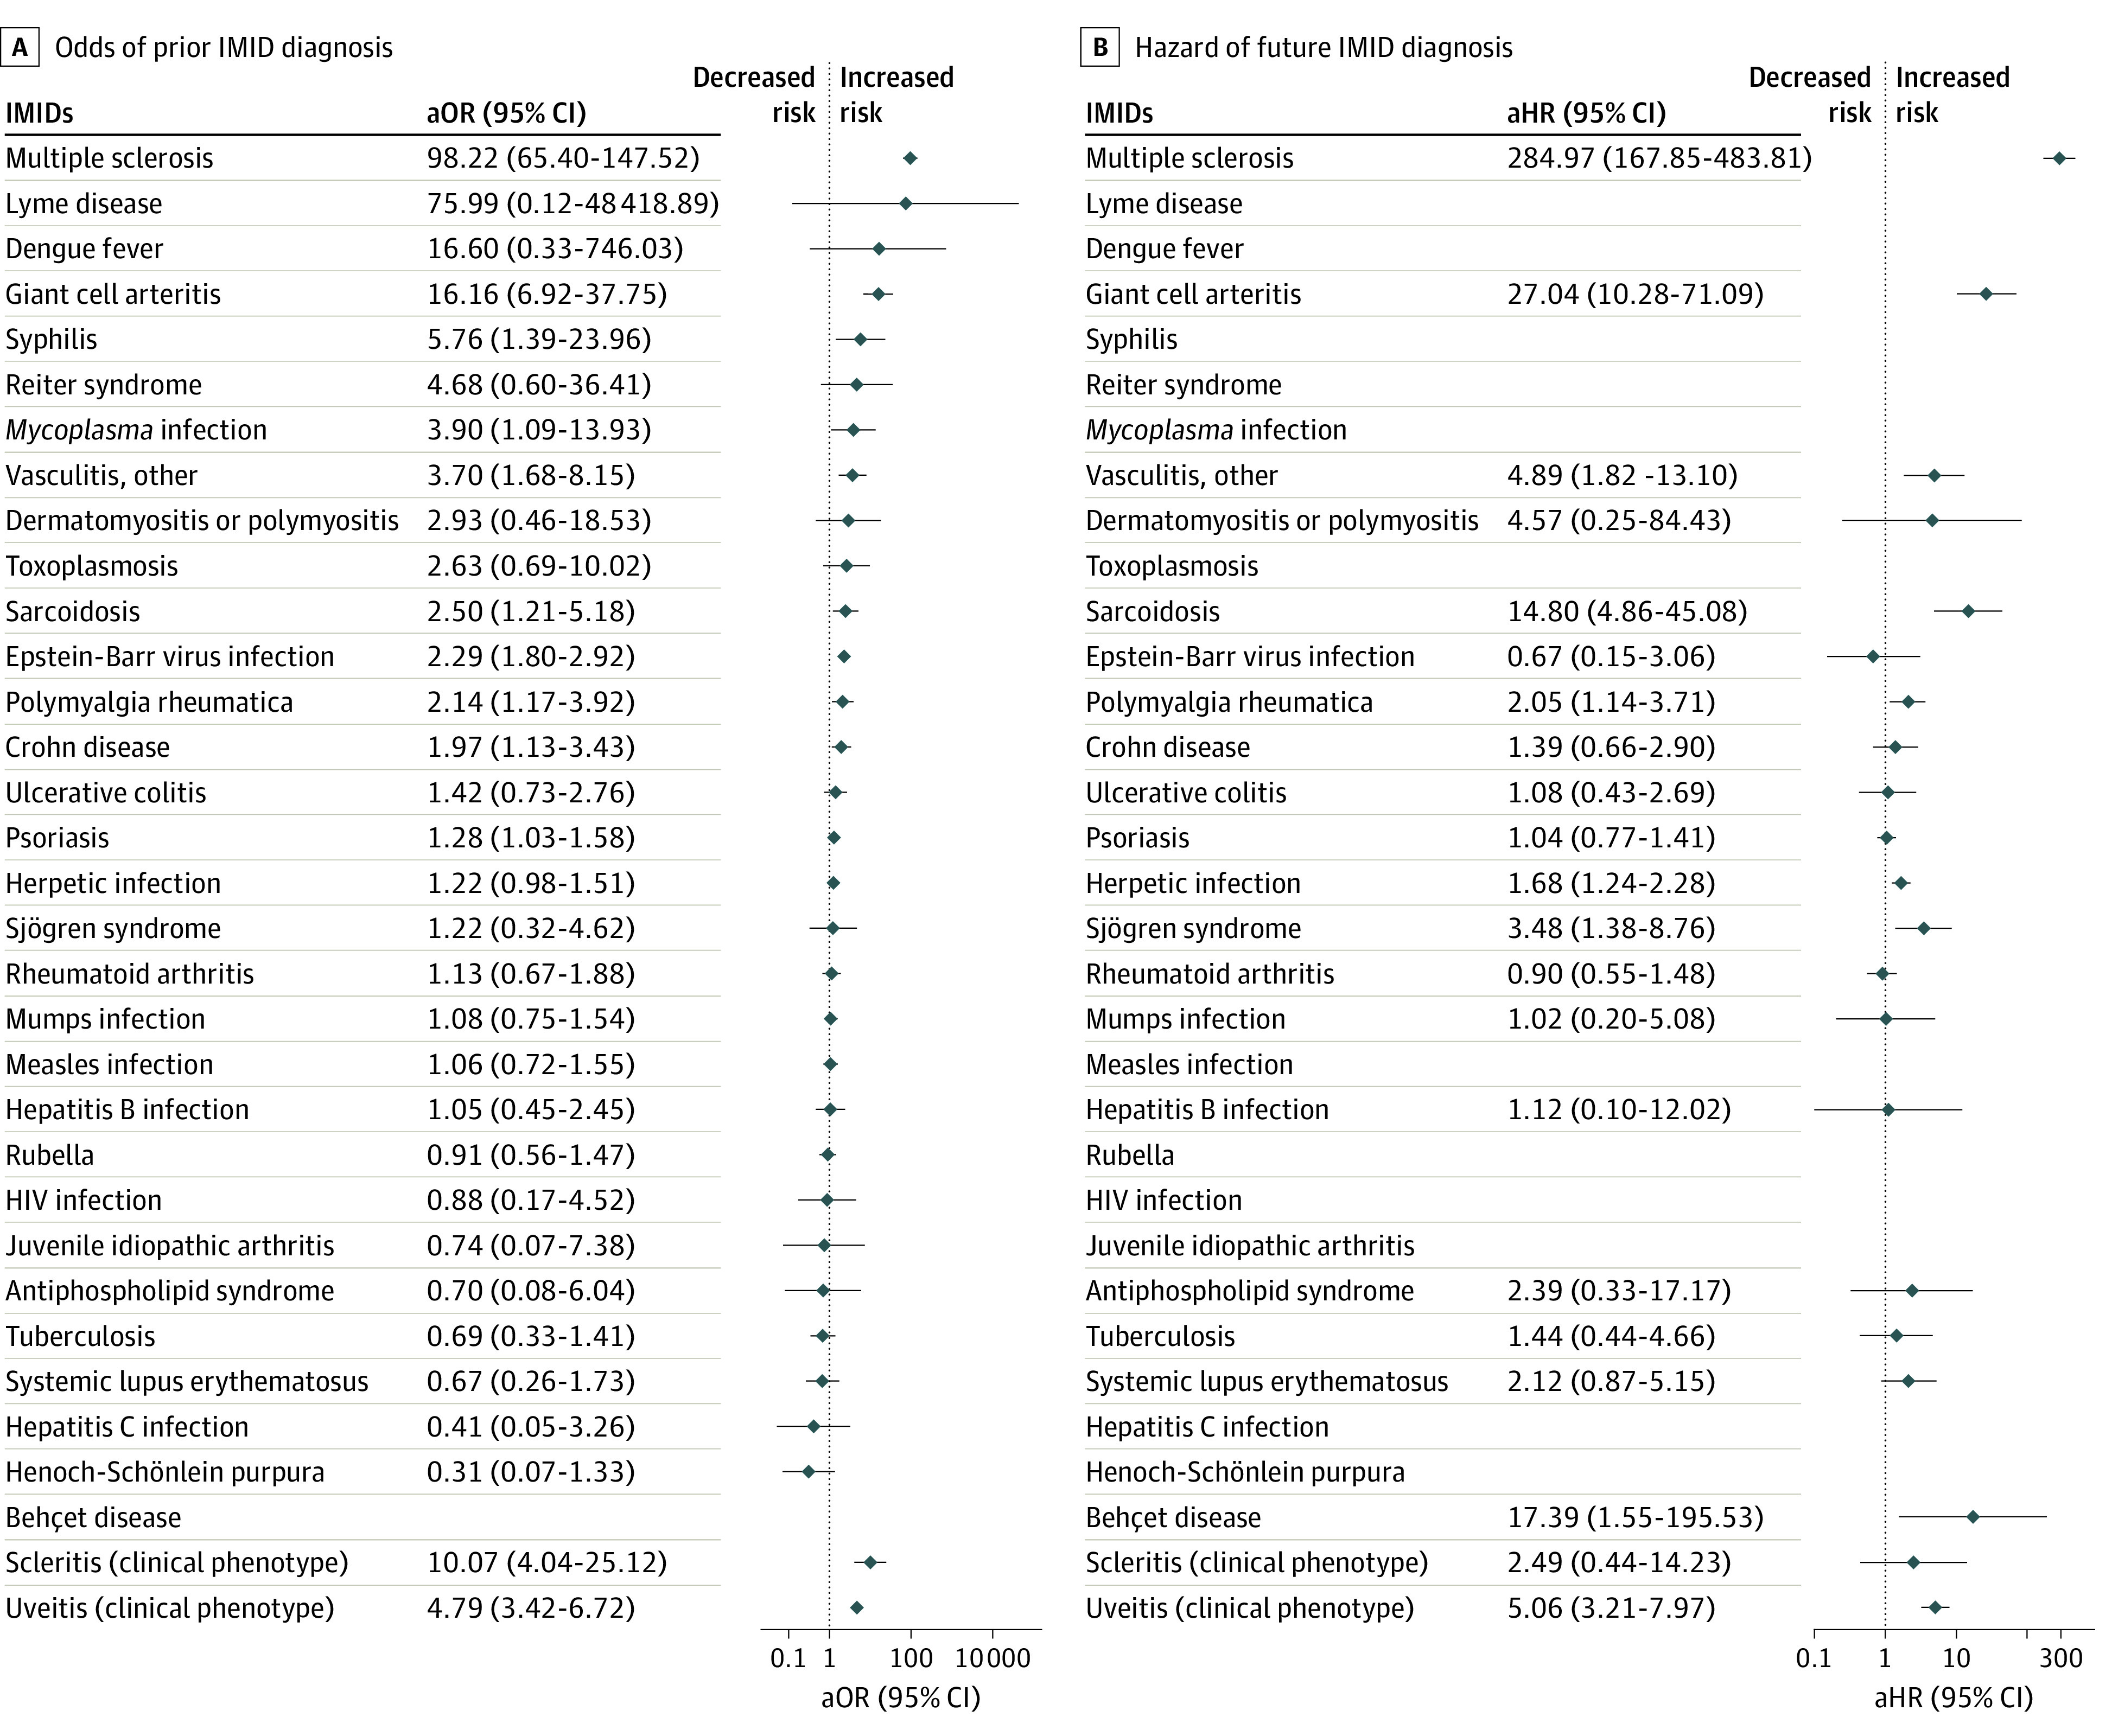
Where no values are present, there were either no data or the value was not estimable.
Median follow-up in the cohort study was 5.27 years (IQR, 2.29-9.43 years) for patients with ON and 4.98 years (IQR, 2.07-9.16 years) for controls. Table 2, Figure 2, and eFigure 2 and eFigure 3 in the Supplement show that in a series of adjusted Cox proportional hazards regression analyses, compared with controls, patients with ON had a significantly higher hazard of incident MS (Figure 3 and eFigure 2 in the Supplement), Behçet disease, sarcoidosis, vasculitis, Sjögren syndrome, and herpetic infection (herpes zoster or simplex) (by decreasing strength of association). More specifically, Figure 3 illustrates that 28.2% of patients with ON developed MS by 10 years of follow-up compared with 0.1% of controls. This increased to 33.7% when considering patients with ON onset between 18 to 50 years of age (eFigure 2 in the Supplement). In addition, some patients with ON, but not controls, developed NMO (n = 34 [1.18%]), granulomatosis with polyangiitis (n = 4 [0.14%]), toxoplasmosis (n = 3 [0.10%]), and paraneoplastic disorder (n = 2 [0.07%]), and 1 patient each was diagnosed with Henoch-Schönlein purpura, syphilis, Lyme disease, and CREST (calcinosis, Raynaud disease, esophageal dysfunction, sclerodactyly, and telangiectasia) syndrome. Patients with ON, but not controls, were also significantly more likely to develop incident uveitis but not scleritis.
Figure 3. Nelson-Aalen Cumulative Hazard Curves Estimating Risk of Incident Multiple Sclerosis Diagnosis in Patients With Optic Neuritis Compared With Controls During 15 Years of Follow-up.

This figure illustrates that 815 of 2894 patients with optic neuritis (28.2%) compared with 13 of 11 576 controls (0.1%) are diagnosed with multiple sclerosis by 10 years of follow-up. Shaded areas indicate 95% CIs.
Patients with ON were significantly more likely than controls to have a prior diagnosis of giant cell arteritis and polymyalgia rheumatica and had a greater hazard of developing incident giant cell arteritis and polymyalgia rheumatica. The mean (SD) age of 130 patients with these diseases was 68.9 (12.5) years compared with 40.8 (15.4) years among 14 340 without.
Discussion
The UK population 1 year or older has a stable incidence of ON at 3.74 per 100 000 person-years during 22 years, combining 0.77 per 100 000 person-years in children younger than 18 years and 4.46 per 100 000 person-years in adults. During the study period, the THIN database matured, reaching a UK prevalence of nearly 115 per 100 000 population in 2018. These UK estimates align in the middle range of ON epidemiologic estimates during 8 decades, including from the US (Minnesota, 1935-1991, 5.1 per 100 000 population per year)17; European countries, Spain (Barcelona, 2008-2012, 5.36 per 100 000 population per year),2 Finland (Northern, 1970-1978, 2.5 per 100 000 population per year),18 and Sweden (Stockholm, 1990-1995, 1.46 per 100 000 person-years)19; Japan (1992-1993, 1.62 per 100 000 adults per year)20; South Korea (national, 2010-2016, 1.04 per 100 000 of those <14 years of age per year and 3.29 per 100 000 of those 15-65 years of age per year21; and Singapore (0.83 per 100 000 population per year).1 Our data reveal independent higher risk of ON in patients residing at higher latitude (Scotland; aIRR, 1.19; P = .001) after adjustment for potential confounders, consistent with the latitude effect reported in MS.22
This study finds elevated ON risk among young women, as has been reported previously (female-male ratio between 1.5:1 and 2.5:1).18,19,20,23 This finding is possibly driven by strong association with MS in the UK population.5,21,24,25 A further explanation is that many genes associated with immune regulation are located on the X chromosome; although lyonization results in a greater pool of genes to respond to infection, it may contribute to increased susceptibility to autoimmunity.26
Novel significant associations were found between ON and both obesity (aIRR, 1.27 for obesity and 1.37 for morbid obesity; P = .001) and smoking (aIRR, 1.32 for current smoking; P < .001, and 1.19 for previous smoking; P = .007). However, these variables were measured only once at cohort entry, with missing data in 32.4% of cases in the obesity category and 22.9% of cases in the smoking category. No meaningful effect modification was observed by age group or sex among those with recorded data. Obesity and metabolic syndrome have been reported to be associated with more rapid neurodegeneration in MS, and although the pathophysiologic basis remains unknown, proinflammatory cytokines are hypothesized to be contributory.27 There is no known direct association between smoking and ON, but a meta-analysis28 identified smoking as a significant factor associated with MS onset, and smokers were more likely to develop secondary progressive MS.29 These potential risk factors will require further prospective evaluation.
This study confirms well-established associations between ON and prevalent (17.3%) and incident MS.21,23,30 We found that 33.7% of patients diagnosed with ON between the ages of 18 and 50 years were subsequently diagnosed with MS by 10 years of follow-up (eFigure 2 in the Supplement). This rate was lower than that reported in Minnesota (1935-1991), where 39% of cases progressed to MS at 10 years, increasing to 60% at 40 years.17
To our knowledge, this is the first national population–representative study to systematically explore and demonstrate strength and significance of association between ON and 43 potentially relevant IMIDs.5 Significant associations included sarcoidosis, psoriasis, Crohn disease, Sjögren syndrome, Behçet disease, granulomatosis with polyangiitis, giant cell arteritis, other vasculitides, polymyalgia rheumatica, and infection with herpesviruses (herpes simplex and varicella zoster combined), Epstein-Barr virus, Mycoplasma, and syphilis. Autoimmune diseases affect between 7.6% and 9.4% of the population,31 with studies indicating an increasing incidence32 and associated ON.2 Our large data set does not confirm an increasing incidence in the United Kingdom during the past 2 decades.
Our findings of 10-fold higher odds of previous scleritis among patients with ON compared with controls and 5-fold higher odds of previous uveitis and hazard of incident uveitis are consistent with a US database study8 (103 867 patients with uveitis, including 974 with ON). This study reported similar ON prevalence in anterior uveitis and the general population (120 per 100 000 population [0.6%]) but higher ON prevalence in intermediate (280 per 100 000 population), posterior (290 per 100 000 population), and panuveitis (380 per 100 000 population). Multiple sclerosis cohort studies (France: n = 430033; Turkey: n = 170234) similarly report uveitis, especially intermediate and panuveitis, rates of 0.52% to 0.65%, preceding an MS diagnosis in 46%, simultaneous with an MS diagnosis in 18%, and after an MS diagnosis in 36%.33
Implications
This study confirms the strength of association of many non-MS IMIDs with ON. Cross-specialty awareness of these is important to ensure prompt recognition and treatment. For practitioners faced with a patient with acute ON, this study provides an epidemiologic evidence base to guide appropriate investigation and directed questions around diagnostic criteria for associated IMIDs.
Future population-based studies are needed in other geographic locations to explore whether these findings, in a high-income, predominantly White population, are globally generalizable. This analysis could be performed again in 5 years to explore the stability of epidemiologic trends, association with additional rare IMIDs, and the impact of the global COVID-19 pandemic on ON incidence.6 Further analysis of THIN to explore risk factors associated with incident ON among patients exposed to each of the identified IMIDs, with adjustment for exposure to different immunosuppressive, immunomodulatory, and antimicrobial therapies, smoking status, and BMI category, could yield valuable insights into pathogenesis, risk, and prognosis and guide targeted investigation (eg, should baseline investigations for non-MS ON include Mycoplasma serologic testing?).
Strengths and Limitations
This study has several strengths. The large sample size permits evaluation of associations between ON and 43 IMIDs and trends during a 22-year period. In addition, the THIN database is generalizable to the UK population.10,11 However, even with nearly 11 million patients, this database was underpowered to identify rare associations between ON and IMIDs (Table 2), with no data on 15 IMIDs.5 Subtypes of ON were not explicitly captured by the available Read codes in this database, for example, chronic relapsing idiopathic optic neuropathy, postinfectious ON, and postvaccination ON (eTable 1 in the Supplement). There were no THIN Read codes for 8 diseases (eg, Blau syndrome and cat scratch or Bartonella infection). Data were insufficient in patients with ON or controls to quantify hazard of some diseases (eg, NMO) and there were too few pediatric patients to permit meaningful subgroup analysis.
Furthermore, retrospective estimates from this database of routinely collected primary care data have potential risks of bias. There was risk of diagnostic error in the hospital or incorrect coding, resulting in misclassification bias.35 This factor may explain the apparently strong association between ON and giant cell arteritis, a cause of arteritic ischemic optic neuropathy. It is likely that some patients with arteritic ischemic optic neuropathy were misclassified as having ON. There was risk of data entry error in the hospital or general practice and of missing data on new diagnoses or history of ON. To mitigate these risks, we conservatively included only patients with ON Read codes, excluding those with other or unspecified optic neuropathy. We did not perform a validation study.10,11 However, ON and most diseases with which it is associated are diagnosed exclusively by hospital specialists, and reassuringly the incidence estimates aligned with a priori epidemiologic expectations.
The stable incidence of ON, with increasing prevalence, indicates evolving maturity of the database and improving disease ascertainment rather than true change in population disease risk over time, with the latest prevalence estimates being the most reliable. We excluded data from 1995 and 1996, but patient data for the next 5 years were considerably less available than for later years and should be interpreted cautiously. Reasons for evolving maturity include adults registering with a general practice at the time of ON onset, having not previously been known to the database (a small number given the high proportion of UK population registered with a general practice), or adults with a first recurrence since addition of their general practice to the database volunteering medical history of previous ON omitted from their earlier record. Over time, electronic data capture improves as systems become more familiar. As more patients are added at birth, diagnosed with ON as young adults, and followed up throughout life, with resulting stabilization of database age structure, we expect emergence of more reliable estimates of prevalence and age at onset. Some increase in prevalence over time is expected if demographic shifts toward older age continue or if age at onset decreases, but there was no evidence for the latter. Between 1997 and 2018, life expectancy at birth in the UK’s 4 nations increased modestly by 4.1 to 4.8 years for men and 2.9 to 3.4 years for women.36 The impact of emerging health threats, including the COVID-19 pandemic, on the UK and global population age structure and risk of postviral ON will need consideration.
Conclusions
This study highlights that the current era of big data offers unprecedented opportunity to advance understanding of the epidemiology of rarer clinical phenotypes and their systemic associations. We report a stable incidence of ON in the UK during the past 22 years and multiple significant associations with prevalent and incident autoimmune and infectious IMIDs. From a direct patient care perspective, at first presentation, non-MS ON cases outnumber MS-associated ON cases, which should be recognized when planning the diagnostic workup and making potentially sight-critical treatment decisions.
eTable 1. Read Codes Included in Case Definition of Optic Neuritis
eTable 2. Time Trend Analysis of the Point Prevalence and Annual Incidence of Optic Neuritis (per 100 000 People) in the UK Between 1997 and 2018
eFigure 1. Annual Point Prevalence of Optic Neuritis in the UK Population (per 100 000 People, With 95% Confidence Intervals) Between 1997 and 2018
eFigure 2. Nelson-Aalen Cumulative Hazard Curves (With 95% Confidence Intervals [CI]) for Diagnosis of Incident Multiple Sclerosis During 15 Years of Follow-up, Comparing Patients Diagnosed With Incident Optic Neuritis A) Aged <17 Years, B) Aged 18-50 Years, and C) Aged >50 Years
eFigure 3. Nelson-Aalen Cumulative Hazard Curves (With 95% Confidence Intervals [CI]) for Diagnosis With Incident Systemic, Neurological or Infectious IMID in Optic Neuritis Patients Compared to Controls During 15 Years of Follow-up
References
- 1.Lim SA, Wong WL, Fu E, et al. The incidence of neuro-ophthalmic diseases in Singapore: a prospective study in public hospitals. Ophthalmic Epidemiol. 2009;16(2):65-73. doi: 10.1080/09286580902737516 [DOI] [PubMed] [Google Scholar]
- 2.Martínez-Lapiscina EH, Fraga-Pumar E, Pastor X, et al. Is the incidence of optic neuritis rising? evidence from an epidemiological study in Barcelona (Spain), 2008-2012. J Neurol. 2014;261(4):759-767. doi: 10.1007/s00415-014-7266-2 [DOI] [PubMed] [Google Scholar]
- 3.Quartilho A, Simkiss P, Zekite A, Xing W, Wormald R, Bunce C. Leading causes of certifiable visual loss in England and Wales during the year ending 31 March 2013. Eye (Lond). 2016;30(4):602-607. doi: 10.1038/eye.2015.288 [DOI] [PMC free article] [PubMed] [Google Scholar]
- 4.Petzold A, Braithwaite T, van Oosten BW, et al. Case for a new corticosteroid treatment trial in optic neuritis: review of updated evidence. J Neurol Neurosurg Psychiatry. 2020;91(1):9-14. doi: 10.1136/jnnp-2019-321653 [DOI] [PMC free article] [PubMed] [Google Scholar]
- 5.Petzold A, Wong S, Plant GT. Autoimmunity in visual loss. Handb Clin Neurol. 2016;133:353-376. [DOI] [PMC free article] [PubMed] [Google Scholar]
- 6.Dessau RB, Lisby G, Frederiksen JL. Coronaviruses in spinal fluid of patients with acute monosymptomatic optic neuritis. Acta Neurol Scand. 1999;100(2):88-91. doi: 10.1111/j.1600-0404.1999.tb01043.x [DOI] [PMC free article] [PubMed] [Google Scholar]
- 7.Coric D, Ometto G, Montesano G, et al. Objective quantification of vitreous haze on optical coherence tomography scans: no evidence for relationship between uveitis and inflammation in multiple sclerosis. Eur J Neurol. 2020;27(1):144-e3. doi: 10.1111/ene.14048 [DOI] [PMC free article] [PubMed] [Google Scholar]
- 8.Guo D, Liu J, Gao R, Tari S, Islam S. Prevalence and incidence of optic neuritis in patients with different types of uveitis. Ophthalmic Epidemiol. 2018;25(1):39-44. doi: 10.1080/09286586.2017.1339808 [DOI] [PubMed] [Google Scholar]
- 9.Chaganti S, Welty VF, Taylor W, et al. Discovering novel disease comorbidities using electronic medical records. PLoS One. 2019;14(11):e0225495. doi: 10.1371/journal.pone.0225495 [DOI] [PMC free article] [PubMed] [Google Scholar]
- 10.Hall GC. Validation of death and suicide recording on the THIN UK primary care database. Pharmacoepidemiol Drug Saf. 2009;18(2):120-131. doi: 10.1002/pds.1686 [DOI] [PubMed] [Google Scholar]
- 11.Seminara NM, Abuabara K, Shin DB, et al. Validity of The Health Improvement Network (THIN) for the study of psoriasis. Br J Dermatol. 2011;164(3):602-609. doi: 10.1111/j.1365-2133.2010.10134.x [DOI] [PMC free article] [PubMed] [Google Scholar]
- 12.ReStore National Centre for Research Methods Townsend Deprivation Index. Accessed April 5, 2020. https://www.restore.ac.uk/geo-refer/36229dtuks00y19810000.php
- 13.Adams J, Ryan V, White M. How accurate are Townsend Deprivation Scores as predictors of self-reported health? a comparison with individual level data. J Public Health (Oxf). 2005;27(1):101-106. doi: 10.1093/pubmed/fdh193 [DOI] [PubMed] [Google Scholar]
- 14.Adderley NJ, Subramanian A, Nirantharakumar K, et al. Association between idiopathic intracranial hypertension and risk of cardiovascular diseases in women in the United Kingdom. JAMA Neurol. 2019. epub 2019/07/10. doi: 10.1001/jamaneurol.2019.1812 [DOI] [PMC free article] [PubMed] [Google Scholar]
- 15.Lévesque LE, Hanley JA, Kezouh A, Suissa S. Problem of immortal time bias in cohort studies: example using statins for preventing progression of diabetes. BMJ. 2010;340:b5087. doi: 10.1136/bmj.b5087 [DOI] [PubMed] [Google Scholar]
- 16.Office for National Statistics , National Records of Scotland, Northern Ireland Statistics and Research Agency - Population Estimates. Population Estimates for the UK, England and Wales, Scotland and Northern Ireland: Mid-2018. Figure 3: Population Pyramid for UK, Mid-2018, Single Year of age 0 to 89. 2018. Accessed April 1, 2020. https://www.ons.gov.uk/peoplepopulationandcommunity/populationandmigration/populationestimates/bulletins/annualmidyearpopulationestimates/mid2018
- 17.Rodriguez M, Siva A, Cross SA, O’Brien PC, Kurland LT. Optic neuritis: a population-based study in Olmsted County, Minnesota. Neurology. 1995;45(2):244-250. doi: 10.1212/WNL.45.2.244 [DOI] [PubMed] [Google Scholar]
- 18.Kinnunen E. The incidence of optic neuritis and its prognosis for multiple sclerosis. Acta Neurol Scand. 1983;68(6):371-377. doi: 10.1111/j.1600-0404.1983.tb04846.x [DOI] [PubMed] [Google Scholar]
- 19.Jin YP, de Pedro-Cuesta J, Söderström M, Stawiarz L, Link H. Incidence of optic neuritis in Stockholm, Sweden 1990-1995, I: age, sex, birth and ethnic-group related patterns. J Neurol Sci. 1998;159(1):107-114. doi: 10.1016/S0022-510X(98)00141-5 [DOI] [PubMed] [Google Scholar]
- 20.Wakakura M, Ishikawa S, Oono S, et al. ; Optic Neuritis Treatment Trial Multicenter Cooperative Research Group (ONMRG) . Incidence of acute idiopathic optic neuritis and its therapy in Japan [in Japanese]. Nippon Ganka Gakkai Zasshi. 1995;99(1):93-97. [PubMed] [Google Scholar]
- 21.Lee JY, Han J, Yang M, Oh SY. Population-based incidence of pediatric and adult optic neuritis and the risk of multiple sclerosis. Ophthalmology. 2020;127(3):417-425. doi: 10.1016/j.ophtha.2019.09.032 [DOI] [PubMed] [Google Scholar]
- 22.Simpson S Jr, Blizzard L, Otahal P, Van der Mei I, Taylor B. Latitude is significantly associated with the prevalence of multiple sclerosis: a meta-analysis. J Neurol Neurosurg Psychiatry. 2011;82(10):1132-1141. doi: 10.1136/jnnp.2011.240432 [DOI] [PubMed] [Google Scholar]
- 23.Woung LC, Peng PH, Liu CC, et al. A nine-year population-based cohort study on the risk of multiple sclerosis in patients with optic neuritis. Tohoku J Exp Med. 2013;231(3):171-177. doi: 10.1620/tjem.231.171 [DOI] [PubMed] [Google Scholar]
- 24.Persson R, Lee S, Yood MU, et al. Multi-database study of multiple sclerosis: identification, validation and description of MS patients in two countries. J Neurol. 2019;266(5):1095-1106. doi: 10.1007/s00415-019-09238-8 [DOI] [PMC free article] [PubMed] [Google Scholar]
- 25.Kurtzke JF. Epidemiology and etiology of multiple sclerosis. Phys Med Rehabil Clin N Am. 2005;16(2):327-349. doi: 10.1016/j.pmr.2005.01.013 [DOI] [PubMed] [Google Scholar]
- 26.Wang J, Syrett CM, Kramer MC, Basu A, Atchison ML, Anguera MC. Unusual maintenance of X chromosome inactivation predisposes female lymphocytes for increased expression from the inactive X. Proc Natl Acad Sci U S A. 2016;113(14):E2029-E2038. doi: 10.1073/pnas.1520113113 [DOI] [PMC free article] [PubMed] [Google Scholar]
- 27.Costello F, Petzold A. Weighting evidence in MS: Obesity and neurodegeneration. Mult Scler. 2020;26(7):748-750. epub 2020/04/17. doi: 10.1177/1352458520912171 [DOI] [PubMed] [Google Scholar]
- 28.Belbasis L, Bellou V, Evangelou E, Ioannidis JP, Tzoulaki I. Environmental risk factors and multiple sclerosis: an umbrella review of systematic reviews and meta-analyses. Lancet Neurol. 2015;14(3):263-273. doi: 10.1016/S1474-4422(14)70267-4 [DOI] [PubMed] [Google Scholar]
- 29.Ramanujam R, Hedström AK, Manouchehrinia A, et al. Effect of smoking cessation on multiple sclerosis prognosis. JAMA Neurol. 2015;72(10):1117-1123. doi: 10.1001/jamaneurol.2015.1788 [DOI] [PubMed] [Google Scholar]
- 30.Koch-Henriksen N, Sørensen PS. The changing demographic pattern of multiple sclerosis epidemiology. Lancet Neurol. 2010;9(5):520-532. doi: 10.1016/S1474-4422(10)70064-8 [DOI] [PubMed] [Google Scholar]
- 31.Cooper GS, Bynum ML, Somers EC. Recent insights in the epidemiology of autoimmune diseases: improved prevalence estimates and understanding of clustering of diseases. J Autoimmun. 2009;33(3-4):197-207. doi: 10.1016/j.jaut.2009.09.008 [DOI] [PMC free article] [PubMed] [Google Scholar]
- 32.Lerner A, Matthias T. Changes in intestinal tight junction permeability associated with industrial food additives explain the rising incidence of autoimmune disease. Autoimmun Rev. 2015;14(6):479-489. doi: 10.1016/j.autrev.2015.01.009 [DOI] [PubMed] [Google Scholar]
- 33.Le Scanff J, Sève P, Renoux C, Broussolle C, Confavreux C, Vukusic S. Uveitis associated with multiple sclerosis. Mult Scler. 2008;14(3):415-417. doi: 10.1177/1352458507083444 [DOI] [PubMed] [Google Scholar]
- 34.Kaya D, Kaya M, Özakbaş S, İdiman E. Uveitis associated with multiple sclerosis: complications and visual prognosis. Int J Ophthalmol. 2014;7(6):1010-1013. [DOI] [PMC free article] [PubMed] [Google Scholar]
- 35.Stunkel L, Kung NH, Wilson B, McClelland CM, Van Stavern GP. Incidence and causes of overdiagnosis of optic neuritis. JAMA Ophthalmol. 2018;136(1):76-81. doi: 10.1001/jamaophthalmol.2017.5470 [DOI] [PMC free article] [PubMed] [Google Scholar]
- 36.Office for National Statistics How has life expectancy changed for the UK constituent countries? 2019. Accessed June 23, 2020. https://www.ons.gov.uk/peoplepopulationandcommunity/birthsdeathsandmarriages/lifeexpectancies/bulletins/nationallifetablesunitedkingdom/2015to2017
Associated Data
This section collects any data citations, data availability statements, or supplementary materials included in this article.
Supplementary Materials
eTable 1. Read Codes Included in Case Definition of Optic Neuritis
eTable 2. Time Trend Analysis of the Point Prevalence and Annual Incidence of Optic Neuritis (per 100 000 People) in the UK Between 1997 and 2018
eFigure 1. Annual Point Prevalence of Optic Neuritis in the UK Population (per 100 000 People, With 95% Confidence Intervals) Between 1997 and 2018
eFigure 2. Nelson-Aalen Cumulative Hazard Curves (With 95% Confidence Intervals [CI]) for Diagnosis of Incident Multiple Sclerosis During 15 Years of Follow-up, Comparing Patients Diagnosed With Incident Optic Neuritis A) Aged <17 Years, B) Aged 18-50 Years, and C) Aged >50 Years
eFigure 3. Nelson-Aalen Cumulative Hazard Curves (With 95% Confidence Intervals [CI]) for Diagnosis With Incident Systemic, Neurological or Infectious IMID in Optic Neuritis Patients Compared to Controls During 15 Years of Follow-up