

Abstract
Objective
To monitor hospital activity for presentation, diagnosis and treatment of cardiovascular diseases during the COVID-19) pandemic to inform on indirect effects.
Methods
Retrospective serial cross-sectional study in nine UK hospitals using hospital activity data from 28 October 2019 (pre-COVID-19) to 10 May 2020 (pre-easing of lockdown) and for the same weeks during 2018–2019. We analysed aggregate data for selected cardiovascular diseases before and during the epidemic. We produced an online visualisation tool to enable near real-time monitoring of trends.
Results
Across nine hospitals, total admissions and emergency department (ED) attendances decreased after lockdown (23 March 2020) by 57.9% (57.1%–58.6%) and 52.9% (52.2%–53.5%), respectively, compared with the previous year. Activity for cardiac, cerebrovascular and other vascular conditions started to decline 1–2 weeks before lockdown and fell by 31%–88% after lockdown, with the greatest reductions observed for coronary artery bypass grafts, carotid endarterectomy, aortic aneurysm repair and peripheral arterial disease procedures. Compared with before the first UK COVID-19 (31 January 2020), activity declined across diseases and specialties between the first case and lockdown (total ED attendances relative reduction (RR) 0.94, 0.93–0.95; total hospital admissions RR 0.96, 0.95–0.97) and after lockdown (attendances RR 0.63, 0.62–0.64; admissions RR 0.59, 0.57–0.60). There was limited recovery towards usual levels of some activities from mid-April 2020.
Conclusions
Substantial reductions in total and cardiovascular activities are likely to contribute to a major burden of indirect effects of the pandemic, suggesting they should be monitored and mitigated urgently.
Keywords: epidemiology, aortic and arterial disease, global health care delivery, health care delivery, heart disease
Introduction
Beyond direct effects of the COVID-19 on populations in every country, the pandemic had and will continue to have indirect effects on morbidity and mortality, through changes in patient and clinician behaviour, and health system reorganisation.1 In order to plan and adapt responses to this and future public health threats, therefore, there is a need to understand the indirect effects of the pandemic on non-communicable diseases for both disease burden and health service provision.2
Cardiovascular diseases (CVDs) are the largest cause of morbidity and mortality in the UK and globally.3 4 Moreover, prior CVD is a major risk factor for complications and mortality associated with COVID-19.5 6 Government guidance has advised individuals with CVD to pay particular attention to physical isolation measures.7 Concerns have been raised about provision of care during the pandemic for these diseases, from prevention to treatment, and are supported by data from multiple countries showing reduced service activity.8 9 In the UK, studies have reported reductions in activity across CVDs.10 11 Moreover, official national statistics show an excess of non-COVID-19 and CVD deaths,12 13 as well as a reduction in emergency department (ED) attendances for cardiac presentations.14
There are multiple disease-specific national audits for CVD, in addition to routine primary and secondary care data. However, these sources often lag several weeks or even months behind real time, may not include the UK’s devolved nations and are not currently accessible for analyses.15 For audit, quality improvement, surveillance and to inform policy responses, it is necessary to determine changes in service delivery that occurred during the pandemic. Transparent, public-facing, near real-time information has been shown to be of value to patients, the public, researchers, clinicians and policymakers alike during the pandemic.1 16
For presentation, diagnosis and treatment of CVD, we aimed to: (1) develop a protocol for national surveillance of CVD hospital services during the COVID-19 pandemic; (2) present pilot data from a preliminary cohort of hospitals; and (3) design and implement a simple tool for monitoring and visualising trends in CVD hospital services in the UK.
Methods
Study design and data sources
We conducted a retrospective hospital-based analysis of presentations, diagnoses and treatments or procedures for selected CVDs in hospitals across the UK before and during the COVID-19 epidemic. The protocol was developed by a group of seven cardiovascular clinicians with relevant clinical, epidemiological and health data science expertise and agreed with members of the CVD-COVID-UK collaboration, supported by the British Heart Foundation (BHF) Data Science Centre.17
Data collection
We sent email invitations to contribute data to the chief clinical information officers or other relevant contacts in 21 hospitals (or groups of regionally connected hospitals) across the UK. We requested aggregate data, with no individual level or linked data, including inpatient admissions and ED visits, both overall and for specified cardiovascular diagnoses and procedures or treatments, and we provided guidance on which International Classification of Diseases, 10th Revision (ICD-10), Office of Population Censuses and Surveys Classification of Interventions and Procedures version 4 (OPCS-4) or equivalent codes to use. We selected six disease areas to gain an overview of CVD service provision in a short timescale:
Acute coronary syndrome (ACS).
Heart failure.
Stroke and transient ischaemic attack.
Venous thromboembolism.
Peripheral arterial disease (PAD).
Aortic aneurysm.
Online supplemental table 1 shows the data request sent to hospitals for weekly counts of relevant ED categories, hospital admission diagnoses and hospital treatments/procedures covering the period 28 October 2019–10 May 2020, designed to show activity in three phases: pre-COVID-19 pandemic to the first UK confirmed case of COVID-19 (31 January 2020), between the first COVID-19 case but prelockdown on 23 March 2020 and postlockdown. All participating hospitals had local information governance approval.
heartjnl-2020-317870supp001.pdf (124.9KB, pdf)
Since our principal aim was to capture change in activity over time within each hospital rather than to make direct comparisons between hospitals, we incorporated a degree of flexibility in the way each data item was defined. For example, one hospital, which did not have timely access to ICD codes for ACS, was able to provide counts using a data capture tool embedded into the patient record that identifies all patients with ACS at the point of cardiac troponin testing.18 Where available, as measures of total acute activity, we requested counts of all ED attendances, all hospital admissions and all COVID-19 hospital admissions.
In addition, given known seasonal fluctuations in hospital services, we requested data on the same items from the same calendar weeks (or months) in the previous year (2018–2019) for comparison. We recognised that not all disease areas or treatments and procedures would be relevant to or available from every participating hospital, and so invited hospitals to contribute whichever data items they were able to.
Data analysis
The study period was divided into three phases based on complete weeks (Monday–Sunday) of data: (1) before the first case of SARS-CoV2 in the UK (28 October 2019–2 February 2020 (14 weeks)); (2) between the first case and start of lockdown in the UK (3 February 2020–22 March 2020 (7 weeks)); and (3) during lockdown (23 March 2020–10 May 2020 (7 weeks)).
We used the aggregate data to compare the weekly counts within each hospital and across all hospitals combined, estimating associated 95% CIs using the Poisson exact method.19 We calculated means of hospital statistics and their 95% CIs in the combined analyses. In addition, we calculated percentage change from the corresponding week in the previous year (2018–2019), together with 95% CIs using the Wilson score interval, in the three phases described above. We also calculated the percentage reduction in total hospital admissions and ED attendances around Christmas and New Year in 2019–2020 by comparing the period 16 December 2019–12 January 2020 to the immediately preceding period 18 November–15 December 2019, using the same approach with equivalent weeks to calculate the percentage reduction around Christmas and New Year in 2018–2019. We calculated 4-week rolling means, that is, the means of hospital activities over each 4-week period, starting 3 weeks prior to the week of interest. Such rolling means enable clearer visualisation of trends for data items with low numbers and high variability. Where data providers suppressed values less than 5, we converted these to the value of 2.5 for analytic purposes. To demonstrate relative change of hospital activities between phases, we also calculated relative reduction (RR) in weekly counts compared with the first phase (before the first UK case of COVID-19). We performed all statistical procedures in R (V.4.0.0). Relevant code is available at https://github.com/HDRUK/4C-Initiative.
Interactive data visualisation tool and patient and public involvement
As understanding trends and patterns in hospital activity should inform policymakers and other stakeholders in the planning of services as the UK eases out of lockdown, we developed an interactive online tool to enable dynamic visualisation of the data. It will enable periodic (eg, monthly) updates of data from contributing hospitals to monitor trends over time and facilitate incorporation of data from other UK hospitals and comparisons between hospitals (http://www.hospitalactivity.com). There was no formal patient and public involvement.
Results
Overall hospital activity
Of 21 hospitals (or groups of regionally connected hospitals) contacted, 17 agreed to participate. Of these, nine hospitals distributed across England and Scotland, providing cardiovascular services to an estimated population of up to 10 million people, contributed data in time for the analyses reported here. There were 513 703 hospital admissions from eight hospitals and 435 653 ED attendances from five hospitals during the period 28 October 2019–10 May 2020 compared with 599 372 and 506 516, respectively, in 2018–2019. There were 676 and 5182 COVID-19 related admissions from eight hospitals for the second and third phases (after the first UK case of COVID-19 until lockdown commenced and from the start of lockdown onwards), respectively.
Across all hospitals, total admissions before the first case of COVID-19 were very similar to the corresponding period in 2018–2019, including the expected dip in admissions of around 12% during the Christmas period in December 2018 and 2019 (online supplemental table 2). After lockdown, admissions decreased by 57.9% (95% CI 57.1% to 58.6%) compared with the previous year (table 1 and figure 1).
Table 1.
Hospital statistics as percentage change from corresponding dates in 2018–2019
| No. of hospitals | Percentage change from 2018 to 2019 | ||||||
| Before first case | Between first case and lockdown | After lockdown | |||||
| % | 95% CI | % | 95% CI | % | 95% CI | ||
| Overall | |||||||
| Total ED attendances | 5 | 3.4 | 3.2 to 3.6 | −8.8 | −8.4 to −9.1 | −52.8 | −52.2 to −53.5 |
| Total hospital admissions | 8 | 1.1 | 1.0 to 1.2 | −6.3 | −6.0 to −6.7 | −58.2 | −57.5 to −58.9 |
| Cardiac | |||||||
| ED attendance with cardiac conditions | 4 | 5.7 | 4.3 to 7.6 | −9.6 | −7.2 to −12.8 | −40.2 | −35.6 to −45.0 |
| Admission with ACS | 9 | −1.7 | −1.1 to −2.6 | −15.7 | −13.0 to −18.9 | −39.4 | −35.3 to −43.5 |
| Admission with heart failure | 7 | 6.1 | 5.1 to 7.3 | −3.2 | −2.2 to −4.5 | −49.0 | −45.7 to −52.2 |
| PCI performed | 7 | −6.9 | −5.0 to −9.4 | −8.2 | −5.4 to −12.2 | −39.6 | −33.7 to −45.8 |
| Cardiac pacemaker and resynchronisation | 8 | 2.3 | 1.0 to 4.9 | 0.0 | 0.0 to 2.8 | −47.2 | −38.8 to −55.9 |
| CABG performed | 6 | −9.4 | −5.0 to −16.9 | −9.8 | −4.3 to −21.0 | −69.6 | −55.2 to −80.9 |
| Cerebrovascular | |||||||
| ED attendance with cerebrovascular conditions | 4 | −1.9 | −1.0 to −3.5 | −6.5 | −4.0 to −10.2 | −31.8 | −26.2 to −38.0 |
| Admission with acute stroke/TIA | 6 | −7.5 | −5.8 to −9.8 | −11.9 | −8.8 to −15.8 | −49.2 | −43.7 to −54.7 |
| Stroke thrombolysis and thrombectomy | 5 | −5.6 | −1.0 to −25.8 | 0.0 | 0.0 to 25.9 | −45.5 | −21.3 to −72.0 |
| Carotid endarterectomy/stenting | 4 | 30.8 | 12.7 to 57.6 | 25.0 | 7.1 to 59.1 | −66.7 | −30.0 to −90.3 |
| Cerebral aneurysm coiling | 5 | −9.6 | −5.7 to −15.7 | −35.8 | −26.9 to −45.8 | −59.4 | −47.1 to −70.5 |
| Other vascular | |||||||
| ED attendance with vascular conditions | 3 | 0.6 | 0.1 to 3.2 | −16.0 | −9.9 to −24.7 | −40.6 | −31.5 to −50.3 |
| Admission with aortic aneurysms | 7 | 13.7 | 10.1 to 18.2 | 9.4 | 5.5 to 15.3 | −53.0 | −44.5 to −61.3 |
| Admission with peripheral arterial disease | 6 | 14.4 | 12.4 to 16.8 | 2.8 | 1.7 to 4.7 | −49.2 | −44.8 to −53.6 |
| Admission with DVT or PE | 6 | 11.5 | 8.6 to 15.0 | −12.9 | −8.9 to −18.2 | −37.2 | −30.6 to −44.2 |
| Limb revascularisation, bypass or amputation | 6 | −1.2 | −0.4 to −3.3 | −3.7 | −1.6 to −8.3 | −68.2 | −59.8 to −75.5 |
| Aortic aneurysm repair | 6 | −18.8 | −10.2 to −31.9 | −20.8 | −9.2 to −40.5 | −88.2 | −65.7 to −96.7 |
| Peripheral angioplasty | 6 | 15.0 | 10.1 to 21.6 | 9.1 | 4.5 to 17.6 | −65.5 | −54.8 to −74.8 |
After lockdown=23 March 2020–10 May 2020.
Before first case=28 October 2019–2 February 2020.
Between first case and lockdown=3 February 2020–22 March 2020.
ACS, acute coronary syndrome; CABG, coronary artery bypass graft; DVT, deep vein thrombosis; ED, emergency department; PCI, percutaneous coronary intervention; PE, pulmonary embolism; TIA, transient ischaemic attack.
Figure 1.

Overall hospital activity (admissions, ED attendances and COVID-19 admissions) between 31 October 2019 and 10 May 2020 compared with the same weeks from 2018 to 2019. Lines describe the mean hospital activities in 2019–2020 (solid) and 2018–2019 (dotted). Shading represents 95% CI of the respective hospital activity. The first case of COVID-19 was on 31 January 2020 and lockdown started on 23 March 2020. ED, emergency department.
Overall ED attendances showed a similar pattern, with a small 3.4% (3.2%–3.5%) increase compared with the previous year before the first case, a more modest winter reduction of around 8% (online supplemental table 2), a marked 52.9% (52.2%–53.5%) reduction after lockdown and evidence of some recovery back towards pre-COVID-19 levels of activity from mid-April 2020. The reduction in hospital admissions was substantially larger than the number of admissions for COVID-19 (figure 1). Overall hospital admission and ED attendance patterns were generally consistent across individual hospitals. However, while there was some recovery in ED attendances from mid-April 2020 in all hospitals that provided data, hospital admissions had only started to return towards usual levels in some, but not all, hospitals by early May (figure 2).
Figure 2.
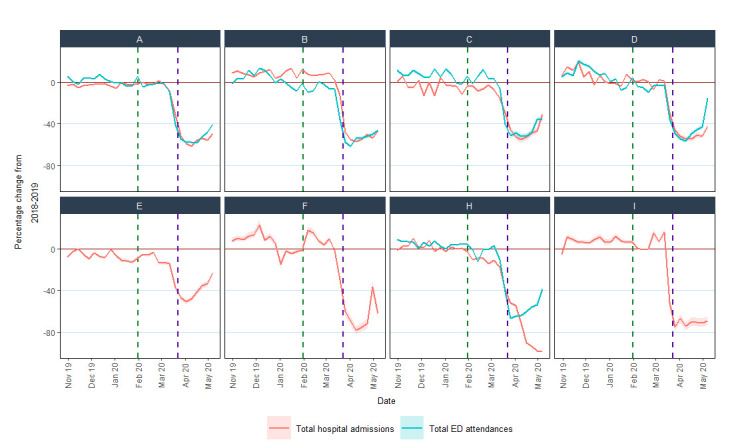
Percentage change compared with the previous year in ED attendances and hospital admissions for individual hospitals. Eight hospitals provided data on hospital admissions and five hospitals (A, B, C, D and H) also provided data on ED attendances. Hospital G did not provide these hospital statistics and is not shown. ED, emergency department.
Cardiac, cerebrovascular and other vascular conditions
Compared with the previous year, hospital statistics on cardiac, cerebrovascular and other vascular conditions dropped by between 31% and 88% after lockdown (table 1). Most started to decline 1–2 weeks before the lockdown. Some recovery from mid-April 2020 was evident in ED attendances for these conditions and for cardiac procedures (primarily driven by PCI) (figure 2, figure 3 and www.hospitalactivity.com). The greatest proportional reductions (65% or more) were in coronary artery bypass graft surgery, carotid endarterectomy, aortic aneurysm repair and procedures for PAD (table 1).
Figure 3.
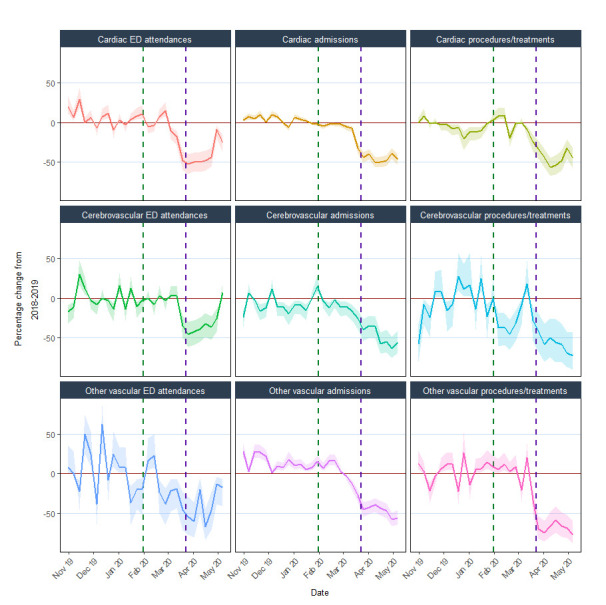
% change compared with the previous year in ED attendance, hospital admissions and procedures/treatments for cardiac, cerebrovascular and other vascular conditions. Cardiac ED attendances are those with an ED diagnosis code for cardiac conditions; cardiac admissions include those with acute coronary syndrome or heart failure; cardiac procedures/treatments include percutaneous coronary intervention, cardiac pacemaker or resynchronisation and coronary artery bypass graft; cerebrovascular ED attendances are those with an ED diagnosis code for cerebrovascular conditions; cerebrovascular admissions include those with acute stroke (ischaemic, intracerebral haemorrhage or subarachnoid haemorrhage) or transient ischaemic attack; cerebrovascular procedures/treatments include stroke thrombolysis, thrombectomy, carotid endarterectomy/stenting or cerebral aneurysm coiling; other vascular ED attendances are those with an ED diagnosis code for other vascular conditions; other vascular admissions include those with aortic aneurysms, DVT, PE or peripheral arterial disease; other vascular procedures include aortic aneurysm repair, limb revascularisation, bypass or amputation and peripheral angioplasty. Horizontal brown line indicates 0%; vertical green dotted line indicates first confirmed COVID-19 case on 31 January 2020; vertical purple dotted line indicates lockdown date on 23 March 2020. Shading represents 95% CIs of % change. DVT, deep vein thrombosis; ED, emergency department; PE, pulmonary embolism.
Comparison with the pre-COVID-19 period
Compared with the period before the first COVID-19 case, activity declined across diseases and specialties between the first case and lockdown (total ED attendances RR 0.94, 0.93–0.95; total hospital admissions RR 0.96, 0.95–0.97) and, more markedly, after lockdown (total ED attendances RR 0.63, 0.62–0.64; total hospital admissions RR 0.59, 0.57–0.60). Reductions in coronary artery bypass grafts, carotid endarterectomy, peripheral arterial procedures and aortic aneurysm repairs were the most prominent (RRs 0.23– 0.49) (figure 4). All hospitals had reduced activities after lockdown but with variation between hospitals in the extent of reduction for different diseases and treatments (online supplemental figure 1).
Figure 4.
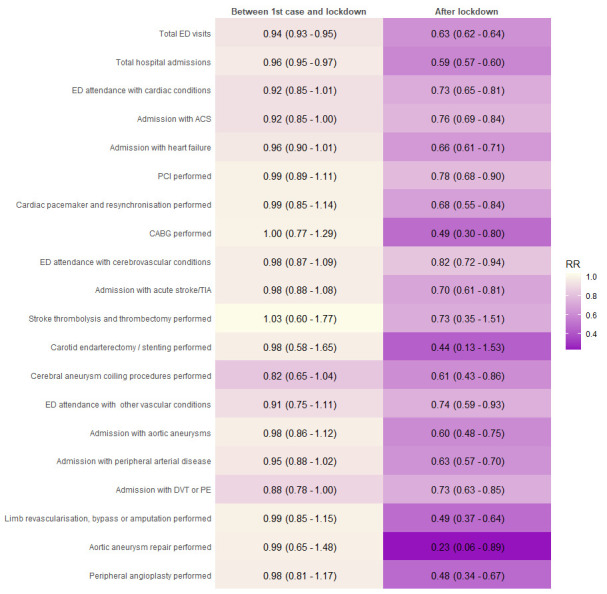
Relative reductions in hospital activities during the COVID-19 pandemic. Relative reduction (RR) comparing phase 2 (between first case and lockdown) and phase 3 (after lockdown) to phase 1 (before first case). ACS, acute coronary syndrome; CABG, coronary artery bypass graft; DVT, deep vein thrombosis; ED, emergency department; PCI, percutaneous coronary interventions; PE, pulmonary embolus; TIA, transient ischaemic attack.
Discussion
Summary of findings
Three main findings have emerged from this rapid assimilation of UK hospital routine health data. First, the current data have shown in detail the pattern of sharp reductions in activity across CVDs, across services and across hospitals, during the initial wave of the pandemic. Second, the results have demonstrated that changes in hospital services started to occur prior to lockdown, with some—but not all—moving towards pre-COVID-19 activity levels by early May 2020. Third, the visualisation tool developed for this analysis has illustrated how aggregate data can be collected from hospitals and presented rapidly.
Our results indicate the reduction in overall admissions was substantially larger than the increase in COVID-19 related admissions across all hospitals that provided information on both. Adapting hospital services to address the pandemic has been more complex than simply accommodating an increase in hospital admissions. Hospitals had to create additional critical care capacity by repurposing operating theatres and staff, therefore, cancelling elective surgical procedures. Hospital-wide measures have also been required to minimise spread of infection. These adaptations necessitated reductions in overall activity. Primary care in the UK shifted to a total triage system and remote consultation, wherever possible, with unknown consequences, including impact on hospital referral. These service adaptations were justifiable, but the marked reduction in overall hospital admissions compared with the numbers due to COVID-19 raises the possibility of overall health service overcompensation. The observed reduction in hospital activity will undoubtedly lead to adverse, indirect, long-term impacts on care and incidence of non-COVID-19 diseases. Understanding patient and professional behaviours and service organisational factors contributing to the observed response across different parts of the health service should help in planning appropriate service adaptation for potential further surge of COVID-19 or future emergencies.
The present data showed a dramatic and consistent decline in overall admissions and ED attendances from ~2 weeks before lockdown. This may reflect changes in behaviour of clinicians, hospital management and the public, which occurred prior to lockdown. It is possible that disease incidence of both cardiovascular and non-cardiovascular conditions decreased, which needs to be investigated. There was evidence of recovery in ED attendances and in admissions in some hospitals from around mid-April 2020, although, as of 10 May 2020, activity generally remained below that of the previous year. We also observed marked reductions in CVD-specific ED attendances, admissions and hospital procedures and treatments, although with some recovery in ED attendances and percutaneous coronary interventions (PCI) from mid-April 2020.
We assessed relative change in activity both through percentage change compared with the previous year and through relative reduction compared with before the first UK COVID-19 case. These two approaches yielded consistent results, suggesting that the observed reductions related mainly to the COVID-19 pandemic rather than to expected variations (eg, the known declining rates in carotid endarterectomy20 or seasonal fluctuations). Reductions in procedures for CVDs and PAD were particularly dramatic, with no evidence of recovery by early May. The number of coronary artery bypass surgery (CABG) was more than halved during the pandemic with a less marked reduction in PCI (figure 4 and table 1). While we did not collect data to explore the reasons for this disparity between modes of coronary revascularisation, several factors may be relevant. The repurposing of cardiac surgical and anaesthetic resources during the pandemic will underpin the reduction in cardiac surgical procedures. Furthermore, some patients who had been referred or accepted for CABG were redirected in some hospitals to be treated instead by PCI, which does not require anaesthetic support. Guidelines from the UK’s Vascular Society early in the pandemic suggested increasing the size threshold for elective surgical intervention for abdominal aortic aneurysms and the avoidance of carotid endarterectomy.21 This advice will have contributed to the dramatic decline in aortic aneurysm repairs and carotid endarterectomies. These disease-specific and service-specific data enable monitoring of service activity as well as estimates to inform on the indirect effects of the pandemic on morbidity, mortality and health economic measures.1 10
We demonstrated that hospitals across the UK were willing and able to rapidly provide aggregate data to monitor trends in overall and CVD-specific activity in close to real time. Furthermore, we have developed an online tool to facilitate the inclusion of additional hospitals and incorporate data updates for ongoing monitoring of trends in hospital activity as lockdown restrictions ease across the UK in the coming weeks and months. These data and our tool provide surveillance of overall and cardiovascular hospital activities and could inform which services for which diseases require particular attention at system level and at hospital level. This framework could be used in other non-COVID-19 diseases, for example, cancer and respiratory disease, where national efforts are already underway (eg, those led by the Health Data Research UK cancer and respiratory research hubs, DATACAN and BREATHE, respectively).22 23 These types of data need to be integrated across disease-specific domains in order to tackle the complex nature of the indirect effects of the pandemic as well as the prominent role of multimorbidity in the risk of COVID-19 severity and mortality. Such data are not currently part of routine pandemic or emergency preparedness,24 but the scale of the indirect effects across the UK and worldwide suggests that this situation needs to change.
Comparison with other data
National mortality data from the UK and other countries also demonstrate the direct and indirect impacts of the pandemic, showing peaks in COVID-19 deaths, non-COVID-19 deaths and CVD deaths.25 26 Other studies have also reported similar reductions in hospital activity overall, for CVDs and for other conditions (eg, cancer) during the COVID-19 pandemic, both in the UK and many other countries.9 27–29 Our results on procedures and treatments for CVDs are consistent with the estimated cancellation rate of over 70% for elective operations based on projections from the initial response to the pandemic.29 Where reported, recovery of activity has generally been slow; for example, in hospitals in China, CVD activity remained below pre-COVID-19 levels for 2–3 months, even after easing lockdown.10 To our knowledge, the present report is the first UK study to have recorded overall and cardiovascular hospital activity over a long enough period since lockdown to show the beginning of recovery in some measures and is the only study we are aware of to provide analyses of these via an online tool designed to include data from additional hospitals and regular updates over the months ahead.
Strengths and limitations
The simple, aggregate nature of our data request enabled a large proportion of the hospitals contacted to provide data in a short timeframe. This has made possible the notion of a regularly updated online tool that can incorporate and display near real-time data from an increasing number of hospitals across the UK. However, the aggregate nature of the data means that the influence of individual-level factors such as age, socioeconomic status, ethnicity and comorbidities cannot be explored. Furthermore, our current data request combines data on the primary and other (secondary) reasons for hospital admission and does not subdivide admissions or procedures according to elective (planned) and emergency (unplanned) activity. Future modifications of our data collection procedures could enable separate analysis of elective and emergency procedures. Finally, we used data from the previous calendar year as a comparator to calculate percentage change in activity. While data averaged across the previous 5 years may provide a more stable comparator and has been used to assess excess mortality from national mortality data, such data would mask longer term trends in some activities (eg, reductions in carotid endarterectomies and aortic aneurysm repairs and increasing numbers of procedures for PAD),30 hospitals may have found it more challenging to provide these data, and changes in hospital catchment areas and service arrangements would be more likely to have occurred over a longer period.
Conclusion
In conclusion, we have shown the value of simple aggregate data for monitoring changes in general and disease-specific hospital activity during the course of the COVID-19 pandemic in the UK and the potential for further development of an online tool to enable ongoing monitoring. This will enable individual hospitals to compare activity in their hospital with others and could provide real-time data to inform the planning and prioritisation of service responses to the current and future public health emergencies.
Key messages.
What is already known on this subject?
There were excess non-COVID-19 and cardiovascular disease (CVD) deaths during the COVID-19 pandemic.
Disease burden and health service provision for CVD is unclear.
What might this study add?
Activity for cardiac, cerebrovascular and other vascular conditions fell by 31%–88% after lockdown with the greatest reductions observed in coronary artery bypass grafts, carotid endarterectomy, aortic aneurysm repair and peripheral arterial disease procedures.
How might this impact on clinical practice?
Health service providers should monitor hospital activities and develop strategies to mitigate indirect effects of the COVID-19 pandemic resulted from reduced total and cardiovascular activities.
Acknowledgments
We would like to thank the staff in the Golden Jubilee National Hospital, Glasgow, including Lynn Hay, Jim Christie and Brian Lawson.
Footnotes
Twitter: @amibanerjee1, @wbradlow1, @MichaelPoon
Correction notice: This article has been corrected since it was published Online First. The funding statement was updated to include 'Professor Suzanne Mason is funded by the National Institute for Health Research Yorkshire and Humber ARC. The views expressed in this publication are those of the author(s) and not necessarily those of the National Institute for Health Research or the Department of Health and Social Care.' Additionally, the middle initial R was added to Jonathan R Boyle.
Collaborators: CVD-COVID-UK Consortium members are listed here: https://www.hdruk.ac.uk/wp-content/uploads/2020/07/CVD-COVID-UK-Consortium-Members-for-website-200722.pdf.
Contributors: Study concept: AB, HH and CLMS. Study coordination: AB, RP and CLMS. Study design: AB, JB, BB, AS, RS, CLMS and WW. Data provision: SB, CB, JB, WB, AC, RC, JD, AD, FF, TJ, GK, KKL, PM, SM, NLM, EP, MP, JACS, FES, ZS and MW. Data analysis and online tool development: MTCP. Writing committee: AB, MTCP and CLMS (drafting); all other authors (subsequent revisions). Guarantors: AB and CLMS.
Funding: CB is supported by the British Heart Foundation (RE/18/6134217). CS is supported by the British Heart Foundation and Health Data Research UK. RP is supported by the British Heart Foundation and Health Data Research UK. MP is supported by Health Data Research UK and the MRC Centre for Drug Safety Science. WW is supported by a Scottish Senior Fellowship from the Chief Scientist’s Office (CAF/17/01). JD holds a British Heart Foundation Personal Chair and is supported by grants from the British Heart Foundation, Health Data Research UK and the National Institute for Health Research. AC receives support from the Cambridge NIHR Biomedical Research Centre. MP is supported by Cancer Research UK Brain Tumour Centre of Excellence Aware (C157/A27589). Professor Suzanne Mason is funded by the National Institute for Health Research Yorkshire and Humber ARC. The views expressed in this publication are those of the author(s) and not necessarily those of the National Institute for Health Research or the Department of Health and Social Care.
Competing interests: None declared.
Patient consent for publication: Not required.
Provenance and peer review: Not commissioned; externally peer reviewed.
Data availability statement: No data are available. Due to data governance from individual hospitals, we do not make data available. However, the data template and analysis approach are available on https://github.com/HDRUK/4C-Initiative.
Supplemental material: This content has been supplied by the author(s). It has not been vetted by BMJ Publishing Group Limited (BMJ) and may not have been peer-reviewed. Any opinions or recommendations discussed are solely those of the author(s) and are not endorsed by BMJ. BMJ disclaims all liability and responsibility arising from any reliance placed on the content. Where the content includes any translated material, BMJ does not warrant the accuracy and reliability of the translations (including but not limited to local regulations, clinical guidelines, terminology, drug names and drug dosages), and is not responsible for any error and/or omissions arising from translation and adaptation or otherwise.
References
- 1. Banerjee A, Pasea L, Harris S, et al. Estimating excess 1-year mortality associated with the COVID-19 pandemic according to underlying conditions and age: a population-based cohort study. Lancet 2020;395:1715–25. 10.1016/S0140-6736(20)30854-0 [DOI] [PMC free article] [PubMed] [Google Scholar]
- 2. Kluge HHP, Wickramasinghe K, Rippin HL, et al. Prevention and control of non-communicable diseases in the COVID-19 response. Lancet 2020;395:1678–80. 10.1016/S0140-6736(20)31067-9 [DOI] [PMC free article] [PubMed] [Google Scholar]
- 3. James SL, Abate D, Abate KH, et al. Global, regional, and national incidence, prevalence, and years lived with disability for 354 diseases and injuries for 195 countries and territories, 1990–2017: a systematic analysis for the global burden of disease study 2017. The Lancet 2018;392:1789–858. 10.1016/S0140-6736(18)32279-7 [DOI] [PMC free article] [PubMed] [Google Scholar]
- 4. Newton JN, Briggs ADM, Murray CJL, et al. Changes in health in England, with analysis by English regions and areas of deprivation, 1990–2013: a systematic analysis for the global burden of disease study 2013. The Lancet 2015;386:2257–74. 10.1016/S0140-6736(15)00195-6 [DOI] [PMC free article] [PubMed] [Google Scholar]
- 5. Docherty AB, Harrison EM, Green CA, et al. Features of 20 133 UK patients in hospital with covid-19 using the ISARIC WHO Clinical Characterisation Protocol: prospective observational cohort study. BMJ 2020;369:m1985. 10.1136/bmj.m1985 [DOI] [PMC free article] [PubMed] [Google Scholar]
- 6. Richardson S, Hirsch JS, Narasimhan M, et al. Presenting characteristics, comorbidities, and outcomes among 5700 patients hospitalized with COVID-19 in the new York City area. JAMA 2020;323:2052. 10.1001/jama.2020.6775 [DOI] [PMC free article] [PubMed] [Google Scholar]
- 7. Public Health England Guidance on social distancing for everyone in the UK and protecting older people and vulnerable adults, 2020. Available: https://www.gov.uk/government/publications/covid-19-guidance-on-social-distancing-and-for-vulnerable-people/guidance-on-social-distancing-for-everyone-in-the-uk-and-protecting-older-people-and-vulnerable-adults [Accessed 16 Mar 2016].
- 8. Bhatt AS, Moscone A, McElrath EE, et al. Declines in hospitalizations for acute cardiovascular conditions during the COVID-19 pandemic: a multicenter tertiary care experience. J Am Coll Cardiol 2020;76:280–8. [DOI] [PMC free article] [PubMed] [Google Scholar]
- 9. De Filippo O, D'Ascenzo F, Angelini F, et al. Reduced rate of hospital admissions for ACS during Covid-19 outbreak in northern Italy. N Engl J Med 2020;383:88–9. 10.1056/NEJMc2009166 [DOI] [PMC free article] [PubMed] [Google Scholar]
- 10. Banerjee A, Chen S, Pasea L, et al. Excess deaths in people with cardiovascular diseases during the COVID-19 pandemic. Cardiovascular Medicine 2020. [DOI] [PMC free article] [PubMed] [Google Scholar]
- 11. Bromage DI, Cannatà A, Rind IA, et al. The impact of COVID-19 on heart failure hospitalization and management: report from a heart failure unit in London during the peak of the pandemic. Eur J Heart Fail 2020;22:978–84. 10.1002/ejhf.1925 [DOI] [PMC free article] [PubMed] [Google Scholar]
- 12. Figueroa J, Brennan P, Theodoratou E, et al. Trends in excess cancer and cardiovascular deaths in Scotland during the COVID-19 pandemic 30 December 2019 to 20 April 2020. Epidemiology 2020. [Google Scholar]
- 13. Office for National Statistics Deaths involving COVID-19, England and Wales: deaths occurring in April 2020. Available: https://www.ons.gov.uk/peoplepopulationandcommunity/birthsdeathsandmarriages/deaths/bulletins/deathsinvolvingcovid19englandandwales/deathsoccurringinapril2020
- 14. Public Health England Emergency department: weekly bulletins for 2020, 2020. Available: https://www.gov.uk/government/publications/emergency-department-weekly-bulletins-for-2020
- 15. Gale CP, Weston C, Denaxas S, et al. Engaging with the clinical data transparency initiative: a view from the National Institute for cardiovascular outcomes research (NICOR). Heart 2012;98:1040–3. 10.1136/heartjnl-2012-302469 [DOI] [PubMed] [Google Scholar]
- 16. Denaxas S. OurRisk.CoV (prototype), 2020. Available: http://covid19-phenomics.org/PrototypeOurRiskCoV.html [Accessed 25 Jun 2020].
- 17. British Heart Foundation Improving the nation’s cardio-vascular health: the BHF Data Science Centre, 2019. Available: https://www.hdruk.ac.uk/news/improving-the-nations-cardio-vascular-health-the-bhf-data-science-centre/
- 18. Shah ASV, Anand A, Strachan FE, et al. High-Sensitivity troponin in the evaluation of patients with suspected acute coronary syndrome: a stepped-wedge, cluster-randomised controlled trial. Lancet 2018;392:919–28. 10.1016/S0140-6736(18)31923-8 [DOI] [PMC free article] [PubMed] [Google Scholar]
- 19. Bégaud B, Martin K, Abouelfath A, et al. An easy to use method to approximate Poisson confidence limits. Eur J Epidemiol 2005;20:213–6. 10.1007/s10654-004-6517-4 [DOI] [PubMed] [Google Scholar]
- 20. Johal AS, Loftus IM, Boyle JR, et al. Changing patterns of carotid endarterectomy between 2011 and 2017 in England. Stroke 2019;50:2461–8. 10.1161/STROKEAHA.119.025231 [DOI] [PubMed] [Google Scholar]
- 21. Vascular Society COVID-19 virus and vascular surgery, 2020. Available: https://www.vascularsociety.org.uk/_userfiles/pages/files/Newsletters/2020/Presidents%20update%2027_03_20.pdf [Accessed 1 Jul 2020].
- 22. DATA-CAN - The Health Data Research Hub for Cancer. Available: https://www.hdruk.ac.uk/infrastructure/the-hubs/data-can/
- 23. Health Data Research UK BREATHE - The Health Data Research Hub for Respiratory Health, 2020. Available: https://www.ed.ac.uk/usher/breathe/latest/statement-covid-19-symptom-tracker-app/what-breathe-does-with-data [Accessed 25 Jun 2020].
- 24. World Health Organization Essential steps for developing or updating a national pandemic influenza preparedness plan, 2018. Available: https://www.who.int/influenza/preparedness/pandemic/en/ [Accessed 25 Jun 2020].
- 25. Poon MTC, Brennan PM, Jin K, et al. Tracking excess deaths (TRACKED) – an interactive online tool to monitor excess deaths associated with the COVID-19 pandemic in the United Kingdom. Wellcome Open Res 2020;5:168 10.12688/wellcomeopenres.16058.1 [DOI] [PMC free article] [PubMed] [Google Scholar]
- 26. Roser M, Ritchie H, Ortiz-Ospina E, et al. Coronavirus pandemic (COVID-19). our world in data, 2020. Available: https://ourworldindata.org/coronavirus [Accessed 26 Jun 2020].
- 27. Lai RK, Recht LD, Reardon DA, et al. Long-Term follow-up of act III: a phase II trial of rindopepimut (CDX-110) in newly diagnosed glioblastoma. Neuro-Oncology 2011;13. [DOI] [PMC free article] [PubMed] [Google Scholar]
- 28. Saban M, Reznik A, Shachar T, et al. Reduction in stroke patients’ referral to the ED in the COVID-19 era: A four-year comparative study. Intensive Care Med 2020. [Google Scholar]
- 29. COVIDSurg Collaborative Elective surgery cancellations due to the COVID-19 pandemic: global predictive modelling to inform surgical recovery plans. Br J Surg 2020. 10.1002/bjs.11746. [Epub ahead of print: 12 May 2020]. [DOI] [PMC free article] [PubMed] [Google Scholar]
- 30. Clinical Effectiveness Unit National vascular registry, 2019. Available: https://www.vsqip.org.uk/content/uploads/2019/12/NVR-2019-Annual-Report.pdf
Associated Data
This section collects any data citations, data availability statements, or supplementary materials included in this article.
Supplementary Materials
heartjnl-2020-317870supp001.pdf (124.9KB, pdf)