

Abstract
The cellular NADH/NAD+ ratio is fundamental to biochemistry but the extent to which it reflects versus drives metabolic physiology in vivo is poorly understood. Here, we report the in vivo application of LbNOX1, a bacterial water-forming NADH oxidase, to assess the metabolic consequences of directly lowering the hepatic cytosolic NADH/NAD+ ratio in mice. By combining this genetic tool with metabolomics, we identify circulating α-hydroxybutyrate (αHB) as a robust marker of elevated hepatic cytosolic NADH/NAD+ ratio, also known as reductive stress. In humans, elevations in circulating αHB levels have previously been associated with impaired glucose tolerance2, insulin resistance3, and mitochondrial disease4, and are associated with a common genetic variant in GCKR5, which has previously been associated with many seemingly disparate metabolic traits. Using LbNOX, we demonstrate NADH reductive stress mediates the effects of GCKR variation on many metabolic traits including circulating triglycerides, glucose tolerance, and FGF21 levels. Our work identifies elevated hepatic NADH/NAD+ as a latent metabolic parameter that is shaped by human genetic variation and contributes causally to key metabolic traits and diseases. Moreover, it undescores the utility of genetic tools such as LbNOX to empower studies of “causal metabolism.”
INTRODUCTION
NADH and NAD+ are essential redox cofactors that lie at the heart of metabolism. They play a particularly important role in hepatic metabolism6, though there is conflicting evidence as to their causal contributions and directionality in disease. For example, mice fed a high fat diet develop metabolic abnormalities that can be partially reversed by treatment with nicotinamide riboside (NR), which raises total NAD+ levels7,8. In contrast, recent studies have implicated an increase in the hepatic cytosolic NADH/NAD+ ratio in the glucose lowering effects of metformin9.
This lack of clarity stems in part from a dearth of tools with which to directly manipulate NADH/ NAD+ in a tissue-specific manner and with subcellular resolution. Dietary supplements which raise hepatic NAD+ levels in vivo do so indirectly and across a broad range of tissues8, and classic redox tools like methylene blue cannot be targeted to specific tissues and can impact multiple redox cofactors. Compounding this challenge, NADH and NAD+ are compartmentalized within cells and organelles, with levels that differ by orders of magnitude, and exist in both free and protein bound forms10.
Recently we introduced a genetic tool, LbNOX, that overcomes these limitations1. LbNOX is a bacterial NADH oxidase that couples the oxidation of NADH to NAD+ with the reduction of oxygen to water (Figure 1a, ). It has high catalytic activity and can be genetically targeted to different subcellular compartments.
Figure 1 -. LbNOX alters compartment-specific free NADH/NAD+ ratio in hepatocytes.
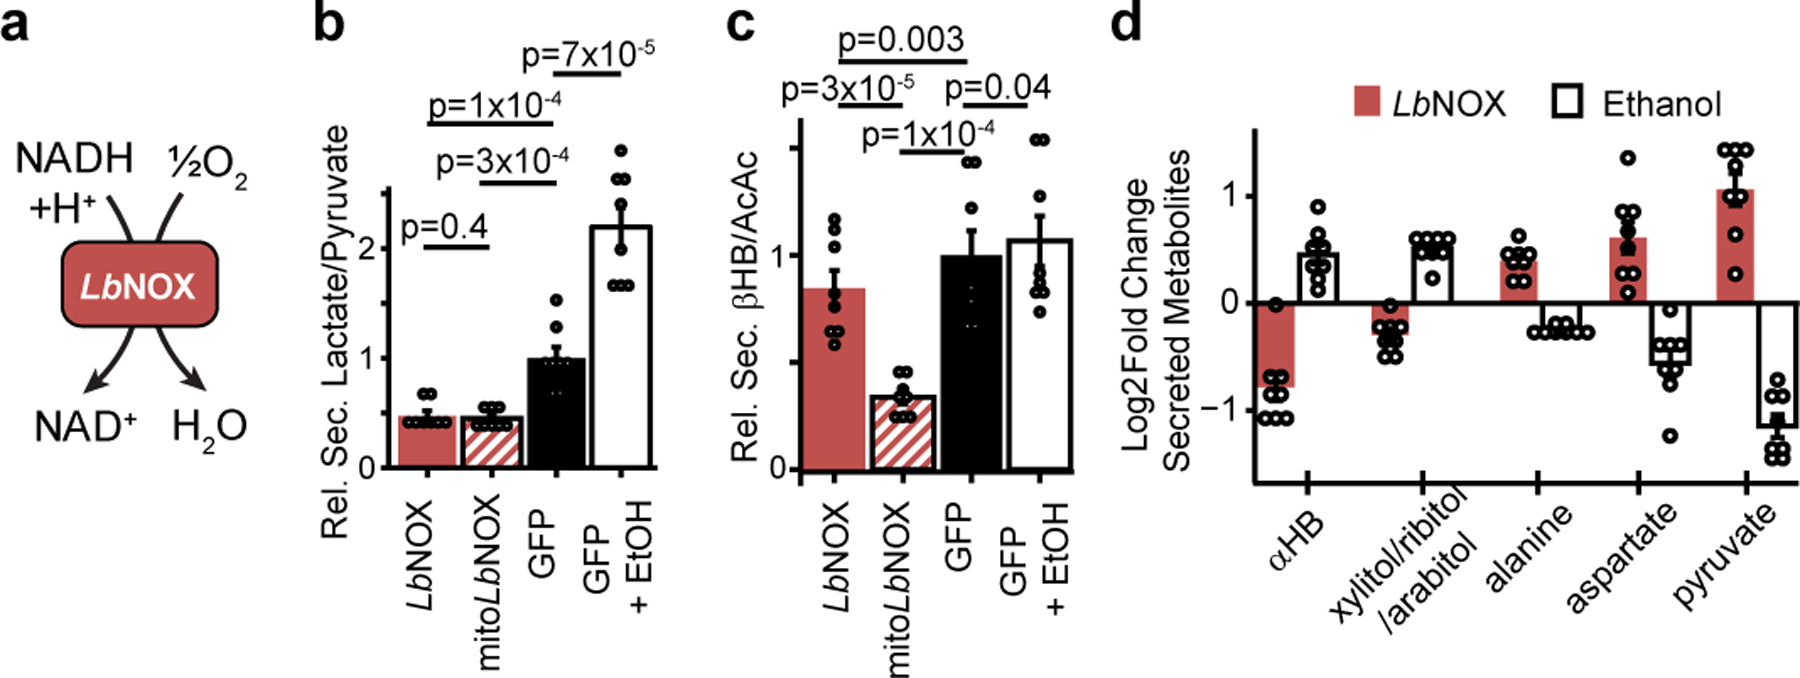
(a) Chemical reaction catalyzed by LbNOX. (b) Effect of LbNOX, mitoLbNOX or ethanol on primary hepatocyte secreted lactate/pyruvate and (c) secreted β-hydroxybutyrate/acetoacetate. (d) Relative changes in abundance of secreted redox concordant metabolites. Data are mean ± s.e.m from n=8 independent hepatocyte isolations. Nominal p values were determined using paired two-sided Student’s T tests between hepatocyte isolationn
Here, we used LbNOX with metabolomics to characterize the biochemical consequences of lowering the hepatic free cytosolic NADH/NAD+ ratio in vivo. Among the top changing metabolites is α−hydroxybutyrate (αHB), whose elevation has been identified as a biomarker of early insulin resistance3, impaired glucose tolerance2, diabetes risk11, and mitochondrial disorders4. The strongest metabolite quantitative trait locus (mQTL) for αHB is in the gene GCKR, which encodes glucokinase regulatory protein (GKRP), an inhibitor of hepatic glucokinase, and is among the most – if not the most – pleitropic GWAS loci, with over 100 studies linking common GCKR variation to over 130 metabolic traits and diseases (Supplementary Table 1). We provide evidence that many of these traits – including circulating αHB, triglycerides, FGF21, and glucose tolerance – can lie downstream of the cytosolic hepatic NADH/NAD+ ratio.
RESULTS
LbNOX lowers NADH/NAD+ in hepatocytes
We used adenovirus to express LbNOX, mitochondrial-targeted LbNOX (mitoLbNOX), or GFP in primary mouse hepatocytes (Extended data 1a). As LbNOX consumes O2, its activity in cells can be detected as non-mitochondrial oxygen consumption. Expression of LbNOX or mitoLbNOX trend towards or increase, respectively, mitochondria-independent O2 consumption (Extended Data 1b). The higher O2 consumption of mitoLbNOX compared to LbNOX, which we have previously reported1, is consistent with higher free NADH concentration in mitochondria10.
To assess the subcellular metabolic activity of LbNOX we measured secreted lactate/pyruvate and β-hydroxybutyrate (βHB)/acetoacetate(AcAc) ratios, metabolite ratios reflective of the cytosolic and mitochondrial free NADH/NAD+ ratios, respectively10. LbNOX markedly lowered lactate/pyruvate, whereas mitoLbNOX lowered both βHB/AcAc and lactate/pyruvate (Figure 1a–b). In contrast ethanol, which generates cytosolic NADH through oxidation of ethanol via alcohol dehydrogenase, increased lactate/pyruvate. We additionally used the fluorescent reporter Peredox12,13 to measure the free cytosolic NADH/NAD+ ratio in hepatocytes exposed to different concentrations of ethanol (Extended Data 1c), with LbNOX shifting the dose-response curve rightwards. The combination of LbNOX and ethanol thus allows selective perturbation of cytosolic free NADH/NAD+ in hepatocytes.
Total cellular measurements of NAD+, NADH, the NADH/NAD+ ratio, or total pool sizes (Extended data 1d–g) are unchanged with LbNOX expression. We note that as total cellular measurements of NADH and NAD+ integrate both free and bound levels originating from all cellular compartments, measurements with the lactate/pyruvate ratio or Peredox are more sensitive to changes in cytosolic free NADH/NAD+ ratio than total cellular measurements.
A screen for redox-sensitive metabolites
We next designed a screen for metabolites sensitive to free cytosolic NADH/NAD+. Primary hepatocytes were transduced with LbNOX or with GFP plus or minus ethanol, and the media was then profiled using liquid chromatography mass spectrometry (LC-MS). We focused on five metabolites whose changes were “redox concordant,” defined as metabolites that significantly increased with LbNOX and decreased with ethanol, or vice versa (Supplementary Table 2, Figure 1c). αHB was among the most sensitive, and became the focus of further investigations given its previous association with a number of metabolic conditions.
The effects of LbNOX and NR are distinct
NR supplementation has emerged as a robust means of increasing total NAD+ pool sizes in vitro and in vivo8,14 but its effect on cellular compartment-specific free NADH/NAD+ ratios is unclear. We therefore performed a direct comparison of the metabolic effects of NR versus LbNOX in hepatocytes. In contrast to LbNOX, NR dramatically boosted total NAD+ levels and the total NAD(H) pool size [Extended data 2 a–c], yet did not lower compartment-specific free NADH/NAD+ ratios as measured by lactate/pyruvate or βHB/AcAc, nor did it lower αHB [Extended data d–f]. We investigated whether NR supplementation could rescue the pyruvate auxotrophy that is classically observed in the context of ETC inhibition and known to be due to an elevated cytosolic NADH/NAD+ ratio1,15. In the presence of piericidin (an inhibitor of mitochondrial complex I), either pyruvate or LbNOX expression could rescue cellular proliferation, but NR supplementation could not [Extended data 2g], despite boosting total cellular NAD+ levels [Extended data 2h]. This illustrates both how measurements of total cellular NAD(H) levels provides little information with respect to free compartment-specific NAD(H), and suggests that the increased cellular NAD+ from NR may contribute to the free NADH/NAD+ pools in a redox-neutral manner.
Hepatic NADH/NAD+ alters αHB in vivo
To extend these findings in vivo, we evaluated the metabolic effects in mice tail-vein injected with LbNOX or luciferase control adenovirus and gavaged with ethanol or water (Figure 2a). We observed that alcohol increased hepatic NADH/NAD+ and αHB, which was largely prevented with LbNOX expression (Figure 2b–c), and an identical pattern between plasma αHB and the lactate/pyruvate ratio (Figure 2d–e), but not βHB/AcAc (Figure 2f), demonstrating αHB is a biomarker of the hepatic free cytosolic NADH/NAD+ ratio in vivo. To complement these findings in another model, we examined the Ndufs4 KO mouse model of mitochondrial disease due to deficiency in complex I16, the primary enzyme responsible for oxidation of NADH to NAD+ in most cell types. Ndufs4 KO had significantly higher plasma αHB levels and hepatic NADH/NAD+ ratios, consistent with our previous findings [Extended data 3]17.
Figure 2 -. in vivo manipulation of the hepatic cytosolic NADH/NAD+ ratio alters hepatic and circulating αHB.
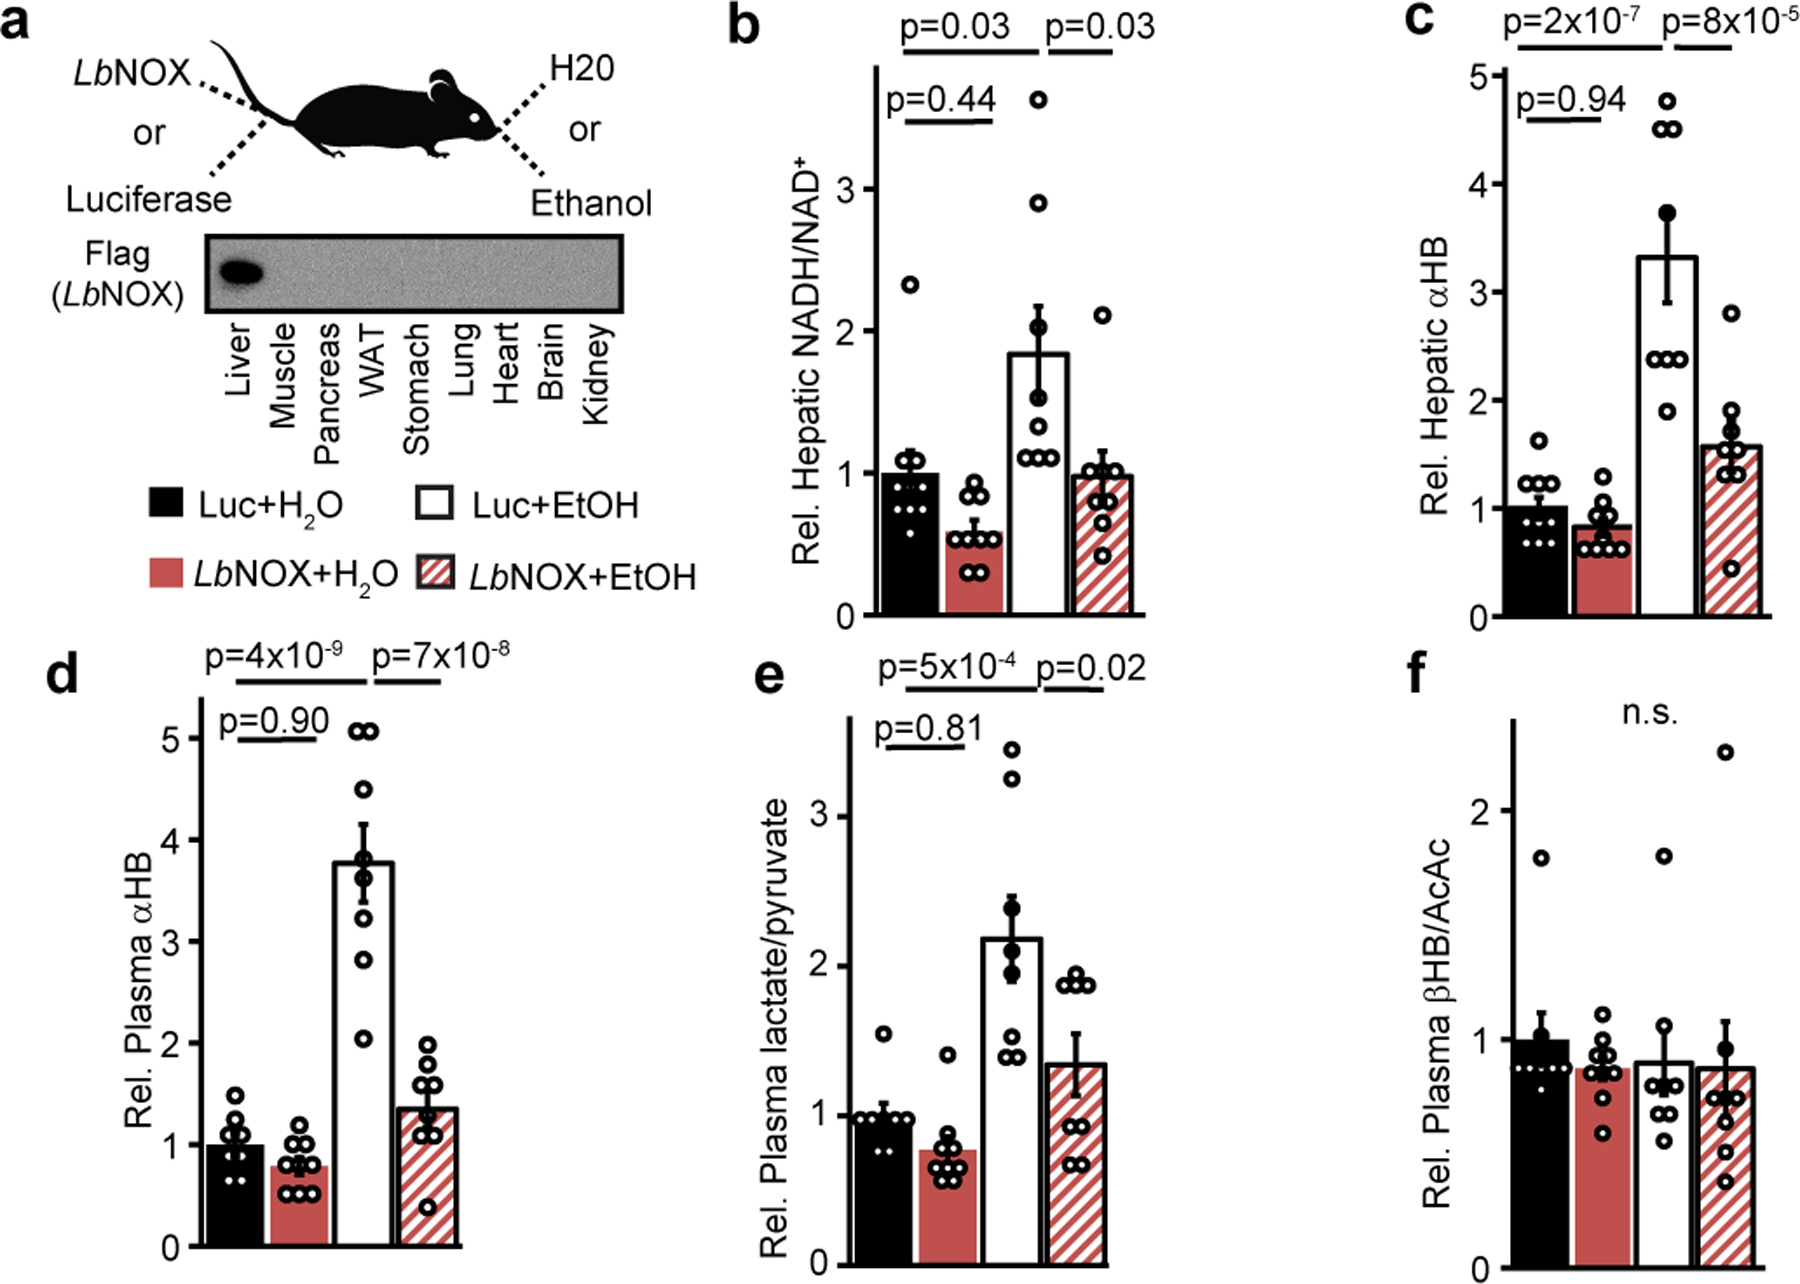
(a) Experiment outline. Effects of combination of hepatic LbNOX or luciferase expression and alcohol on (b) hepatic NADH/NAD+, (c) hepatic αHB (d) plasma αHB, (e) plasma lactate/pyruvate, (f) plasma βHB/AcAc. Data are mean ± s.e.m from n=8–10 mice per group. p values were determined using one-way ANOVA with post-hoc Tukey’s HSD test. n.s. is p=0.90.
A GCKR variant raises hepatic NADH/NAD+
We next hypothesized we could identify candidate human genetic determinants of hepatic NADH/NAD+ via genetic association studies of plasma αHB levels. Data from a mQTL study of the Framingham Heart Study reveals that the top three SNPs associated with αHB levels – rs1260326, rs780094, and rs780093 (Figure 3a)5 – are in the GCKR locus, a liver-specific gene (Figure 3b). The three SNPs are in tight linkage disequilibrium and the “risk” haplotype, which approaches 50% prevalence in some populations (Extended data 4a)18, has been associated with a remarkably large number of disease states and metabolic traits, spanning cardiometabolic risk factors such as circulating cholesterol and triglyceride levels19,20, plasma levels of small circulating metabolites5, behavioral traits such as alcohol and coffee consumption21,22, important mediators of metabolic signaling such as leptin23 and FGF2124, as well as diseases such as diabetes25, and fatty liver disease26 [Supplementary Table 1].
Figure 3 -. A common GCKR variant is associated with plasma.
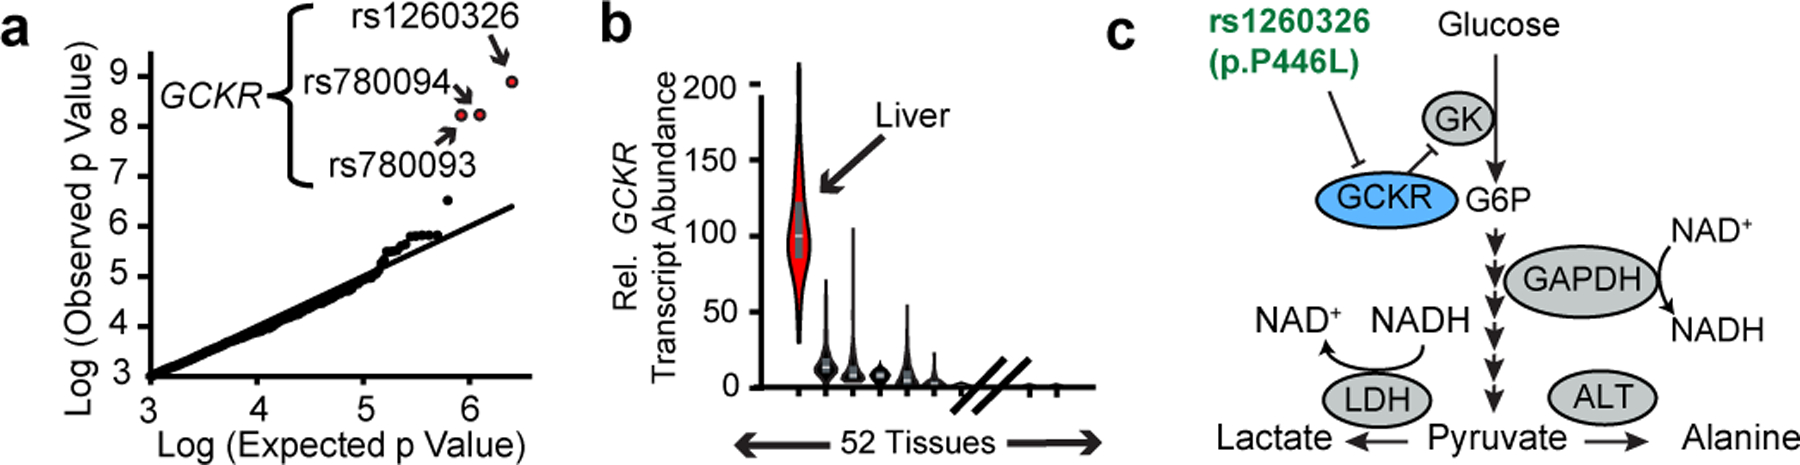
αHB in humans (a) Q-Q plot of variants associated with plasma αHB levels, from Rhee et al 20135. (b) Relative distribution of GCKR expression in humans from GTEx (Lonsdale et al. 2012). Box plots show median, 25th and 75th percentile expression. (c) Pathway diagram depicting proposed role of GCKR and its polymorphism.
GCKR’s protein product GKRP sequesters hepatic glucokinase in the liver during fasting and releasing it during feeding. It is thought to help prevent a futile metabolic cycle during gluconeogenesis with glucose-6-phosphatase, and provide a rapid mechanism to increase hepatic glucose metabolism during feeding27 (Figure 3c). rs1260326 encodes a P446L missense mutation in GKRP which inhibits its activity and results in higher glucokinase activity and hepatic glycolytic flux28, and is the likely causal variant underlying traits associated with the risk GKCR haplotype.
To our knowledge, no previous study has invoked the hepatic NADH/NAD+ ratio as an effector of GCKR variants. To investigate this possibility, we identified plasma metabolites from the Figure 2 experiment that were sensitive to hepatic NADH/NAD+ (see Methods), and then calculated an enrichment score for these metabolties across all metabolite-QTL loci reported in the Rhee et al. study5. This analysis revealed GCKR as among the top loci for redox-sensitive metabolites (Extended data 4b).
We then measured the metabolic consequences of overexpression of either GKRP 446P or GKRP 446L (rs1260326 variant) in primary hepatocytes (Extended data 4c). GKRP 446P overexpression decreased the lactate/pyruvate ratio and αHB, but this effect was less with the 446L variant, despite comparable levels of overexpression. This indicates both that GCKR directly influences the free cytosolic NADH/NAD+ ratio, and that this effect is blunted for the 446L variant. Additionally, the direction of change in lactate, pyruvate, alanine, and αHB were all consistent with changes observed at the GCKR locus in previously reported GWAS studies [Supplementary Table 1]. Glucose is a fundamental source of reducing equivalents and GKRP’s inhibition of glycolytic flux is diminished with the 446L variant28. Thus, we speculate the effect of GCKR on the decreasing the free hepatic NADH/NAD+ ratio is most likely through modulation of glycolytic flux and/or its fate.
LbNOX alters insulin resistance in vivo
As GCKR variants are associated with impaired glucose tolerance29 and circulating αHB is a biomarker of impaired glucose tolerance and insulin resistance3, we investigated the effects of LbNOX expression in the high fat diet (HFD) mouse model of insulin resistance and dysglycemia.
At baseline, HFD mice had elevated circulating levels of αHB compared to chow-fed diet (CFD), which were significantly lowered with LbNOX (Figure 4a). Hepatic LbNOX improved glucose tolerance in HFD mice (Figure 4b), and hepatic insulin resistance during hyperinsulinemic-euglycemic clamps (Figure 4c–d), though not any other measured parameters including body weight or insulin-stimulated glucose uptake in peripheral tissues (Extended data 5a–k, Supplementary Table 3). These data indicate a causal link between the free cytosolic hepatic NADH/NAD+ ratio and hepatic insulin resistance in our system, which potentially underlies the association of αHB with insulin resistance in humans3.
Figure 4 -. Direct oxidation of free hepatic cytosolic NADH improves glucose tolerance and hepatic insulin sensitivity in vivo.
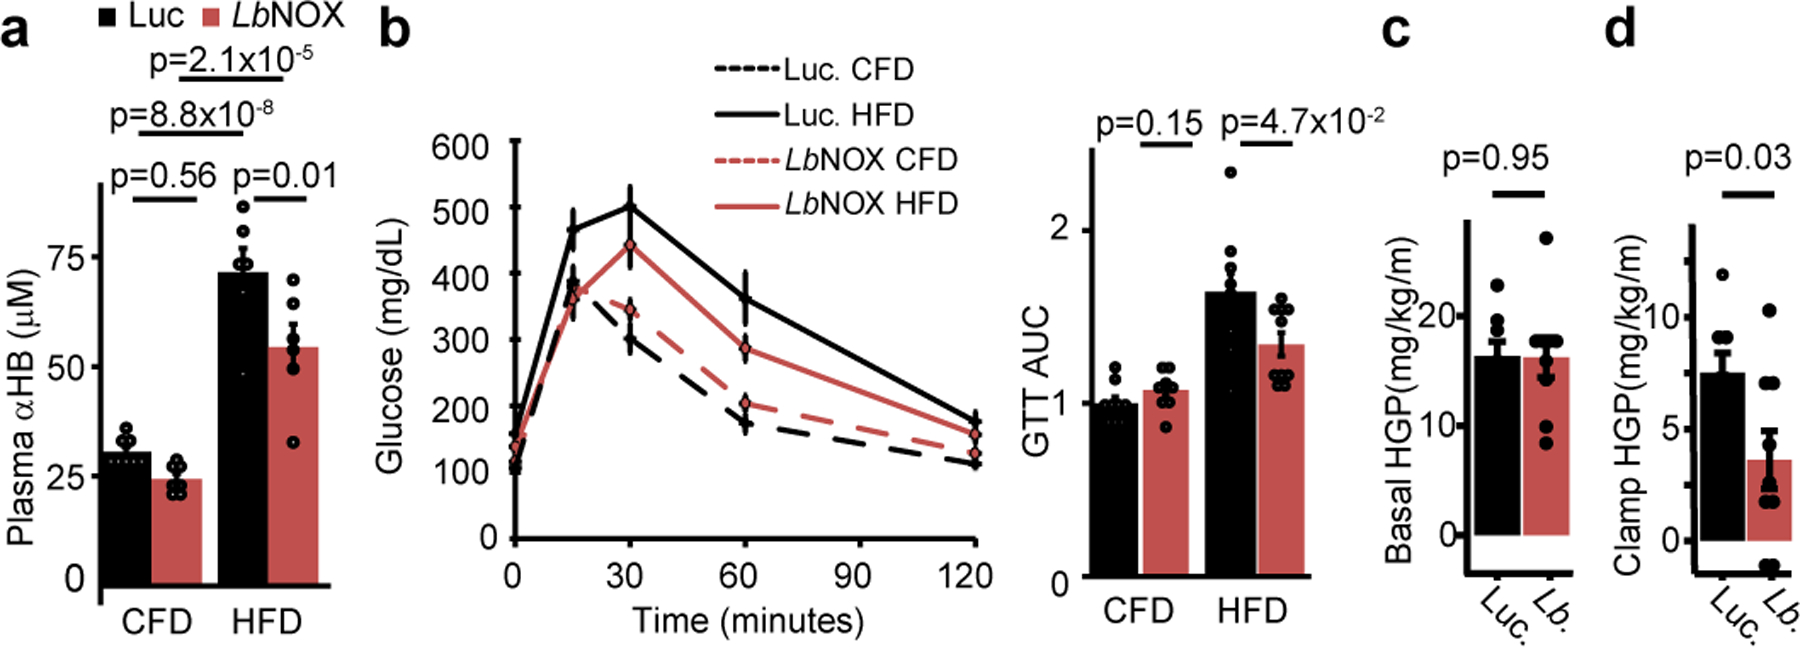
Effects of hepatic LbNOX expression on (a) plasma αHB and (b) glucose tolerance in chow fed (CFD) or high-fat diet (HFD) mice. Effect of hepatic LbNOX in HFD-fed mice during hyperinsulinemic-euglycemic clamp on (c) basal hepatic glucose production (HGP), (d) clamp hepatic glucose production. p values were determined using unpaired two-sided Student’s T test (b-d), or one-way Anova with post-hoc Tukey’s HSD test (a). Data are mean ± s.e.m from n=6–8 mice for (a), 9–10 for (b), 8–9 total for (c).
Most models of hepatic insulin resistance invoke a disruption of hepatic insulin signaling at or upstream of Akt via a number of proposed mediators30–33 such as diacyl glycerols (DAGs) or ceramides, leading to downstream alterations in FoxO1 activity and transcription of gluconeogenic genes. However, we could find no difference in hepatic DAG or ceramide content with LbNOX expression [Extended data 6a–b], nor acute insulin-mediated Akt phosphorylation [Extended data 7a–c], FoxO1 target transcript abundance [Extended data 7d], or AKT phosphorylation/FoxO1 targets at the end of the hyperinsulinemic-euglycemic clamp (Extended data 7e–g). Total NAD+, NADPH, and NADP+ pool sizes were also unchanged (Extended data 8a–f).
Measurements of the gluconeogenic intermediates that sequentially link the conversion of pyruvate to glucose, with the exception of glyceraldehyde-3-phosphate (GAP) and oxaloacetate which we could not reliably measure, suggest a control point at either Gapdh or Tpi (Extended data 7h, top panel,Extended data 7i), which is most likely at Gapdh as it requires NADH to reduce bisphosphoglycerate (BPG) to GAP. This is further strengthened by an analysis of livers grouped into high or low lactate/pyruvate ratio which even more clearly identifies the Gapdh/Tpi crossover point (Extended data 7h, bottom panel).
NADH/NAD+ can serve as an effector of GCKR–linked traits
Having established that the free hepatic cytosolic NADH/NAD+ ratio underlies the association between GCKR and αHB, we hypothesized that some of the many other traits linked to GCKR variation might similarly be mediated by hepatic NADH/NAD+ [Figure 5a].
Figure 5 -. Many GCKR Associated Metabolic Traits Lie Downstream of Hepatic NADH Reductive Stress.
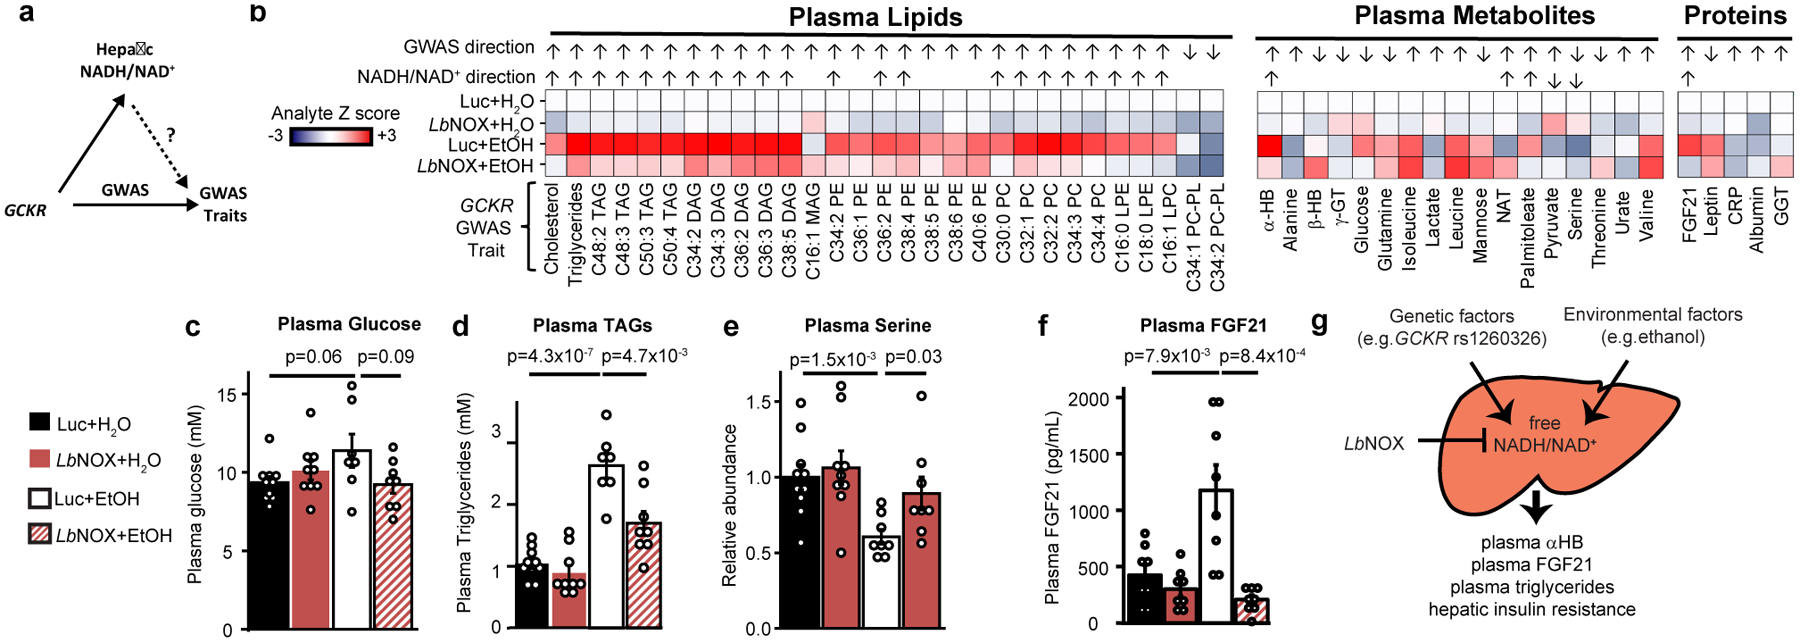
(a) GWAS studies have linked many traits to GCKR variation. The current study raises the hypothesis that some of these are mediated by variation in hepatic NADH/NAD+ (b) Shown are 51 such traits that we could measure using the EtOH/LbNOX in vivo system in Figure 3a, with the analyte Z score for each condition relative to Luc+H20, whether the measured analyte fulfilled our criteria fo “NADH/NAD+ sensitivity” (see Material and Methods) and if so its direction, along with the observed direction of effect from the P446L risk haplotype in published studies (Supplementary Table 1). Selected data are shown for (c) plasma glucose, (d) total plasma triglycerides, (e) plasma serine, and (f) plasma FGF21. (g) Proposed model, where circulating αHB is a biomarker of elevated cytosolic free hepatic NADH/NAD+, a latent metabolic parameter that is influenced by genetic and environmental factors and serves as an effector of different metabolic traits. Data are mean ± s.e.m from n=7–10 mice per group. Nominal p values were determined using two-sided Student’s T tests used for “NADH/NAD+” sensitivity calculations. TAG= triacylglycerol; DAG= diacylglycerol; MAG= monoacylglycerol; PE = phosphatidylethanolamine; PC phosphatidylcholine; LPE = lysophosphatidylethanolamine; LPC lysophophatidylcholine; PC-PL phosphatidychloine plasmalogen; γGT γ−glutamylthreonine; GGT gamma-glutamyltransferase; CRP C-reactive protein; NAT N-acetyltrytophan.
To investigate this possibility we used a variety of analytic methods (see Methods) to measure plasma levels of 51 analytes associated with GCKR in GWAS studies using the experimental scheme from Figure 2 [Figure 5b]. Of these, we found 28 were sensitive to hepatic cytosolic NADH/NAD+ of which nearly all were in the same direction as their GWAS associations. While some tested metabolites did not exhibit sensitivity to hepatic NADH/NAD+ including plasma glucose [Figure 5c], many did and notably included plasma triglycerides [Figure 5d] (the most replicated GWAS association with the GCKR risk haplotype in over 30 studies, see Supplementary Table 1), plasma serine [Figure 5e], and circulating FGF21 levels [Figure 5f].
Not all GCKR-linked traits we could measure showed NADH/NAD+ sensitivity, perhaps due to technical reasons (for example our acute experimental paradigm versus chronic human changes) or the fact that some GCKR assocations may operate via changes in hepatic glycolytic flux that are non-redox based.
This approach demonstrates the effectiveness of using GCKR GWAS associations as human genetic tools to uncover novel human NADH/NAD+ biology, and further supports the concept that the hepatic redox state is an effector of GCKR to influence metabolic traits.
DISCUSSION
With the use of LbNOX we have been able to change the free NADH/NAD+ ratio in a specific cellular compartment – the cytoplasm – in a specific tissue – the liver – in vivo. In doing so we have identified αHB as a circulating biomarker of the free cytosolic hepatic NADH/NAD+ ratio, which is in turn influenced by common human genetic variation in GCKR. This in turn has allowed us to identify excess NADH electrons, or “reductive stress”, as an effector of many metabolic traits linked to GCKR through GWAS (Figure 5g).
αHB is a relatively obscure metabolite whose only known production in humans is through the reduction of α-ketobutyrate (αKB) via LDH in the cytosol (Extended data 9). An elevation in cytosolic NADH/NAD+ would therefore promote αHB formation and likely underlies our observation that αHB is a biomarker of cytosolic NADH/NAD+. While we cannot exclude the possibility of non-hepatic contributions to the circulating αHB pool, recent work by Rabinowitz and colleagues suggest that only the liver and, interestingly, skin are significant sources34. We note other sources of αKB could also potentially influence αHB levels.
Prior metabolomics studies have demonstrated that elevated plasma αHB is associated with dysglycemia, and we show both that αHB is elevated in a mouse model of insulin resistance, and that direct oxidation of hepatic cytosolic NADH in this setting improves hepatic insulin resistance, possibily independent of canonical intrinsic hepatic insulin signaling35,36. Our data phenocopy the association of αHB in humans that lower αHB levels are associated with improved glucose tolerance and insulin resistance but not basal blood glucose levels2,3.Our data also clarify causal relationships which underlie the mechanism by which GCKR segregates dysglycemic traits, namely how the GCKR variant which worsens glucose tolerance37,38 improves basal glucose levels25: it is likely that the blood glucose lowering effect of the GCKR variant causally increases reductive stress, and this high NADH/NAD+ is causally related to hepatic insulin resitance and glucose tolerance. We also note recent work demonstrating that a SLC16A11 haplotype which increases risk of type II diabetes also increases the cytosolic NADH/NAD+ ratio, and hypothesize that the associated reductive stress is causally related to its phenotype39.
Motivated by the association between circulating levels of αHB and GCKR genetic variation5, we are able to demonstrate that common human genetic variation in GCKR directly influences hepatic reductive stress, and that many traits linked to GCKR variants are influenced by reductive stress in a mouse model [Figure 5b].
Our work has uncovered two notable traits that have previously been associated with GCKR variation, but whose link to hepatic NADH redox metabolism has not previously been reported: circulating triglycerides [Figure 5d] and plasma FGF21 levels [Figure 5f]. Plasma triglycerides, a cardiometabolic risk factor, are the most replicated GCKR GWAS association [Supplementary Table 1], nominating hepatic NADH reductive stress as a latent risk factor of cardiometabolic disease. Reductive stress additionally likely contributes to the increase in circulating triglycerides observed with heavy alcohol consumption40, and may be causally related to hepatic fat accumulation seen with heavy alcohol use, as well as hepatic fat more generally given the association of GCKR with hepatic fat content in NAFLD26. FGF21 is a hepatokine that has many metabolic actions, and though a redox basis for its secretion has never before been proposed, previous studies have shown that alcohol consumption causes its release41.
We speculate that the simultaneous release of triglycerides and FGF21 by the liver in response to NADH reductive stress may represent an adaptive, dissipative program. Triglycerides are energy rich lipids that can be packaged and exported to peripheral tissues. FGF21 is known to boost metabolic rates through increased uncoupling42 or energy expenditure43 and specifically promotes the clearance of circulating triglycerides by promoting their uptake into fat44 . The release of triglycerides and and FGF21 in response to elevations in NADH/NAD+ may therefore represent a whole body “reductive stress response” whose logic is to transfer reducing equivalents from the liver into peripheral tissues for storage or for catabolism. Future challenges lie in testing this model and elucidating the molecular mechanisms linking high NADH/NAD+ ratios in the cytosol to elevations in circulating FGF21 and triglycerides.
Through the use of LbNOX – a genetic tool that enables causal studies of NADH/NAD+ metabolism - our work strongly supports the concept that the alterations in αHB levels seen in insulin resistance, common GCKR variants, and mitochondrial disorders, reflect an excess of hepatic reducing equivalents, and that this hepatic reductive stress can be a causal determinant for many metabolic traits and diseases [Figure 6g]. Future efforts will be required to directly target reductive stress for therapeutic benefit, as well as define adaptive and maladaptive components of the reductive stress response.
METHODS
Primary Hepatocyte Experiments [Figures 1b–f, 2a–f, 4d, ED1a–e]
Primary hepatocytes were freshly isolated by perfusion and enzymatic digestion (Roche 5401119001) of livers from male C57BL/6J mice, aged 12–16 weeks, and plated on 6-well collagen-coated plates (Life Technologies A1142801) at a density of 4E5 cells per well in Gibco DMEM 11995–065 media supplemented with 10% FBS (Sigma-Aldrich F2442), 200 U/mL Penicillin-Streptomycin. Cells were transduced with adenovirus immediately after isolation, and all subsequent experiments were performed 24 hours after isolation. Prior to metabolomics experiments, transduced hepatocytes were placed in serum-free media (Gibco DMEM A1443001 supplemented with 5.5 mM glucose), and media samples were collected two (Figure 1) or four hours later (Figures 2,4). For experiment with nicotinamide riboside (NR), Nicotinamide Riboside Chloride (Tru Niagen) in PBS was added to a final concentration of 500 μM at the time of hepatocyte seeding, and included at a concentration of 500 μM in the serum free media use for metabolomics experiments.
Rescue of Piericidin-induced inhibition of cell proliferation [Figure 2g]
1×10³ HeLa Tet3G LbNOX cells (previously described in Titov et al. 20171) were seeded in 96 well plates in DMEM 11995–065 media supplemented with 10% FBS (Sigma-Aldrich F2442), 200 U/mL Penicillin-Streptomycin. Twenty-four hours after seeding, either water or doxycycline was added to to a final concentration of 300 ng/mL in each well. Twenty-four hours later, media was exchanged to DMEM without pyruvate (US Biological, D9802), supplemented with 10% dialyzed FBS (Life Technologies, 26400–044), 200 μM uridine, ± 1 μM piericidin, ± 1 mM pyruvate, ± 500 μM NR, and ± 300 ng/ml doxycycline. Cells were counted 4 days later.
Adenovirus Production, Amplification, and Titering
All adenoviruses were Type 5 (dE1/dE3), with gene expression driven by a CMV promoter. Seed GFP amd Luciferase control adenoviruses were purchased from Vector Biolabs and Signagen, respectively. LbNOX and mitoLbNOX adenoviruses were generated using the ViraPower Adenoviral Expression Kit (Thermo Fisher K493000) after subcloning from pUC57-LbNOX and pUC57-mitoLbNOX (Addgene Plasmids 75275 and 75285, respectively). Mouse GCKR adenovirus (GKRP 446P, ref BC012412, and GKRP 446L) were purchased from Vector Biolabs. All viruses were amplified in 293A cell lines (ATCC) and titered using the Adeno-X Rapid Titer Kit (Takara Bio 632250), co-titered with aliquots of a standard virus of known titer as a control. High-titer virus for in vivo expression was purified using the Adenovirus Purification Kit (ViraPur 003054).
Primary Hepatocyte Oxygen consumption [Figure ED1a]
Hepatocyte respiration was measured 24 hours after isolation and transduction in a Seahorse Bioscience XF24–3 Analyzer. Prior to seeding, Seahorse XF24 cell plates were coated with 30 μL of 100 μg/mL Collagen I from rat-tail (Enzo ALX-522–435). Immediately after hepatocyte isolation, fresh hepatocytes were added to cell plates at a density of 5000 cells per well in 250 μL of hepatocyte isolation media (described above), in addition to the specified adenovirus, and incubated overnight. Twenty-four hours after plating, media was replaced with 450 μL of assay media (Gibco DMEM A14430–1, 10% FBS, 200 U/mL penicillin-Streptomycin, 5.5 mM HEPES, 1 nM insulin, 1 nM dexamethasone, 4.5 g/L glucose), and oxygen consumption was measured. Each measurement was performed after a 4-minute mix period, a 30-second pause, and a 2-minute wait period. ETC inhibitors Antimycin A and Rotenone were injected to a final concentration of 2 μM each.
Imaging Peredox in Mouse Hepatocytes [Figure 1e]
Freshly isolated hepatocytes were plated on fibronectin-coated glass coverslips in a 6-well plate and incubated for 4 hours in hepatocyte medium with adenovirus. The transduction mixture was removed, and hepatocytes were transfected with 1.0 μg Peredox-mCherry in pcDNA3.1 using Effectene transfection reagent (Qiagen, Hilden, Germany) in fresh medium. After 12–14 hours, the transfection mixture was removed and fresh medium was added. Experiments were carried out 24–32 hours afterwards (36–48 hours after hepatocyte isolation). Wide-field epifluorescence experiments were performed in a diamond-shaped solution chamber mounted on the headstage of an inverted microscope (Nikon, Tokyo, Japan) under continuous perfusion (1.2 mL/min flow rate) heated at 37oC. Glass coverslips containing plated hepatocytes were cracked with a diamond-tip pen and shards were placed in the recording chamber. The bath solution was 140 mM NaCl, 10 mM glucose, 10 mM HEPES, 5 mM KCl, 2 mM CaCl2, 1 mM MgCl2; pH adjusted to 7.4 with 1 M NaOH. Ethanol was added as indicated. Glass shards were preincubated in bath solution at 37oC for 10 min prior to placing in the recording chamber. Emitted light was collected with an Andor Revolution DSD spinning disk unit (Andor, Belfast, UK) using a x20/0.75NA objective illuminated with a LED light source (Lumencor, Beaverton, OR). The green and red fluorophores of Peredox were excited using 405/10 nm and 578/16 nm band-pass filters, emission was collected through 525/50 nm and 629/56 nm band-pass filters, and excitation and emission light were separated with 490-nm and 590-nm short pass dichroics, respectively. Images were acquired with iQ (Andor) every 15 s at 50 ms exposure and 4×4 binning.
Fluorescence intensity was quantified with ImageJ as the mean over a region of interest drawn around each analyzed hepatocyte. Peredox signal (green/red) was expressed as a percent value where 0 is the “floor” (obtained in 10 mM pyruvate) and 100 is the “ceiling” (obtained in 10 mM ethanol). For dose-response curves, a Hill function was fit to the data using the Solver function in Excel.
Analyte Measurements
Mouse blood glucose was measured with an AlphaTRAK2 glucose monitor (Zoetis), plasma glucose with Glucose-SL reagent (Sekisu, 235–60), trigylcerides with Triglyceride-SL reagent (Sekisu, 236–99), Leptin with a mouse leptin ELISA (Enzo, ADI-900–019A), FGF21 with mouse FGF21 ELISA (Sigma Millipore, EZRMFGF21–26K), GGT with mouse GGT ELISA (Aviva systems biology, OKEH03351), CRP with mouse CRP ELISA (Sigma, RAB1121), and Albumin with BCG Albumin Assay (Sigma, MAK124). Whole cell/tissue NADH/NAD+ for Figures 2a–c,h ED1b-e, and ED with NAD+/NADH-Glo Assay (Promega, G9071).
Analytes not listed above were measured with LC-MS or GC-MS as described below.
Animal Experiments
All animal experiments in this manuscript were approved by the Massachusetts General Hospital or University of Massachusettes Institutional Animal Care and use Committee, and all relevant ethical regulations were followed.
Male C57BL/6J mice aged 12–16 weeks were purchased from The Jackson Laboratory (Bar Harbor, ME), and were administered chow (Prolab Isorpo RMH 3000 5p75) and water ad libitum. For diet-induced obesity (DIO) mice, male C57BL/6J mice aged 12–16 fed a high-fat diet (Reseach Diets D12492) or were purchased from The Jackson Laboratory, and maintained on their diet prior to experiments.
For adenoviral experiments, 2–4E9 PFUs of adenovirus were given via tail vein injection, and experiments were performed four days post injection, after which time mice were sacrificed. For each experiment, different conditions (i.e. LbNOX or Luciferase) were randomly divided among cagemates. Investigators were not blinded to the identity of mice, and sample sizes were not prespecified.
For gavage experiments, an oral gavage of 3.5 g/kg or equivalent H20 volume for controls was given at the start of the experiment, followed by a second gavage of half the initial dose one hour later. Plasma and liver tissue were harvested 6-hours after the initial dose under isoflurane anesthesia and immediately stored at −80°C (plasma) or flash frozen in liquid nitrogen (liver) until further processing, as described below.
For glucose tolerance tests, overnight fasted mice were given an intraperitoneal injection of 2g/kg of 20% glucose in saline. Blood glucose levels were subsequently measured using an Alphatrak 2 glucometer. For acute insulin experiments, DIO mice were fasted for 6 hours and then injected with 2U/kg insulin, with liver tissue harvested 15 minutes later under isoflurane anesthesia and flash frozen in liquid nitrogen before further analysis. For mouse experiments with Ndufs4 KO mice, liver and plasma were harvested from unfasted WT and KO littermates at age 48 days. For plasma αHB measurements in CFD versus HFD mice as well as QPCR of Foxo1 transcriptional targets, mice were fasted six hours prior to measurements.
Hyperinsulinemic-euglycemic clamp (Figures 5c, 5d, ED4 a–k).
Hyperinsulinemic-euglycemic clamps were conducted as previously described46. Briefly, survival surgery was performed at 5~6 days before clamp experiments to establish an indwelling catheter in jugular vein, which was used to inject 2E9 PFUs of viral vector 4 days prior to the clamp. On the day of clamp experiment, mice were fasted overnight (~17 hrs), and a 2-hr hyperinsulinemic-euglycemic clamp was conducted in conscious mice with a primed and continuous infusion of human insulin (150 mU/kg body weight priming followed by 2.5 mU/kg/min; Humulin, Eli Lilly, IN) . To maintain euglycemia, 20% glucose was infused at variable rates during clamps. Whole body glucose turnover was assessed with a continuous infusion of [3-3H]glucose (PerkinElmer, Waltham, MA), and 2-deoxy-D-[1-14C]glucose (2-[14C]DG) (PerkinElmer, Waltham, MA) was administered as a bolus (10 mCi) at 75 min after the start of clamps to measure insulin-stimulated glucose uptake in individual organs. At the end of the clamps, mice were anesthetized, and tissues were taken for biochemical analysis.
Glucose concentrations during clamps were analyzed using 5~10 μl plasma by a glucose oxidase method on Analox GM9 Analyser (Analox Instruments Ltd., London, UK). Plasma concentrations of [3-3H]glucose, 2-[14C]DG, and 3H2O were determined following deproteinization of plasma samples as previously described. For the determination of tissue 2-[14C]DG-6-Phosphate content, tissue samples were homogenized, and the supernatants were subjected to an ion-exchange column to separate 2-[14C]DG-6-P from 2-[14C]DG.
Rates of basal hepatic glucose production (HGP) and insulin-stimulated whole body glucose turnover were determined as previously described46. Insulin-stimulated rate of HGP was determined by subtracting the glucose infusion rate from whole body glucose turnover. Whole body glycolysis and glycogen plus lipid synthesis from glucose were calculated as previously described46. Insulin-stimulated glucose uptake in individual tissues was assessed by determining the tissue (e.g., skeletal muscle) content of 2-[14C]DG-6-phosphate and plasma 2-[14C]DG profile.
Metabolomics experiments
Media and Plasma metabolite measurements (Figures 1c,1d,1f, 2d,2e, 2f, 3d, 3e, 3f, 4d, 5a, 6b, 6d,6e, ED2a):
30 μl of media or plasma sample was mixed with 137 μl of ice-cold acetonitrile containing internal standards (13C6 -glucose, D3-lactate, 13C3-pyruvate, D3-αHB,13C2 -βHB, 13C3 -alanine & 13C3-serine) for metabolite extraction. Samples were vortexed and incubated on ice for 30 mins. After centrifugation for 20 mins at 4°C at 21,000 g, 75 μl of sample was transferred to an autosampler glass vial for LCMS analysis and 10 μl of sample was injected on Waters XBridge amide column (2.1×100 mm, 2.5μm, Part # 186006091). A pooled QC sample was prepared by mixing ~equal volume of each sample and injected every few samples to evaluate the analytical performance. Samples were injected in randomized order to avoid any run order effect. Calibration curves were prepared from 0.5 μmol/L to 400 μmol/L for pyruvate, αHB, βHB, alanine, serine, 8.32 μmol/L to 665.6 μmol/L for acetoacetate, 0.02 mmol/L to 16 mmol/L for glucose and lactate in surrogate matrix buffer. 4% w/v human serum albumin in PBS was used as surrogate matrix buffer. D3-α-HB was used as an internal standard for acetoacetate. The column oven temperature was 27°C and autosampler was 4C°, mobile phase A was 5/95 acetonitrile/water, 20 mM ammonium acetate, pH 9 (adjusted with ammonium hydroxide) and mobile phase B was acetonitrile. The LC gradient conditions at a flow rate of 0.220 mL/min were: 0 mins 85 %B, 0.5 min 85%B, 9 min 35%B, 11 min 2% B, 12min 2 % B, 13.5 min 85%B, 14.6 min 85%B ,15 min 85%B with 0.420 mL/min to 18 min. A Dionex Ultimate 3000 UHPLC system was coupled to Q-Exactive Plus Orbitrap mass spectrometer (Thermo Fisher Scientific, Waltham, MA) with HESI probe operating in polarity switching mode. MS parameters were: sheath gas flow 50 , aux gas flow 10 , sweep gas flow 2 , spray voltage 2.50kV in negative and 3.8kV in positive, capillary temperature 310°C, S-lens RF level −50 and aux gas heater temperature 370°C. Data acquisition was done using Xcalibur software (Thermo Scientific) in the range of 70–1000 m/z, resolution 70,000, AGC target 3e6 and maximum injection time of 80 ms. MS/MS and the retention time of each metabolite was matched against reference standard to confirm identities. Data analysis was done using the Tracefinder™ 4.1 with 5 ppm mass tolerance, and quality of integration for each chromatographic peak was reviewed.
Analysis of liver gluconeogenic intermediates (Figure ED 6h):
Using a method adapted from Lu et al 201847, snap-frozen liver tissue (~40 mg) was ground to a powder using a mortar and pestle on dry ice and extracted using 4/4/2 acetonitrile/methanol/water with 0.1 M formic acid (20 μL of solvent per mg of tissue), vortexed and neutralized with 15% ammonium bicarbonate (8.7 μL for the 100 μL of extraction solvent), sonicated for 1 min, and then subjected to 2 freeze-thaw cycles. Samples were incubated on ice for 20 minutes and then centrifuged at 21,000 g for 20 minutes at 4°C, at which point 300 μL (30 mg tissue) supernatant was mixed with 700 μL of water, frozen, and lyophilized overnight. Samples were re-suspended in 100 μL of 60/40 acetonitrile/water on the day of analysis.
Metabolite separation was performed using a Dionex Ultimate 3000 UHPLC system and ZIC-pHILIC column (150×2.1, 5μm, Merck KGa). Mobile phase A was 20 mM ammonium carbonate in water, pH 9.6 (adjusted with ammonium hydroxide) and mobile phase B was acetonitrile. The column was held at 40°C, injection volume was 5 μL and LC gradient conditions at flow rate of 0.3 mL/min were: 0 min: 80% B, 0.5 min : 80% B, 20.5 min: 20%B, 21.3 min : 20%B, 21.5 min : 80%B with 7.5 min of equilibration time. MS detection was done with a Q-Exactive Plus Orbitrap mass spectrometer (Thermo Fisher Scientific, Waltham, MA) with HESI probe operating in switch polarity mode. MS parameters were: sheath gas flow 50, aux gas flow 12 , sweep gas flow 2, spray voltage 2.80 for negative (3.50 for positive), capillary temperature 320°C, S-lens RF level −50 and Aux gas heater temperature 380°C. Data acquisition was done using Xcalibur software (Thermo Scientific) and performed in full scan mode with range of 70–1000 m/z , resolution 70,000, AGC target 1e6 and maximum Injection time of 80 ms. Data analysis was performed as described above.
Liver NAD(P)(H) analysis (Figure 3b, ED 7a–f):
Ground liver samples were extracted with 4/4/2 acetonitrile/methanol/water with 0.1M formic acid as described earlier and 5 μL of supernatant was injected on ZIC-pHILIC column. The column temperature was maintained at 27°C and mobile phase composition was as above. Chromatography gradient was slightly modified as: flow rate was 0.15 mL/min, 0 min: 80% B, 0.5 min: 80% B, 20.5 min: 20% B, 21.3 min: 20%B, 21.5 min: 80% B with 7.5 min of column equilibration time.
Liver αHB analysis (Figure 3c, ED 2a):
Liver samples were extracted with D3-α-HB internal standard as described in the gluconeogenic intermediate analysis and analyzed on the amide column as described in the media and plasma analysis.
Sugar analysis by gas chromatography-mass spectrometry (GC-MS) (Figure 6b, Mannose):
For mannose quantification (Figure 6b), we employed GC-MS rather than LC-MS to separate mannose, glucose, galactose, and fructose isomers and quantify them in mouse plasma samples. Briefly, 20 μL of plasma sample was extracted with 120 μL of methanol containing 0.83 mM of 13C3-glucose, 4.16 μM of 13C6- mannose. Samples were vortexed, incubated on ice for 20 mins, centrifuged at 21,000g at 4°C for 20 mins, and the supernatant was collected. 110 μL of supernatant was transferred to a glass GCMS vial and dried down using nitrogen gas. Calibration standards were prepared from 0.5–400 μM/L for fructose, mannose, galactose and from 0.02mM −16mM for glucose in surrogate matrix buffer. We used a two step derivatization procedure as described48: First, methoxyamination was performed by adding 50 μL of methoxyamine hydrochloride (20 mg/mL in pyrimidine) to the dried samples and incubating at 30 °C for 90 minutes. Then, silylation was carried out by adding 80 μL of MSTFA(N-Methyl-N-trimethylsilyltrifluoroacetamide) plus 1% TMCS(2,2,2-Trifluoro-N-methyl-N-(trimethylsilyl)-acetamide, Chlorotrimethylsilane) and incubating at 70°C for 60 mins. Derivatized samples were cooled down to room temperature before injection. A TriPlus RSH autosampler (Thermo Scientific) was used to inject 1 μL of derivatized sample into a split/splitless(SSL) injector at 250°C using 1:50 split flow on TRACE 1310 GC system (Thermo Scientific). Metabolites were separated using a ZB-5MSi GC column (30m x 0.25mm x 0.25 μm; Phenomenex). Helium was used as carrier gas at flow rate of 1 mL/min. The GC oven program was started at 60°C and held for 1-minute, increased to 320°C at a rate of 10°C/min, and kept at 320°C for 5 minutes. The eluted peaks were transferred through an auxiliary transfer temperature of 300°C into electron ionization (EI) source (at 70ev energy) of the Q-Exactive GC mass spectrometer (Thermo Scientific). High resolution EI fragmentation spectra were acquired using 60,000 resolution with mass range of 50–750 m/z. The AGC target was 1e6 and maximum injection time was automatic. Data acquisition and analysis was done using Tracefinder™ 4.1 with 10 ppm mass tolerance and quality of integration for each chromatographic peak was reviewed.
Lipidomics measurements (Figure 6b, ED5a–b) :
Lipids were profiled using a Shimadzu Nexera X2 U-HPLC (Shimadzu Corp.; Marlborough, MA) coupled to an Exactive Plus Orbitrap mass spectrometer (Thermo Fisher Scientific; Waltham, MA). Briefly, liver tissues (17.0–27.5 mg) were homogenized in four volumes of water (4 μL/mg of tissue) using a bead mill (TissueLyser II; Qiagen Inc.; Valencia CA). Lipids were extracted from aqueous homogenates (10 μL) using 190 μL of isopropanol containing 1,2-didodecanoyl-sn-glycero-3-phosphocholine (Avanti Polar Lipids; Alabaster, AL). After centrifugation, supernatants were injected directly onto a 100 × 2.1 mm, 1.7 μm ACQUITY BEH C8 column (Waters; Milford, MA). The column was eluted isocratically with 80% mobile phase A (95:5:0.1 vol/vol/vol 10mM ammonium acetate/methanol/formic acid) for 1 minute, followed by a linear gradient to 80% mobile-phase B (99.9:0.1 vol/vol methanol/formic acid) over 2 minutes, a linear gradient to 100% mobile phase B over 7 minutes, then 3 minutes at 100% mobile-phase B. MS analyses were carried out using electrospray ionization in the positive ion mode using full scan analysis over 200–1100 m/z at 70,000 resolution and 3 Hz data acquisition rate. Other MS settings were: sheath gas 50, in source CID 5 eV, sweep gas 5, spray voltage 3 kV, capillary temperature 300°C, S-lens RF 60, heater temperature 300°C, microscans 1, automatic gain control target 1e6, and maximum ion time 100 ms. Raw data were processed using TraceFinder 3.3 software (Thermo Fisher Scientific; Waltham, MA) and Progenesis QI (Nonlinear Dynamics; Newcastle upon Tyne, UK). Lipid identities were denoted by total acyl carbon number and total number of double bond number.
Real time quantitative PCR [Figures ED6d, ED6g]
RNA was isolated using a Qiagen RNAeasy kit (Qiagen) and reverse transcribed using the SuperScript III First-Strand Synthesis System (Invitrogen). qPCR was performed using an Applied Biosystems 7500 Fast Real-Time PCR system, using the following primers from Thermo Fisher Scientific: G6Pc (Mm00839363_m), Pepck1 (Mm01247058_m1), PC (Mm00500992_m1). Hprt (Mm03024075_m1) was used as an internal control.
Western blotting
Antibody identities and suppliers are available in the reporting summary.
For western blots in Figures 1, 3, and 4, after blotting with primary antibodies membranes were blotted with HRP-conjugated secondary antibodies and developed with a chemiluminescent substrate (Western Lightning Plus-ECL, PerkinElmer). For remaining western blots, after blotting with primary antibodies membranes were blotted with IRDye 800CW-conjugated secondary antibodies (Licor), and scanned on a Typhoon bioimager (Amserham). Gels were not reprobed, and each gel band shown is either a different slice from the same gel for bands with different molecular weights, or a separate gel run with the same lysate for those of similar or identical (e.g. AKT) molecular weights.
Analysis of NADH/NAD+ sensitive analytes
Metabolites in Figure 1f were identified as “NADH/NAD+-sensitive” if the metabolite abundance was significantly different in both the Luciferase+Ethanol and LbNOX conditions for a Bonferroni-corrected α of 0.05 using paired two-tailed Student’s T-test, and the direction of the changes in metabolite between these two conditions were opposite.
For in vivo experiments, we defined a plasma metabolite as “NADH/NAD+ sensitive” from the Figure 3 experiment if it met all of the following criteria: (i) p < 0.1 for two-tailed Student’s T test between Luciferase and Luciferase + EtOH group, (ii) p < 0.1 for two-tailed Student’s T test between Luciferase+ EtOH and LbNOX + EtOH group, (iii) the direction of the changes between these two conditions were opposite.
For the enrichment analysis in Extended Data 3B, we first determined the redox sensitivity of all metabolites reported in the Rhee et al study that we could detect on our metabolomics analysis (156, of which 59 were NADH/NAD+ sensitive). Next, to select independent loci with at least one genome-wide significant (p < 5e-8) metabolite association in Rhee et al.5 (Table S2), we clumped all SNPs using the minimum p-value reported for each SNP, the HapMap CEU reference panel (release 23)49, and PLINK (v1.9, with options: --clump-p1 5e-8 --clump-p2 0.001 --clump-r2 0.5 --clump-kb 250)50. This resulted in 123 independent loci. Next, for each of the 123 loci, we identified all metabolites that are suggestively associated (p < 1e-5) with the lead SNP for that locus, and then performed a one-tailed Fisher’s exact test to assess the significance of overlap between these metabolites and the redox sensitive metabolites identified above.
Table of GCKR-associated traits
Supplementary Table 1 was compiled through a combination of manual literature review, the NHGRI-EBI Cataolog (https://www.ebi.ac.uk/gwas/), snipa (http://snipa.helmholtz-muenchen.de/snipa3/), and snpedia.com.
Statistics and Reproducibility
All data are expressed as mean +/− standard error of mean (s.e.m). All reported sample sizes (n) represent a biologically independent experiment, defined as follows: For all primary hepatocyte data except peredox experiments (Figure 1e), this was an independent hepatocyte isolation (i.e. hepatocytes isolated from a separate mouse) within each experimental condition. For the peredox experiment, this represents measurements from different individual cells. For in vivo experiments, this represents data from a distinct mouse. For Hela cell culture experiments, this represents cells seeded on different days within an experimental group. All attempts at replication were successful.
Paired Student’s T-tests were used to compare independent hepatocyte isolations divided into experimental groups (e.g. LbNOX or luciferase) to account for the significant metabolic variability between isolations from individual mice. All other Student’s t tests were unpaired. For multiple T tests within an experiment, results were considered significant using a Bonferonni-adjusted α=0.05/n, where n was the number of tests. For ANOVA calculations, a result was considered significant for p < 0.05 using a post-hoc Tukey’s test.
Extended Data
Extended data 1 -. The effects of LbNOX expression in primary hepatocytes.
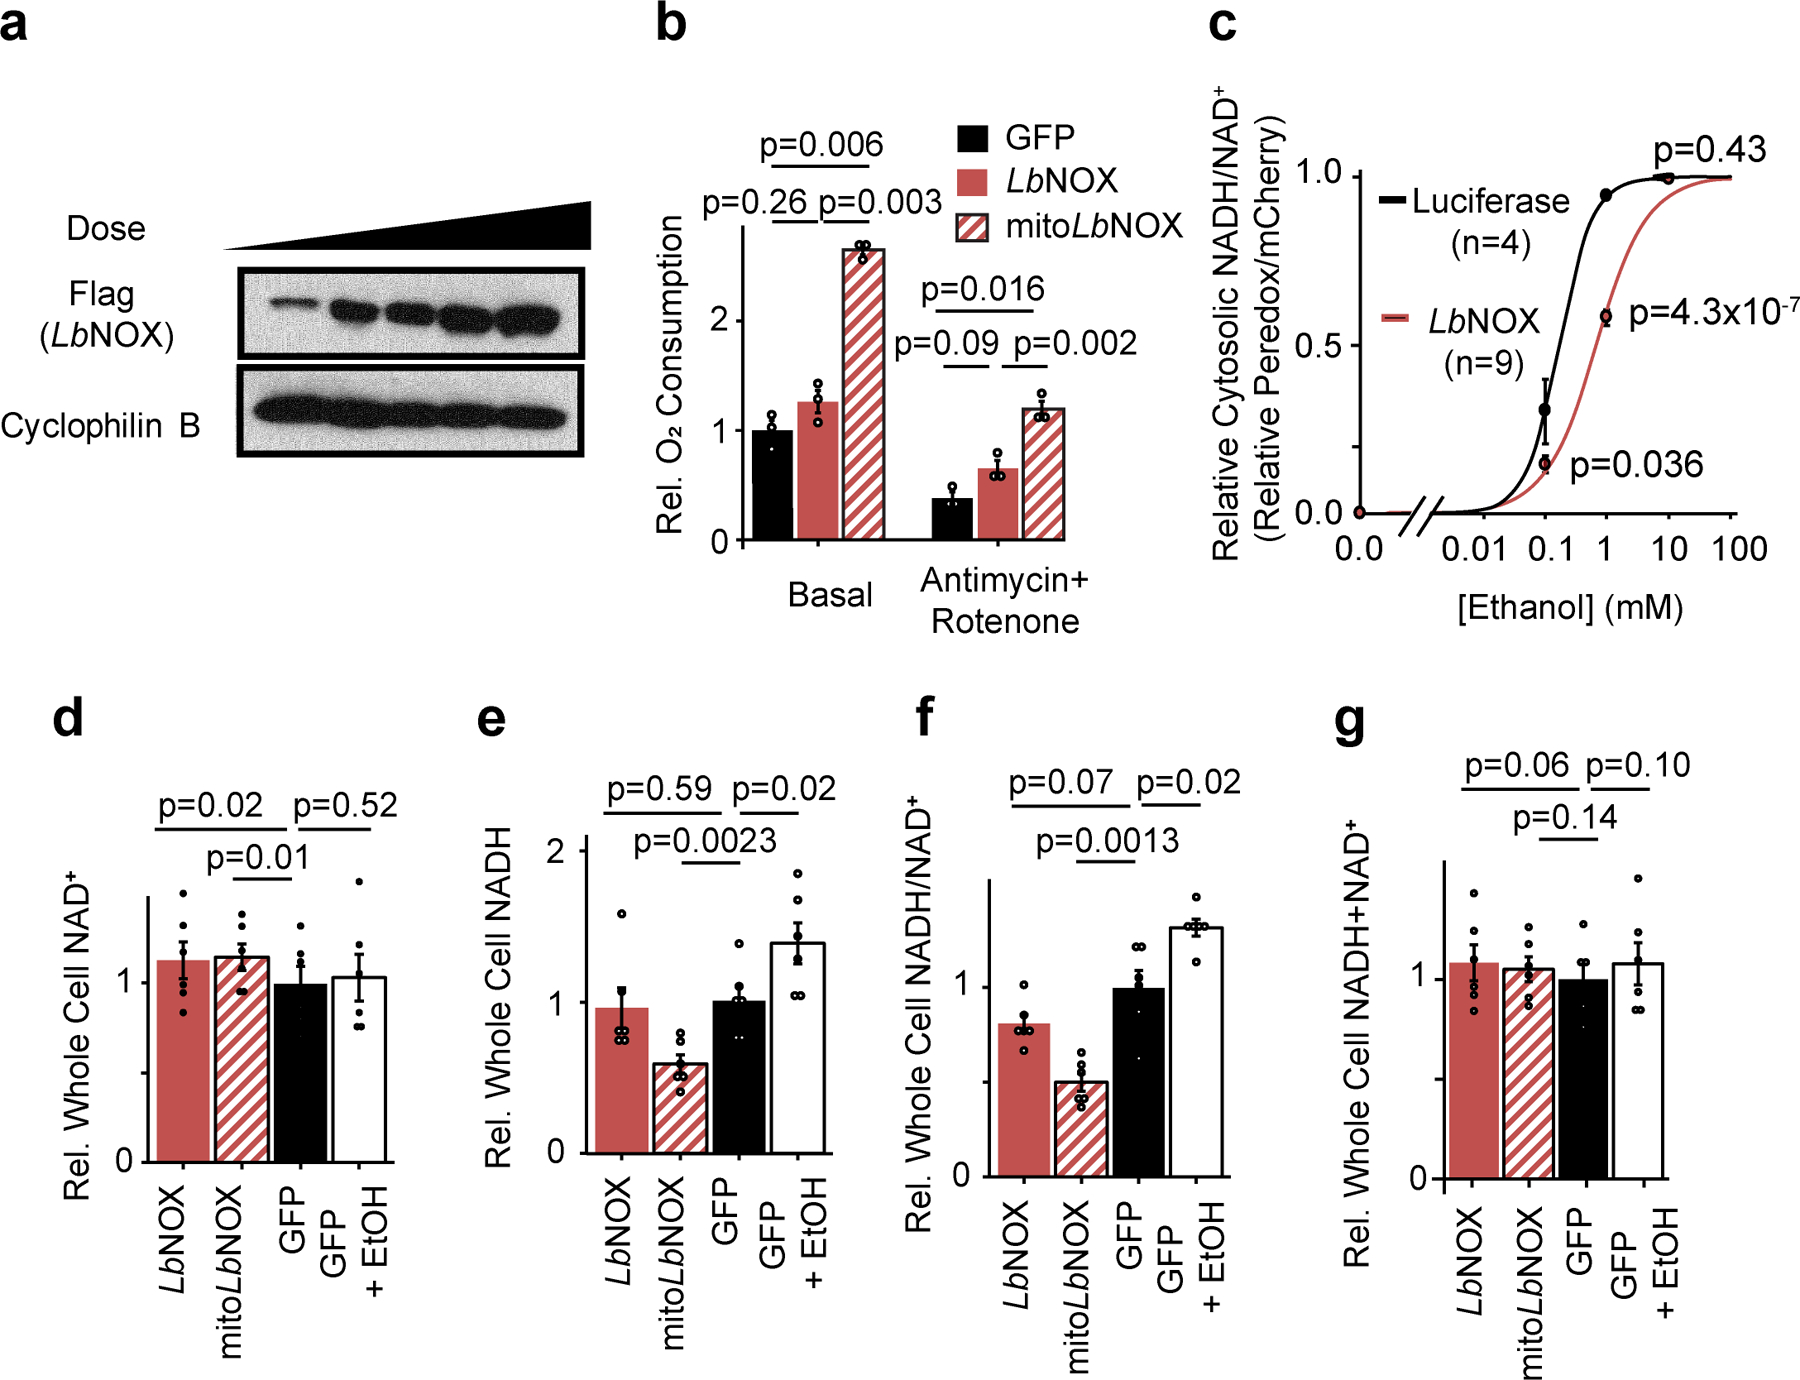
(b) Dose-dependent adenovirus-mediated expression of LbNOX in primary hepatocytes at 24 hours. Representative western from two independent experiments (b) Effect of LbNOX on free cytosolic NADH/NAD+ as measured by peredox with increasing alcohol concentrations. (c) Effect on basal or antimycin+rotenone insensitive respiration with LbNOX or mitoLbNOX. n=3. (d) whole cell NAD+; (e) NADH; (f) NADH/NAD+, and (g) NADH+NAD+. n=6 independent hepatocyte isolations. Nominal p values were determined using paired two-sided Student’sT tests between hepatocyte isolations (c-g), or unpaired two-sided Student’s T test for peredox experiments (b).
Extended data 2 -. Nicotinamide riboside and LbNOX have distinct effects on pyridine dinucleotide pool sizes and redox ratios.
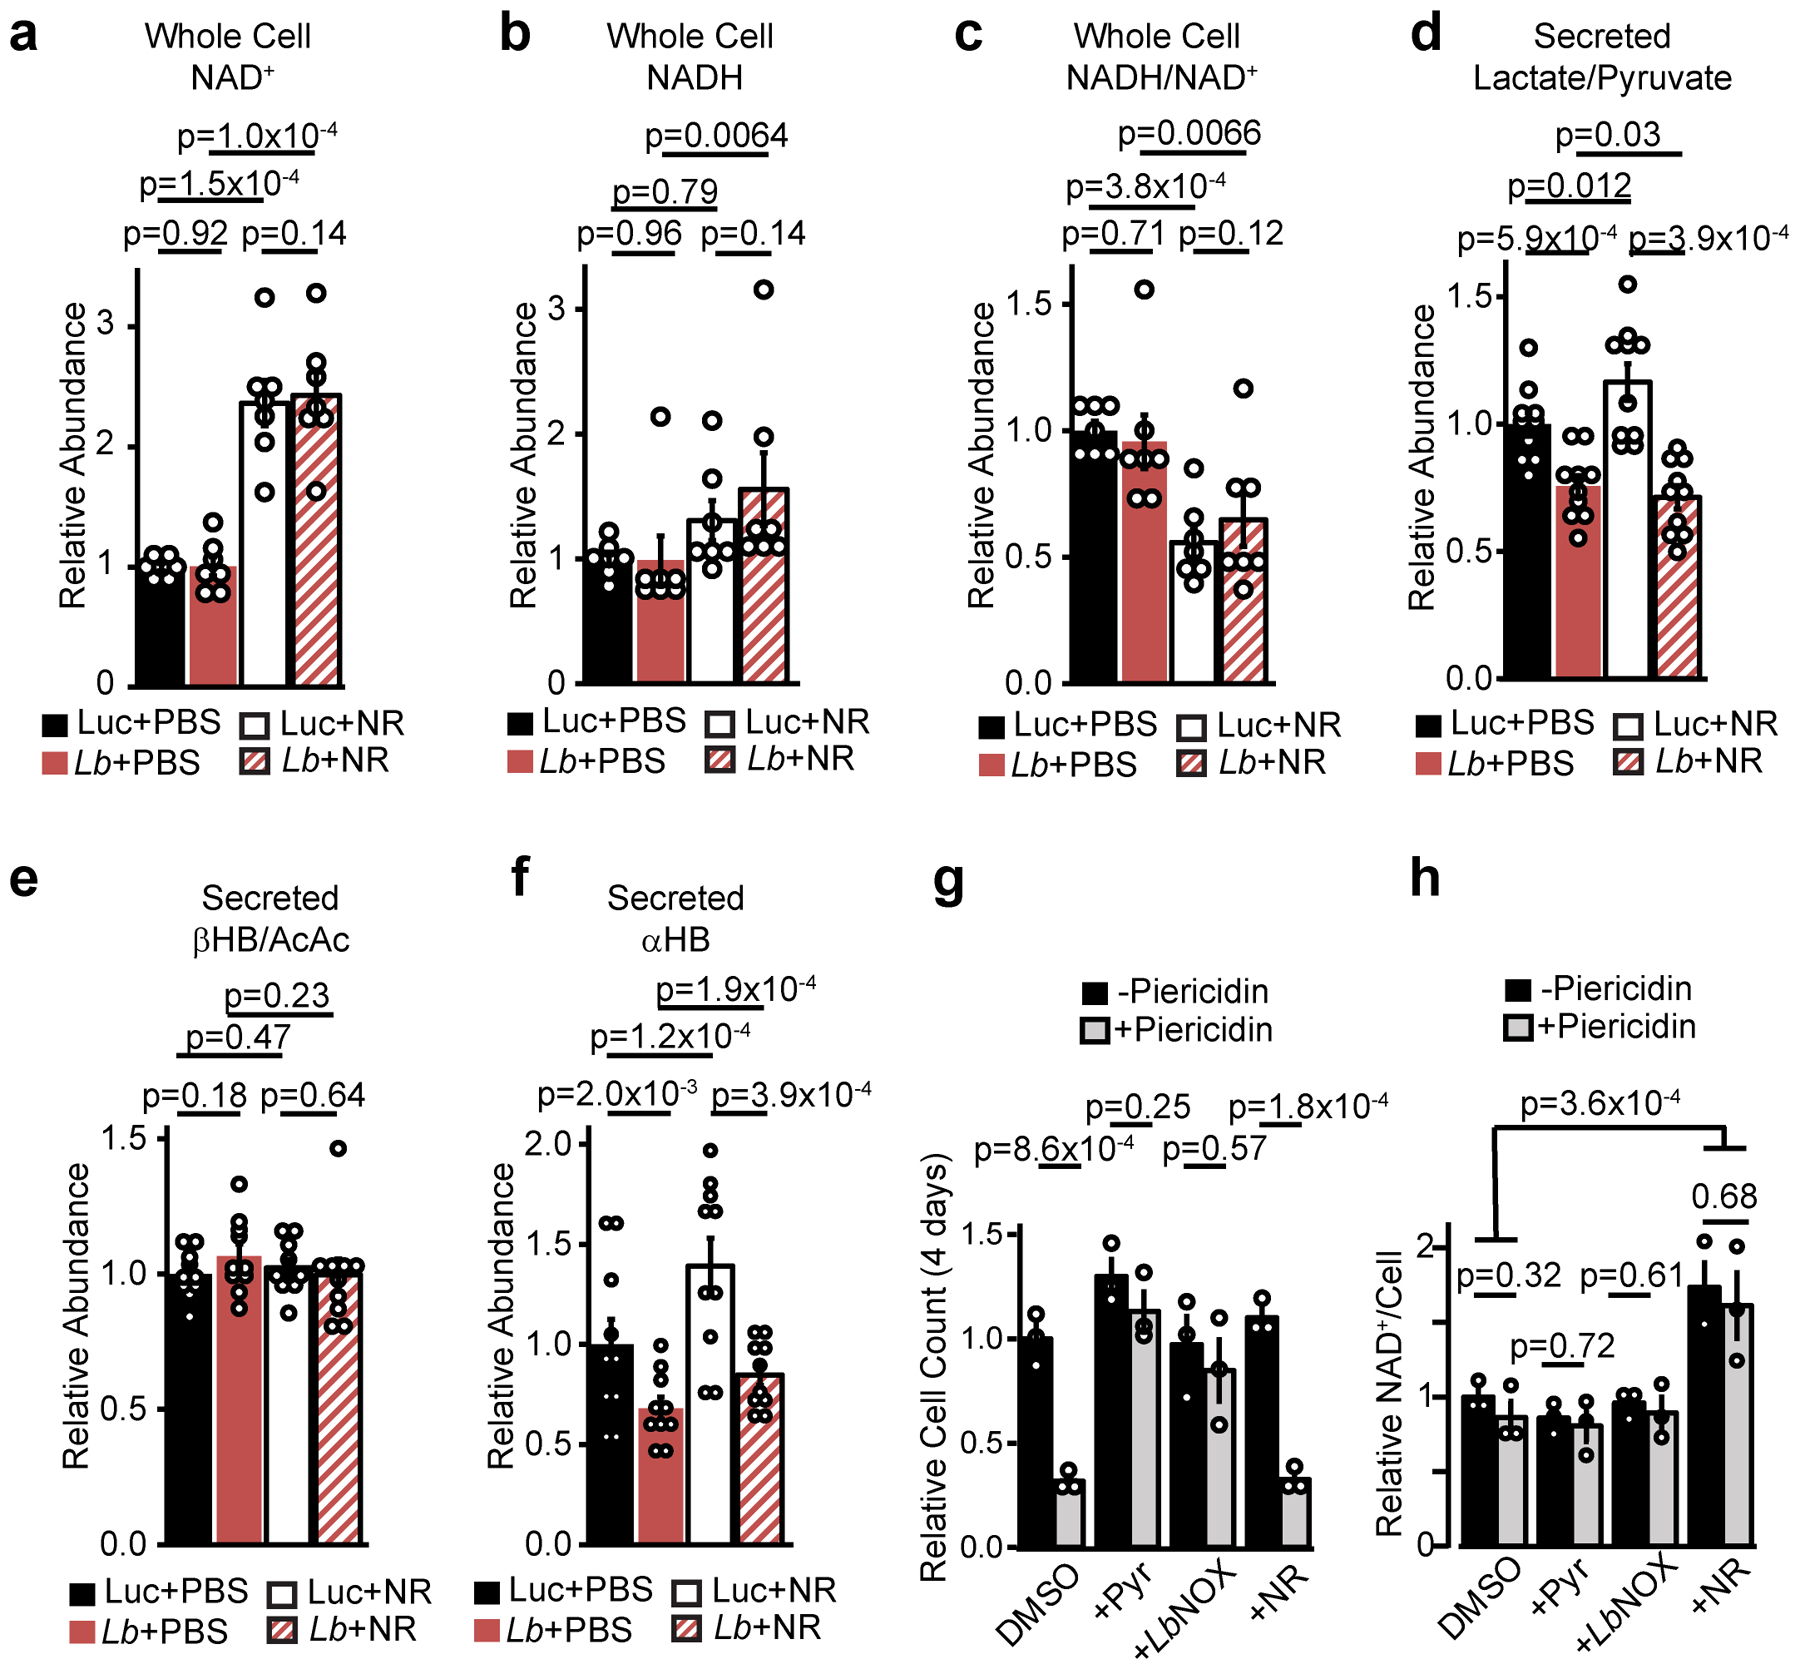
Relative total cellular (a) NAD+, (b) NADH, (c) NADH/NAD+, secreted (d) lactate/pyruvate, (e) β−hydroxybutyrate/Acetoacetate (βHB/AcAc), and (f) αHB in primary hepatocytes with or without NR supplementation and LbNOX. (g) Effect of pyruvate, LbNOX expression, or NR on the inhibition of Hela cell proliferation and total NAD+ levels (h) by piericidin 4 days after seeding. Data are mean ± s.e.m from n=7 (a-c) or 10 (d-f) independent hepatocyte isolation, or 3 independent Hela cell experiments (g-h). Nominal p values were determined using paired (between hepatocyte isolations, a-f) or unpaired (Hela cells, g-h) two-sided Student’s T tests.
Extended data 3 -. αHB and hepatic NADH/NAD+ are elevated in the Ndufs4 KO mouse model of mitochondrial disease.
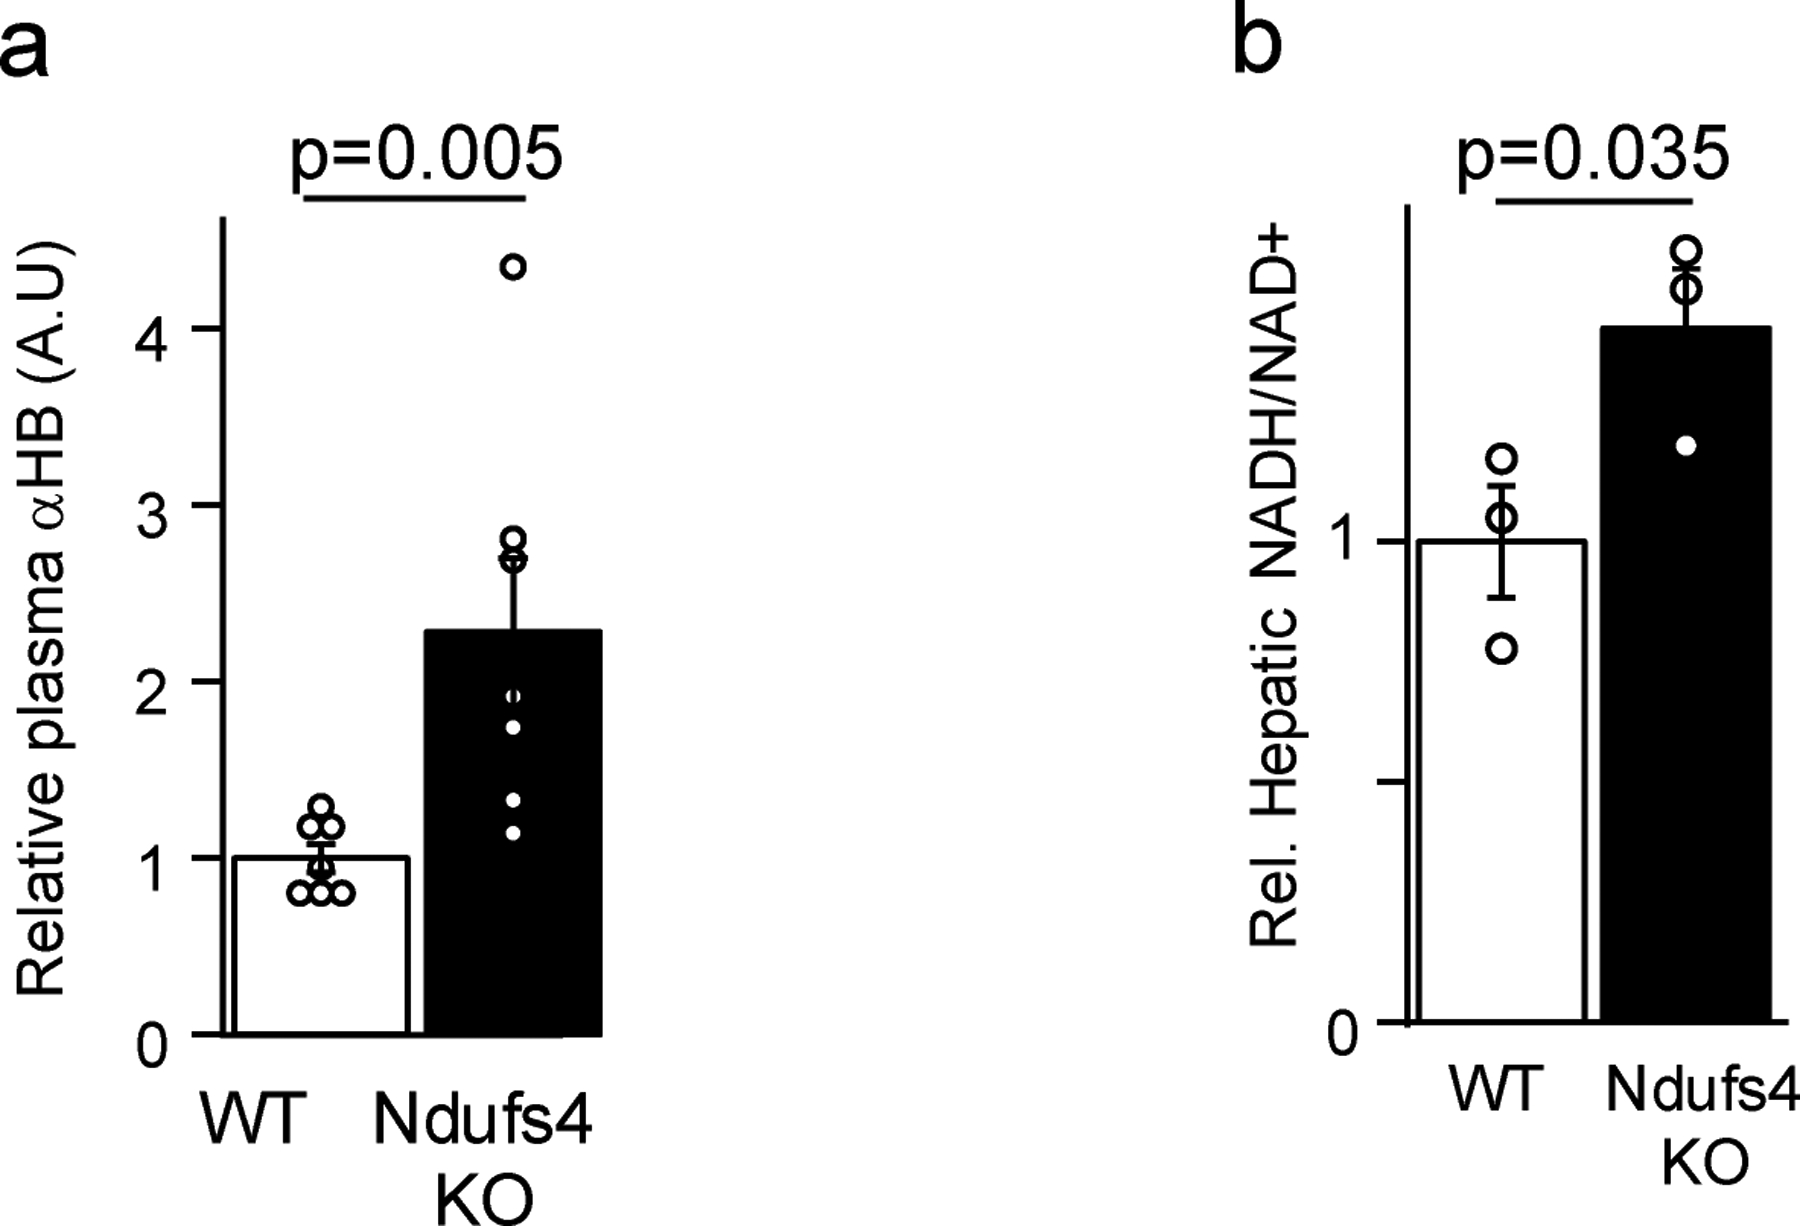
(a) Plasma αHB, (b) hepatic NADH/NAD+. n = 3 mice each group for NADH/NAD+ measurements, 7 mice for αHB measurements. Data are mean ± s.e.m. p values were determined using one-sided Student’s T test.
Extended data 4 -. A common GCKR variant increases hepatic cytosolic NADH reductive stress.
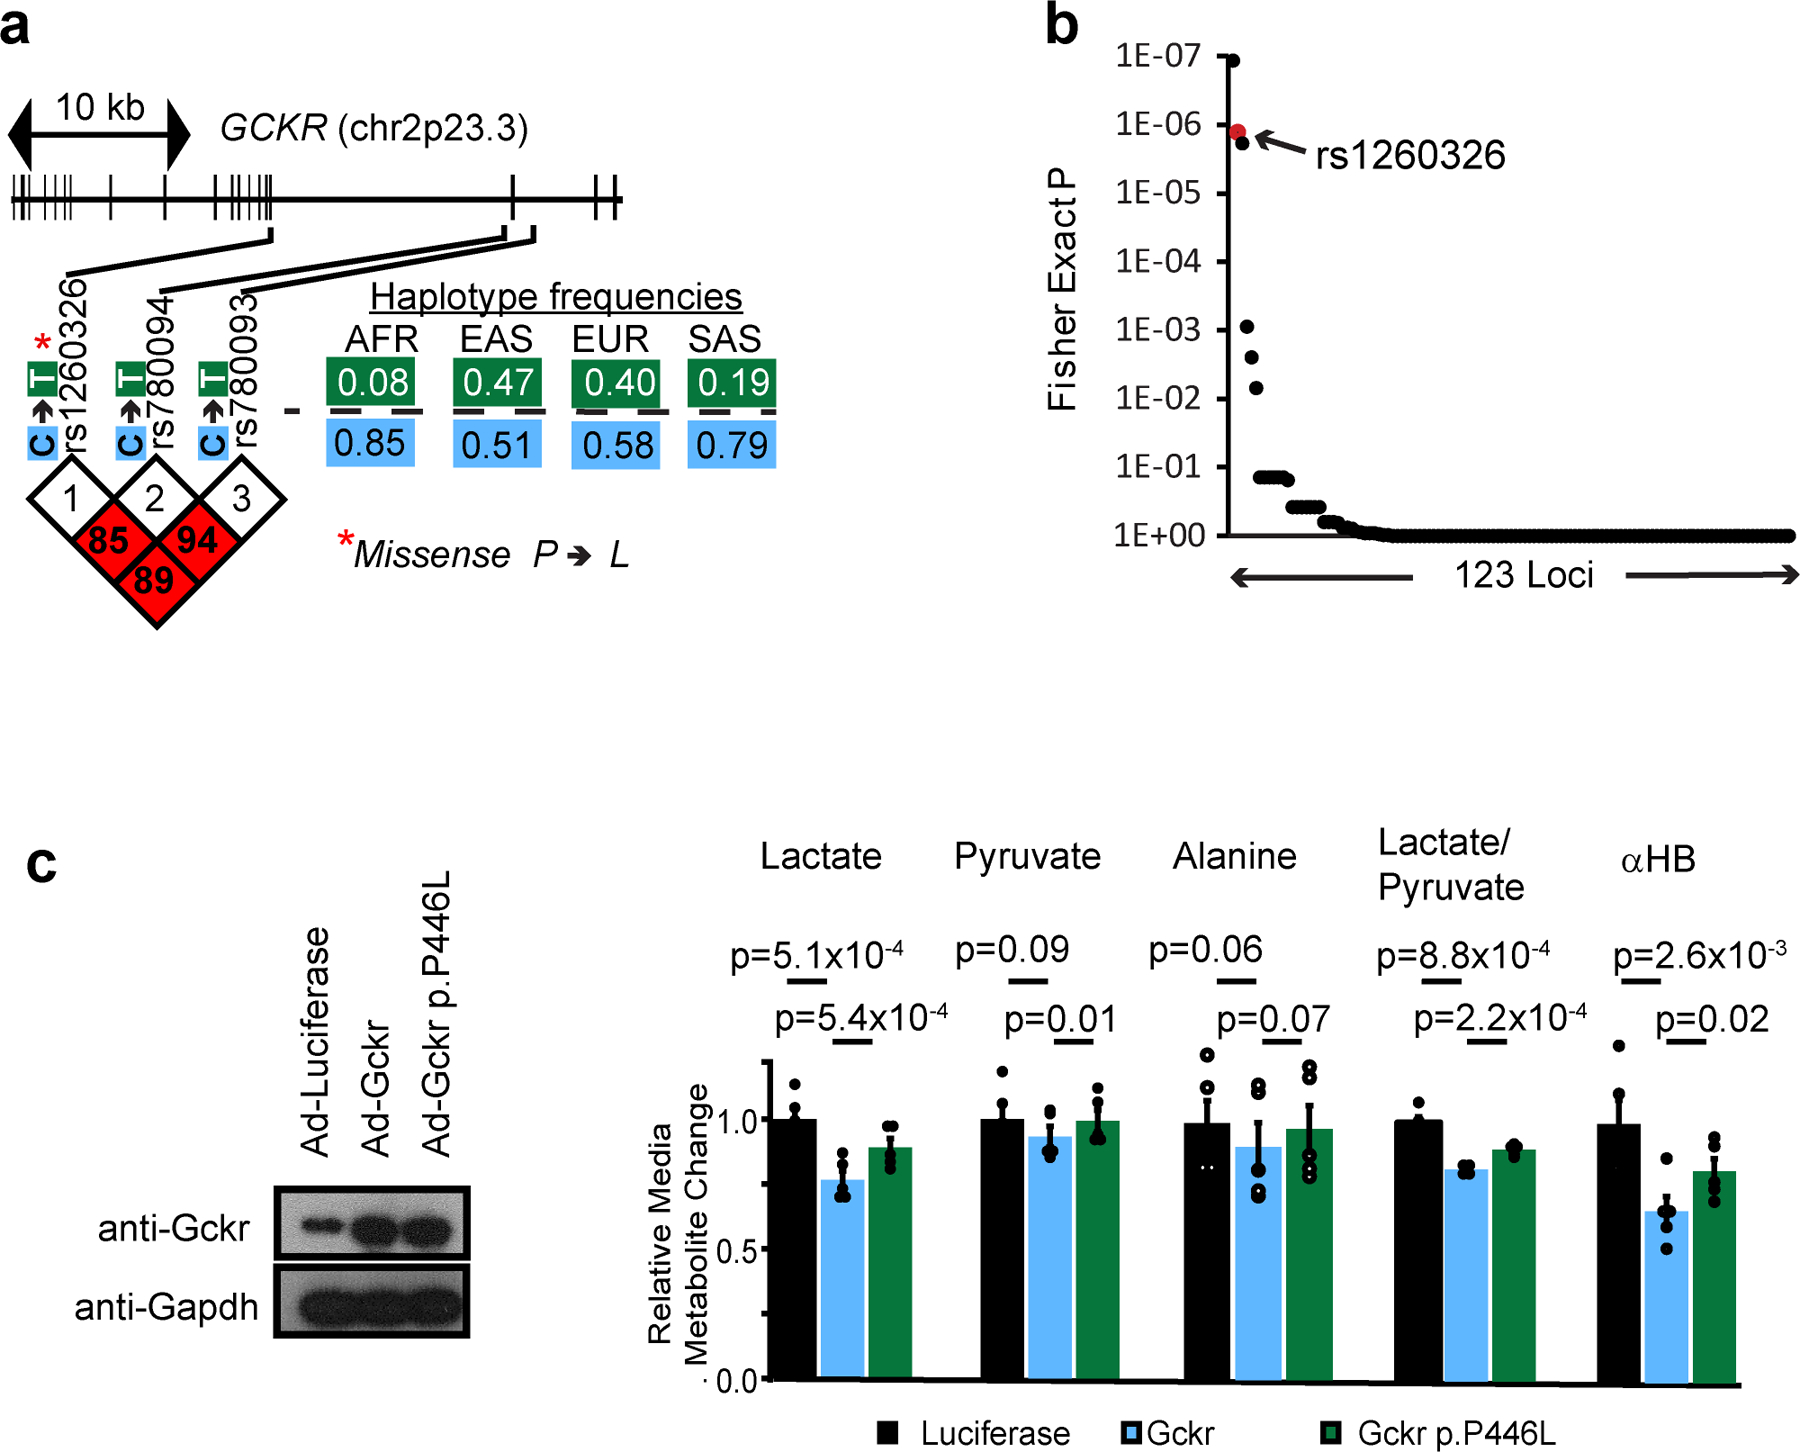
(a) Gene structure, variant location, variant LD blocks, and haplotype frequency for risk haplotype of GCKR from the 1000 Genomes Project45. AFR, Africa; EAS, East Asian; EUR, European; SAS, South Asian (b) Enrichment of redox sensitive metabolites in reported metabolite associations by loci from Rhee et al 2013. p values were determined from one-tailed Fisher’s exact test as described in Methods. (c) Effects of overexpression of Gckr or Gckr p.P446L in mouse primary hepatocytes. Data are mean ± s.e.m. Nominal p values were determined using paired two-sided Student’s T tests between n=5 independent hepatocyte isolations.
Extended data 5 -. Effects of LbNOX expression on metabolic parameters during hyperinsulinemic-euglycemic clamp.
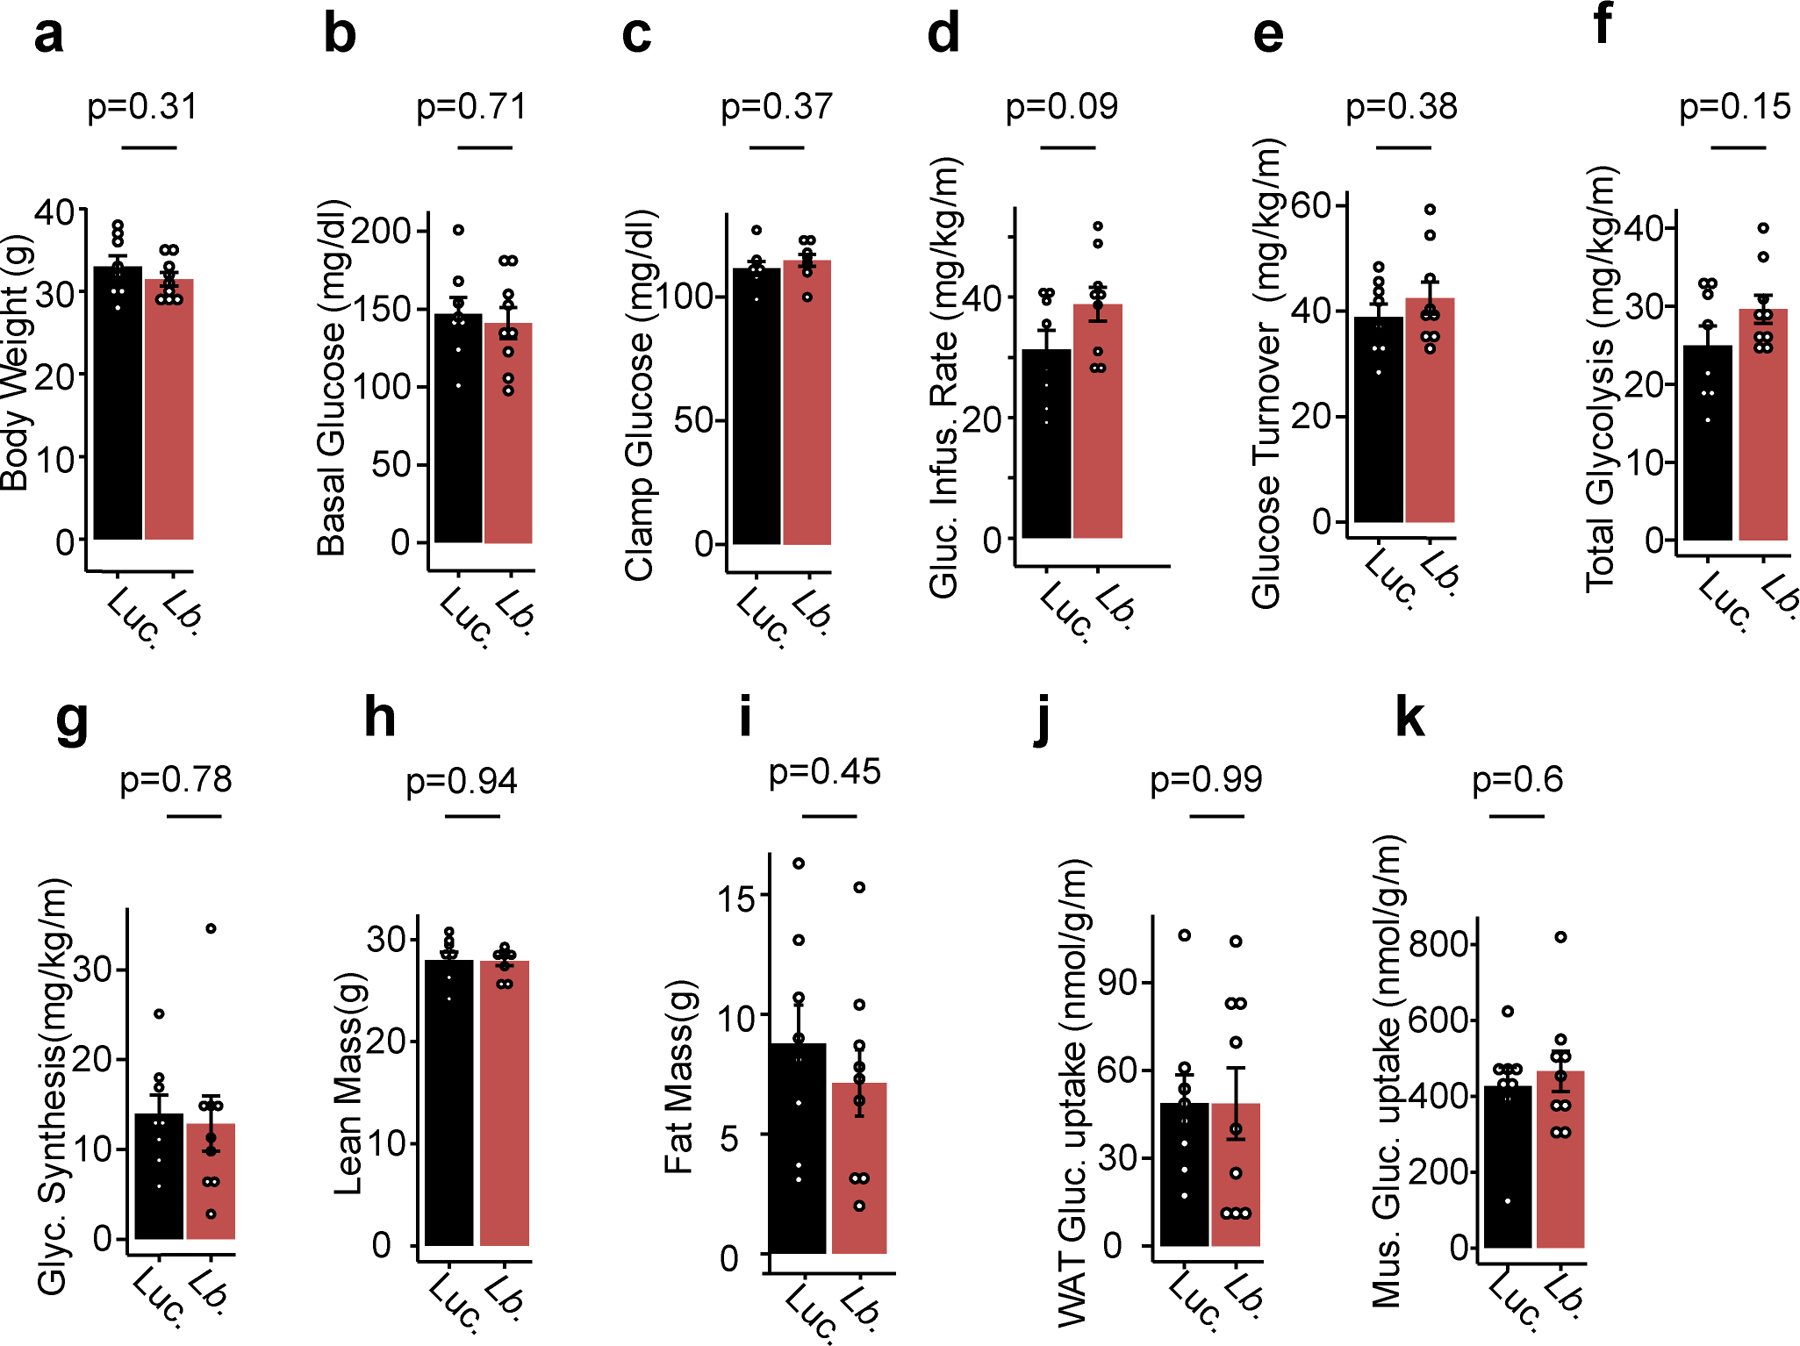
Effects of LbNOX expression in HFD-fed mice using a 2.5 mU/min/kg insulin infusion during hyperinsulinemic-euglycemic clamp on (a) body weight, (b) basal glucose, (c) clamp glucose levels, (d) glucose infusion rate, (e) whole body glucose turnover, (f) whole body glycolysis, (g) whole body glycogen synthesis, (h) lean mass, (i) fat mass, (j) white adipose tissue (WAT) glucose uptake, and (k) skeletal muscle glucose uptake. p values were determined using two-sided Student’s T test. Data are reported as mean±SEM from n=8 (luciferase) or n=9 (LbNOX) mice.
Extended data 6 -. Hepatic diacylglycerols and ceramides in DIO mice with LbNOX expression.
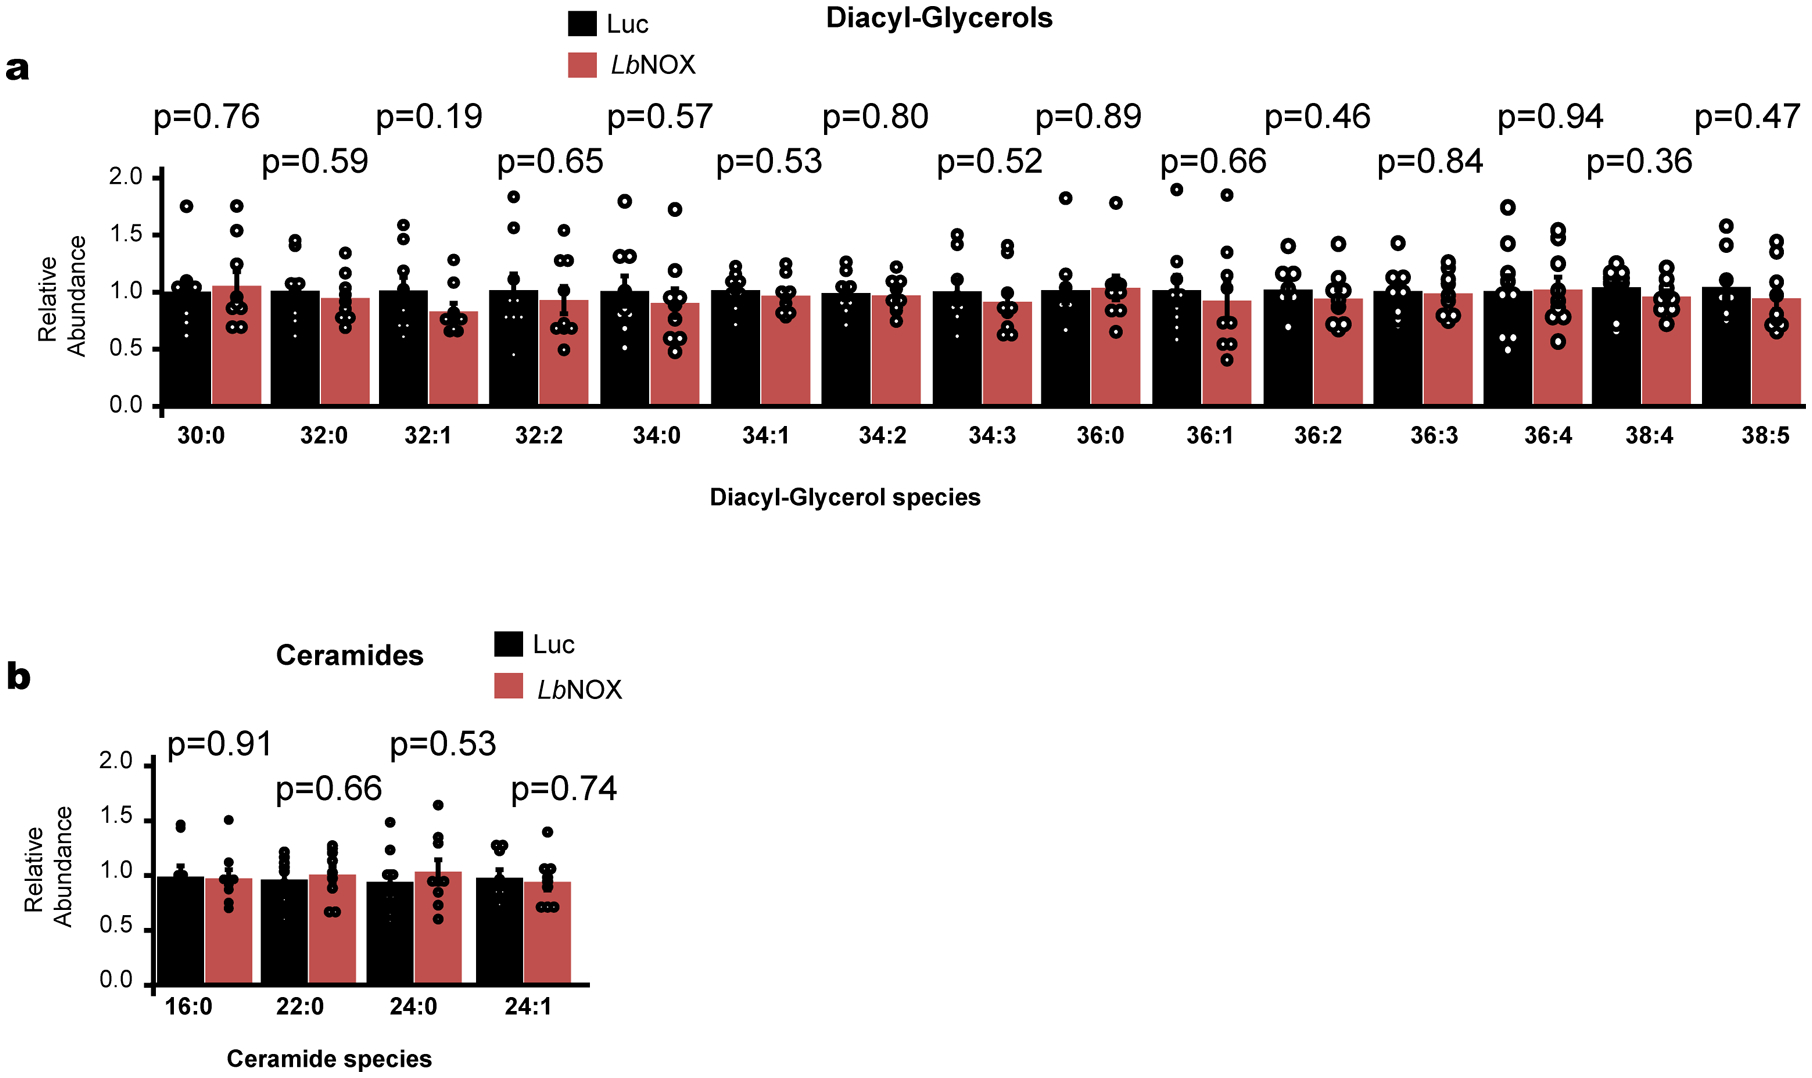
Effect of LbNOX expression of hepatic diacylglycerol and ceramide content in DIO mice. Data are reported as mean±SEM from n=9 mice. p values were determined using two-sided Student’s T test.
Extended data 7 -. LbNOX improves hepatic insulin resistance in vivo independent of hepatic insulin signaling.
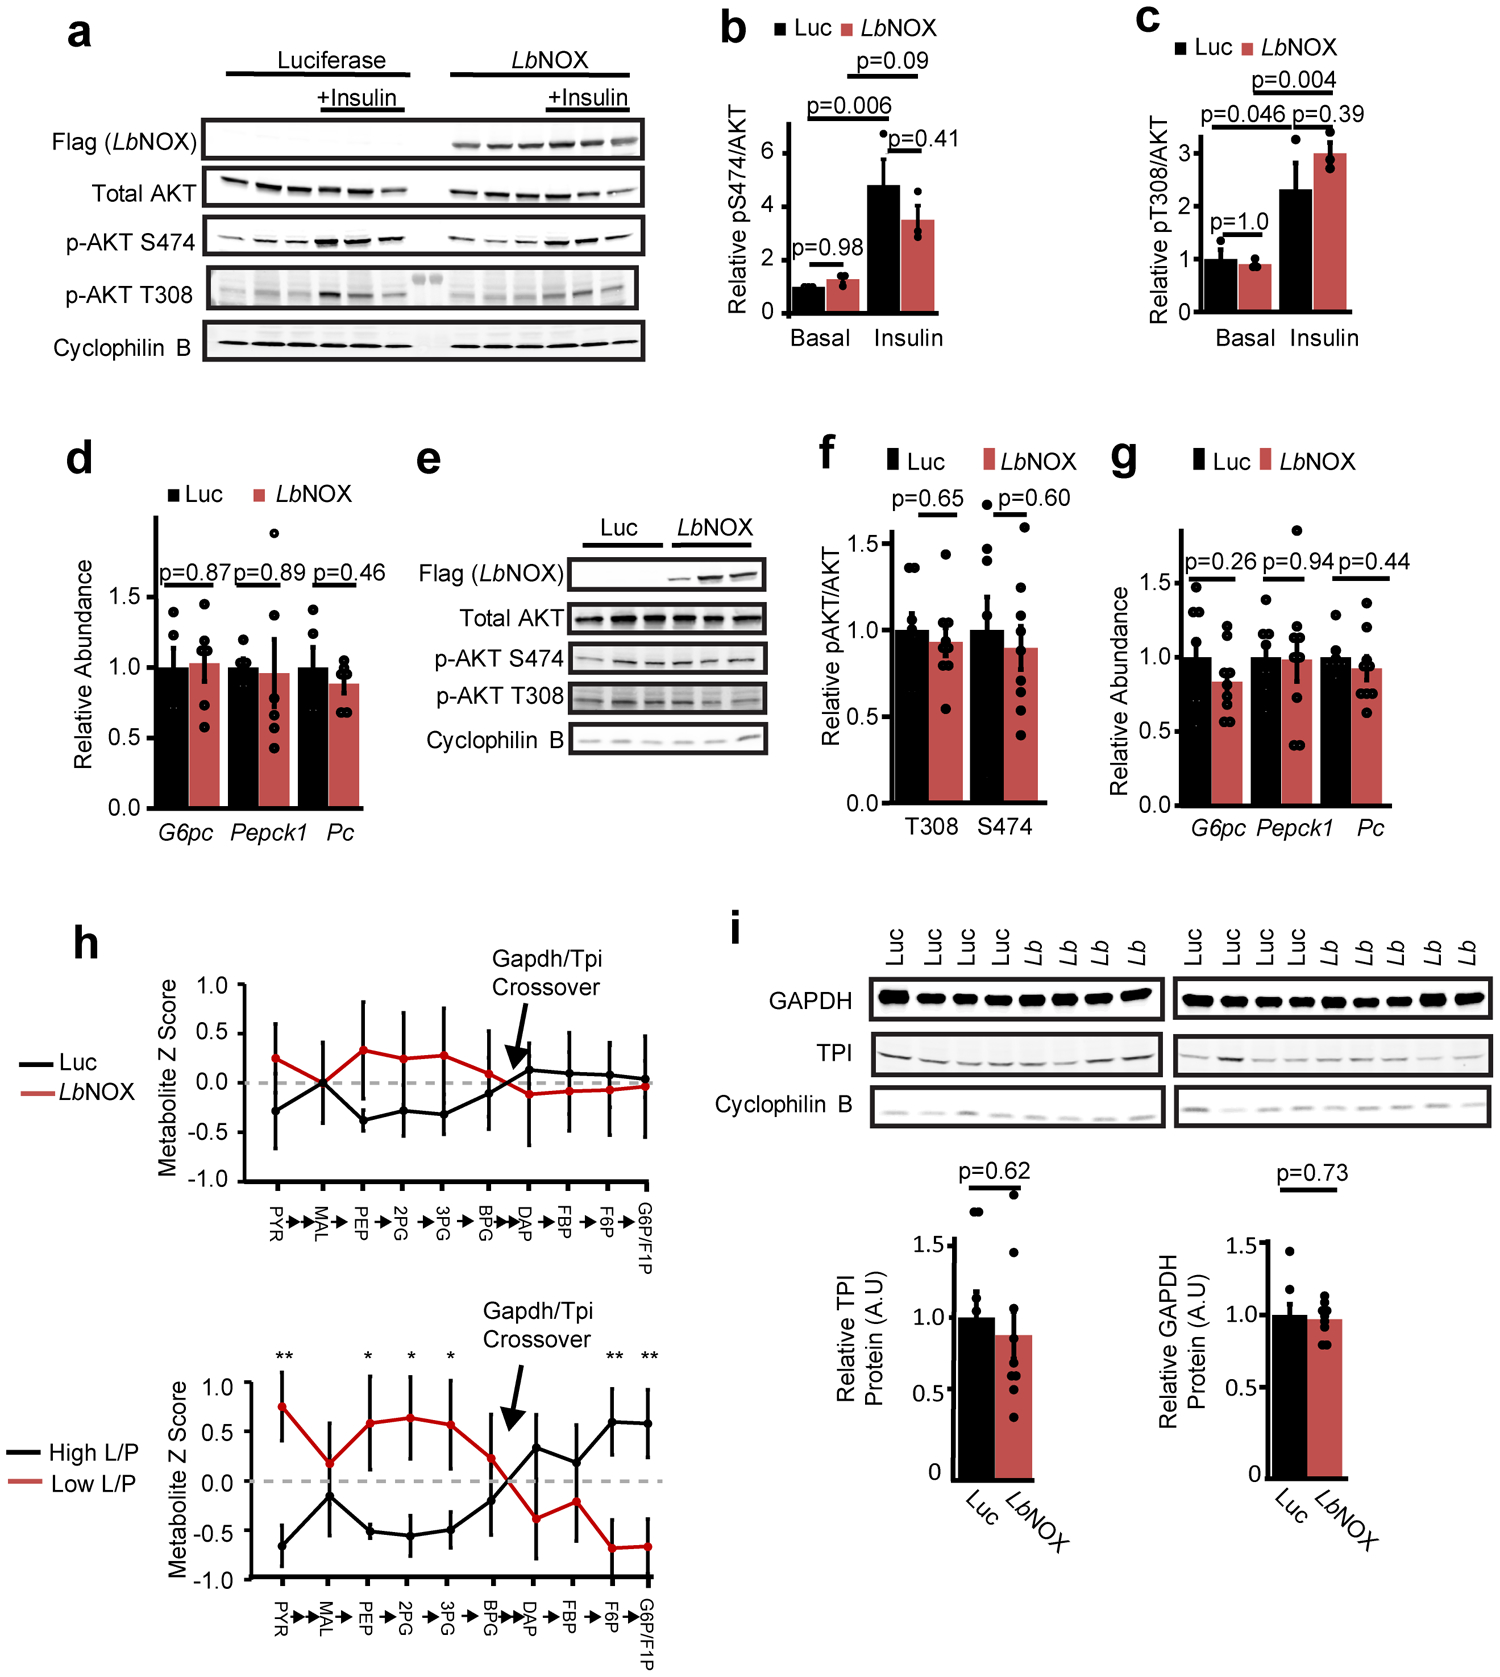
(a) Western blots of liver lysate from DIO mice 15 minutes after an i.p. injection of saline or 2 U/kg insulin with relative pS474 Akt/total Akt (b) and pT308 Akt/total Akt (c), n=3 from representative western from two independent experiments. (d) Transcriptional Foxo1 targets G6pc, Pepck1, and PC in DIO mice with LbNOX or luciferase, n=6. (e) Western blots of liver lysates at the end of hyperinsulinemic-eugylcemic clamps, n=3 representative of n=8 (Luciferase) and 9 (LbNOX) with (f) relative pS474 Akt/total Akt and pT308 Akt/total Akt (g) transcriptional Foxo1 targets G6pc, Pepck1, and Pc. n=8 (Luciferase), 9 (LbNOX). (h) Crossover analysis of relative abundance of gluconeogenic intermediates at end of hyperinsulinemic-euglycemic clamps. In the top panel, LbNOX vs. luciferase mice are compared. In the bottom panel, samples are divided by high or low liver lactate/pyruvate ratios and compared. (i) Relative protein levels of Gapdh and TPI at the end of the insulin clamp.n=8 (Luciferase), 9 (LbNOX). *, **, = p < 0.05, 0.01, using two-sided Student’s T test. Data are reported as mean±SEM.
Extended data 8 -. NAD(P)(H) levels in LbNOX versus Luciferase livers at end of hyperinsulinemic-euglycemic clamps.
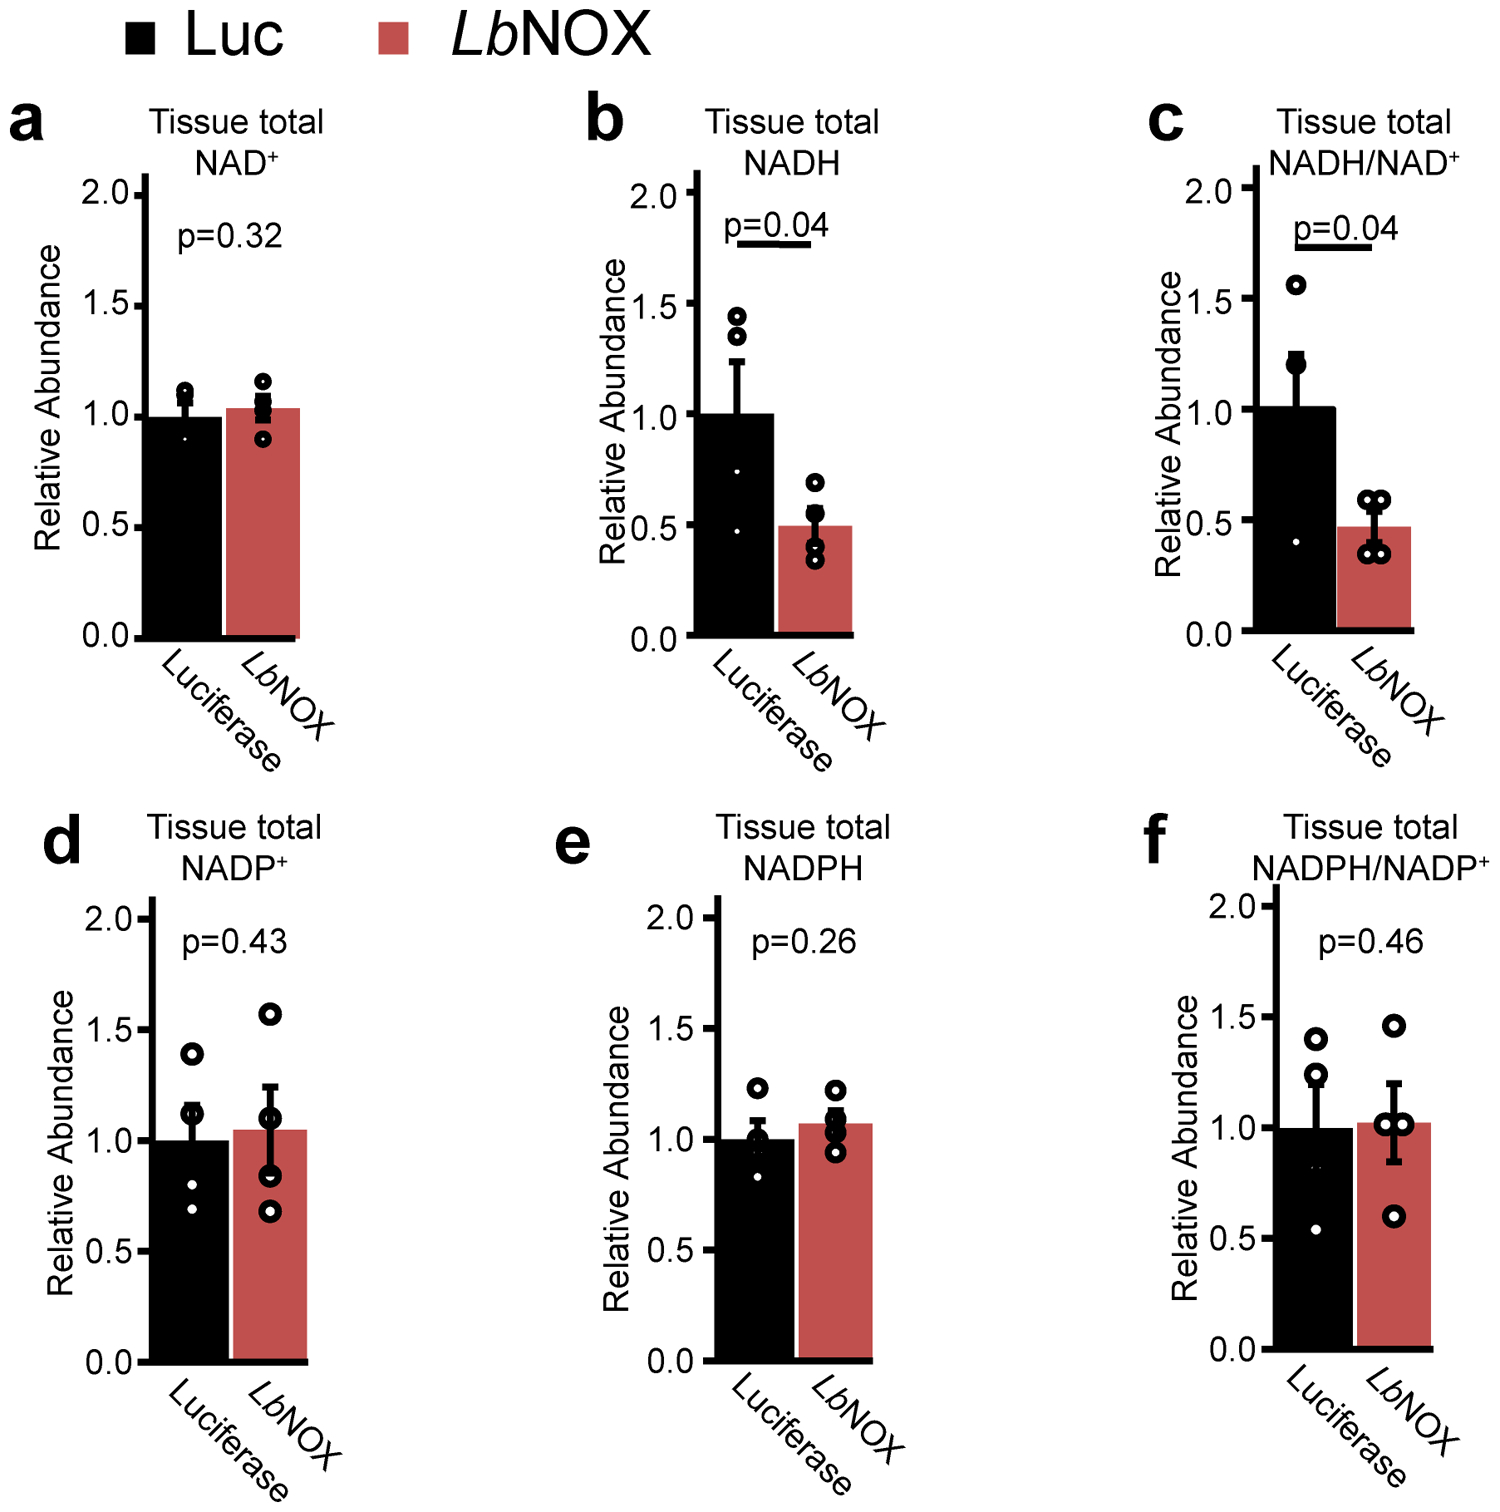
n = 4 mice for each group. p values were determined one-sided Student’s T test. Data are reported as mean ± SEM
Extended data 9 -.
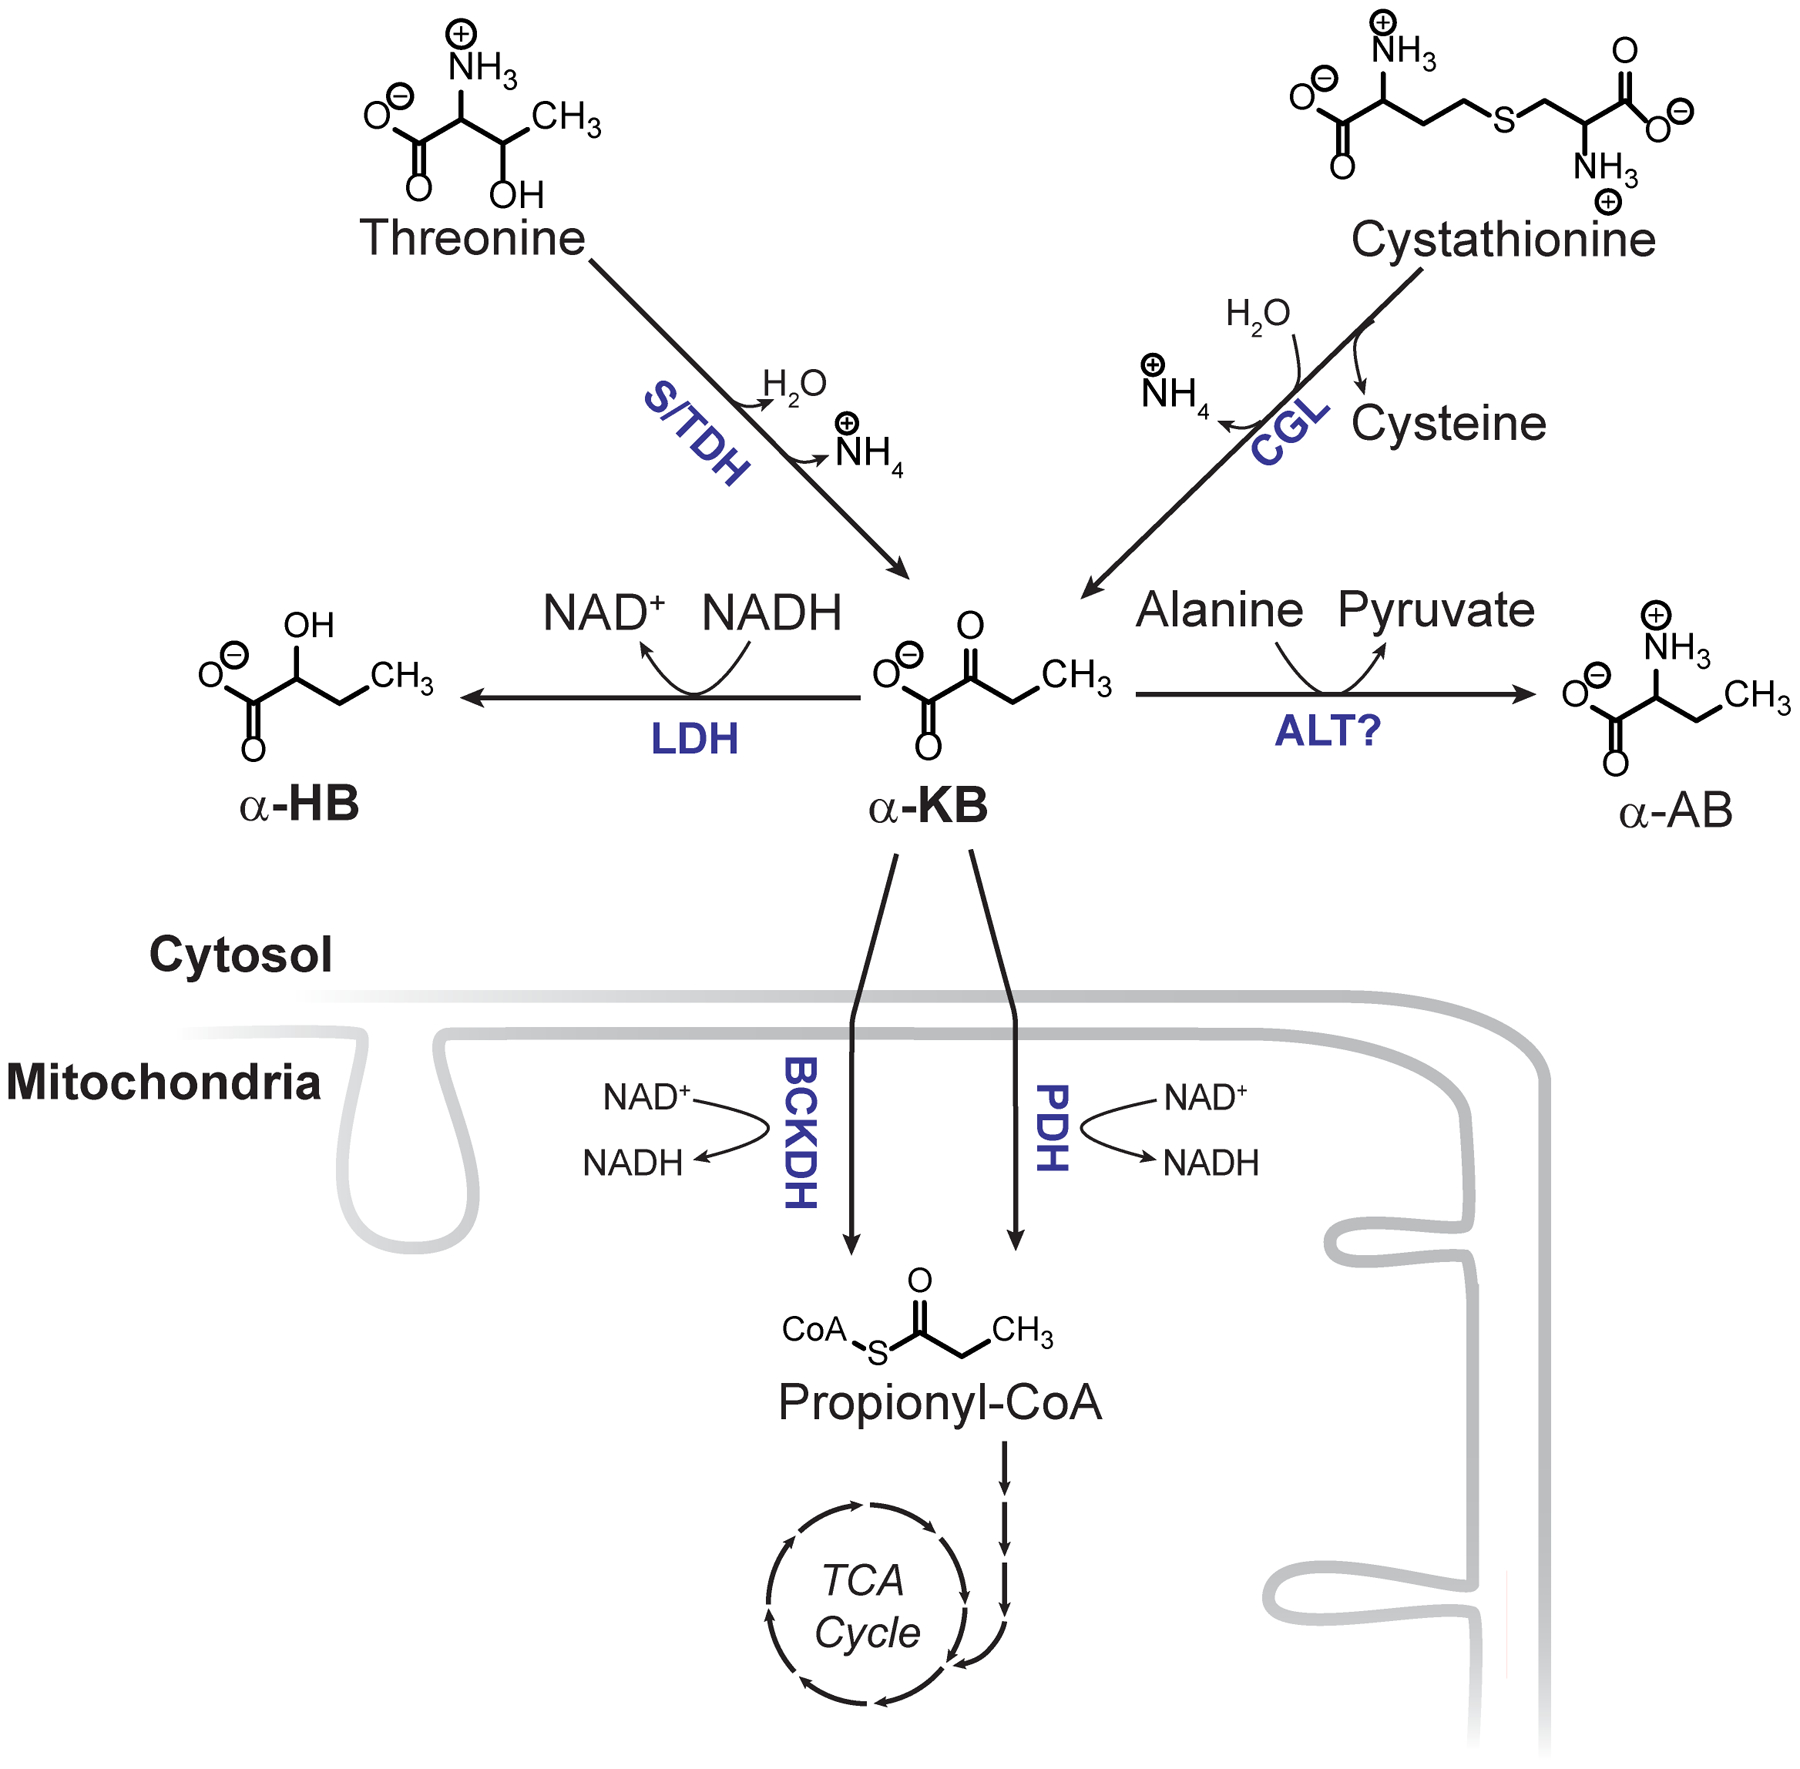
Metabolic origins and fate of αHB. LDH = lactate dehydrogenase, S/TDH = serine/threonine dehydratase, CGL = cystathionine gamma lyase, ALT = alanine aminotransferase, BCKDH = branched chain alpha keto acid dehydrogenase complex, PDH = pyruvate dehydrogenase.
Supplementary Material
Acknowledgements:
We thank Joseph Avruch and members of the Mootha lab for valuable discussions and feedback. R.P.G was supported by NIH F32DK111132-01 and NIH K08DK115881-01. R.P.G and R.M were both supported by a Pinnacle Research Award from the American Association for the Study of Liver Diseases (AASLD). Y.H.H. was supported by NIH T32DK110919. Part of this study was performed at the National Mouse Metabolic Phenotyping Center at UMass supported by NIH 5U2C-DK093000 (to J.K.K.) This work was supported in part by a gift from the Marriott Mitochondrial Disorders Collaborative Research Network and grants from the National Institutes of Health (R35GM122455, TR01GM099683). V.K.M. is an Investigator of the Howard Hughes Medical Institute.
Footnotes
Data availability: All data generated and used in this study are either included in this article (and its Supplementary Information) or are available from the corresponding author on reasonable request.
Competing Financial Interests: V.K.M. is an inventor on a patent PCT/US2016/045015 filed by Massachusetts General Hospital on the use of the LbNOX technology as protein prosthesis for mitochondrial diseases or conditions. V.K.M. and R.P.G are inventors on a patent provisionally filed by Massachusetts General Hospital on modulating hepatic reductive stress with chemicals.
References
- 1.Titov DV et al. Complementation of mitochondrial electron transport chain by manipulation of the NAD+/NADH ratio. Science 352, 231–235 (2016). [DOI] [PMC free article] [PubMed] [Google Scholar]
- 2.Cobb J et al. α-Hydroxybutyric acid is a selective metabolite biomarker of impaired glucose tolerance. Diabetes Care 39, 988–995 (2016). [DOI] [PubMed] [Google Scholar]
- 3.Gall WE et al. Α-Hydroxybutyrate Is an Early Biomarker of Insulin Resistance and Glucose Intolerance in a Nondiabetic Population. PLoS One 5, e10883 (2010). [DOI] [PMC free article] [PubMed] [Google Scholar]
- 4.Thompson Legault J. et al. A Metabolic Signature of Mitochondrial Dysfunction Revealed through a Monogenic Form of Leigh Syndrome. Cell Rep. 13, 981–989 (2015). [DOI] [PMC free article] [PubMed] [Google Scholar]
- 5.Rhee EP et al. A genome-wide association study of the human metabolome in a community-based cohort. Cell Metab. 18, 130–43 (2013). [DOI] [PMC free article] [PubMed] [Google Scholar]
- 6.Goodman RP, Calvo SE & Mootha VK Spatiotemporal compartmentalization of hepatic NADH and NADPH metabolism. J. Biol. Chem 293, 7508–7516 (2018). [DOI] [PMC free article] [PubMed] [Google Scholar]
- 7.Trammell SAJ et al. Nicotinamide riboside opposes type 2 diabetes and neuropathy in mice. Sci. Rep 6, 1–7 (2016). [DOI] [PMC free article] [PubMed] [Google Scholar]
- 8.Cantó C et al. The NAD+ precursor nicotinamide riboside enhances oxidative metabolism and protects against high-fat diet-induced obesity. Cell Metab. 15, 838–847 (2012). [DOI] [PMC free article] [PubMed] [Google Scholar]
- 9.Madiraju AK et al. Metformin suppresses gluconeogenesis by inhibiting mitochondrial glycerophosphate dehydrogenase. Nature 510, 542–546 (2014). [DOI] [PMC free article] [PubMed] [Google Scholar]
- 10.Krebs HA The redox state of nicotinamide adenine dinucleotide in the cytoplasm and mitochondria of rat liver. Adv. Enzyme Regul 5, 409–434 (1967). [DOI] [PubMed] [Google Scholar]
- 11.Ferrannini E et al. Early metabolic markers of the development of dysglycemia and type 2 diabetes and their physiological significance. Diabetes 62, 1730–1737 (2013). [DOI] [PMC free article] [PubMed] [Google Scholar]
- 12.Hung YP, Albeck JG, Tantama M & Yellen G Imaging cytosolic NADH-NAD+redox state with a genetically encoded fluorescent biosensor. Cell Metab. 14, 545–554 (2011). [DOI] [PMC free article] [PubMed] [Google Scholar]
- 13.Masia R et al. Live cell imaging of cytosolic NADH/NAD + ratio in hepatocytes and liver slices. Am. J. Physiol. - Gastrointest. Liver Physiol ajpgi.00093.2017 (2017) doi: 10.1152/ajpgi.00093.2017. [DOI] [PMC free article] [PubMed] [Google Scholar]
- 14.Trammell SAJ et al. Nicotinamide riboside is uniquely and orally bioavailable in mice and humans. Nat. Commun 7, 12948 (2016). [DOI] [PMC free article] [PubMed] [Google Scholar]
- 15.King MP & Attardi G Human cells lacking mtDNA: repopulation with exogenous mitochondria by complementation. Science 246, 500–3 (1989). [DOI] [PubMed] [Google Scholar]
- 16.Kruse SE et al. Mice with mitochondrial complex I deficiency develop a fatal encephalomyopathy. Cell Metab. 7, 312–20 (2008). [DOI] [PMC free article] [PubMed] [Google Scholar]
- 17.Jain IH et al. Hypoxia as a therapy for mitochondrial disease. Science (80-. ). 352, 54–61 (2016). [DOI] [PMC free article] [PubMed] [Google Scholar]
- 18.Machiela MJ & Chanock SJ LDlink: A web-based application for exploring population-specific haplotype structure and linking correlated alleles of possible functional variants. Bioinformatics 31, 3555–3557 (2015). [DOI] [PMC free article] [PubMed] [Google Scholar]
- 19.Teslovich TM et al. Biological, clinical and population relevance of 95 loci for blood lipids. Nature 466, 707–713 (2010). [DOI] [PMC free article] [PubMed] [Google Scholar]
- 20.Diabetes Genetics Initiative of Broad Institute of Harvard and MIT, Lund University, and N. I. of B. R. et al. Genome-wide association analysis identifies loci for type 2 diabetes and triglyceride levels. Science 316, 1331–6 (2007). [DOI] [PubMed] [Google Scholar]
- 21.Cornelis MC et al. Genome-wide meta-analysis identifies six novel loci associated with habitual coffee consumption. Mol. Psychiatry 20, 647–656 (2015). [DOI] [PMC free article] [PubMed] [Google Scholar]
- 22.Chambers JC et al. Genome-wide association study identifies loci influencing concentrations of liver enzymes in plasma. Nat. Genet 43, 1131–8 (2011). [DOI] [PMC free article] [PubMed] [Google Scholar]
- 23.Kilpeläinen TO et al. Genome-wide meta-analysis uncovers novel loci influencing circulating leptin levels. Nat. Commun 7, 10494 (2016). [DOI] [PMC free article] [PubMed] [Google Scholar]
- 24.Cheung CYY et al. An Exome-Chip Association Analysis in Chinese Subjects Reveals a Functional Missense Variant of GCKR That Regulates FGF21 Levels. Diabetes 66, 1723–1728 (2017). [DOI] [PubMed] [Google Scholar]
- 25.Orho-Melander M et al. Common missense variant in the glucokinase regulatory protein gene is associated with increased plasma triglyceride and C-reactive protein but lower fasting glucose concentrations. Diabetes 57, 3112–21 (2008). [DOI] [PMC free article] [PubMed] [Google Scholar]
- 26.Speliotes EK et al. Genome-wide association analysis identifies variants associated with nonalcoholic fatty liver disease that have distinct effects on metabolic traits. PLoS Genet. 7, e1001324 (2011). [DOI] [PMC free article] [PubMed] [Google Scholar]
- 27.Raimondo A, Rees MG & Gloyn AL Glucokinase regulatory protein: Complexity at the crossroads of triglyceride and glucose metabolism. Curr. Opin. Lipidol 26, 88–95 (2015). [DOI] [PMC free article] [PubMed] [Google Scholar]
- 28.Beer NL et al. The P446L variant in GCKR associated with fasting plasma glucose and triglyceride levels exerts its effect through increased glucokinase activity in liver. Hum. Mol. Genet 18, 4081–4088 (2009). [DOI] [PMC free article] [PubMed] [Google Scholar]
- 29.Dupuis J et al. New genetic loci implicated in fasting glucose homeostasis and their impact on type 2 diabetes risk. Nat. Genet 42, 105–116 (2010). [DOI] [PMC free article] [PubMed] [Google Scholar]
- 30.Holland WL & Summers SA Sphingolipids, insulin resistance, and metabolic disease: New insights from in vivo manipulation of sphingolipid metabolism. Endocr. Rev 29, 381–402 (2008). [DOI] [PMC free article] [PubMed] [Google Scholar]
- 31.Perry RJ, Samuel VT, Petersen KF & Shulman GI The role of hepatic lipids in hepatic insulin resistance and type 2 diabetes. Nature 510, 84–91 (2014). [DOI] [PMC free article] [PubMed] [Google Scholar]
- 32.Nakatani Y et al. Involvement of endoplasmic reticulum stress in insulin resistance and diabetes. J. Biol. Chem 280, 847–851 (2005). [DOI] [PubMed] [Google Scholar]
- 33.Shoelson SE, Lee J & Goldfine AB Review series Inflammation and insulin resistance. J. Clin. Invest 116, 1793–1801 (2006). [DOI] [PMC free article] [PubMed] [Google Scholar]
- 34.Jang C et al. Metabolite Exchange between Mammalian Organs Quantified in Pigs. Cell Metab. 1–13 (2019) doi: 10.1016/j.cmet.2019.06.002. [DOI] [PMC free article] [PubMed] [Google Scholar]
- 35.Titchenell PM, Chu Q, Monks BR & Birnbaum MJ suppression of glucose output by insulin in vivo. Nat. Commun 6, 1–9 (2015). [DOI] [PMC free article] [PubMed] [Google Scholar]
- 36.Ader M & Bergman RN Peripheral effects of insulin dominate suppression of fasting hepatic glucose production. Am. J. Physiol. - Endocrinol. Metab 258, (1990). [DOI] [PubMed] [Google Scholar]
- 37.Dupuis J et al. New genetic loci implicated in fasting glucose homeostasis and their impact on type 2 diabetes risk. Nat. Genet 42, 105–16 (2010). [DOI] [PMC free article] [PubMed] [Google Scholar]
- 38.Saxena R et al. Genetic variation in GIPR influences the glucose and insulin responses to an oral glucose challenge. Nat. Genet 42, 142–8 (2010). [DOI] [PMC free article] [PubMed] [Google Scholar]
- 39.Kim W et al. Polyunsaturated Fatty Acid Desaturation Is a Mechanism for Glycolytic NAD+ Recycling. Cell Metabolism vol. 0. [DOI] [PMC free article] [PubMed] [Google Scholar]
- 40.Baraona E & Lieber CS Effects of ethanol on lipid metabolism. J. Lipid Res 20, 289–315 (1979). [PubMed] [Google Scholar]
- 41.Desai BN, Singhal G, Watanabe M, Stevanovic D & Lundasen T Fibroblast growth factor 21 ( FGF21 ) is robustly induced by ethanol and has a protective role in ethanol associated liver injury. Mol. Metab 21, (2017). [DOI] [PMC free article] [PubMed] [Google Scholar]
- 42.Hondares E et al. Hepatic FGF21 expression is induced at birth via PPARalpha in response to milk intake and contributes to thermogenic activation of neonatal brown fat. Cell Metab. 11, 206–12 (2010). [DOI] [PMC free article] [PubMed] [Google Scholar]
- 43.Xu J et al. Fibroblast growth factor 21 reverses hepatic steatosis, increases energy expenditure, and improves insulin sensitivity in diet-induced obese mice. Diabetes 58, 250–259 (2009). [DOI] [PMC free article] [PubMed] [Google Scholar]
- 44.Schlein C et al. FGF21 lowers plasma triglycerides by accelerating lipoprotein catabolism in white and brown adipose tissues. Cell Metab. 23, 441–453 (2016). [DOI] [PubMed] [Google Scholar]
- 45.Auton A et al. A global reference for human genetic variation. Nature 526, 68–74 (2015). [DOI] [PMC free article] [PubMed] [Google Scholar]
- 46.Kim JK Hyperinsulinemic-euglycemic clamp to assess insulin sensitivity in vivo. Methods in Molecular Biology vol. 560 (2009). [DOI] [PubMed] [Google Scholar]
- 47.Lu W, Wang L, Chen L, Hui S & Rabinowitz JD Extraction and Quantitation of Nicotinamide Adenine Dinucleotide Redox Cofactors. Antioxid. Redox Signal 28, 167–179 (2018). [DOI] [PMC free article] [PubMed] [Google Scholar]
- 48.Fiehn O Metabolomics by Gas Chromatography-Mass Spectometry: the combination of targeted and untargeted profiling. Current Protocols in Molecular Biology vol. 114 (2016). [DOI] [PMC free article] [PubMed] [Google Scholar]
- 49.Gibbs RA et al. The International HapMap Project. Nature 426, 789–796 (2003). [DOI] [PubMed] [Google Scholar]
- 50.Chang CC et al. Second-generation PLINK: Rising to the challenge of larger and richer datasets. Gigascience 4, 1–16 (2015). [DOI] [PMC free article] [PubMed] [Google Scholar]
Associated Data
This section collects any data citations, data availability statements, or supplementary materials included in this article.