

Abstract
Filler disfluencies – uh and um – are thought to serve distinct discourse functions. We examined fillers in spontaneous speech by youth with autism spectrum disorder (ASD), who struggle with pragmatic language, and by youth with ASD who have achieved an ‘optimal outcome’ (OO), as well as in peers with typical development (TD). While uh rates did not differ, participants with ASD produced um less frequently than OO or TD groups. Um rate was associated with autism symptom severity, but not executive function or language abilities, suggesting that um serves a pragmatic, listener-oriented function. Moreover, in contrast to minimal production in ASD, the typical OO um production substantiates the normalization of subtle social communication in this population.
Keywords: Autism, Optimal Outcomes, Pragmatics, Discourse, Disfluency, Fillers
Introduction
Disfluencies, such as repetitions, self-corrections, silent pauses, and filled pauses, are frequent in spontaneous speech, particularly when a speaker has difficulty planning an utterance (Clark & Fox Tree, 2002). In general, disfluency reflects difficulty in organizing, timing, and monitoring language output; see Griffin and Spieler (2006) for a detailed review. Disfluencies, including repetitions and self-corrections, have been linked to executive functions such as inhibitory control (Engelhardt, Ferreira, & Nigg, 2011; Engelhardt, Nigg, & Ferreira, 2013). Not all disfluencies, however, are associated with executive dysfunction: filled pauses, or filler disfluencies, were not correlated with cognitive load or executive dysfunction (Engelhardt et al., 2011; Engelhardt et al., 2013). In fact, fillers – um and uh – are thought to serve distinct pragmatic functions (Clark & Fox Tree, 2002). Given that pragmatic language impairment is central to autism spectrum disorder (or ASD; Shriberg, Paul, Black, & van Santen, 2011), the current study aimed to explore filler production among individuals with autism spectrum disorder (ASD), and those who have achieved ‘optimal outcomes’ (OO) from ASD. In the current study, we examined filler production by youth with ASD and OO, as compared to youth with typical development (TD). We also investigated the association between filler rates, autism symptom severity, and general cognitive and language abilities, to illuminate the processes implicated in filler production.
Fillers.
Fillers appear to be a nearly universal feature of language. Uh and um are the most common fillers in American English; eh is a produced frequently in Swedish, Norwegian, Spanish, French, and Hebrew. Indeed, the most frequent vowel sounds in the lexicon for a given language’s generally correspond with the vowel sounds in that language’s fillers (Shriberg, 1994).
Saying uh or um affords a momentary halt in speech, offering time for speech planning and production. This momentary delay could otherwise be achieved with a silent pause. Why, then, do speakers fill their pauses? It has been shown that uhs and ums are more than vocal artifacts: they communicate information about discourse itself. Speakers use fillers to signal intent to hold the conversational floor (Maclay & Osgood, 1959), convey uncertainty and equivocation (Brennan & Williams, 1995), or announce momentary delays in speech for utterance planning (Clark & Fox Tree, 2002) and word-finding (Goodwin & Goodwin, 1986).
Multiple findings support the hypothesis that fillers serve a pragmatic function. When conversing on the telephone, people produce more fillers than in face-to-face discourse (Oviatt, 1995), suggesting that, when nonverbal cues such as gesture and eye contact are unavailable, speakers rely more heavily on the use of uhs and ums to coordinate discourse. Oviatt (1995) also found that speakers produce more fillers when speaking to a human audience than to a machine audience (i.e., voice recognition software). This increased filler rate in the presence of ‘mindful’ or conscious interlocutors suggests that fillers are produced at least in part for the benefit of the listener. This account is consistent with the finding that people giving instructions produce more fillers than those following instructions (Bortfeld, Leon, Bloom, Schober, and Brennan, 2001).
Although most studies to date have collapsed uh and um into a single category of disfluency, these fillers tend to appear in complementary distribution and to be produced in different grammatical contexts, suggesting that they may serve distinct functions. Many languages, in fact, contain two types of fillers: one filler consisting only of a vowel, and one including a nasal (i.e., m and n), which allows the speaker to extend the length of the filled pause indefinitely (Shriberg, 1994). While both fillers signal a speech delay, uh typically precedes shorter delays, while um generally precedes longer ones (Clark & Fox Tree, 2002; Smith & Clark, 1993). Furthermore, uh is produced more often within utterances, whereas um is produced more often at utterance boundaries (Clark & Fox Tree, 2002). This study measured uh and um separately to test whether they differ in terms of self-regulatory versus communicative functions.
Studies also suggest that fillers affect speech comprehension. When listeners hear uh or um, they are more likely to look at referents that are new to the discourse (Arnold, Fagnano, & Tanenhaus, 2003) or that are difficult to describe (Arnold, Hudson Kam, & Tanenhaus, 2007; Arnold, Tanenhaus, Altmann, & Fagnano, 2004). Such anticipation effects have been reported for children as young as two years (Kidd, White, & Aslin, 2011). While it is possible that these anticipation effects are due to the pragmatic function of fillers, it is also possible that these effects may merely reflect statistical learning and do not necessitate perspective taking. To address these two hypotheses, Arnold et al. (2007) tracked eye movements while participants heard fluent versus disfluent speech. In some cases, they were told that the speaker had impaired object recognition. On those trials, participants did not make anticipatory eye movements towards novel referents after hearing fillers, presumably because they inferred that the speaker’s impairments would make fillers less indicative of referent novelty and more indicative of difficulty labeling objects. Similarly, changing the identity of the speaker decreases the presence of anticipatory eye movements for discourse-new referents (Barr & Seyfeddinipur, 2010), suggesting that listeners assess discourse novelty from the speaker’s perspective, providing further evidence that fillers have a pragmatic function. Taken together, these studies suggest that interlocutors (e.g., conversational partners) use fillers to comprehend and manage discourse, and to communicate and parse mental-state information. The effective use of uh and um therefore requires a speaker to consider the listener’s perspective while constructing an utterance. Perspective-taking is an area of particular difficulty for people with ASD.
Disfluency in Autism Spectrum Disorder.
ASD is a neurodevelopmental disorder marked by deficits in reciprocal social interaction and communication (American Psychiatric Association, 2000). Pragmatic language is broadly impaired in ASD, and atypical prosody, including disfluencies affecting the rhythm of speech, is a core feature, with increased rates of repetition and self-correction (Shriberg et al., 2001; Suh et al., 2014), and silent pauses (Lake, Humphreys, & Cardy, 2011). Speech in ASD can also be marked by ‘atypical’ disfluencies that are uncommon outside of the disorder, including sound repetitions and within-word breaks (Plexico, Cleary, McAlpine, & Plumb, 2010).
Filler Production in ASD.
Although individuals with ASD are generally more disfluent, the pragmatic account of filler disfluencies would lead one to expect fewer fillers in ASD. To our knowledge, only two studies to date have probed this inconsistency. One study found results consistent with the reduced-filler prediction: analysis of a large speech corpus found that adults with ASD produced significantly fewer fillers relative to adults with TD (Lake et al., 2011).
Optimal Outcomes.
Although ASD was previously considered a lifelong condition, a growing body of literature indicates that some 8–25% of children diagnosed with ASD in early childhood make such significant gains over the course of development that they lose their ASD diagnosis, achieving an ‘optimal outcome’ (OO) from ASD (Fein et al., 2013; for a review of optimal outcomes, see Helt et al., 2008). Studies of OO suggest that most pragmatic language deficits are completely resolved, although some persist at least through early development. A study of young OO children ages 5–9 reported pragmatic language deficits during narrative production, such as providing fewer causal explanations and character motivations, and misinterpreting story events (Kelley, Paul, Fein, & Naigles, 2006). In contrast, an older group of OO children (ages 8–13, including many who also participants in the 2006 sample) showed no pragmatic deficits on standardized language measures (Kelley, Naigles, & Fein, 2010). Moreover, during spontaneous narrative production, OO and TD groups did not differ in ambiguous pronoun production, and produced fewer ambiguous pronouns than their ASD peers (Suh et al., 2014). However, participants with ASD and OO used more idiosyncratic language. Therefore, some pragmatic deficits, particularly those relating to spontaneous narrative production, appear to persist in OO.
Suh et al. (2014) also examined disfluency in OO during the narrative task. There was significant participant overlap between Suh et al.’s sample and that of the current study. Like their peers with ASD, OO individuals produced more self-corrections than TD individuals; however, unlike their peers with ASD, OO individuals did not produce more repetitions. There were no group differences in filler production, among any of the three groups. As described below, the narrative task in Suh et al.’s study may have minimized filler production. Furthermore, in the two studies that have measured filled pause production in ASD (Lake et al., 2011; Suh et al., 2014), neither contrasted uh and um production.
Current study.
In the current study, we examined filler production by youth with ASD, OO, and TD, during a spontaneous speech sample produced under cognitive load. Speakers produce more fillers when discourse is more difficult (Arnold et al., 2007; Arnold et al., 2004) and when their task is less constrained, with a larger range of expressive options (Schachter, Christenfeld, & Ravina, 1991). Suh et al.’s narrative elicitation task was untimed; participants were asked to generate a narrative from a picture book. In contrast, our open-ended picture description task was used to elicit speech under constrained conditions (the requirement to describe a particular image), in a timed fashion, and under an additional cognitive load.
This study had two primary goals. First, we sought to evaluate the unique frequencies of both uh and um for ASD, OO, and TD participants. Given the evidence that fillers, and particularly um, are pragmatic in nature, we hypothesized that ASD participants would produce uh and um, particularly um, less frequently than their TD peers. Further, we were particularly interested in filler production in OO, as the degree of ‘normalization’ of subtle pragmatic language abilities in OO remains an open question. A second goal was to explore the mechanisms associated with filler production by probing correlations among filler production and ASD symptomatology and executive functions (including verbal fluency), as well as general language ability. Given the pragmatic account of fillers, we hypothesized that uh and um production would correlate with core ASD symptomatology per se rather than executive functions or language ability.
Methods
Participants
Participants included individuals between 8 and 21 years with a history of ASD who achieved optimal outcomes (OO; n = 24); high-functioning individuals with a current ASD diagnosis (ASD; n = 24); and individuals with a history of typical development (TD; n = 16). The groups did not differ on age, gender, and nonverbal IQ (NVIQ). Mean verbal IQ (VIQ) of the OO and TD groups was marginally higher than the ASD group. All participants had verbal, nonverbal, and full-scale IQ scores at or above the average range (Standard Scores > 77). Participant data are shown in Table 1. All participants were part of a larger study of OO (Fein et al., 2013).
Table 1.
Descriptive characteristics for autism spectrum disorder (ASD), optimal outcome (OO), and typically developing (TD) groups.
| ASD | OO | TD | F/χ2 | p | Post-Hoc | Cohen’s d | |
|---|---|---|---|---|---|---|---|
| N | 24 | 24 | 16 | ||||
| Sex Gender (M:F) | 21:3 | 19:5 | 14:2 | 0.79 | 0.67 | ||
| Age | 12;10 9.0–16.4 |
13;6 8.5–21.2 |
13;4 9.9–15.6 |
0.30 | 0.74 | ||
| (2.4) | (4.3) | (1.8) | |||||
| 9;0–16;4 | 8;6–21;2 | 9;10–15;7 | |||||
| VIQa | 103.5 81–133 |
111.6 80–137 |
113.2 99–136 |
2.96 | 0.06 | ASD < OO, TD | ASD/OO: 0.56 ASD/TD: 0.73 |
| (13.8) | (15.0) | (12.9) | |||||
| 81–133 | 80–137 | 99–136 | ASD/TD: 0.73 | ||||
| NVIQb | 111.1 78–147 |
110.6 87–134 |
115.1 89–139 |
0.59 | 0.56 | ||
| (14.7) |
(13.8) |
(12.2) | |||||
| 78–147 | 87–134 | 89–139 | |||||
| ADOSc | 10.4 | 1.4 | 0.9 | 123.49 | 0.001 | ASD < OO, TD | ASD/OO: 3.56 |
| (3.2) | (1.6) | (1.1) | |||||
| 7–19 | 0–4 | 0–4 | ASD/TD: 3.97 | ||||
| SCQ Lifetimed | 23.1 | 17.1 | 1.27 | 78.92 | 0.001 | TD < OO < ASD | TD/OO: 3.59 |
| (6.0) | (6.1) | (1.3) | ASD/TD: 5.03 | ||||
| 10–31 | 7–28 | 0–4 | OO/ASD: 0.99 | ||||
| BRIEF Global EFe | 66.5 | 51.1 | 40.9 | 43.90 | 0.001 | TD < OO < ASD | TD/OO: 1.38 |
| (9.3) | (8.4) | (6.2) | ASD/TD: 3.24 | ||||
| 49–82 | 38–68 | 32–54 | OO/ASD: 0.99 | ||||
| D-KEFS Cat. Flu.f | 10.58 | 12.9 | 11.6 | 2.14 | 0.13 | ||
| (4.2) | (3.7) | (3.7) | |||||
| 3–19 | 7–19 | 7–19 | |||||
| CELF Core Lang.g | 99.9 | 109.9 | 119.3 | 12.0 | 0.001 | ASD < OO < TD | ASD/OO: 0.77 7 |
| (14.1) | (11.9) | (7.8) | ASD/TD: 1.70 | ||||
| 70–124 | 79–126 | 109–132 | OO/TD: 0.93 |
Data are shown as mean, SD, and range.
VIQ: Stanford-Binet Verbal IQ, Standard Score.
NVIQ: Stanford-Binet Nonverbal IQ, Standard Score.
Summed social and communicative domain scores from the ADOS; higher scores indicate greater severity. On the ADOS, 7 is the cutoff for an ASD.
SCQ = Social Communication Questionnaire, Lifetime severity score; higher scores indicate greater severity. A score of 15 is recommended as the threshold for ASD (Rutter et al., 2003).
BRIEF: The BRIEF (Gioia et al., 2000) parent questionnaire for executive functions generates a Global Executive Composite score; higher scores indicate greater impairment.
D-KEFS: Delis-Kaplan Executive Function System (Delis, Kaplan, & Kramer, 2001), Category Fluency subtest.
CELF: Comprehensive Evaluation of Language Fundamentals, 4th Edition, Core Language Score.
OO group.
Participants in the OO group had to have received a diagnosis prior to age five years from a specialist in the field of autism, focusing directly on the ASD diagnosis and verified in a written report. OO participants could not exhibit current ASD symptomatology on the basis of the Autism Diagnostic Observation Schedule (ADOS; Lord, Rutter, DiLavore, & Risi, 2002) or by clinical judgment. In addition to IQ scores in or above the average range, OO participants were required to demonstrate the presence of age-appropriate social and communication skills, operationalized as scores on the Communication and Socialization domains of the Vineland Adaptive Behavior Scales, Second Edition (Vineland-II; Sparrow, Cicchetti, & Balla, 2005) that were within the normal range (Standard Scores > 77), and participation in general education classes.
ASD group.
Participants in the ASD group met DSM-IV-TR criteria for pervasive developmental disorders (Autistic Disorder, n = 12; Pervasive Developmental Disorder – Not Otherwise Specified, n = 12) based on expert clinical judgment using DSM-IV-TR criteria (American Psychiatric Association, 2000). Diagnosis was confirmed using the ADOS (Lord et al., 2002). Early language delay (no words by 18 months or no phrases by 24 months) was required for inclusion, and no participants met formal diagnostic criteria for Asperger’s disorder.
TD group.
Participants in the TD group could not meet criteria for any ASD based on the ADOS, parent report on the Social Communication Questionnaire (SCQ; Rutter, Bailey, & Lord, 2003), or clinical judgment. Participants had no first-degree relatives with an ASD diagnosis. In order to avoid a hyper-normative group, TD children were not excluded for learning disorders.
Exclusion criteria.
Participants were excluded across groups if they exhibited symptoms of major psychopathology that would impede study participation. Participants with severe visual or hearing impairments, history of seizure disorder, Fragile X Syndrome, or head trauma with loss of consciousness were also excluded. Two TD and 2 ASD participants were excluded due to possible seizure disorder.
Measures
Participants completed a comprehensive assessment of ASD symptom severity, IQ, executive functions, and language ability, as well as an experimental task, as part of a larger study of OO (Fein et al., 2013). The following measures were of relevance to the current study:
The Autism Diagnostic Observation Schedule (ADOS; Lord et al., 2002) is a semi-structured play-based assessment, and is the gold-standard tool for diagnosing ASD. Participants completed either Module 3 or Module 4, and it was administered and scored by trained and research-reliable graduate student clinicians. Assessments were digitally recorded for later review by expert clinicians.
The Social Communication Questionnaire, Lifetime Version (SCQ; Rutter et al., 2003) is a parent questionnaire that screens for ASD symptoms across the lifespan. Higher scores indicate more severe ASD symptomatology.
The Wechsler Abbreviated Scale of Intelligence (WASI; Wechsler, 1999) is a brief measure of verbal and nonverbal intelligence; it was used to assess cognitive abilities.
The Clinical Evaluation of Language Fundamentals (CELF; Semel, Wiig, & Secord, 2003) Core Language Score provides a clinical measure of general language abilities.
The Delis-Kaplan Executive Function System (D-KEFS; Delis, Kaplan, & Kramer, 2001) is a neuropsychological battery for assessing executive functions. The Category Fluency subtest, in which participants list as many words as possible that fit in a semantic category, was used as a measure of verbal fluency.
The Behavior Rating Inventory of Executive Function (BRIEF; Gioia, Isquith, Guy, & Kenworthy, 2000) is a parent questionnaire; the Global Executive Composite score was used as a measure of executive functioning.
Experimental Task.
Participants completed a computerized dual-task paradigm in which they were instructed to tap a key with their index finger (reanalysis of data presented in Fitch et al., 2015). Unlike some tasks involving tapping, participants were not asked to synch their tapping with any external stimulus; rather, they were simply asked to tap as quickly as possible. Tapping hand (right, left) was randomized and counterbalanced; each participant tapped an equal number of trials with each hand.
Participants completed ten baseline tapping-only and six dual task trials. Only the dual task trials are relevant for the current study. Each trial lasted 10 seconds; the words ‘Go’ and ‘Stop’ served as start and stop signals. During dual task trials, participants were instructed to describe each of six paintings (presented on the computer display) to the experimenter while simultaneously tapping their right index finger. There were two practice trials to insure comprehension of the procedure. Graduate student experimenters administered the task and served as the audience for the participants’ painting descriptions. Trials were videotaped for transcription and later analysis. Sample transcripts of painting descriptions, and the painting, are provided in Figure 1.
Figure 1.

One of the six paintings (Bathers at Asnières; Georges Seurat) that participants were asked to describe for 10 seconds, along with sample descriptions from an individual with autism spectrum disorder (ASD), optimal outcome (OO), and typical development (TD). * Indicates a self-interruption.
Procedures
The University of Connecticut Institutional Review Board approved study procedures, and written consent and assent were obtained from parents and participants. Testing took place either at the participant’s home or at the University of Connecticut.
Transcription and Reliability.
Three trained transcribers (the first author and two trained research assistants, all naïve to diagnosis) transcribed participants’ painting descriptions. All words and fillers were transcribed. Transcribers specifically differentiated between the fillers uh and um. Uh and um count, as well as total word count (including fillers), were tallied across the six transcribed trials for each participant. Partial words were not included. Filler totals were divided by total word count and multiplied by 100, yielding uh and um ratio scores for each participant.
Two additional trained research assistants re-transcribed 16 of the 64 descriptions (25%). Because filler ratio scores were continuous variables, intraclass correlations (ICC) were used to calculate interrater reliability for uh and um rates, using average-measures ICC, with an “absolute agreement” definition (Shrout & Fleiss, 1979). As transcribers varied across participants, we used a “one-way random,” ICC (1) model. Reliability for was excellent: ICC (1,2) = .94 for uh; ICC (1,2) = .98 for um.
Results
All data were evaluated for standard assumptions of normality. Filler rates were not normally distributed and violated assumptions of normality, per Shapiro-Wilk tests, so nonparametric tests were used. Kruskal-Wallis tests compared the variables of interest (uh rate and um rate) with group (TD, OO, and ASD) as an independent variable. Post hoc analyses used Mann-Whitney U tests; effect sizes were calculated with rank-biserial correlation (r; conventions for effects: small = .10–.29, medium = .30–.49, large = .50–1). The presence or absence of um as a function of group was tested via χ2 analyses, with effect sizes calculated using Odds Ratios (OR). Although groups differed marginally in VIQ, because VIQ is inherently related to diagnostic category, it was not included as a covariate (see Dennis et al., 2009). To ensure that age, NVIQ, and VIQ did not independently correlate with um rate, correlations were tested across groups. Within-group Pearson correlations were calculated to test mechanisms underlying variations in filler use.
Kruskal-Wallis analyses indicated no group differences in uh rate, H (2) = 2.92, p = .23. However, the groups differed in um rate, H (2) = 10.59, p < .01. Mann-Whitney U analyses indicated that the OO group (Mdn = 0.7) produced um significantly more frequently than the ASD group (Mdn = 0.0), U = 182.5, p < .05, with a medium effect size (r = .34); the TD versus ASD group comparison was also significant (Mdn = 2.3), U = 88.5, p < .01, with a medium effect size (r = .48). The TD and OO groups did not differ, U = 146.0, p = .20, with a small effect size (r = .20). Data are shown in Table 2 and Figure 2.
Table 2.
Median and mean uh and um rates (per 100 words), and odds ratios for participants who produced at least 1 uh or at least 1 um, as a function of group.
| ASD | OO | TD | H/χ2 | p | Post-Hoc | r / OR | ||
|---|---|---|---|---|---|---|---|---|
| Uh Rate | 2.92 | 0.23 | ASD/TD: 0.73 | |||||
| Median | 0.00 | 0.72 | 0.00 | |||||
| Mean | 0.48 | 0.92 | 0.91 | |||||
| SD | (1.0) | (1.5) | (1.5) | |||||
| Range | 0–3.6 | 0–7.1 | 0–5.1 | |||||
| Uh > 0 (%)a | 29.2 | 54.2 | 43.8 | ASD/OO/TD: | 3.10 | 0.21 | ||
| Um Rate | 10.59 | <0.01 | ASD < OO, TD | ASD/OOb: 0.34 ASD/OO: 0.34 |
||||
| Median | 0.00 | 0.71 | 2.34 | ASD/TDb: 0.48 | ||||
| Mean | 0.78 | 1.90 | 2.39 | |||||
| SD | (1.5) | (2.5) | (1.7) | |||||
| Range | 0–4.8 | 0–9.0 | 0–5.1 | |||||
| Um > 0 (%)a | 29.2 | 66.7 | 81.3 | ASD/OO: | 5.34 | <0.05 | ASD/OOc: 4.86 | |
| ASD/TD: | 8.44 | <0.01 | ASD/TDc: 10.52 | |||||
| OO/TD: | 0.42 | 0.52 |
Indicates the percentage of participants per group who produced at least 1 uh or at least 1 um.
Indicates point-biserial correlation (r) effect sizes
Indicates odds ratios (OR).
Figure 2.
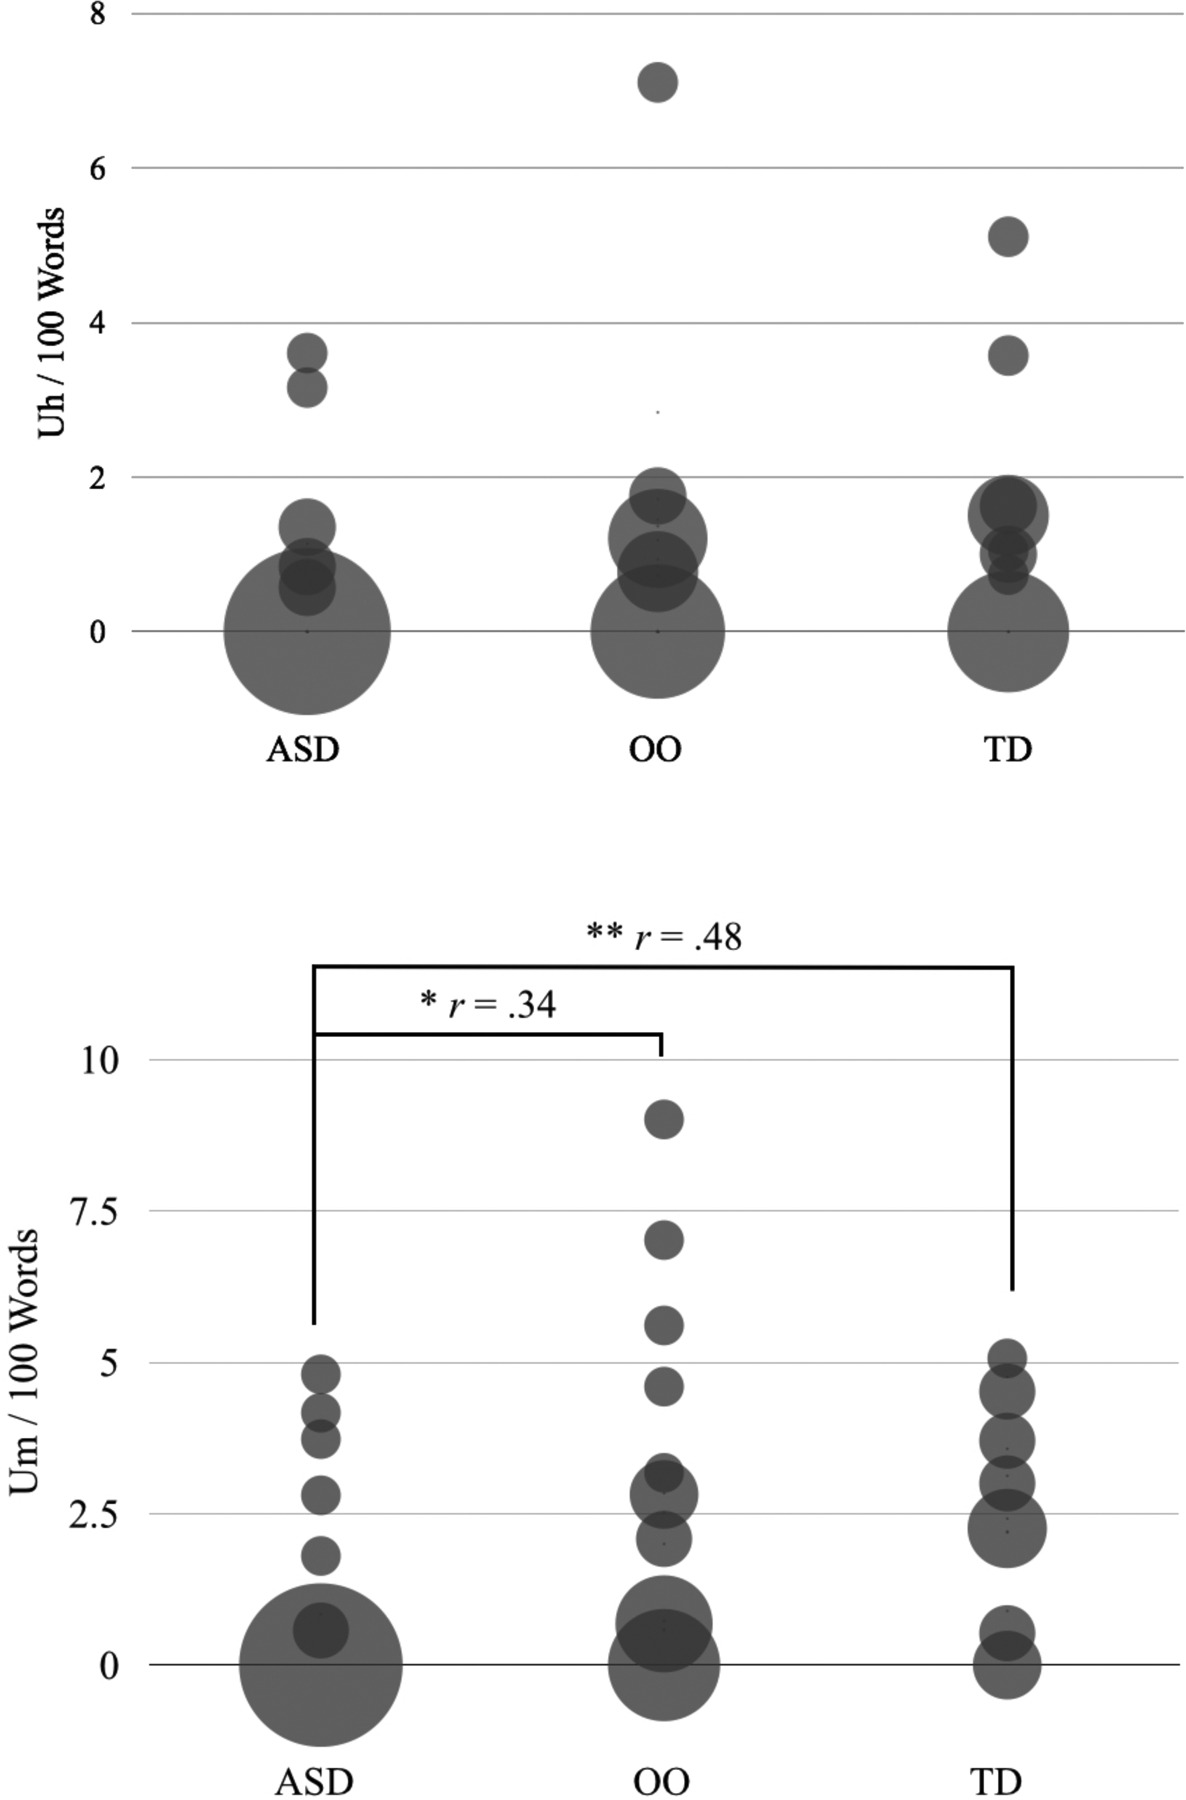
Mean uh (above) and um (below) rates by autism spectrum disorder (ASD), optimal outcome (OO), and typically developing (TD) groups. Circle size corresponds to number of participants at a given rate; the smallest circles represent a single participant.
To further explore group differences, um production was dichotomized: um rate > 0 (for participants who produced at least one um) or um rate = 0. Uh production was dichotomized as well (uh rate > 0, uh rate = 0). Chi-square tests indicated no difference in uh production among ASD, OO and TD groups, χ2 (2, N = 64) = 3.10, p = .21. There was, however, a difference between ASD and OO groups, χ2 (1, N = 48) = 5.34, p < .05, OR = 4.86, and ASD and TD groups, χ2 (1, N = 40) = 8.44, p < .01, OR = 10.52. Both TD and OO participants were significantly more likely to say um than ASD participants. The TD and OO groups did not differ, χ2 (1, N = 40) = .42, p = .52. Data are shown in Table 2.
There were no significant correlations between um rate and age, VIQ, or NVIQ across groups, all ps > .17. Analyzing groups separately, um rate was not correlated with CELF Core Language, D-KEFS Category Fluency, or BRIEF Global Executive Composite scores, all ps > .39. For both TD and OO groups, um rate and SCQ score were uncorrelated, ps > .34. For the ASD group, um rate and SCQ scores were correlated, r = −.45, n = 24, p < .05, such that lower um rate was associated with greater ASD symptomatology, as shown in Figure 3. These results suggest that reduced um production in ASD relates to core pragmatic defects, rather than factors that may impact fluency, such as executive function or general language abilities.
Figure 3.
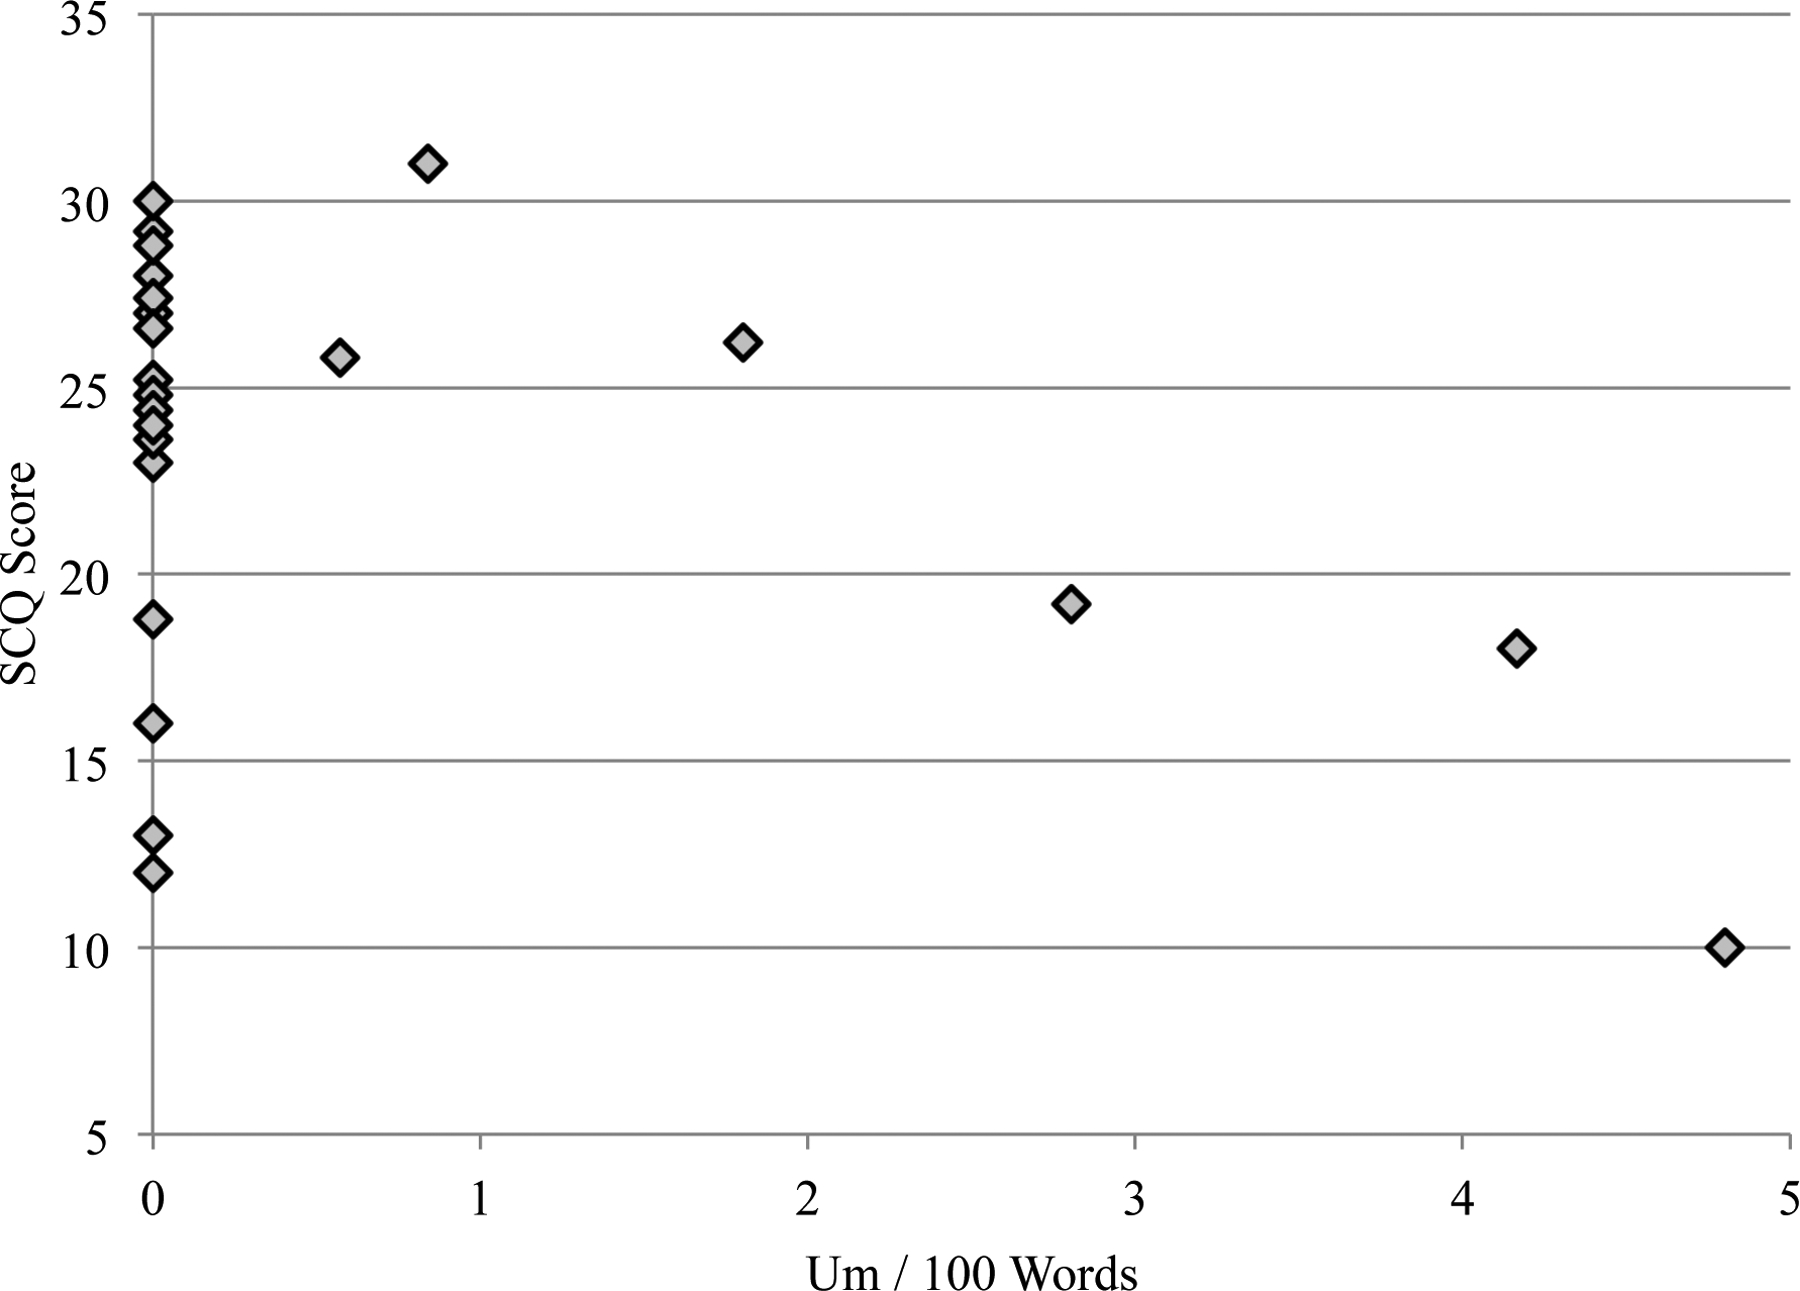
Association between autism severity (SCQ score) and um rate within the ASD group. A cutoff score of 15 is recommended as an indication of a possible ASD (Rutter et al., 2003); higher scores indicate greater severity. All ASD participants, except three, were above this cutoff; these three participants had ADOS scores that were well within the clinical range, and were judged to carry an ASD diagnosis by expert clinicians.
Discussion
This study examined the production of fillers in spontaneous speech among individuals with high-functioning ASD, optimal outcomes, and typical development. There were two primary goals: to test for group differences in the frequency of uh and um production and to probe possible factors underlying filler production, including social, executive, and general language abilities. Given the pragmatic role that fillers play, ASD participants were expected to produce uh and um (particularly um) less frequently than their TD peers, and uh and um production were expected to correlate with ASD symptomatology per se rather than executive functions or language ability. Results supported these hypotheses.
Although there were no group differences for uh production, the ASD participants produced significantly fewer ums than their TD and OO peers, and were also less likely to produce um at all (10 times less likely then TD peers, and 5 times less likely than OO peers). This finding is consistent with a report by Lake et al. (2011), and substantiates prior research suggesting that fillers are unique among disfluencies, serving a pragmatic, listener-oriented function. Given that people with ASD are generally less able to account for their listener’s perspective and constrain their discourse to meet social goals (Colle, Baron-Cohen, Wheelwright, & van der Lely, 2008; Paul, Orlovski, Marcinko, & Volkmar, 2009), it is consistent that they utilize this filler as a pragmatic conversational cue less frequently than their TD peers.
It was particularly interesting that this pattern applied specifically to um. Because uh and um appear in complementary distribution, speakers may use them to convey distinct information. Um has a more marked phonological construction than uh, which is produced with a ‘reduced’ schwa (see Clark & Fox Tree, 2002). In essence, um may be more deliberately produced and reflect more explicit discourse meanings than uh. Consistent with this suggestion, the current findings indicate that uh serves a self-directive, inward-oriented function, whereas um serves a communicative, listener-oriented function. In other words, these results could be taken as evidence that filled uh pauses are produced to serve a speaker’s needs, whereas filled um pauses are produced specifically for the benefit of a listener.
Despite substantial participant overlap, the current study findings contrast with a prior report from Suh et al. (2014), which used a narrative task. Although filler rates in Suh et al. (2014) trended in the expected direction, with OO and TD participants producing more fillers than those with ASD, this difference did not reach statistical significance. One possible explanation for the discrepancy is differing task demands. In the previous study, participants generated a narrative from a picture book without additional cognitive load or time constraint. In the current study, by contrast, participants freely produced descriptions of six discrete unrelated images under mild cognitive load (tapping the index finger as rapidly as possible) and time constraint. At least one study has found that speakers produce more fillers when choosing from a larger range of expressive options due to less constrained task parameters (Schachter et al., 1991). It is therefore possible that the task in the current study more robustly elicited fillers, and that floor effects contributed to the lack of group differences found previously. Buttressing this explanation, filler rates even in the TD group were quite low in Suh et al. (2014), with 1.03 fillers per 100 words; there was a threefold increase in fillers (3.30 fillers per 100 words) in the current study, possibly reflecting the greater cognitive demand.
The current study elucidates not only the use of um in spontaneous speech among individuals with ASD, but also those who have achieved an optimal outcome. The greater frequency of um production in OO, at rates comparable to TD, suggests that optimal outcomes are marked by the normalization of subtle listener-oriented pragmatic cues during spontaneous speech. This finding contributes to the current literature suggesting a broader normalization of language abilities in OO, particularly in the pragmatic domain.
An evaluation of a possible mechanism underlying filler production indicated that domain-general cognitive processes did not drive individual differences in filler production. Executive functions broadly, including verbal fluency specifically, as well as general language ability, were not associated with um rate in any group, despite significant within-group variability. This finding is consistent with Engelhardt et al. (2011) and Engelhardt et al. (2013), who found no association between executive dysfunction and filler production, despite an association with other disfluencies. In contrast, greater ASD severity was associated with reduced um production. These findings suggest that, in ASD, underproduction of um relates specifically to core social deficits rather than executive dysfunction or general language deficits. One might therefore predict that these findings are specific to ASD, and that individual with other neurodevelopmental disorders involving language disorder but not pragmatic impairments, such as specific language impairment or intellectual disability, would produce fillers, especially um, at a normative rate. This is a question for future research.
There are at least two explanations for the association of symptom severity and um rates. First, because people with ASD show decreased attention to social cues, they may fail to develop an implicit understanding of the social meaning of fillers. Reduced um production, then, would reflect a reduced understanding of pragmatic cues in general. A second possibility is that people with ASD do comprehend the social meaning of fillers in conversation, but have difficulty employing these cues to meet social goals. Future studies employing visual world paradigms (e.g. Huettig, Rommers, & Meyer, 2011) could help investigate whether fillers influence the anticipation of novel referents in ASD, thereby addressing this competence versus performance question.
The present findings also may have interesting implications for our understanding of one of the most noticeable characteristics of ASD, atypical speech qualities (Mesibov, 1992). Speech is often described as ‘mechanical’ or ‘stilted.’ Given the apparent social nature of um in conversation, the decreased production of um in ASD may factor into this stilted or ‘pedantic’ speech quality. Indeed, while clinical impression finds ubiquitous abnormal prosodic in ASD, studies report quantifiable prosodic deficits in only 50% of participants (Paul et al., 2005; Shriberg et al., 2001). Interestingly, studies suggest that fillers possess signature prosodic characteristics, even across tonal and non-tonal languages (i.e., monolingual English-speaking listeners are able to recognize fillers in German and Mandarin; Lai, Gorman, Yuan, & Liberman, 2007). It is possible that the absence of this prosodic particle (um) – an absence not typically measured in studies of prosody – that contributes to the perception of atypical speech quality.
There were several limitations to this study. First, the speech samples consisted of monologues rather than dialogues. While studies have reported that fillers are produced in both contexts (Clark & Fox Tree, 2002), this method may be less representative of everyday communication. Note that, because the social demands of monologues are lower, this method should theoretically advantage the ASD group, reducing the likelihood of group differences. A second limitation is the brevity of the speech samples (60 seconds total, produced in a single discourse context). Although findings were robust, it would be informative to examine filler production across variety of rhetorical and conversational contexts. Further, the current study focused on American English; findings may not generalize across languages. Finally, and perhaps most importantly, individuals in the OO group were not evaluated longitudinally, making it impossible to determine OO was characterized by normative um production early in development or whether it ‘emerged’ as other symptoms remitted.
In summary, the current findings contribute both to our understanding of filler disfluencies as pragmatic cues, and to our understanding of optimal outcomes from ASD. First, these results suggest that the filler um serves a uniquely pragmatic, listener-oriented function, as its prevalence in spontaneous speech is linked to core social competence. Additionally, the normative production of this pragmatic marker among OO individuals suggests a fundamental improvement of social communication, substantiating the possibility of true normalization of function in some individuals with well-documented ASD.
Acknowledgments:
This research was supported by a grant from National Institutes of Mental Health (R01 MH076189) to D.F. We would like to thank Alyssa Orenstein, Eva Troyb, Katherine Tyson, Michael Rosenthal, and Molly Helt for their assistance with data collection, Allison Fitch, Sydney Seese, and Erica Crowley for their assistance with transcription, and the parents and children who participated in this study.
References
- American Psychiatric Association. (2000). Diagnostic and statistical manual of mental disorders IV-TR (IV-TR ed.). Washington, DC: American Psychiatric Association. [Google Scholar]
- Arnold JE, Fagnano M, & Tanenhaus MK (2003). Disfluencies signal theee, um, new information. Journal Psycholinguistic Research, 32(1), 25–36. [DOI] [PubMed] [Google Scholar]
- Arnold JE, Hudson Kam CL, & Tanenhaus MK (2007). If you say thee uh you are describing something hard: The on-line attribution of disfluency during reference comprehension. Journal of Experimental Psychology: Learning, Memory, and Cognition, 33(5), 914–930. doi: 10.1037/0278-7393.33.5.914 [DOI] [PubMed] [Google Scholar]
- Arnold JE, Tanenhaus MK, Altmann RJ, & Fagnano M (2004). The old and thee, uh, new: disfluency and reference resolution. Psychological Science, 15(9), 578–582. [DOI] [PubMed] [Google Scholar]
- Barr DJ, & Seyfeddinipur M (2010). The role of fillers in listener attributions for speaker disfluency. Language and Cognitive Processes, 25(4), 441–455. doi: 10.1080/01690960903047122 [DOI] [Google Scholar]
- Bortfeld H, Leon SD, Bloom JE, Schober MF, & Brennan SE (2001). Disfluency rates in conversation: effects of age, relationship, topic, role, and gender. Language and Speech, 44(2), 123–147. [DOI] [PubMed] [Google Scholar]
- Brennan SE, & Williams M (1995). The feeling of another’s knowing: Prosody and filled pauses as cues to listeners about the metacognitive states of speakers. Journal of Memory and Language, 34, 383–398. [Google Scholar]
- Clark HH, & Fox Tree J (2002). Using uh and um in spontaneous speaking. Cognition, 84(1), 73–111. [DOI] [PubMed] [Google Scholar]
- Colle L, Baron-Cohen S, Wheelwright S, & van der Lely HK (2008). Narrative discourse in adults with high-functioning autism or Asperger syndrome. Journal of Autism and Developmental Disorders, 38(1), 28–40. doi: 10.1007/s10803-007-0357-5 [doi] [DOI] [PubMed] [Google Scholar]
- Delis DC, Kaplan E, & Kramer JH (2001). Delis-Kaplan Executive Function System (D-KEFS) Examiner’s Manual. San Antonio, TX: The Psychological Corporation. [Google Scholar]
- Dennis M, Francis DJ, Cirino PT, Schachar R, Barnes MA, & Fletcher JM (2009). Why IQ is not a covariate in cognitive studies of neurodevelopmental disorders. Journal of the International Neuropsychological Society, 15, 1–13. [DOI] [PMC free article] [PubMed] [Google Scholar]
- Engelhardt PE, Ferreira F, & Nigg JT (2011). Language production strategies and disfluencies in multi-clause network descriptions: a study of adult attention-deficit/hyperactivity disorder. Neuropsychology, 25(4), 442–453. doi: 10.1037/a0022436 [DOI] [PMC free article] [PubMed] [Google Scholar]
- Engelhardt PE, Nigg JT, & Ferreira F (2013). Is the fluency of language outputs related to individual differences in intelligence and executive function? Acta Psychologica, 144(2), 424–432. doi: 10.1016/j.actpsy.2013.08.002 [DOI] [PMC free article] [PubMed] [Google Scholar]
- Fein D, Barton M, Eigsti IM, Kelley E, Naigles L, Schultz RT, … Tyson K (2013). Optimal outcome in individuals with a history of autism. Journal of Child Psychology and Psychiatry 54(2), 195–205. [DOI] [PMC free article] [PubMed] [Google Scholar]
- Gioia GA, Isquith PK, Guy SC, & Kenworthy L (2000). Behavior rating inventory of executive function. Child Neuropsychology, 6(3), 235–238. [DOI] [PubMed] [Google Scholar]
- Goodwin MH, & Goodwin C (1986). Gesture and coparticipation in the activity of searching for a word. Semiotica: Journal of the International Association for Semiotic Studies/Revue de l’Association Internationale de Sémiotique, 62(1–2), 51–75. [Google Scholar]
- Griffin Z, & Spieler D (2006). Observing the what and when of language production for different age groups by monitoring speakers’ eye movements. Brain and Language, 99(3), 272–288. [DOI] [PMC free article] [PubMed] [Google Scholar]
- Huettig F, Rommers J, & Meyer AS (2011). Using the visual world paradigm to study language processing: A review and critical evaluation. Acta Psychologica, 137(2), 151–171. doi: 10.1016/j.actpsy.2010.11.003 [DOI] [PubMed] [Google Scholar]
- Kelley E, Naigles L, & Fein D (2010). An in-depth examination of optimal outcome children with a history of autism spectrum disorders. Research in Autism Spectrum Disorders, 4, 526–538. [Google Scholar]
- Kelley E, Paul JJ, Fein D, & Naigles LR (2006). Residual language deficits in optimal outcome children with a history of autism. Journal of Autism and Developmental Disorders, 36(6), 807–828. [DOI] [PubMed] [Google Scholar]
- Kidd C, White KS, & Aslin RN (2011). Toddlers use speech disfluencies to predict speakers’ referential intentions. Developmental science, 14(4), 925–934. [DOI] [PMC free article] [PubMed] [Google Scholar]
- Lai C, Gorman K, Yuan J, & Liberman M (2007). Perception of disfluency: Language differences and listener bias. Paper presented at the Annual Conference of the International Speech Communication Association, Antwerp, Belgium. [Google Scholar]
- Lake JK, Humphreys KR, & Cardy S (2011). Listener vs. speaker-oriented aspects of speech: Studying the disfluencies of individuals with autism spectrum disorders. Psychonomic Bulletin & Review, 18(1), 135–140. [DOI] [PubMed] [Google Scholar]
- Lord C, Rutter M, DiLavore PC, & Risi S (2002). Autism Diagnostic Observation Schedule (ADOS). Los Angeles: Western Psychological Services. [Google Scholar]
- Maclay H, & Osgood CE (1959). Hesitation phenomena in spontaneous English speech. Word-Journal of the International Linguistic Association, 15(1), 19–44. [Google Scholar]
- Mesibov G (1992). Treatment issues with high-functioning adolescents and adults with autism In Schopler E & Mesibov G (Eds.), High-Functioning Individuals with Autism (pp. 143–156). New York: Plenum Press. [Google Scholar]
- Oviatt SL (1995). Predicting spoken disfluencies during human–computer interaction. Computer Speech & Language, 9(1), 19–35. [Google Scholar]
- Paul R, Orlovski SM, Marcinko HC, & Volkmar F (2009). Conversational behaviors in youth with high-functioning ASD and Asperger syndrome. Journal of Autism and Developmental Disorders, 39(1), 115–125. [DOI] [PMC free article] [PubMed] [Google Scholar]
- Paul R, Shriberg L, McSweeney J, Cicchetti D, Klin A, & Volkmar F (2005). Relations between prosodic performance and communication and socialization ratings in high functioning speakers with autism spectrum disorders. Journal of Autism and Developmental Disorders, 35(6), 861–869. [DOI] [PubMed] [Google Scholar]
- Plexico LW, Cleary JE, McAlpine A, & Plumb AM (2010). Disfluency characteristics observed in young children with autism spectrum disorders: A preliminary report. SIG 4 Perspectives on Fluency and Fluency Disorders, 20(2), 42–50. [Google Scholar]
- Rutter M, Bailey A, & Lord C (2003). The Social Communication Questionnaire (SCQ). Los Angeles: Western Psychological Services. [Google Scholar]
- Schachter S, Christenfeld N, & Ravina B (1991). Speech disfluency and the structure of knowledge. Journal of Personality and Social Psychology, 60(3), 362–367. [Google Scholar]
- Semel E, Wiig EH, & Secord WA (2003). Clinical Evaluation of Language Fundamentals (4th ed.). San Antonio, TX: Harcourt Assessment, Inc. [Google Scholar]
- Shriberg EE (1994). Preliminaries to a theory of speech disfluencies, University of California. [Google Scholar]
- Shriberg LD, Paul R, Black LM, & van Santen JP (2011). The hypothesis of apraxia of speech in children with autism spectrum disorder. Journal of Autism and Developmental Disorders, 41(4), 405–426. [DOI] [PMC free article] [PubMed] [Google Scholar]
- Shriberg LD, Paul R, McSweeny JL, Klin AM, Cohen DJ, & Volkmar FR (2001). Speech and prosody characteristics of adolescents and adults with high-functioning autism and Asperger syndrome. Journal of Speech, Language, and Hearing Research, 44(5), 1097–1115. [DOI] [PubMed] [Google Scholar]
- Shrout PE, & Fleiss JL (1979). Intraclass correlations: uses in assessing rater reliability. Psychological Bulletin, 86(2), 420. [DOI] [PubMed] [Google Scholar]
- Smith VL, & Clark HH (1993). On the course of answering questions. Journal of Memory and Language, 32, 25–38. [Google Scholar]
- Sparrow SS, Cicchetti DV, & Balla DA (2005). Vineland Adaptive Behavior Scales, Second Edition (Vineland-II) Circle Pines, MN: AGS Publishing. [Google Scholar]
- Suh J, Eigsti IM, Naigles L, Barton M, Kelley E, & Fein D (2014). Narrative Performance of Optimal Outcome Children and Adolescents with a History of an Autism Spectrum Disorder (ASD). Journal of Autism and Developmental Disorders, 6, 6. [DOI] [PMC free article] [PubMed] [Google Scholar]
- Wechsler D (1999). Manual for the Wechsler Abbreviated Scale of Intelligence (1 ed.). New York: Pearson Psychological Corporation. [Google Scholar]