

Abstract
Quantitative assessment of the material properties of ocular tissues can provide valuable information for investigating several ophthalmic diseases. Quantitative acoustic microscopy (QAM) offers a means of obtaining such information, but few QAM investigations have been conducted on human ocular tissue. We imaged the optic nerve (ON) and iridocorneal angle in 12-μm deparaffinized sections of the human eye using a custom-built acoustic microscope with a 250-MHz transducer (7-μm lateral resolution). The two-dimensional QAM maps of ultrasound attenuation (α), speed of sound (c), acoustic impedance (Z), bulk modulus (K), and mass density (ρ) were generated. Scanned samples were then stained and imaged by light microscopy for comparison with QAM maps. The spatial resolution and contrast of scanning acoustic microscopy (SAM) maps were sufficient to resolve anatomic layers of the retina (Re); anatomic features in SAM maps corresponded to those seen by light microscopy. Significant variations of the acoustic parameters were found. For example, the sclera was 220 MPa stiffer than Re, choroid, and ON tissue. To the authors’ knowledge, this is the first systematic study to assess c, Z, K, ρ, and α of human ocular tissue at the high ultrasound frequencies used in this study.
Keywords: scanning acoustic microscopy (SAM), speed of sound, acoustic impedance, 250-MHz ultrasound, optic nerve, sclera, choroid, human eye
Introduction
Many ocular diseases are associated with significant mechanical property alteration of various tissues in the human eye. Myopia (i.e., nearsightedness) manifests in changes of scleral material properties. The sclera (Sc) is a collagen-rich tissue giving the eye its stability and form. Myopic eyes show weaker, more flexible Sc, which may be caused by decreased scleral collagen synthesis and increased collagen degradation.1,2 Increased ocular rigidity is associated with the development of glaucoma3 and increased scleral stiffness is correlated with the development of glaucoma and with age.4,5 The biomechanical model of glaucoma posits that the difference between intraocular and intracranial pressure contributes to permanent excavation of optic nerve (ON) head,6–8 which is a defining clinical feature of glaucoma.9,10 This process is mainly mediated by the biomechanical properties of the Sc (especially near the ON head) and lamina cribrosa (LC), a mesh-like structure that the ON passes through in traversing the Sc. In neovascular age-related wet macular degeneration (AMD), choroidal vessels penetrate Bruch’s membrane and enter the retina (Re). Bruch’s membrane is an acellular basement membrane consisting of elastin and collagen sandwiched between the Re and choroid (Ch). The membrane undergoes alterations in thickness and elastin organization in the macular region in AMD.9 The elastic modulus of the cellular environment influences cell proliferation,11 and thus the biomechanical properties of Bruch’s membrane may play a role in AMD. A study of excised Bruch’s membranes demonstrated increasing stiffness with age, although changes in AMD were not demonstrated in this small study (n = 13).12
The studies above suggest that the cited disorders occur concomitantly with changes in the local mechanical properties of ocular tissue. Therefore, we hypothesize that a key for developing new treatment options and diagnostic tools for ophthalmological diseases will be assessing the relationship between disease and micromechanical tissue properties. Such information could be used to develop novel high-frequency ultrasonic13–16 or ultrasound biomicroscopy devices17–21 that are sensitive to microstructural and micromechanical changes of tissue properties. For example, Ye et al.22 used a wideband, 60-MHz transducer in an ex vivo study to evaluate the acoustic properties of human ocular tissues including Sc, cornea, ciliary body and iris quantitatively. In their study, B-mode images from backscattered signals exhibit alignment of collagen fibers and acoustic properties (i.e., speed of sound, attenuation and backscatter coefficient) varied significantly between different tissue types. A few studies have been already reported on the direct assessment of elastic properties, using novel technologies, such as acoustic radiation force impulse imaging or sequential ultrasound imaging.23,24 Shahbazi et al.24 found a significant (i.e., 148%) increase in the elastic modulus of the posterior wall in AMD.
Although these studies emphasize the necessity of assessing the mechanical properties of ocular tissue, hardly any data at the micrometer scale are available, and only a few methods exist to acquire them. Scanning acoustic microscopy (SAM), which uses ultrasound frequencies between 100 MHz and 1.5 GHz, has become a reliable tool for assessing acoustical properties such as speed of sound (c) and acoustic impedance (Z), which are related to the elastic properties of the tissue. SAM was applied successfully to characterizing various soft tissues and disease sta tes.25–35 However, only a few studies have reported SAM measurements for ocular tissues. In a previous study by our group, we reported fine-resolution, acoustical-property maps of the murine Re at a 250-MHz center frequency.36 The results suggested that layers of the murine Re have significantly different mechanical and acoustical properties, which might have important implications for retinal disease pathogenesis. In another study,37 we presented a novel acoustic microscope operating at 500 MHz and demonstrated the feasibility of measuring mechanical properties of soft tissues at ultrafine (~4 μm) resolution. In that study, we measured sections of human eyes at the ON and cornea. Although results were intriguing by showing material property variations on the cellular level, the study focused on the engineering aspects of the new 500-MHz system and therefore, the number of samples was too small to infer statistically meaningful conclusions about ocular tissue properties. In another study by Beshtawi et al.,38 the speed of sound of cross-linked corneas was compared with controls at the micron level using a 761-MHz transducer. The results of that study show that the speed of sound in the cross-linked cases was higher than in the untreated cases.
SAM has the potential to assess the mechanical properties (i.e., bulk modulus and mass density) at very fine resolutions by determining the speed of sound, attenuation, and acoustic impedance in a single measurement. However, most previous SAM studies fail to assess all these parameters at once and hence cannot give a full description of the mechanical tissue properties. In our previous work,37 we provided a complete description of a signal-processing algorithm that allows assessment of all three acoustic properties in a single measurement. The present paper uses the same approach to systematically determine the micromechanical properties of the ON and iridocorneal angle regions (ARs) that play key roles in ocular disorders, especially in glaucoma.
Materials and Methods
Specimen and Sample Preparation
Six eyes of three individuals with no known ocular disease were obtained postmortem from anonymous donors through the North Carolina Eye Bank (Winston-Salem, North Carolina). Whole eyeswere fixed with a mixture of 4% paraformaldehyde, 16.8% isopropyl alcohol, 2% trichloroacetic acid, and 2% zinc chloride in a phosphate buffer for 24 hours at 4°C. The superior aspect of the eye was marked and the whole eyecups were embedded in paraffin and adjacent 3-μm- and 12-μm-thick sections were taken. The thickness for the SAM experiments (i.e., 12-μm sections) was determined in previous studies and was optimal for the applied signal-processing methods and transducer beam properties.36,39
The sections were transferred to glass microscope slides precoated in poly-l-lysine. When slides were ready for examination, they were deparaffinized in Histo-Clear (National Diagnostics, Atlanta, Georgia; twice for 5 minutes), and rehydrated in 100% ethanol (twice for 5 minutes), 75% ethanol (5 minutes), and normal saline (5 minutes). Samples were transferred immediately to SAM for scanning after the last 5 minutes in saline. After acoustic microscopy measurements were taken, the 12- and 3-μm sections were stained using hematoxylin and eosin (H&E), and histology was analyzed by light microscopy.
Acoustic Microscopy
A custom-built SAM system with a 250-MHz center-frequency transducer (Fraunhofer IMBT, St. Ingbert, Germany) was used for this study. A detailed description of the system, working principle, a photo of the setup and a block diagram can be found in our previous publications.36,37 Briefly, the F-number of the transducer was 1.16, the radius of curvature was 450 μm, the −6-dB bandwidth was 170 MHz, the lateral resolution (−6-dB beam width) was 7 μm, and depth of field was 72 μm. The microscope slide was mounted on a three-axis, high-precision scanning stage (Newport, Irvine, California) and the samples were raster scanned using an increment of 2 μm. A 300-MHz monocycle pulser (GZ1120ME-03, GEOZONDAS, Vilnius, Lithuania) was used to generate and receive ultrasonic signals. The radiofrequency (RF) signals were amplified (AU-1114-BNC, MITEQ, Hauppauge, New York) and digitized at 2.5 GHz with 12-bit accuracy using an oscilloscope (HDO6104, Teledyne LeCroy, Chestnut Ridge, New York). All components were controlled by custom-built LabVIEW (National Instruments, Austin, TX) software. Figure 1 shows a signal measured with the device at the focus from a planar reflector. For all experiments, a drop of degassed and filtered water was used as coupling medium. To estimate speed of sound, the temperature of the water drop was measured before and after each SAM measurement by thermocouples.
Figure 1.
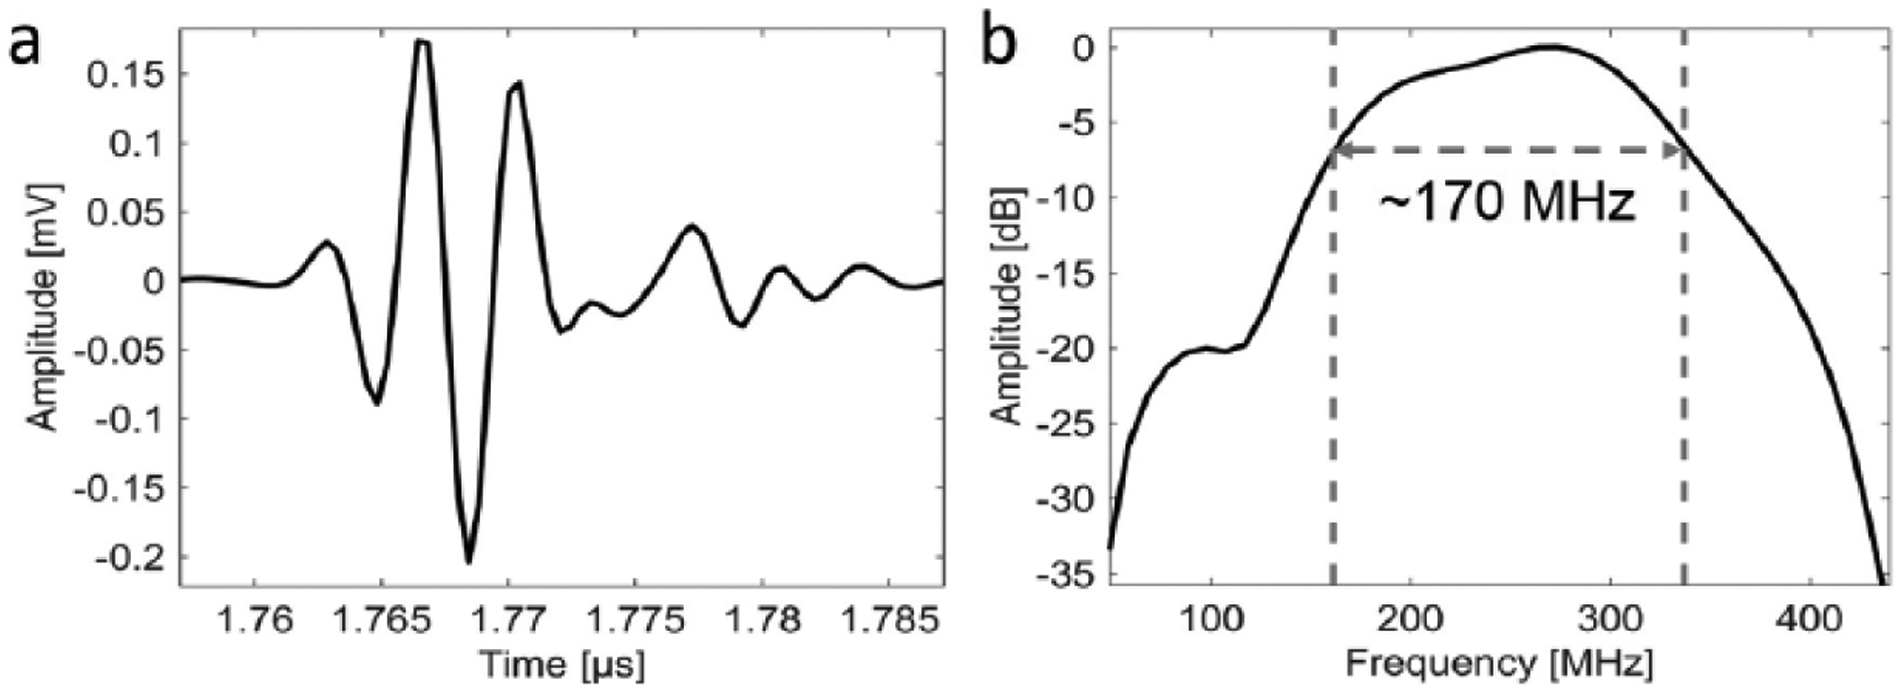
Plots of signal at focus from (a) a planar reflector and (b) the corresponding power spectrum.
Two different locations were selected for each eye, which are the iridocorneal AR and the optic nerve region (ONR). The scanned area did not exceed 4 mm2. For each eye and location, two slides were scanned thus leading to a total of 24 scans. The time to scan one sample of about 2 mm2 was approximately 20 minutes.
Signal and Data Processing
Our signal and data processing methods were described in detail in our previous paper.37 We developed a model-based approach similar to the procedures described by Hozumi et al.26 RF data recorded at locations where tissue is attached to the glass plate are expected to exhibit two reflected signals, which originate from the sample surface and from the sample–glass plate interface. The amplitude of the first reflection is directly related to the acoustic impedance (Z) of the coupling fluid and the tissue. The amplitude of the second signal depends on the attenuation (α) within the sample and the impedance mismatch at the water-sample and sample-glass-plate interfaces. The time difference between the signals is determined by the speed of sound (c) in the tissue and the thickness (d) of the sample section. By using a reference signal acquired at a location without tissue (i.e., only signal from the glass plate), we demonstrated that all three acoustic parameters can be derived independently for each RF signal.
The material properties, mass density (ρ in g/cm3) and bulk modulus (K in GPa), were calculated from c and Z for each pixel location using ρ = Z / c and K = c · Z.40 In a final postprocessing step, a median filter using a 3 × 3 pixel kernel (i.e., 6 × 6 μm) was used to obtain the two-dimensional (2D) acoustical parameter maps. All signal-processing methods were implemented using MATLAB (The MathWorks Inc., Natick, Massachusetts). Thresholds for the acoustical parameters were used to remove unrealistic values of acoustic property estimates. Specifically, pixels were removed if c < 1485 m/s or c > 1800 m/s or Z < 1.5 MRayl or Z > 2 MRayl or d < 7 μm or d > 15 μm. (On average, less than 5% of the pixels of a full sample were removed.)
By plotting the amplitude of the sample–glass slide interface, another 2D-parameter map was derived. Although a quantitative interpretation of this amplitude map is difficult, being dependent on both attenuation and acoustic impedance, our previous work showed that the amplitude maps provide a good overall representation of tissue morphology.
Statistics and Data Evaluation
Photomicrographs of adjacent H&E-stained histologic sections were digitized and manually registered to the amplitude maps. Rectangular regions of interest (ROIs, n = 5) were manually selected according to different tissue types. Based on the light microscopy images, we identified five different tissue types for each scan location that were also visible in the SAM amplitude images. For ONR, we identified the LC, ON tissue, Ch, Re, and Sc. For AR, we identified trabecular meshwork (TrM), ciliary body muscle (CM), pigment layer (PL) and processes (Pr), and the Sc. Except for Sc at the AR, five equally sized ROIs were selected randomly within the tissue for each tissue type. To study parameter variation from anterior to posterior Sc, we divided Sc at the AR into three equally sized layers of outer (Sc1), center (Sc2), and inner (Sc3) layer. In each layer, four ROIs were manually selected.
The ROIs were used to derive descriptive statistics (i.e., mean and standard deviation) for all acoustical parameters (i.e., Z, α, B, c, ρ). N-way analysis of variance (ANOVA) followed by post hoc multicomparison Tukey–Kramer tests was used to evaluate the impact of tissue type and sample specific effects on the derived acoustical parameters. Statistical results were considered significant for p values less than 0.05. Relationships between the acoustical properties were assessed using linear-regression analysis. All data points of the 2D-parameter maps were included in the regression analysis. The statistical computations were conducted using the MATLAB Statistics Toolbox (The MathWorks Inc.).
Results
Image Registration
Ultrasound amplitude maps were successfully registered to the H&E-stained photomicrographs of adjacent sections. Figure 2 shows registered images of AR (a and b) and ONR (c and d). The amplitude-image contrast of the unstained sections shows similar structures as the H&E-stained sections. For example, Sc, CM, TrM, Pr, and PL can be distinguished in the AR. Similarly, LC, Sc, Re, and ON tissue in the ONR are visible.
Figure 2.

(a and c) Scanning acoustic microscopy (SAM) amplitude images co-registered with (b and d) hematoxylin and eosin (H&E)–stained light microscopy images of adjacent sections. (a and b) Angle region (AR) with iris (Ir); trabecular meshwork (TrM), sclera (Sc), ciliary muscle (CM), processes (Pr), pigment layer (PL), (c and d) optic nerve region (ONR) with retina (Re), choroid (Ch), sclera (Sc), lamina cribrosa (LC), and optic nerve (ON).
Quantitative Parameter Estimation
Figure 3 shows 2D-parameter maps (i.e., K, ρ, and α) of the same samples depicted in Figure 2. Excluded and background (regions without sample) values are indicated in dark blue. The contrast of these parameter maps is related to different tissue types of the scanned regions. For example, the Sc is the stiffest, most dense, and most attenuating tissue.
Figure 3.

Material property maps of AR (a-c), ONR (d-f), with properties K (a and d), mass density (b and e), and attenuation (c and f) from the same samples depicted in Figure 2. AR = angle region; ONR = optic nerve region; Ir = iris; TrM = trabecular meshwork; Sc = sclera; CM = ciliary muscle; PL = pigment layer; Re = retina; Ch = choroid; Sc = sclera; LC = lamina cribrosa; ON = optic nerve.
Tables 1 and 2 summarize average parameters obtained for each measurement location (i.e., AR and ONR) and provide an overview of statistical differences between the various tissue types. Among the stiffer tissues are Sc (2.71 GPa at AR and 2.79 GPa at the ONR), PL (2.72 GPa), and LC (2.67). The bulk modulus of TrM is significantly lower (2.62 GPa) than that of the adjacent Sc tissue. ON, Re, and Ch tissue did not show a significant variation in bulk modulus. The overall variation of mass density is relatively small, ranging from 0.98 to 1.05 g/cm3. The most dense materials are Sc, TrM, and PL with ρ(Sc) = 1.03 g/cm3 at the AR, ρ (Sc) = 1.05 g/cm3 at the ONR, ρ(TrM) = 1.02 g/cm3, and ρ(PL) = 1.01 g/cm3. Analysis of LC, Re, ON, and Ch revealed no significant variations between the tissue types. PL, TrM, and Sc were the most attenuating tissues, with more than 9 dB/MHz/cm. The least attenuating tissues were Re, ON, and Pr, with less than 4 dB/MHz/cm. Parameter variations of Z and c are redundant as ρ and K are derived from Z and c.
Table I.
Average Parameters for Tissue Types at AR.
| Tissue | K (GPa) | Z (MRayl) | α (dB/cm/MHz) | c (m/s) | ρ (g/cm3) | n | |||||
|---|---|---|---|---|---|---|---|---|---|---|---|
| TrM | 2.62‡ | ±0.17 | 1.64‡ | ±0.05 | 10.53† | ±3.01 | 1600* | ±58 | 1.02‡ | ±0.02 | 35 |
| CM | 2.55* | ±0.10 | 1.58* | ±0.02 | 6.05‡ | ±1.56 | 1610* | ±52 | 0.98* | ±0.03 | 35 |
| PL | 2.72† | ±0.17 | 1.66‡ | ±0.06 | 9.46† | ±3.21 | 1642† | ±57 | 1.01‡ | ±0.03 | 35 |
| Pr | 2.49* | ±0.11 | 1.57* | ±0.02 | 3.44* | ±1.93 | 1586* | ±61 | 0.99* | ±0.03 | 35 |
| Sc | 2.71† | ±0.13 | 1.67† | ±0.06 | 11.70† | ±2.99 | 1618‡ | ±46 | 1.03† | ±0.04 | 72 |
Values are in means ± standard deviations. Material properties (i.e., K, Z, α, c, ρ, n) of different tissue types (i.e., TrM, CM, PL, Pr, Sc) with different symbols (i.e., *, ‡, and †) have significant different mean values (i.e., p < 0.05). For example, bulk modulus of Pr (~2.49* GPa) is significantly smaller than that of Sc (~2.71† GPa). AR = angle region; TrM = trabecular meshwork; CM = ciliary muscle; PL = pigment layer; Pr = processes; Sc = sclera.
Table 2.
Average Parameters for Tissue Types at ONR.
| Tissue | K (GPa) | Z (MRayl) | α (dB/cm/MHz) | c (m/s) | ρ (g/cm3) | n | |||||
|---|---|---|---|---|---|---|---|---|---|---|---|
| LC | 2.67‡ | ±0.11 | 1.62† | ±0.02 | 6.22‡ | ±2.03 | 1655‡ | ±57 | 0.98* | ±0.03 | 35 |
| ON | 2.53* | ±0.10 | 1.57* | ±0.02 | 3.99* | ±1.27 | 1611* | ±57 | 0.98* | ±0.03 | 35 |
| Ch | 2.57* | ±0.11 | 1.59‡ | ±0.02 | 6.95‡ | ±2.08 | 1612* | ±63 | 0.99* | ±0.04 | 35 |
| Re | 2.54* | ±0.10 | 1.57* | ±0.01 | 3.56* | ±1.21 | 1618* | ±58 | 0.97* | ±0.03 | 35 |
| Sc | 2.79† | ±0.11 | 1.71× | ±0.05 | 9.94† | ±2.02 | 1629* | ±53 | 1.05‡ | ±0.05 | 35 |
Values are in means ± standard deviations. Material properties (i.e., K, Z, α, c, ρ, n) of different tissue types (i.e., LC, ON, Ch, Re, Sc) with different symbols (i.e., *, ‡, †, and ×) have significant different mean values (i.e., p < 0.05). For example, bulk modulus of Re (~2.54* GPa) is significantly smaller than that of Sc (~ 2.79† GPa). ONR = optic nerve region; LC = lamina cribrosa; ON = optic nerve; Ch = choroid; Re = retina; Sc = sclera.
Figure 4 shows variations of K and ρ with respect to location in the Sc (i.e., from outer to inner). ANOVA revealed that K and ρ is significantly stiffer and denser in the posterior sections. Mean and average values are summarized in Table 3. Except of c (variations are not significant), the other acoustic parameters, Z and α follow the same trend.
Figure 4.

Variation of K (a) and ρ (b) from outer to inner sclera at AR. AR = angle region.
Table 3.
Average Parameters for Sclera Layers at AR.
| Layer | K (GPa) | Z (Mrayl) | α (dB/cm/MHz) | c (m/s) | ρ (g/cm3) | n | |||||
|---|---|---|---|---|---|---|---|---|---|---|---|
| 1 | 2.64* | ±0.12 | 1.63* | ±0.04 | 10.11* | ±2.88 | 1617* | ±40 | 1.01* | ±0.02 | 24 |
| 2 | 2.68* | ±0.10 | 1.67‡ | ±0.03 | 11.73* | ±2.64 | 1606* | ±47 | 1.04‡ | ±0.03 | 24 |
| 3 | 2.81‡ | ±0.11 | 1.72† | ±0.05 | 13.40‡ | ±2.55 | 1632* | ±48 | 1.06‡ | ±0.05 | 24 |
Values are in means ± standard deviations. Material properties (i.e., K, Z, α, c, ρ, n) of different layers (i.e., 1, 2, 3) with different symbols (i.e., *, ‡, and †) have significant different mean values (i.e., p < 0.05). For example, the bulk modulus of Layer 1 (~2.64* GPa) is significantly smaller than the bulk modulus of Layer 3 (~2.81‡ GPa). AR = angle region.
Discussion
The current study demonstrates a suitable method for ex vivo assessment of the material properties of thin sections of ocular tissues. To the best of the authors’ knowledge, this study presents the first systematic survey of micromechanical and acoustical properties of human ocular tissue. As expected from the theoretical 7-μm lateral resolution of the 250-MHz transducer, our system is able to resolve the microanatomy and characterize the material properties of different tissue types that are expected to play an important role in eye disorders.
In contrast to most other studies dealing with acoustic microscopy of soft tissues,25–33 we were able to estimate c and Z from a single measurement. This allowed a direct pixel-by-pixel derivation of mechanical properties such as K and ρ. K is related to the Young’s modulus together with Poisson’s ratio (or shear modulus). Assessing the elastic properties of ocular tissues is currently the focus of many research studies because the elastic properties of ocular tissue are believed to be associated with several disease conditions. For example, scleral properties may be altered in high myopia and staphyloma.2,41 Studies suggest that significant changes in biomechanical properties of Sc and LC are associated with glaucoma development.42,43 A study by Chong et al.9 indicates that alterations in the elastic properties of Bruch’s membrane may be linked to AMD.
Biomechanical properties of excised ocular tissues, such as the Sc, have been investigated using a variety of techniques, the most common being strip extensiometry and inflation testing. Microcomputer-controlled strip-extensiometry devices, such as the Minimat 2000 (Rheometric Scientific GmbH, Bensheim, Germany), determine stress–strain relationships along one axis of clamped strips of the material being tested.44–46 Whole-eye inflation involves measuring deformation as a result of an increase in intraocular pressure, which induces a radial stress.47–50 In both techniques, elasticity measurements are made on bulk tissue, which precludes studying the contributions of fine-scale tissue components. These two methods also are subject to tissue-preparation artifacts and, in the case of strip extensiometry, boundary conditions related to clamping.
The new techniques developed in this study, though not immune to artifact, have several advantages compared with other current procedures because the new techniques offer a means of assessing biomechanical properties on a fine-resolution scale that allows investigation on a microscopic scale rather than on a macroscopic or bulk level.
Another possible application of the new technique would be the development and refinement of mechanical models of ultrasound wave propagation at lower frequencies. Quantitative ultrasound (QUS) measurements at frequencies of 10 to 40 MHz are well established and already are used clinically for evaluating the eye. However, a complete understanding of how ultrasound waves interact with ocular tissues is lacking and, in particular, biological structures at the cellular level responsible for ultrasound scattering remain to be identified. As demonstrated in our study, SAM at 250 MHz and higher potentially can provide a reliable tool to gain new insights into the micro-elastic and structural composition of ocular tissue. That information is crucial for an improved understanding of ultrasound–tissue interaction at lower frequencies (f ≤ 50 MHz). Ultrasound scattering is ultimately a scale (i.e., frequency)–dependent phenomenon, but under the Born (and other) approximations, ultrasound scattering is entirely determined by the spatial variations of the 3D autocorrelation function of the acoustic impedance.51–53 Because of the spatial resolution of the 2D impedance maps obtained using SAM, we should be able to better interpret ultrasound scattering at frequencies much lower than 250 MHz, potentially from 1 to at least 50 MHz. Therefore, our group is currently investigating the potential of applying QUS in vivo human eyes. The ability to differentiate tissue state (e.g., diseased and healthy) based on ultrasound scattering is related to the contrast resolution (i.e., acoustic property variations in relation to the ultrasound wave length) of the imaging system and is an important parameter when considering various applications.51 Hence, together with numerical simulations and proper inverse models, the information gained from SAM can lead to more accurate scattering models of ocular tissue, which could lead to novel ultrasound-based diagnostic approaches.
Our study shows that the amplitude images gave good contrast among different tissue types. However, the direct interpretation of amplitude contrast alone cannot reliably be linked to a single mechanical tissue property. In all our data, the signal-envelope magnitude was obtained from the second reflection, and it is affected by the following several interrelated factors: impedance mismatch at sample–water and sample–glass interfaces, attenuation effects caused by scattering and absorption, tissue thickness, and focusing and diffraction effects. Consequently, 2D maps of acoustic parameters such as c, α, Z, ρ, and K allow a more precise characterization of the material properties of the eye.
However, the reported absolute values should be interpreted with caution. In this initial study, we used fixed, paraffin-embedded samples. This method of tissue preparation provides easy and well-controlled sample handling compared with cryo-sectioning of unfixed tissue. However, during embedding, all water is replaced by paraffin and the sample must be rehydrated during the de-paraffinization protocol, which potentially could damage cells. Furthermore, the procedure used in this study required a fixation step prior to embedding, which alters the properties of collagen-rich tissues by generating cross-links. For example, in a study conducted by Beshtawi et al.,38 the authors used a 761-MHz transducer to determine speed of sound at the micrometer scale in cryo-sectioned corneas; this study compared cross-linked with control corneas and found a significant, 5% higher speed of sound in the cross-linked specimens. Preliminary data from an ongoing study by our group (data not shown) confirm the variation described in Beshtawi et al.38 Sc is a collagen-rich tissue very similar to corneal tissue. Hence, we expect a similar effect of speed of sound in our study. Accordingly, values reported in this study may not permit a direct translation to in vivo or even fresh ex vivo conditions. Furthermore, different tissue types (e.g., tissue with less collagen) might be affected differently by the sample preparation process. Nevertheless, results of the current study strongly suggest that acoustic and micromechanical maps can be derived at fine resolution from thin ocular tissue sections using a 250-MHz transducer. An alternative option to paraffin-embedded samples is to use cryo-sectioned specimens as successfully applied in other studies by our group.39,54 The ability of SAM to image soft tissues without the need for fixation and staining, which may alter the properties of the investigated tissue, is a strong advantage compared with other microscopy methods (e.g., light microscopy).
Attenuation slope values measured with our SAM may appear large, but cannot be assumed to be valid at lower frequencies (i.e., <150 MHz), because the frequency dependence of attenuation cannot be assumed to be linear over a large frequency range.55,56 Our estimation procedure assumes a linear model that provides very accurate attenuation values over the bandwidth of the used transducer (i.e., 165–335 MHz). To properly extrapolate the 250-MHz attenuation values to lower frequencies, we are working on novel estimation algorithms capable of providing parameters modeling nonlinear attenuation (e.g., the exponent of the frequency dependent attenuation).
Another factor that might cause a change of material properties is the sample-cutting process, which could alter the microstructure by producing disruptive shear forces. Caution is required while handling the very thin tissue samples. Earlier experiments (data not shown) revealed that keeping the samples in saline after de-paraffinizing and reducing the time between paraffin removal and measurement is crucial for obtaining reliable results. The material properties of the thin sections are altered easily by the irreversible effects of drying or long immersion in saline including cell shrinkage, swelling, or other damage.
Nevertheless, we expect that the reported values are only affected by a fixed offset because all specimens underwent the same treatment. This would still allow studying relative changes of acoustic properties as a function of disease type and stage. However, this possibility still needs to be investigated in more detail. One optional study would be to investigate the effect of embedding on the acoustic impedance and to measure and compare fresh samples using the same transducer. An experimental approach for such a study was suggested and tested by Saijo.57 The technique and apparatus presented in this study also allows such measurements, and we currently are conducting studies on human lymph nodes.58,59
Because of the 7-μm spatial resolution afforded by the 250-MHz transducer, the measured acoustic parameters may be influenced by a combination of unresolved structures (e.g., cell constituents). To examine these possible relations at a subcellular scale, measurements with higher frequencies can be used. We recently used a 500-MHz transducer in the scanning device described here to image ocular tissue.37 The results demonstrated a much finer resolution (~4 μm) that allowed resolving structures that are not visible when using the 250-MHz transducer. For example, the 500-MHz transducer allowed us to assess the mechanical properties of Bruch’s membrane, which is a thin (<4-μm) multilayered acellular structure situated between the highly vascular Ch and the retinal pigment epithelium. Furthermore, finer beams of the LC were visible for the higher frequencies. However, more systematic surveys that compare micro-elastic properties of ocular tissues, involving different resolutions and a large number of specimens at different disease stages are required to reveal the impact of ocular disorders on the micromechanical and structural properties of the human eye. We anticipate that such information will be indispensable for developing new diagnostic and treatment approaches.
In future studies, we plan to study human ocular tissues for a range of different ophthalmic diseases.
Conclusion
This study represents a systematic survey of micromechanical and acoustical properties of human ocular tissue. We were able to establish an SAM approach that provides speed of sound, acoustic impedance, and acoustic attenuation with one measurement and therefore allows direct estimation of mechanical quantities such as bulk modulus and mass density at length scales of a few microns. Although more investigations are required to evaluate the results found in the present work fully, we anticipate that databases of material properties derived by SAM will be invaluable for further studies investigating the impact of clinically relevant diseases on the micromechanical properties of human ocular tissue. Furthermore, we expect that such information will be of value for the development and improvement of new high-frequency, ultrasound approaches to diagnose and evaluate eye diseases. We currently are extending our experiments to cryo-sectioned human ocular tissues, including specimens of the cornea and Sc, to compare the micromechanical properties of different disease and control cases.
Funding
The author(s) received no financial support for the research, authorship, and/or publication of this article.
Footnotes
Declaration of Conflicting Interests
The author(s) declared no potential conflicts of interest with respect to the research, authorship, and/or publication of this article.
References
- 1.Castrén JA, Pohjola S. MYOPIA AND SCLERAL RIGIDITY. Acta Ophthalmol (Copenh). 2009;40(1):33–36. doi: 10.1111/j.1755-3768.1962.tb02349.x. [DOI] [PubMed] [Google Scholar]
- 2.Phillips JR, McBrien NA. Form deprivation myopia: elastic properties of sclera. Ophthalmic Physiol Opt. 1995;15(5):357–62. [PubMed] [Google Scholar]
- 3.Hommer A, Fuchsjäger-Mayrl G, Resch H, Vass C, Garhofer G, Schmetterer L. Estimation of ocular rigidity based on measurement of pulse amplitude using pneumotonometry and fundus pulse using laser interferometry in glaucoma. Invest Ophthalmol Vis Sci. 2008;49(9):4046–50. doi: 10.1167/iovs.07-1342. [DOI] [PubMed] [Google Scholar]
- 4.Friberg TR, Lace JW. A comparison of the elastic properties of human choroid and sclera. Exp Eye Res. 1988;47(3):429–36. [DOI] [PubMed] [Google Scholar]
- 5.Quigley HA. Number of people with glaucoma worldwide. Br J Ophthalmol. 1996;80(5):389–93. [DOI] [PMC free article] [PubMed] [Google Scholar]
- 6.Quigley HA, Addicks EM, Green WR, Maumenee AE. Optic nerve damage in human glaucoma. II. The site of injury and susceptibility to damage. Arch Ophthalmol. 1981;99(4):635–49. [DOI] [PubMed] [Google Scholar]
- 7.Quigley HA, Addicks EM, Green WR. Optic nerve damage in human glaucoma. III. Quantitative correlation of nerve fiber loss and visual field defect in glaucoma, ischemic neuropathy, papilledema, and toxic neuropathy. Arch Ophthalmol. 1982;100(1):135–46. [DOI] [PubMed] [Google Scholar]
- 8.Quigley HA, Green WR. The histology of human glaucoma cupping and optic nerve damage: clinicopathologic correlation in 21 eyes. Ophthalmology. 1979;86(10):1803–30. [DOI] [PubMed] [Google Scholar]
- 9.Chong NHV, Keonin J, Luthert PJ, Frennesson CI, Weingeist DM, Wolf RL, et al. Decreased thickness and integrity of the macular elastic layer of Bruch’s membrane correspond to the distribution of lesions associated with age-related macular degeneration. Am J Pathol. 2005;166(1):241–51. doi: 10.1016/S0002-9440(10)62248-1. [DOI] [PMC free article] [PubMed] [Google Scholar]
- 10.Danesh-Meyer HV, Boland MV, Savino PJ, Miller NR, Subramanian PS, Girkin CA, et al. Optic disc morphology in open-angle glaucoma compared with anterior ischemic optic neuropathies. Invest Ophthalmol Vis Sci. 2010;51(4):2003–10. doi: 10.1167/iovs.09-3492. [DOI] [PMC free article] [PubMed] [Google Scholar]
- 11.Janmey PA, Winer JP, Murray ME, Wen Q. The hard life of soft cells. Cell Motil Cytoskeleton. 2009;66(8):597–605. doi: 10.1002/cm.20382. [DOI] [PMC free article] [PubMed] [Google Scholar]
- 12.Ugarte M, Hussain AA, Marshall J. An experimental study of the elastic properties of the human Bruch’s membrane-choroid complex: relevance to ageing. Br J Ophthalmol. 2006;90(5):621–6. doi: 10.1136/bjo.2005.086579. [DOI] [PMC free article] [PubMed] [Google Scholar]
- 13.Mamou J, Aristizábal O, Silverman RH, Ketterling JA, Turnbull DH. High-frequency chirp ultrasound imaging with an annular array for ophthalmologic and small-animal imaging. Ultrasound Med Biol. 2009;35(7):1198–208. doi: 10.1016/j.ultrasmedbio.2008.12.017. [DOI] [PMC free article] [PubMed] [Google Scholar]
- 14.Silverman RH. Improved high-resolution ultrasonic imaging of the eye. Arch Ophthalmol. 2008;126(1):94–7. doi: 10.1001/archopht.126.1.94. [DOI] [PMC free article] [PubMed] [Google Scholar]
- 15.Coleman DJ, Silverman RH, Rondeau MJ. Ophthalmology. Ultrasound Med Biol. 2000;26:S128–30. doi: 10.1016/S0301-5629(00)00185-X. [DOI] [PubMed] [Google Scholar]
- 16.Silverman RH, Rondeau MJ, Lizzi FL, Coleman DJ. Three-dimensional high-frequency ultrasonic parameter imaging of anterior segment pathology. Ophthalmology. 1995;102(5):837–43. [DOI] [PubMed] [Google Scholar]
- 17.Narayanaswamy A, Vijaya L, Shantha B, Baskaran M, Sathidevi AV, Baluswamy S. Anterior chamber angle assessment using gonioscopy and ultrasound biomicroscopy. Jpn J Ophthalmol. 2004;48(1):44–9. doi: 10.1007/s10384-003-0004-4. [DOI] [PubMed] [Google Scholar]
- 18.Silverman RH, Lizzi FL, Ursea BG, Rondeau MJ, Eldeen NB, Kaliscz A, et al. High-resolution ultrasonic imaging and characterization of the ciliary body. Invest Ophthalmol Vis Sci. 2001;42(5):885–94. [PubMed] [Google Scholar]
- 19.Silverman RH, Kruse DE, Coleman DJ, Ferrara KW. High-resolution ultrasonic imaging of blood flow in the anterior segment of the eye. Invest Ophthalmol Vis Sci. 1999;40(7):1373–81. [PubMed] [Google Scholar]
- 20.Gentile RC, Berinstein DM, Liebmann J, Rosen R, Stegman Z, Tello C, et al. High-resolution ultrasound biomicroscopy of the pars plana and peripheral retina. Ophthalmology. 1998;105(3):478–84. doi: 10.1016/S0161-6420(98)93031-7. [DOI] [PubMed] [Google Scholar]
- 21.Brent MH, Pavlin CJ, Kelly EN. Ultrasound biomicroscopy in the screening of retinopathy of prematurity. Am J Ophthalmol. 2002;133(2):284–5. [DOI] [PubMed] [Google Scholar]
- 22.Ye SG, Harasiewicz KA, Pavlin CJ, Foster FS. Ultrasound characterization of normal ocular tissue in the frequency range from 50 MHz to 100 MHz. IEEE Trans Ultrason Ferroelectr Freq Control. 1995;42(1):8–14. doi: 10.1109/58.368319. [DOI] [Google Scholar]
- 23.Silverman RH, Urs R, Lloyd HO. Effect of ultrasound radiation force on the choroid. Invest Ophthalmol Vis Sci. 2013;54(1):103–9. doi: 10.1167/iovs.12-10773. [DOI] [PMC free article] [PubMed] [Google Scholar]
- 24.Shahbazi S, Mokhtari-Dizaji M, Mansori MR. Noninvasive estimation of the ocular elastic modulus for age-related macular degeneration in the human eye using sequential ultrasound imaging. Ultrasonics. 2012;52(2):208–14. doi: 10.1016/j.ultras.2011.08.004. [DOI] [PubMed] [Google Scholar]
- 25.Hattori K, Sano H, Saijo Y, Kita A, Hatori M, Kokubun S, et al. Measurement of soft tissue elasticity in the congenital clubfoot using scanning acoustic microscope. J Pediatr Orthop B. 2007;16(5):357–62. doi: 10.1097/BPB.0b013e328248b4d0. [DOI] [PubMed] [Google Scholar]
- 26.Hozumi N, Yamashita R, Lee C-K, Nagao M, Kobayashi K, Saijo Y, et al. Time-frequency analysis for pulse driven ultrasonic microscopy for biological tissue characterization. Ultrasonics. 2004;42(1–9):717–22. doi: 10.1016/j.ultras.2003.11.005. [DOI] [PubMed] [Google Scholar]
- 27.Kijima H, Minagawa H, Saijo Y, Sano H, Tomioka T, Yamamoto N, et al. Degenerated coracoacromial ligament in shoulders with rotator cuff tears shows higher elastic modulus: measurement with scanning acoustic microscopy. J Orthop Sci. 2009;14(1):62–67. doi: 10.1007/s00776-008-1283-x. [DOI] [PubMed] [Google Scholar]
- 28.Masugata H, Mizushige K, Senda S, Kinoshita A, Sakamoto H, Sakamoto S, et al. Relationship between myocardial tissue density measured by microgravimetry and sound speed measured by acoustic microscopy. Ultrasound Med Biol. 1999;25(9):1459–63. [DOI] [PubMed] [Google Scholar]
- 29.Miura K, Nasu H, Yamamoto S. Scanning acoustic microscopy for characterization of neoplastic and inflammatory lesions of lymph nodes. Sci Rep. 2013;3:1255. doi: 10.1038/srep01255. [DOI] [PMC free article] [PubMed] [Google Scholar]
- 30.Petter-Puchner A, Gruber-Blum S, Walder N, Fortelny RH, Redl H, Raum K. Ultrasound biomicroscopy (UBM) and scanning acoustic microscopy (SAM) for the assessment of hernia mesh integration: a comparison to standard histology in an experimental model. Hernia. 2014;8(4):579–85. doi: 10.1007/s10029-013-1201-9. [DOI] [PubMed] [Google Scholar]
- 31.Saijo Y, Tanaka M, Okawai H, Sasaki H, Nitta SI, Dunn F. Ultrasonic tissue characterization of infarcted myocardium by scanning acoustic microscopy. Ultrasound Med Biol. 1997;23(1):77–85. [DOI] [PubMed] [Google Scholar]
- 32.Sasaki H, Saijo Y, Tanaka M, Nitta S, Terasawa Y, Yambe T, et al. Acoustic properties of dialysed kidney by scanning acoustic microscopy. Nephrol Dial Transplant. 1997;12(10):2151–4. [DOI] [PubMed] [Google Scholar]
- 33.Zhao X, Wilkinson S, Akhtar R, Sherratt MJ, Watson REB, Derby B. Quantifying micro-mechanical properties of soft biological tissues with scanning acoustic microscopy. Mater Res Soc Symp Proc. 2011;1301. doi: 10.1557/opl.2011.572. [DOI] [PMC free article] [PubMed] [Google Scholar]
- 34.Ito K, Yoshida K, Maruyama H, Mamou J, Yamaguchi T. Acoustic impedance analysis with high-frequency ultrasound for identification of fatty acid species in the liver. Ultrasound Med Biol. 2017;43(3):700–11. doi: 10.1016/j.ultrasmedbio.2016.11.011. [DOI] [PubMed] [Google Scholar]
- 35.Irie S, Inoue K, Yoshida K, Mamou J, Kobayashi K, Maruyama H, et al. Speed of sound in diseased liver observed by scanning acoustic microscopy with 80 MHz and 250 MHz. J Acoust Soc Am. 2016;139(1):512–9. doi: 10.1121/1.4940126. [DOI] [PubMed] [Google Scholar]
- 36.Rohrbach D, Lloyd HO, Silverman RH, Mamou J. Fine-resolution maps of acoustic properties at 250 MHz of unstained fixed murine retinal layers. J Acoust Soc Am. 2015;137(5):EL381–7. doi: 10.1121/1.4916790. [DOI] [PMC free article] [PubMed] [Google Scholar]
- 37.Rohrbach D, Jakob A, Lloyd H, Tretbar S, Silverman RH, Mamou J. A novel quantitative 500-MHz acoustic microscopy system for ophthalmologic tissues. IEEE Trans Biomed Eng. 2017;64(3):715–724. doi: 10.1109/TBME.2016.2573682. [DOI] [PMC free article] [PubMed] [Google Scholar]
- 38.Beshtawi IM, Akhtar R, Hillarby MC, O’Donnell C, Zhao X, Brahma A, et al. Scanning acoustic microscopy for mapping the microelastic properties of human corneal tissue. Curr Eye Res. 2013;38(4):437–44. doi: 10.3109/02713683.2012.753094. [DOI] [PubMed] [Google Scholar]
- 39.Briggs A Acoustic Microscopy. Oxford and New York: Clarendon Press and Oxford University Press; 1992. [Google Scholar]
- 40.McBrien NA, Jobling AI, Gentle A. Biomechanics of the sclera in myopia: extracellular and cellular factors. Optom Vis Sci. 2009;86(1):E23–30. doi: 10.1097/OPX.0b013e3181940669. [DOI] [PubMed] [Google Scholar]
- 41.Zeimer R Biomechanical properties of the optic nerve head In: Optic Nerve in Glaucoma. Kugler Publications; 1995. pp. 107–21. http://books.google.com/books?hl=de&lr=&id=96tIZr7BCL8C&oi=fnd&pg=PA107&dq=Biomechanical+properties+of+the+optic+nerve+head&ots=uM4sjhouym&sig=GGYiKmXRSREz6o8n3ZTziBB3WdY#v=onepage&q=Biomechanical%20properties%20of%20the%20optic%20nerve%20head&f=false (accessed June 29, 2014). [Google Scholar]
- 42.Sigal IA, Flanagan JG, Ethier CR. Factors influencing optic nerve head biomechanics. Invest Ophthalmol Vis Sci. 2005;46(11):4189–99. doi: 10.1167/iovs.05-0541. [DOI] [PubMed] [Google Scholar]
- 43.Spoerl E, Boehm AG, Pillunat LE. The influence of various substances on the biomechanical behavior of lamina cribrosa and peripapillary sclera. Invest Ophthalmol Vis Sci. 2005;46(4):1286–90. doi: 10.1167/iovs.04-0978. [DOI] [PubMed] [Google Scholar]
- 44.Marcovich AL, Brandis A, Daphna O, Feine I, Pinkas I, Goldschmidt R, et al. Stiffening of rabbit corneas by the bacteriochlorophyll derivative WST11 using near infrared light. Invest Ophthalmol Vis Sci. 2012;53(10):6378–88. doi: 10.1167/iovs.12-9913. [DOI] [PubMed] [Google Scholar]
- 45.Wollensak G, Spoerl E, Seiler T. Stress-strain measurements of human and porcine corneas after riboflavin-ultraviolet-A-induced cross-linking. J Cataract Refract Surg. 2003;29(9):1780–5. [DOI] [PubMed] [Google Scholar]
- 46.Knox Cartwright NE, Tyrer JR, Marshall J. Age-related differences in the elasticity of the human cornea. Invest Ophthalmol Vis Sci. 2011;52(7):4324–9. doi: 10.1167/iovs.09-4798. [DOI] [PubMed] [Google Scholar]
- 47.Jue B, Maurice DM. The mechanical properties of the rabbit and human cornea. J Biomech. 1986;19(10):847–53. [DOI] [PubMed] [Google Scholar]
- 48.Litwiller DV, Lee SJ, Kolipaka A, Mariappan YK, Glaser KJ, Pulido JS, et al. MR elastography of the ex vivo bovine globe. J Magn Reson Imaging. 2010;32(1):44–51. doi: 10.1002/jmri.22217. [DOI] [PMC free article] [PubMed] [Google Scholar]
- 49.Pierscionek BK, Asejczyk-Widlicka M, Schachar RA. The effect of changing intraocular pressure on the corneal and scleral curvatures in the fresh porcine eye. Br J Ophthalmol. 2007;91(6):801–3. doi: 10.1136/bjo.2006.110221. [DOI] [PMC free article] [PubMed] [Google Scholar]
- 50.Kolios M Biomedical ultrasound imaging from 1 to 1000 MHz. Can Acoust. 2009;37(3):35–43. https://jcaa.caa-aca.ca/index.php/jcaa/article/view/2124 (accessed March 8, 2017). [Google Scholar]
- 51.Morse PM, Ingard KU. Theoretical Acoustics. Princeton, NJ: Princeton University Press; 1986. [Google Scholar]
- 52.Mamou J, Oelze ML, O’Brien WD, Zachary JF. Extended three-dimensional impedance map methods for identifying ultrasonic scattering sites. J Acoust Soc Am. 2008;123(2):1195–208. doi: 10.1121/1.2822658. [DOI] [PMC free article] [PubMed] [Google Scholar]
- 53.Rohrbach D, Hoang QV, Wen Q, McFadden SA, Silverman RH, Mamou J. Fine-resolution elastic-property maps of myopic sclera by means of acoustic microscopy In: IEEE International Ultrasonics Symposium, Taipei, Taiwan: 21–24 October 2015, pp. 1–4. doi: 10.1109/ULTSYM.2015.0169. [DOI] [Google Scholar]
- 54.Rohrbach D, Reisner AS, Wen Q, McFadden SA, Silverman RH, Hoang QV, et al. Microstructural assessment of the guinea pig sclera using quantitative acoustic microscopy In: IEEE International Ultrasonics Symposium, 18–21 September 2016, Tours, France, pp. 1–4. doi: 10.1109/ULTSYM.2016.7728794. [DOI] [Google Scholar]
- 55.Chivers RC, Hill CR. Ultrasonic attenuation in human tissue. Ultrasound Med Biol. 1975;2(1):25–29. doi: 10.1016/0301-5629(75)90038-1. [DOI] [PubMed] [Google Scholar]
- 56.Parker KJ, Lerner RM, Waag RC. Attenuation of ultrasound: magnitude and frequency dependence for tissue characterization. Radiology. 1984;153(3):785–8. doi: 10.1148/radiology.153.3.6387795. [DOI] [PubMed] [Google Scholar]
- 57.Saijo Y Acoustic microscopy: latest developments and applications. Imaging Med. 2009;1(1):47–63. doi: 10.2217/iim.09.8. [DOI] [Google Scholar]
- 58.Mamou J, Rohrbach D, Saegusa-Beecroft E, Yanagihara E, Machi J, Feleppa EJ. Ultrasound-scattering models based on quantitative acoustic microscopy of fresh samples and unstained fixed sections from cancerous human lymph nodes In: IEEE International Ultrasonics Symposium, 21–24 October 2015, Taipei, Taiwan: pp. 1–4. doi: 10.1109/ULTSYM.2015.0173. [DOI] [Google Scholar]
- 59.Rohrbach D, Saegusa-Beecroft E, Yanagihara E, Machi J, Feleppa EJ, Mamou J. Fine-resolution maps of acoustic properties at 250 MHz of fresh samples and unstained fixed 12-μm thin sections from cancerous human lymph nodes In: IEEE International Ultrasonics Symposium, 3–6 September 2014, Chicago, USA: pp. 624–7. doi: 10.1109/ULTSYM.2014.0153. [DOI] [Google Scholar]