

Abstract

Revealing the active nature of oxide-derived copper is of key importance to understand its remarkable catalytic performance during the cathodic CO2 reduction reaction (CO2RR) to produce valuable hydrocarbons. Using advanced spectroscopy, electron microscopy, and electrochemically active surface area characterization techniques, the electronic structure and the changes in the morphology/roughness of thermally oxidized copper thin films were revealed during CO2RR. For this purpose, we developed an in situ cell for X-ray spectroscopy that could be operated accurately in the presence of gases or liquids to clarify the role of the initial thermal oxide phase and its active phase during the electrocatalytic reduction of CO2. It was found that the Cu(I) species formed during the thermal treatment are readily reduced to Cu0 during the CO2RR, whereas Cu(II) species are hardly reduced. In addition, Cu(II) oxide electrode dissolution was found to yield a porous/void structure, where the lack of electrical connection between isolated islands prohibits the CO2RR. Therefore, the active/stable phase for CO2RR is metallic copper, independent of its initial phase, with a significant change in its morphology upon its reduction yielding the formation of a rougher surface with a higher number of underco-ordinated sites. Thus, the initial thermal oxidation of copper in air controls the reaction activity/selectivity because of the changes induced in the electrode surface morphology/roughness and the presence of more undercoordinated sites during the CO2RR.
Keywords: cathodic CO2 reduction reaction, oxide derived copper, electrocatalysis, morphology/roughness changes, SEM, ECSA, operando X-ray spectroscopy
Introduction
Copper is the element of choice for gas-phase thermochemical reduction of CO2 to methanol and CO, where the active phase is largely accepted to be copper metal modified by traces of oxygen. It should be noted that the exact composition of the active phase,1 within a matrix of the copper metal, depends on the prehistory of the catalyst and shows considerable spread and uncertainty about the nature of the active center.2 In the case of copper metal as a gas-phase selective oxidation catalyst, it was found that the active phase is neither pure oxide nor pure metal3,4 but a transient phase with overall metallic properties. While active in methanol formation, such a catalyst does not efficiently catalyze C–C bond formation in the gas phase. Under electrochemical conditions, however, copper has the unique ability to produce C–C bonds during the electroreduction of CO2. This uncommon attribute of copper during the electrocatalytic reduction of CO2 has attracted the interest of many research groups5−7 to produce hydrocarbons and alcohols as was pioneered by Hori and coworkers.8−11 Unfortunately, the selective reduction of CO2 into fuels is dominated by complex proton-coupled electron transfer steps12 suffering from high overpotential,13 low selectivity,14 and deactivation over time.15 This fact has triggered interest in finding more efficient/stable copper-based electrocatalysts.7,16 Particularly, the so-called oxide-derived copper (OD-Cu) has aroused high interest because of its improved performance in terms of CO2 reduction reaction (CO2RR) Faradaic efficiency (FE) and a lower overpotential when compared to other copper-based electrocatalysts.13,17 However, the role of the initial Cu-oxidation state, morphology/roughness changes, and how it influences the activity/selectivity of OD-Cu toward the electrode reduction of CO2 to valuable hydrocarbons are not completely understood.18
The exceptional electrocatalytic properties shown by OD-Cu are ascribed in the literature to both the electronic structure of copper and its morphology.19−23 This work aims to elucidate the OD-Cu active copper phase during the CO2RR. In addition, will clarify the role of changes in the morphology and roughness changes, and shows how these parameters influence the activity/selectivity/stability of the electrocatalyst during the electroreduction of CO2. First, the oxidation state of copper during the reaction is clarified by using a set of three different starting situations of OD-Cu in an effort to separate morphological and electronic structure variations. In order to shed light on these issues, we made use of a custom-developed versatile microreactor that allows the investigation of copper catalysts in the presence of gases as well as liquids, to avoid artifacts that may be associated with ex situ analysis.24 The bulk electronic structure of the samples was investigated using in situ X-ray spectroscopy. Such in situ measurements are technically challenging (especially with soft X-rays in the presence of gases or liquids), requiring the use of approaches based on a very thin membrane window (transparent to the X-rays), which separates the vacuum (where the incoming X-rays and detectors are located) from the liquid/gas phase to allow operation under relevant experimental conditions. This approach enables the monitoring of the electronic structure variations of the electrode (i.e., copper oxide phase) in the presence of gases at different temperatures (OD-copper preparation), as well as during the electrochemical reaction (cathodic CO2 reduction). These results were complemented with ex situ scanning electron microscopy (SEM) images collected to provide accurate descriptions of the electrode morphology calcined at different temperatures, before and after the electroreduction of CO2. In addition, the SEM characterization was complemented with electrochemically active surface area (ECSA) characterization in order to ascribe the morphology changes to variations in the roughness factor. The roughness factor is normalized by an electropolished Cu foil used as reference.23
It was found that higher oxidation states, yielding Cu(II) oxides, induce the formation of a nonreducible and inactive thin film under at neutral pH in a CO2-saturated KHCO3 solution because of the formation of carbonate complexes,25 in good agreement with the previous results published by our group for electrochemically prepared copper electrodes.26 Forcing the electric current to flow through the electrode results in Cu(II) dissolution/detachment. We suggest that if bulkier electrodes (i.e., copper foil or a single crystal) are used, the dissolution/detachment of Cu(II) oxide leaves a rougher metallic copper surface. In contrast, Cu(I) oxide does readily undergo reduction, independently of the initial Cu(I) proportion in the electrode, indicating that the CO2RR takes place on a closed shell Cu0 ([Ar] 3d104s0 configuration) ascribed to metallic copper. Thus, Cu(I) oxide is not stable during CO2RR, though possibly stabilized by kinetics. Furthermore, the loss of oxygen in the copper oxide lattice prompts the electrode reconstruction, which roughens the surface and, as a side effect, increases the number of undercoordinated copper centers, which control the activity and selectivity of OD-Cu during the CO2RR.
Experimental Section
In situ Flow Cell for X-ray Absorption Spectroscopy in FY Mode
The in situ microreactor is operated in the main chamber of the ISISS beamline in BESSY II (Berlin, Germany) with a background pressure of ∼10–7 mbar. Meanwhile, gases or aqueous electrolyte is circulated on the back side of a Si3N4 membrane, where the physical vapor deposited (PVD) copper thin film electrode is placed. The effective area of the electrode is ∼0.4 cm2, which is determined by the diameter of the O-ring (0.7 cm) used for sealing the cell. The measurements were recorded at cf. 1.4 to avoid the overlapping contribution of the second-order Si K-edge (from the Si3N4 membrane) on the plateau before the pre-edge of the Cu L2,3 edges. Note that no beam effects were observed during consecutive scans of the Cu L2,3-edge region, ruling out detectable beam-damage in the copper electrodes. The Si3N4 membranes are sourced from the company Norcada (Edmonton, Canada). On the Si3N4 membrane, a 3 nm thin Cr adhesion layer was deposited by PVD. After that, 50 nm of Cu was deposited onto Cr by PVD to yield a 100 nm Si3N4, 3 nm Cr, and 50 nm Cu arrangement. We obtained a homogeneous, polycrystalline Cu thin film using this procedure. When mounted onto the flow cell, the Si3N4 membrane coated with PVD copper can be used as the working electrode and the X-ray window at the same time. The window separates the liquid and gas from the vacuum, where a photodiode detector is placed (AXUV100 Opto Diode Corp.). The X-ray transmission through the Si3N4 membrane is estimated to be approximately equal to 90% of the incoming X-ray intensity at the Cu L2,3-edge excitation energies. The main body of the cell is made of polyether ether ketone (PEEK), which is an electrical insulator and is chemically inert to most of the aqueous electrolytes. The counter electrode is a Pt wire and the reference electrode is a Ag/AgCl FLEXREF, sourced from WPI (Florida, USA).
Electrolyte
The electrolyte is 100 mM KHCO3, which is prepared by diluting 10 g of KHCO3 (Roth, 99%) in 1 L of Milli-Q water (18.2 MΩ) at room temperature (RT). It is saturated with ultrapure grade CO2 by bubbling the electrolyte continuously.
Potenstiostats
Potentiometric control during the in situ X-ray absorption spectra–total fluorescence yield (XAS–TFY) characterization is guaranteed using a Biologic SP-300 (Seyssinet-Pariset, France) potentiostat, allowing for different electrochemical characterization modes such as cyclic voltammetry (CV), linear sweep voltammetry (LSV), and chronoamperometry. The applied potential was controlled with an Autolab PGSTAT 204 potentiostat (Utrecht, Netherlands) during the online gas chromatography (GC) reaction product analysis.
Copper Reference Samples
Copper foil was supplied by Nicalco Corporation (99.96% purity) and prepared by several cycles of Ar+ sputtering and annealing in 0.5 mbar of H2 at 400 °C. The copper oxides, Cu2O 99.9% and CuO 99.7% (metal basis powders), were sourced from Alfa Aesar and introduced into the ultrahigh vacuum (UHV) chamber immediately after unsealing the containers.
SEM Characterization
The morphology characterization was carried out on a SEM HITACHI S-4800. For this purpose, a secondary electron detector was used, applying an accelerating voltage of 1 kV, an emission current of 10 μA, and a 3 mm working distance.
CO2 Electroreduction Measurements
CO2 electroreduction measurements were carried out using a gas-tight glass H-cell separated by an anion exchange membrane (Selemion AMV, AGC Inc.). Both the working electrode and counter electrode compartments were filled with 40 mL 100 mM KHCO3 (Honeywell, 99.95%) and purged continuously with CO2 (99.995%, 20 mL min–1). A KHCO3 solution was prepared with ultrapure water and further prepurified with Chelex 100 resin (Bio-Rad, 100–200 mesh). Prior to the measurement, the electrolyte was bubbled with CO2 for 30 min to remove oxygen and saturate the solution. A platinum gauze (MaTecK, 3600 mesh cm–2) was used as the counter electrode and a leak-free Ag/AgCl electrode (3.4 M KCl, Innovative Instruments, Inc.) as the reference electrode. The PVD Cu thin films were deposited on a glass slide, following the procedure describe above for the electrodes prepared on the Si3N4 membrane. They were successively oxidized in air at three different temperatures (25, 150, and 300 °C). The PVD copper oxide electrodes were used as the working electrode and were contacted with a clamp wrapped by Kapton tape to avoid unwanted reactions. The potentials were controlled with an Autolab potentiostat (PGSTAT 204). The gas products were analyzed using an online gas chromatograph (Agilent 7890B) every 20 min. H2 and hydrocarbons were separated by different columns (Molecular Sieve 13X, HayeSep Q, and Carboxen-1010 PLOT) and quantified using a thermal conductivity detector and a flame ionization detector. The formic acid concentration was analyzed using a high-performance liquid chromatograph (Shimadzu Prominence) equipped with a NUCLEOGEL SUGAR 810 column and a refractive index detector. Ethanol concentrations were analyzed using a liquid gas chromatograph (Shimadzu 2010 Plus), equipped with a fused silica capillary column and a FID. FE calculations can be found in the Supporting Information.
Electrochemical Roughness Factor Measurement
Roughness factors were obtained to determine the ECSA of the electrodes by measuring the double-layer capacitance in a CO2-saturated 100 mM KHCO3 solution, after the thermal oxidation at three different temperatures and after 1 h of CO2 electroreduction reaction at −1.8 V vs Ag/AgCl. The roughness factor of an electropolished Cu foil is used as reference and is defined as 1 (ECSA normalized by an electropolished Cu foil23).
Results and Discussion
Figure 1A shows the in situ microreactor used in this investigation. This cell is composed of a PEEK body (white), a metal block that is heated with an infra-red laser (light blue), a reference electrode (Ag/AgCl), a counter electrode (Pt), and a 50 nm thick PVD copper thin film deposited onto a 100 nm thick Si3N4 window (transparent to the incoming X-rays and outgoing photons), which is used as the working electrode (electrode preparation details can be found in the Experimental Section). This approach allows for the investigation of the electronic structure of copper by recording the XAS in TFY mode, or partial fluorescence yield if the photodiode is replaced by a silicon drift detector. In this way, the Cu L2,3 edges were collected during reaction conditions probing the transition of an electron from the occupied Cu 2p orbital to the unoccupied Cu 3d or/and Cu 4sp orbitals. These orbitals are hybridized with the oxygen 2p in the case of copper oxides,27 revealing valuable chemical information on the oxidation state. In this way, the variations in the electronic structure of the Cu PVD thin film, induced by heating (in the presence of gases) and by the applied potential (in the presence of electrolytes), were recorded using photon-in/photon-out (PIPO) techniques28,29 as shown schematically in Figure 1A. This setup allows us to perform thermal treatment in a controlled gas atmosphere (up to 1 bar partial pressure) as well as electrochemical characterization, all with the same sample, by changing the environment from a gas to a liquid electrolyte in the flow cell. This liquid/gas switchable microreactor is a combination of the gas and electrochemical cells described elsewhere30−33 and it was specifically redesigned for the experiments reported here. Note that this cell is a “micro-lab”, allowing not only in situ sample characterization, but also in situ sample preparation. This makes it possible to investigate the specimen from its fabrication until its use as a catalyst under reaction conditions. Several tests were accomplished to prove the operation/effectiveness of this setup by comparing its performance with a standard electrochemical laboratory cell. Figure S1 shows the comparison of the cyclic voltammograms (CVs) obtained with the in situ cell and in a standard electrochemical cell indicating that the electrochemical performance (apart from the absolute current) is the same in both systems. These results prove that there are no charge transport limitations in the in situ cell. Its correct performance indicates that the in situ electrochemical cell is reliable for the investigation of the CO2RR at the same time that the electronic structure is revealed by simultaneously collecting XAS spectra in TFY mode. Note that during the experiments, the correct electrochemical performance of the in situ experiments was assured by simultaneous LSV characterization.
Figure 1.
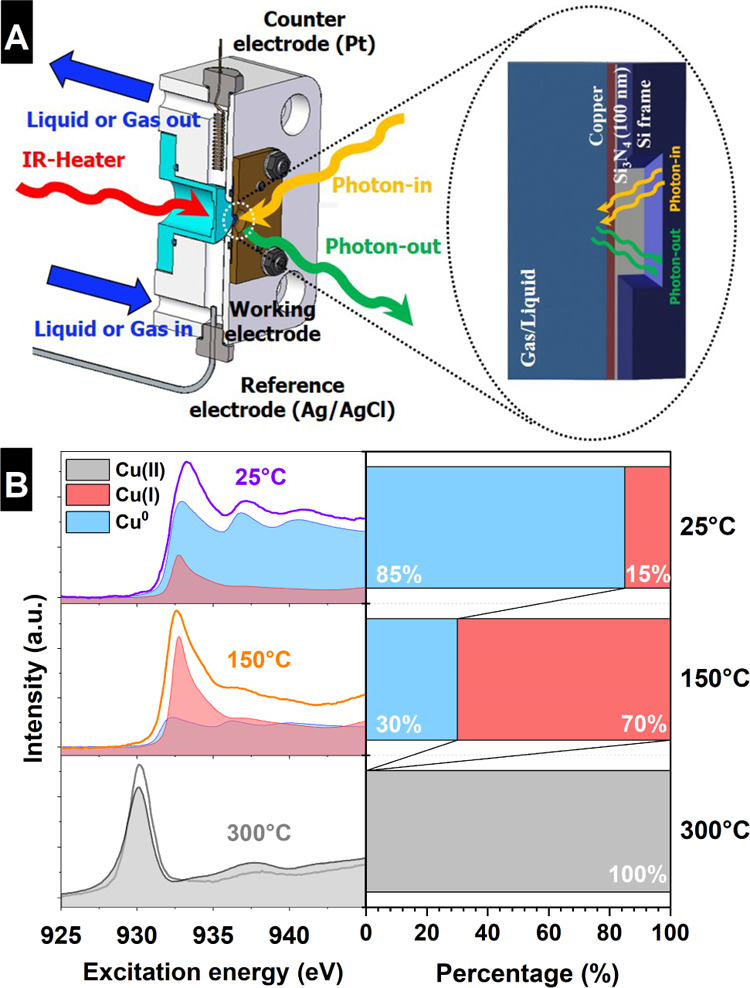
(A) Schematic drawing of the in situ cell, which allows for the thermal oxidation of the copper electrode in the presence of gases, using an IR-laser heater, or as the electrochemical cell when the gas is exchanged by a liquid electrolyte. The electrochemical cell contains a PVD Cu working electrode (deposited on the Si3N4 membrane), a Pt wire counter electrode, and an Ag/AgCl reference electrode. The detection method for X-ray absorption spectroscopy is also shown schematically in the membrane zoom: PIPO measurements in TFY. (B) Cu L3 absorption edge measured in the XAS–TFY mode of the in situ oxidized 50 nm thick PVD copper at three different temperatures in air and the linear combination of relevant copper reference samples that resemble the collected spectra. Furthermore, the estimated percentage of each component is shown on the right side.
By means of a controlled temperature-programmed oxidation experiment in combination with in situ monitoring of the electronic structure of the Cu PVD thin films by means of X-ray absorption spectroscopy (at the Cu L2,3-edges), it was possible to accurately control and tailor the oxidation state of the formed copper oxide thin film depending on the heating temperature. In this work, the electrodes were oxidized in air in order to get the same conditions described by Li and Kanan in the original work on OD-Cu.13 For this purpose, we first filled the cell with air to oxidize the Cu PVD layer (50 nm thick) at three different temperatures (as shown in Figure 1B): RT (25 °C), 150, and 300 °C. We use linear combination fitting (LCF) to determine the percentage contribution of each copper oxide species to the overall collected spectrum, as this analysis method is well accepted.34,35 This method was selected because it discerns better, in a mixture matrix composed of different oxides, than, for example, different normalized X-ray absorption analyses. Using the LCF scheme, we determined that the different thermal treatments yielded a mixed oxide dominated by metallic copper and 15% Cu(I) oxide at RT (25 °C), a mix of 70% Cu(I) oxide and 30% metallic copper at 150 °C, and pure Cu(II) oxide at 300 °C, as shown in Figure 1B left. Note that the percentage of each oxide, contributing to the XAS Cu L2,3 spectrum in the thin film, was estimated using the reference spectra detailed in the Experimental Section, which are selected as principal components in the LCF method yielding an accurate description of the different phase percentage contained in each thermally prepared copper oxide sample.
To establish the activity and selectivity of the different thermally oxidized copper electrodes under high performance conditions, we prepared PVD Cu thin films on glass support slides under the same conditions as those used for the preparation of the working electrode on the Si3N4 window, and 3 nm Cr (adhesion layer) and 50 nm of Cu were deposited by PVD. Subsequently, the electrodes were thermally treated at different temperatures in air (25, 150, and 300 °C) and used as working electrodes for the CO2RR. The resistance of the film oxidized at RT and 150 °C is in the range of ohms, meanwhile the film oxidized at 300 °C showed resistance on the order of kilo ohms, where conductivity measurements confirm the Ohmic contact with the current collector. The catalytic activity of these electrodes was investigated using the methodology described in the Experimental Section.36Figure 2A shows the FE (see the Supporting Information for calculation details) for the different PVD copper thin films oxidized at 25 °C (not calcined), 150, and 300 °C in air. The electrodes oxidized at RT (with a geometric current density of 13.7 mA/cm2) and 150 °C (with a geometric current density of 13.9 mA/cm2) display a similar performance, with slightly higher selectivity to hydrocarbons, alcohols, and formic acid formation for the electrode oxidized at 150 °C. In contrast, the Cu thin film oxidized at 300 °C is characterized by a quick drop in the initial current upon cathodic polarization to a nondetectable catalytic activity, showing a low current density (40 μA/cm2) under steady state current conditions. This result indicates that Cu(II) oxide shows an electrical contact loss, which can be due to an oxide breakdown because of the loss of dielectric isolation inducing the flow of a large current and electrode dissolution or due to erosion induced by the phase changes. Determining the exact reason for the Cu(II) electrode dissolution is in fact beyond the scope of this study and remains an open question for further investigations. Anyhow, the dissolution process observed is different than the chemical dissolution observed during anodic polarization of copper electrodes.29 In addition to the activity/selectivity tests, changes in the electrode morphology and surface roughness induced by the thermal oxidation in air and CO2RR were investigated by means of ex situ SEM analysis and ECSA measurements. Figure 2B1–D1 shows the electrode morphology after the thermal treatment at different temperatures used to prepare the different electrodes of this investigation. These images indicate that the morphology of the electrode is strongly modified by oxidation in air at different temperatures. The electrode texture shows a uniform surface composed of coarse grains of different sizes depending on the temperature/oxidation state. The uncalcined electrode (25 °C) is flatter than the electrode oxidized at 150 °C, Cu(I) oxide. The sample oxidized at 300 °C (Cu(II) oxide) presents coarser grains, which have an even higher roughness amplitude than the 150 °C sample. Therefore, the reconstruction of the copper electrodes is ruled by the incorporation of oxygen in the copper lattice as well as by the oxidation temperature indicating that the morphology changes are dominated by oxidation/reduction processes.37 The changes induced in the morphology of the electrodes after the electrocatalytic reduction of CO2 were also investigated. Figure 2B2,C2 shows that the electrodes oxidized at 25 and 150 °C undergo roughness changes during the reaction. These changes in the morphology were also recently observed under reaction conditions in situ using an electrochemical scanning electron microscope with electrodeposited copper oxide electrodes indicating a reconstruction in the electrode because of the oxygen loss during the CO2RR.38 However, Figure 2D2 shows that the electrode oxidized at 300 °C (Cu(II) oxide) underwent partial dissolution because of the electrical current flowing along a narrow path and Joule heating inducing cathodic breakdown, or as a consequence of the erosion induced during the copper oxide phase changes yielding a spongy porous morphology composed of electrically isolated patches/islands (see also Figure S2). A magnification of these electrodes before and after the CO2RR is shown in Figure S3 in the Supporting Information. The dominant character of the cathodic breakdown/erosion/detachment versus the dissolution is supported by the fact that the decay in the current occurs suddenly, whereas in dissolution processes, the current decays asymptotically. Cathodic breakdown generates conductive spots from the dissolution of the nonconductive Cu(II) oxide and results in a sudden change in electrical conductivity allowing a large current to flow through the electrode. As a result of the breakdown/erosion/dissolution effects, patches of electrically not-connected copper islands are formed as shown in Figure S2. Note that in other investigations in the literature, copper foils or single crystals (bulky electrodes) were used for the formation of OD-copper13 rather than the thin films employed in this investigation. For such samples, it is likely that the dissolution of Cu(II) species exposes rough metallic Cu underneath the Cu(II) oxide/copper carbonate layer, which would significantly increase the active area and performance in the reaction.
Figure 2.
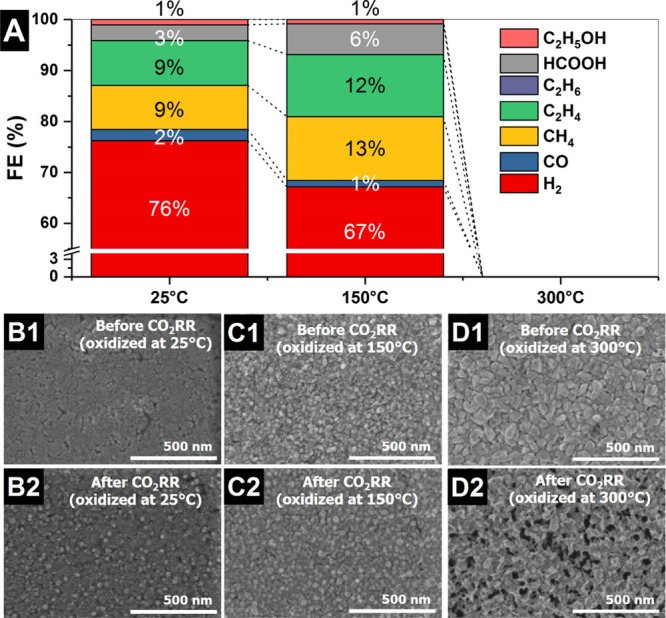
(A) FE at −1.8 V vs Ag/AgCl collected on the thermally oxidized PVD Cu films (50 nm) in CO2-saturated 100 mM KHCO3 electrolyte. SEM images of the different PVD electrodes oxidized at different temperatures in air before (1) and after (2) the CO2RR [(B) 25, (C) 150 and (D) 300 °C], on glass plates.
From the SEM measurements, it appears to be necessary to quantify the variations in the surface roughness induced by the oxidation/redox processes. At this point, it is important to remark that techniques such as the Brunauer–Emmett–Teller (BET) technique are not suitable to evaluate the active surface area of the PVD thin film electrodes because their small area is below the detection limit. Therefore, the SEM characterization results are complemented by the ECSA, which is a technique more suitable for the characterization of these electrodes compared to BET. The ECSA analysis is shown in Figure 3 and in Table S1. The roughness factor, calculated from the ECSA characterization, of the PVD copper as deposited (at RT) is similar to the reference electropolished copper foil (roughness factor defined as 1). Meanwhile, the roughness factor increases to 2.83 when the PVD Cu electrode is oxidized at 150 °C in air. Thus, the ECSA150°C/ECSA25°C ratio increases up to a value of 2.7 units upon thermal oxidation, in line with the SEM characterization. More interestingly, the ECSA analysis was performed with these samples after the CO2RR, where the roughness factors of the PVD copper at RT and oxidized at 150 °C in air increased to 3.63 and 3.18, respectively. Note that the copper oxide produced at 300 °C cannot be investigated using ECSA characterization because of the low conductivity of the Cu(II) oxide-like electrode. The ECSACO2RR/ECSA25°C ratio increased to 3.5 and ECSACO2RR/ECSA150°C to 1.1, indicating a strong enhancement in the ECSA (rougher surface) for the case of native Cu(I) oxide at RT. These results indicate that the loss of oxygen during the CO2RR dominates the morphology/roughness change more than the thermal oxidation of the electrode at higher temperature. An analysis of the reduction products shows interesting aspects that concern the overall roughness factor and current for both electrodes, yielding an enhanced hydrogen evolution reaction (HER) in the case of the native Cu(I) oxide because of an increased number of low-coordinated Cu sites. In fact, after 1 h of reaction, small particles are formed in the thin PVD copper film yielding the formation of low coordinated sites on the rougher surface dominating the HER.39 Thus, the rougher surface enables the HER to proceed at lower overpotentials with similar current densities with respect to the sample oxidized at 150 °C in air.
Figure 3.

ECSA analysis of the PVD copper electrodes prepared at different temperatures before and after the reaction (−1.8 V vs Ag/AgCl in CO2-saturated 100 mM KHCO3 electrolyte after 1 h of continuous CO2RR).
After the copper electrodes are thermally oxidized, at different temperatures in air, the in situ cell is filled with 100 mM KHCO3 electrolyte saturated in CO2, allowing the investigation of the electronic structure during the CO2RR. By doing this, the changes in the electronic structure that each thermally oxidized Cu electrode undergoes in the presence of the electrolyte and under applied potential are investigated by in situ X-ray absorption spectroscopy recording the Cu L2,3-edge spectra. The estimated amount of each copper oxide component contributing to the spectra was calculated using a LCF analysis (see Figure 4A). The variations in the electronic structure induced in the three electrodes by the applied potential are shown in Figure 4B, meanwhile Figure 4C shows the LSV recorded during the acquisition of the Cu L2,3-edge spectra. Note that the simultaneously collected LSV validates the correct electrochemical performance during the in situ XAS characterization. Figure 4B1,C1 shows the Cu L2,3-edge spectra of the copper electrode oxidized at RT at different potentials as well as the LSV. The sample undergoes a reduction from a mixed Cu(I)/Cu0 oxide to Cu0, as shown in the LCF in Figure 4A1, which can be seen by comparing the red [at open circuit voltage (OCV)] and blue (CO2RR) Cu L2,3-edge spectra. The same behavior is observed for the copper electrode oxidized at 150 °C that undergoes a reduction as shown in Figure 4B2. Note that the reduction wave (around −1.0 V vs Ag/AgCl) shown in Figure 4C2 is more pronounced in the electrode oxidized at 150 °C than in the sample oxidized at RT (Figure 4C1). This behavior is a consequence of the higher percentage of copper oxide present in the sample oxidized at 150 °C. The electrode prepared at 150 °C undergoes full reduction (within the detection limit) to metallic copper under CO2RR conditions as shown in the LCF in Figure 4A2. Meanwhile, the electrode oxidized at 300 °C, consisting of Cu(II) oxide, cannot be easily reduced (see Figure 4A3–C3) and shows a low current because of its insulating character as shown in the LSV in Figure 4C3. This finding is in good agreement with the catalytic activity measurements shown in Figure 2A and corroborates our previous results26 for copper oxides prepared by electrode anodization, where the formed copper carbonates that acted as an insulating layer in Cu(II)-like electrodes are inactive for the electroreduction of CO2. The formation of copper carbonates in the sample oxidized at 300 °C in the presence of KHCO3 is corroborated by its comparison with copper carbonate and cupric oxide fingerprint reference samples. The carbonate species show a shift in the main peak to lower excitation energies as shown in Figure S4. If there is a sufficiently conductive subsurface matrix supporting the Cu(II) layer, or if Cu(II) is not too thick or if it does not completely cover the surface, Cu(II) is rereduced as shown in Figure S5. Under these conditions, the in situ collected spectra of a mix Cu(I)/Cu(II) show a first reduction wave ascribed to the reduction from Cu(I) to Cu0 resulting in a Cu(II)/Cu0 mix-oxide matrix, where the Cu(II) species are associated with the copper carbonate species. At higher cathodic polarization, there is a second reduction wave ascribed to the dissolution/reduction of CuCO3 to Cu0 with no evidence of remaining oxide phase under CO2RR conditions. Comparing the LSV of the sample oxidized at RT also shows a second oxidation wave, which is related to the existence of native copper carbonate and/or copper silicates that are reduced/removed at high cathodic polarizations.
Figure 4.

(A) Estimated percentage of each copper oxide component for the different electrodes depending on the applied potential. (B) In situ Cu L2,3 absorption edges of the thermally prepared Cu films, collected in TFY mode at various applied potentials. (C) LSV of each sample in 100 mM KHCO3 (saturated in CO2) with Pt and Ag/AgCl as counter and reference electrodes, respectively.
The in situ Cu L2,3 XAS, in combination with SEM and ECSA characterization, clearly indicate that the catalytic activity/selectivity of copper is mainly determined by the surface morphology/roughness because the thin Cu films were found to become reduced under CO2RR irrespective of the temperature pretreatment if only Cu(I) oxide is present. Oxidizing the electrode in air at elevated temperature (inserting more oxygen into the copper lattice) results in the formation of a rougher copper oxide surface compared to the as-prepared PVD thin film. This thermal treatment enhances the surface to volume ratio allowing, in principle, more Cu atoms to participate in the reaction. Rougher surfaces have an enhanced number of active sites per mass or geometrical surface area compared to flatter ones. According to our results, the electroreduction of the copper oxide electrode has the same effect on the electrode morphology as thermal oxidation, increasing the electrode surface roughness due to oxygen loss in the copper oxide lattice. Therefore, oxidizing the copper electrode thermally is not a manageable procedure for controlling the electrode surface morphology. This result indicates that oxidizing and/or reducing the electrode modifies the number of active centers accesible for the CO2 molecules present in the electrolyte. Figure 5 shows schematically the modifications that the electrodes undergo as a consequence of the thermal treatment in air and because of the electroreduction of CO2 into valuable hydrocarbons and alcohols. For the PVD electrode as prepared and oxidized at RT, the surface is composed mostly of Cu(I) oxide (red), meanwhile the bulk is essentially metallic (blue). Once the electrode is heated to 150 °C in air, most of the electrode becomes oxidized to Cu(I) oxide (red) with significant changes in its morphology and enhanced surface roughness. Increasing the temperature to 300 °C in air yields the formation of Cu(II) oxide (gray) and the highest roughness amplitude for the thermal-treated copper electrode. During the CO2RR, the electrodes oxidized in air at 25 °C (not calcined) and 150 °C undergo reduction to Cu0 (blue), where the surface morphology/roughness is similar for both samples, explaining the comparable electrocatalytic performance observed. Therefore, the electrode reduction and oxygen lost in the lattice results in the formation of small particles with low coordinated sites that enhance H2 production as the ECSA, as demonstrated by SEM and GC measurement comparison between Cu(I) oxides prepared at RT and at 150 °C. These results are also supported by the LSV (similar electrochemical behavior for both samples) data implying that there are no major differences in the number of active sites between the Cu(I) samples, independent of the temperature preparation. These results are also in good agreement with the ECSA characterization findings. In contrast, the Cu(II) oxide formed at 300 °C undergoes dissolution at cathodic potentials yielding isolated patches of porous electrode material. Because Cu(II) is hardly reduced, the electrode remains insulating, explaining the lack of activity/conductivity of this electrode. At this point, it is important to remark that the TFY measurements are bulk sensitive and, therefore, the whole electrode film thickness contributes to the signal. Hence, it is possible that a gradient of dissolved oxygen remains in the near-surface.40
Figure 5.

Scheme of the variations in the structure and oxidation state of the copper electrodes following thermal treatment and the CO2RR.
Conclusions
In summary, we found that the activity and stability of thermally oxidized copper electrodes is determined by their as-prepared oxidation state. Cu(I) oxides are readily reduced to metallic copper during the electrocatalytic reduction of CO2. In contrast, Cu(II) oxide is hardly reduced, but rather dissolves, with the lack of conductivity in these films rendering them inactive. If current is forced to flow through the Cu(II) electrode, it prompts electrode dissolution and the formation of a porous patched pattern. However, with bulk electrodes like foils or single crystals, it may be expected that the Cu(II) dissolution, or rereduction if the substrate is conductive enough, exposes the metallic surface beneath the porous Cu(II) oxide structure, which may be the key in the high activity/selectivity reported in the literature for OD-Cu electrodes, that is, by larger retention times.
The clear result of this study is that the matrix of the active electrocatalyst for CO2 reduction is metallic copper. The fact that the prehistory of the electrode may play a role in the identification of the active material is taken as indication that modifications of the metallic copper without losing its conductivity may be an effective strategy to influence the intrinsic activity. Both the morphological (roughness, strain) and compositional effects (coadsorbates and subsurface-dissolved species) may be relevant. This leaves room for experiments by doping metallic copper in a controlled way to affect activity and selectivity. For reasons of stability, such modifiers should be studied in low enough amounts as not to compromise the stability of the metallic copper matrix phase.
Acknowledgments
We thank DAAD for financial support in the framework of Taiwanese-German collaboration (project IDs 57218279 and 57392335). C.-H.C. acknowledges financial support from projects 104-2112-M-032-005-MY2 and 105-2911-I-032-501. D.G., H.S.J., and B.R.C. thank the financial support of the German Research Foundation (DFG) under grant SFB 1316, subproject B1, the SPP2080 project no. 406944504 and Germany Excellence Strategy—EXC 2008/1 (UniSysCat)—390540038 and the European Research Council (ERC-725915, OPERANDOCAT). R.V.M. thanks the Humboldt Foundation for a Humboldt Research Fellowship. We thank the Helmholtz-Zemtrum Berlin für Materialien und Energie for allocating beamtime for our experiments within the proposal numbers 192-08521 and 191-08014. We thank Sven Kubala for his help in preparing the PVD copper thin film electrodes.
Supporting Information Available
The Supporting Information is available free of charge at https://pubs.acs.org/doi/10.1021/acscatal.0c03484.
Faradaic efficiency calculations. CVs comparing the in situ XAS cell and standard EC-laboratory cell. SEM characterization of the electrodes before and after the CO2RR. Comparison of the Cu L3 of the thermal samples with cupric oxide and copper carbonate. In situ XAS–TFY characterization of a Cu(II)/Cu(I) mix oxide depending on the applied potential. ECSA analysis of the PVD copper prepared at different temperatures before and after the reactions (PDF)
The authors declare no competing financial interest.
Supplementary Material
References
- Behrens M.; Studt F.; Kasatkin I.; Kühl S.; Hävecker M.; Abild-Pedersen F.; Zander S.; Girgsdies F.; Kurr P.; Kniep B.-L.; Tovar M.; Fischer R. W.; Nørskov J. K.; Schlögl R. The Active Site of Methanol Synthesis over Cu/ZnO/Al2O3 Industrial Catalysts. Science 2012, 336, 893–897. 10.1126/science.1219831. [DOI] [PubMed] [Google Scholar]
- Zhong J.; Yang X.; Wu Z.; Liang B.; Huang Y.; Zhang T. State of the Art and Perspectives in Heterogeneous Catalysis of CO2 Hydrogenation to Methanol. Chem. Soc. Rev. 2020, 49, 1385–1413. 10.1039/c9cs00614a. [DOI] [PubMed] [Google Scholar]
- Schedel-Niedrig T.; Neisius T.; Böttger I.; Kitzelmann E.; Weinberg G.; Demuth D.; Schlögl R. Copper (Sub) Oxide Formation: a Surface Sensitive Characterization of Model Catalysts. Phys. Chem. Chem. Phys. 2000, 2, 2407–2417. 10.1039/b000253o. [DOI] [Google Scholar]
- Böttger I.; Schedel-Niedrig T.; Timpe O.; Gottschall R.; Hävecker M.; Ressler T.; Schlögl R. Catalytic Methanol Oxidation over Copper: Observation of Reaction-Induced Nanoscale Restructuring by Means of In Situ Time-Resolved X-ray Absorption Spectroscopy. Chem.—Eur. J. 2000, 6, 1870–1876. 10.1002/(sici)1521-3765(20000515)6:10<1870::aid-chem1870>3.0.co;2-0. [DOI] [PubMed] [Google Scholar]
- Mistry H.; Varela A. S.; Cecile S. B.; Zegkinoglou I.; Sinev I.; Choi Y. W.; Kisslinger K.; Stach E. A.; Yang J. C.; Strasser P.; Roldan-Cuenya B. Highly Selective Plasma-Activated Copper Catalysts for Carbon Dioxide Reduction to Ethylene. Nat. Commun. 2016, 7, 12123. 10.1038/ncomms12123. [DOI] [PMC free article] [PubMed] [Google Scholar]
- Arán-Ais R. M.; Gao D.; Roldan Cuenya B. Structure-and Electrolyte-Sensitivity in CO2 Electroreduction. Acc. Chem. Res. 2018, 51, 2906. 10.1021/acs.accounts.8b00360. [DOI] [PubMed] [Google Scholar]
- Gao D.; Arán-Ais R. M.; Jeon H. S.; Roldan Cuenya B. Rational Catalyst and Electrolyte Design for CO2 Electroreduction Towards Multicarbon Products. Nat. Catal. 2019, 2, 198–210. 10.1038/s41929-019-0235-5. [DOI] [Google Scholar]
- Hori Y.; Kikuchi K.; Suzuki S. Production of CO and CH4 in Electrochemical Reduction of CO2 at Metal Electrodes in Aqueous Hydrogencarbonate Solution. Chem. Lett. 1985, 14, 1695–1698. 10.1246/cl.1985.1695. [DOI] [Google Scholar]
- Hori Y.; Kikuchi K.; Murata A.; Suzuki S. Production of Methane and Ethylene in Electrochemical Reduction of Carbon Dioxide at Copper Electrode in Aqueous Hydrogencarbonate Solution. Chem. Lett. 1986, 15, 897–898. 10.1246/cl.1986.897. [DOI] [Google Scholar]
- Hori Y.; Murata A.; Takahashi R. Formation of Hydrocarbons in the Electrochemical Reduction of Carbon Dioxide at a Copper Electrode in Aqueous Solution. J. Chem. Soc., Faraday Trans. 1 1989, 85, 2309–2326. 10.1039/f19898502309. [DOI] [Google Scholar]
- Hori Y.; Takahashi I.; Koga O.; Hoshi N. Selective Formation of C2 Compounds from Electrochemical Reduction of CO2 at a Series of Copper Single Crystal Electrodes. J. Phys. Chem. B 2002, 106, 15–17. 10.1021/jp013478d. [DOI] [Google Scholar]
- Kas R.; Kortlever R.; Milbrat A.; Koper M. T. M.; Mul G.; Baltrusaitis J. Electrochemical CO2 Reduction on Cu2O-Derived Copper Nanoparticles: Controlling the Catalytic Selectivity of Hydrocarbons. Phys. Chem. Chem. Phys. 2014, 16, 12194–12201. 10.1039/c4cp01520g. [DOI] [PubMed] [Google Scholar]
- Li C. W.; Kanan M. W. CO2 Reduction at Low Overpotential on Cu Electrodes Resulting from the Reduction of Thick Cu2O Films. J. Am. Chem. Soc. 2012, 134, 7231–7234. 10.1021/ja3010978. [DOI] [PubMed] [Google Scholar]
- Kondratenko E. V.; Mul G.; Baltrusaitis J.; Larrazábal G. O.; Pérez-Ramírez J. Status and Perspectives of CO2 Conversion into Fuels and Chemicals by Catalytic, Photocatalytic and Electrocatalytic Processes. Energy Environ. Sci. 2013, 6, 3112–3135. 10.1039/c3ee41272e. [DOI] [Google Scholar]
- Jermann B.; Augustynski J. Long-Term Activation of the Copper Cathode in the Course of CO2 Reduction. Electrochim. Acta 1994, 39, 1891–1896. 10.1016/0013-4686(94)85181-6. [DOI] [Google Scholar]
- Khezri B.; Fisher A. C.; Pumera M. CO2 Reduction: the Quest for Electrocatalytic Materials. J. Mater. Chem. A 2017, 5, 8230–8246. 10.1039/c6ta09875d. [DOI] [Google Scholar]
- Li C. W.; Ciston J.; Kanan M. W. Electroreduction of Carbon Monoxide to Liquid Fuel on Oxide-Derived Nanocrystalline Copper. Nature 2014, 508, 504. 10.1038/nature13249. [DOI] [PubMed] [Google Scholar]
- Handoko A. D.; Ong C. W.; Huang Y.; Lee Z. G.; Lin L.; Panetti G. B.; Yeo B. S. Mechanistic Insights into the Selective Electroreduction of Carbon Dioxide to Ethylene on Cu2O-Derived Copper Catalysts. J. Phys. Chem. C 2016, 120, 20058–20067. 10.1021/acs.jpcc.6b07128. [DOI] [Google Scholar]
- Lum Y.; Yue B.; Lobaccaro P.; Bell A. T.; Ager J. W. Optimizing C–C Coupling on Oxide-Derived Copper Catalysts for Electrochemical CO2 Reduction. J. Phys. Chem. C 2017, 121, 14191–14203. 10.1021/acs.jpcc.7b03673. [DOI] [Google Scholar]
- Verdaguer-Casadevall A.; Li C. W.; Johansson T. P.; Scott S. B.; McKeown J. T.; Kumar M.; Stephens I. E. L.; Kanan M. W.; Chorkendorff I. Probing the Active Surface Sites for CO Reduction on Oxide-Derived Copper Electrocatalysts. J. Am. Chem. Soc. 2015, 137, 9808–9811. 10.1021/jacs.5b06227. [DOI] [PubMed] [Google Scholar]
- Lum Y.; Ager J. W. Evidence for Product-Specific Active Sites on Oxide-Derived Cu Catalysts for Electrochemical CO2 Reduction. Nat. Catal. 2019, 2, 86–93. 10.1038/s41929-018-0201-7. [DOI] [Google Scholar]
- Eilert A.; Cavalca F.; Roberts F. S.; Osterwalder J.; Liu C.; Favaro M.; Crumlin E. J.; Ogasawara H.; Friebel D.; Pettersson L. G. M.; Nilsson A. Subsurface Oxygen in Oxide-Derived Copper Electrocatalysts for Carbon Dioxide Reduction. J. Phys. Chem. Lett. 2017, 8, 285–290. 10.1021/acs.jpclett.6b02273. [DOI] [PubMed] [Google Scholar]
- Wang L.; Nitopi S.; Wong A. B.; Snider J. L.; Nielander A. C.; Morales-Guio C. G.; Orazov M.; Higgins D. C.; Hahn C.; Jaramillo T. F. Electrochemically Converting Carbon Monoxide to Liquid Fuels by Directing Selectivity with Electrode Surface Area. Nat. Catal. 2019, 2, 702–708. 10.1038/s41929-019-0301-z. [DOI] [Google Scholar]
- Lum Y.; Ager J. W. Stability of Residual Oxides in Oxide-Derived Copper Catalysts for Electrochemical CO2 Reduction Investigated with 18O Labeling. Angew. Chem., Int. Ed. 2018, 57, 551–554. 10.1002/anie.201710590. [DOI] [PubMed] [Google Scholar]
- Stiff M. J. Copper/Bicarbonate Equilibria in Solutions of Bicarbonate Ion at Concentrations Similar to those Found in Natural Water. Water Res. 1971, 5, 171–176. 10.1016/0043-1354(71)90049-2. [DOI] [Google Scholar]
- Velasco-Vélez J.-J.; Jones T.; Gao D.; Carbonio E.; Arrigo R.; Hsu C.-J.; Huang Y.-C.; Dong C.-L.; Chen J.-M.; Lee J.-F.; Strasser P.; Roldan Cuenya B.; Schlögl R.; Knop-Gericke A.; Chuang C.-H. The Role of the Copper oxidation State in the Electrocatalytic Reduction of CO2 into Valuable Hydrocarbons. ACS Sustainable Chem. Eng. 2018, 7, 1485–1492. 10.1021/acssuschemeng.8b05106. [DOI] [Google Scholar]
- Jiang P.; Prendergast D.; Borondics F.; Porsgaard S.; Giovanetti L.; Pach E.; Newberg J.; Bluhm H.; Besenbacher F.; Salmeron M. Experimental and Theoretical Investigation of the Electronic Structure of Cu2O and CuO Thin Films on Cu(110) Using X-ray Photoelectron and Absorption Spectroscopy. J. Chem. Phys. 2013, 138, 024704. 10.1063/1.4773583. [DOI] [PubMed] [Google Scholar]
- Velasco-Vélez J. J.; Jones T. E.; Pfeifer V.; Dong C.-L.; Chen Y.-X.; Chen C.-M.; Chen H.-Y.; Lu Y.-R.; Chen J.-M.; Schlögl R.; Knop-Gericke A.; Chuang C.-H. Trends in Reactivity of Electrodeposited 3d Transition Metals on Gold Revealed by Operando Soft X-ray Absorption Spectroscopy During Water Splitting. J. Phys. D: Appl. Phys. 2016, 50, 024002. 10.1088/1361-6463/50/2/024002. [DOI] [Google Scholar]
- Velasco-Vélez J.-J.; Skorupska K.; Frei E.; Huang Y.-C.; Dong C.-L.; Su B.-J.; Hsu C.-J.; Chou H.-Y.; Chen J.-M.; Strasser P.; Schlögl R.; Knop-Gericke A.; Chuang C.-H. The Electro-Deposition/Dissolution of CuSO4 Aqueous Electrolyte Investigated by In Situ Soft X-ray Absorption Spectroscopy. J. Phys. Chem. B 2017, 122, 780–787. 10.1021/acs.jpcb.7b06728. [DOI] [PubMed] [Google Scholar]
- Velasco-Vélez J. J.; Teschner D.; Girgsdies F.; Hävecker M.; Streibel V.; Willinger M. G.; Cao J.; Lamoth M.; Frei E.; Wang R.; Centeno A.; Zurutuza A.; Hofmann S.; Schlögl R.; Knop-Gericke A. The Role of Adsorbed and Subsurface Carbon Species for the Selective Alkyne Hydrogenation over a Pd-Black Catalyst: an Operando Study of Bulk and Surface. Top. Catal. 2018, 61, 2052–2061. 10.1007/s11244-018-1071-6. [DOI] [PMC free article] [PubMed] [Google Scholar]
- Velasco-Vélez J. J.; Pfeifer V.; Hävecker M.; Wang R.; Centeno A.; Zurutuza A.; Algara-Siller G.; Stotz E.; Skorupska K.; Teschner D.; Kube P.; Braeuninger-Weimer P.; Hofmann S.; Schlögl R.; Knop-Gericke A. Atmospheric Pressure X-ray Photoelectron Spectroscopy Apparatus: Bridging the Pressure Gap. Rev. Sci. Instrum. 2016, 87, 053121. 10.1063/1.4951724. [DOI] [PubMed] [Google Scholar]
- Knop-Gericke A.; Pfeifer V.; Velasco-Velez J.-J.; Jones T.; Arrigo R.; Hävecker M.; Schlögl R. In Situ X-ray Photoelectron Spectroscopy of Electrochemically Active Solid-Gas and Solid-Liquid Interfaces. J. Electron Spectrosc. Relat. Phenom. 2017, 221, 10–17. 10.1016/j.elspec.2017.03.010. [DOI] [Google Scholar]
- Velasco-Vélez J. J.; Pfeifer V.; Hävecker M.; Weatherup R. S.; Arrigo R.; Chuang C.-H.; Stotz E.; Weinberg G.; Salmeron M.; Schlögl R.; Knop-Gericke A. Photoelectron Spectroscopy at the Graphene–Liquid Interface Reveals the Electronic Structure of an Electrodeposited Cobalt/Graphene Electrocatalyst. Angew. Chem., Int. Ed. 2015, 54, 14554–14558. 10.1002/anie.201506044. [DOI] [PubMed] [Google Scholar]
- Gaur A.; Shrivastava B. D.; Joshi S. K. Copper K-edge XANES of Cu(I) and Cu(II) oxide mixtures. J. Phys.: Conf. Ser. 2009, 190, 012084. 10.1088/1742-6596/190/1/012084. [DOI] [Google Scholar]
- Gräfe M.; Donner E.; Collins R. N.; Lombi E. Specification of Metal (Loid)s in Environmental Samples by X-ray Absorption Spectroscopy: A Critical Review. Anal. Chim. Acta 2014, 822, 1–22. 10.1016/j.aca.2014.02.044. [DOI] [PubMed] [Google Scholar]
- Gao D.; Scholten F.; Roldan Cuenya B. Improved CO2 Electroreduction Performance on Plasma-Activated Cu Catalysts Via Electrolyte Design: Halide Effect. ACS Catal. 2017, 7, 5112–5120. 10.1021/acscatal.7b01416. [DOI] [Google Scholar]
- Cao J.; Rinaldi A.; Plodinec M.; Huang X.; Willinger E.; Hammud A.; Hieke S.; Beeg S.; Gregoratti L.; Colbea C.; Schlögl R.; Antonietti M.; Greiner M.; Willinger M. In Situ Observation of Oscillatory Redox Dynamics of Copper. Nat. Commun. 2020, 11, 3554. 10.1038/s41467-020-17346-7. [DOI] [PMC free article] [PubMed] [Google Scholar]
- Velasco-Vélez J.-J.; Mom R. V.; Sandoval L.; Falling L. J.; Chuang C. H.; Gao D.; Jones T. E.; Qingjun Z.; Arrigo R. Revealing the Active Phase of Copper During the Electroreduction of CO2 in Aqueous Electrolyte by Correlating In Situ X-ray Spectroscopy and In Situ Electron Microscopy. ACS Energy Lett. 2020, 5, 2106–2111. 10.1021/acsenergylett.0c00802. [DOI] [PMC free article] [PubMed] [Google Scholar]
- Reske R.; Mistry H.; Behafarid F.; Roldan Cuenya B.; Strasser P. Particle Size Effects in the Catalytic Electroreduction of CO2 on Cu Nanoparticles. J. Am. Chem. Soc. 2014, 136, 6978–6986. 10.1021/ja500328k. [DOI] [PubMed] [Google Scholar]
- Chou T.-C.; Chang C.-C.; Yu H.-L.; Yu W.-Y.; Dong C.-L.; Velasco-Vélez J.-J.; Chuang C.-H.; Chen L.-C.; Lee J.-F.; Chen J.-M.; Wu H.-L. Controlling the Oxidation State of the Cu Electrode and Reaction Intermediates for Electrochemical CO2 Reduction to Ethylene. J. Am. Chem. Soc. 2020, 142, 2857–2867. 10.1021/jacs.9b11126. [DOI] [PubMed] [Google Scholar]
Associated Data
This section collects any data citations, data availability statements, or supplementary materials included in this article.