

Abstract

Glycerol-3-phosphate dehydrogenase is a biomedically important enzyme that plays a crucial role in lipid biosynthesis. It is activated by a ligand-gated conformational change that is necessary for the enzyme to reach a catalytically competent conformation capable of efficient transition-state stabilization. While the human form (hlGPDH) has been the subject of extensive structural and biochemical studies, corresponding computational studies to support and extend experimental observations have been lacking. We perform here detailed empirical valence bond and Hamiltonian replica exchange molecular dynamics simulations of wild-type hlGPDH and its variants, as well as providing a crystal structure of the binary hlGPDH·NAD R269A variant where the enzyme is present in the open conformation. We estimated the activation free energies for the hydride transfer reaction in wild-type and substituted hlGPDH and investigated the effect of mutations on catalysis from a detailed structural study. In particular, the K120A and R269A variants increase both the volume and solvent exposure of the active site, with concomitant loss of catalytic activity. In addition, the R269 side chain interacts with both the Q295 side chain on the catalytic loop, and the substrate phosphodianion. Our structural data and simulations illustrate the critical role of this side chain in facilitating the closure of hlGPDH into a catalytically competent conformation, through modulating the flexibility of a key catalytic loop (292-LNGQKL-297). This, in turn, rationalizes a tremendous 41,000 fold decrease experimentally in the turnover number, kcat, upon truncating this residue, as loop closure is essential for both correct positioning of key catalytic residues in the active site, as well as sequestering the active site from the solvent. Taken together, our data highlight the importance of this ligand-gated conformational change in catalysis, a feature that can be exploited both for protein engineering and for the design of allosteric inhibitors targeting this biomedically important enzyme.
Keywords: glycerol-3-phosphate dehydrogenase, loop dynamics, transition state stabilization, empirical valence bond, Hamiltonian replica exchange
Introduction
Human liver glycerol-3-phosphate dehydrogenase (hlGPDH) is a dimeric enzyme that catalyzes the NADH-dependent reduction of cytosolic dihydroxyacetone phosphate (DHAP) to glycerol-3-phosphate (G3P), a compound which serves as a key precursor for lipid synthesis.1 The reaction catalyzed by hlGPDH involves hydride transfer from NADH to the C2 position of the substrate DHAP, as well as protonation at the carbonyl oxygen of DHAP (Figure 1).2−5
Figure 1.

(top) Overlay of the tertiary structure of ternary hlGPDH·NAD·DHAP complexes with the catalytic loop (292-LNGQKL-297) in either the catalytically inactive “open” conformation (magenta, PDB ID: 6E8Y(5,6)) or the catalytically competent “closed” conformation (gold, PDB ID: 6E90(5,6)). Shown here are also the positions of key active site side chains responsible for maintaining the closed conformation of the catalytic loop, as well as the relative position of the substrate DHAP and the cofactor NADH. (bottom) Mechanisms for the sequential hydride and proton transfer reactions catalyzed by wild-type hlGPDH.
Curiously, while hlGPDH is a key metabolic enzyme,7 it has only been subject to classical studies to characterize the protein’s structure and kinetic mechanism;5,8−12 however, an analysis of this enzyme’s reaction mechanism has not yet been performed. In addition, as with a range of other enzymes, such as triosephosphate isomerase (TIM),13,14 orotidine 5′-monophosphate decarboxylase (OMPDC),15 β-phosphoglucomutase,16 and 1-deoxy-d-xylulose-5-phosphate reductoisomerase,17,18hlGPDH utilizes the binding energy of the phosphodianion of the substrate DHAP [and of the phosphite dianion piece in the case of the reaction with the truncated substrate, glycolaldehyde (GA)] to drive an enzyme conformational change, from a floppy inactive open enzyme to a rigid catalytically active closed form.11,19 In the cases of OMPDC, TIM, and hlGPDH, up to two-thirds of the total 11–12 kcal·mol–1 intrinsic binding interactions between the enzyme and the phosphodianion substrate fragment is utilized in the stabilization of catalytically active-caged complexes which, in turn, provide strong stabilization of the transition states (TSs) for proton/hydride transfer and decarboxylation reactions.11,19
In the case of hlGPDH, X-ray crystal structures for the binary hlGPDH·NAD (PDB ID: 1X0X(4,6) and 6E8Z(5,6)) and ternary hlGPDH·NAD·DHAP (PDB ID: 1WPQ(4,6) and 6E90(5,6)) complexes of hlGPDH demonstrate that the binding of the substrate DHAP triggers a conformational change from a catalytically inactive open to a catalytically competent closed conformation of a flexible protein loop (292-LNGQKL-297, Figure 1),11 analogous to similar conformational changes observed in enzymes, such as TIM13,14 and OMPDC.15 Of particular interest to the present work is the side chain of R269, which acts as a bridge between this flexible loop and the substrate, as it is simultaneously ion-paired with the substrate phosphodianion via its guanidinium group, while also interacting with Q295 from the flexible loop of hlGPDH (Figure 1). Truncation of Q295 and R269 to alanine (Q295A and R269A) has been shown to lead to 3.0 and 9.1 kcal·mol–1 destabilization of the TS for the reduction of DHAP,11 respectively (in terms of decrease in kcat/KM), and the R269A variant in particular has been shown to lead to a 41,000 fold decrease in the turnover number (kcat).5,20 This impaired catalytic activity has been ascribed to the electrostatic destabilization of the TS in the substituted enzymes.11 However, while electrostatic destabilization through the loss of the ion pair between R269 and the substrate phosphodianion will clearly play a role in facilitating the loss of activity upon truncation of this residue, additional effects from structural perturbations and incomplete closure of the flexible loop upon the truncation of the arginine side chain cannot be ruled out. This possibility is supported by the fact that single point mutations in enzymes have been shown to bring about large conformational changes that can alter their functionally relevant motions in a catalytically deleterious way.21−23 We note also that for related enzymes, such as dihydrofolate reductase24 and TIM,25 such loop motions have been shown to be partially rate-limiting for the chemical step.
In the present study, we have combined empirical valence bond (EVB)26 simulations with Hamiltonian replica exchange molecular dynamics (HREX-MD) simulations27 in order to model the hydride transfer reaction catalyzed by hlGPDH, as well as the impact of K120A, R269A, and Q295A substitutions on the catalytic activity of the enzyme. Parallel to this, we present a new crystal structure for the R269A variant of the hlGPDH·NAD binary complex, which demonstrates that this single-point mutation has a substantial impact on both the active site configuration and the position of the flexible loop. This crystal structure serves in turn as a starting point for our HREX-MD simulations to study the conformational dynamics of the catalytic loop. Through this combination of X-ray crystallography and atomistic simulations, we obtain insights both into the molecular origin for the ≫1000 fold rate acceleration for the hlGPDH-catalyzed reaction (compared to the corresponding nonenzymatic reaction, kcat/kuncat),5 as well as demonstrating the critical importance of full closure of the flexible loop for efficient catalysis by this enzyme. This builds on our earlier detailed studies of the conformational dynamics of the analogous loop 6 in TIM,28 and further showcases how enhanced sampling simulations combined with multiscale models capable of reliably describing the chemical step of catalysis can be used as powerful tools to obtain insights into the role of loop dynamics in enzyme catalysis.
Methodology
EVB Simulations
Following from our previous recent studies of the proton transfer reactions catalyzed by TIM, in the present work, we used the EVB approach26 to model the chemical reaction catalyzed by hlGPDH (Figure 1), using a similar protocol as that described in our previous work.28−31 Specifically, we modeled the hydride transfer reaction based on the valence bond states, as shown in Figure 2. Simulations of the reaction catalyzed by wild-type hlGPDH , as well as by the K120A, Q295A, and R269A variants of this enzyme were performed (i.e., 4 independent simulation systems in total).
Figure 2.

Valence bond states used in this work to describe the hydride transfer reaction catalyzed by hlGPDH. Only the nicotinamide ring of the cofactor was placed in the EVB region, with the remainder of the cofactor treated purely classically. Note however that the EVB region is also described using the same classical force field, and the main difference between the EVB and surrounding regions is the cutoffs used for evaluating nonbonded interactions, as well as the use of Morse potentials and an alternative vdW potential to describe atoms directly involved in the reaction, as described in the main text and Supporting Information.
All simulations were performed using the 2.05 Å resolution structure of hlGPDH in the complex with the substrate DHAP and the cofactor NAD (PDB ID: 6E90(5,6)) as a starting point. In the case of the K120A, Q295A, and R269A variants, alanine substitutions were performed in silico by manual truncation of the side chain of the relevant residue(s), using the structure of the wild-type enzyme.
All resulting systems were solvated in a water sphere of TIP3P32 water molecules, with a radius of 24 Å, centered on the bridging oxygen atom of the nicotinamide-bound ribose sugar and phosphate group of the NADH cofactor, and described using the surface-constraint all-atom solvent model.33 The system was then described using a standard multilayer approach in which all residues within the inner 85% of the water sphere were fully mobile, those in the outer 15% were subjected to a 10 kcal·mol–1 Å–2 harmonic positional restraint to restrain them to their original crystallographic positions, and all residues outside the droplet were essentially fixed to their crystallographic positions using a 200 kcal·mol–1 Å–2 restraint, as in our previous work.28−31 All residues within the mobile region (i.e., the inner 85% of the water sphere) were assigned their expected ionization states at physiological pH, based on a combination of empirical screening using PROPKA 3.134 and visual inspection. All other residues, in particular residues outside the water droplet, were kept in their neutral form and restrained to their crystallographic positions as described above, as is standard practice to avoid system instabilities being introduced to the simulations because of the presence of unscreened charges outside the explicit simulation sphere. A full list of ionized residues and histidine protonation patterns in our simulations is provided in Table S1. All nonbonded interactions were calculated with a 10 Å cutoff, except for the reacting atoms (shown in Figure 2) to which a 99 Å (i.e. in principle infinite) cutoff was applied to describe the nonbonded interactions. Long-range interactions were treated using the local reaction field approach.35
All simulations in this work were performed using the Q5 simulation package,36 and the OPLS-AA force field.37 OPLS-AA compatible parameters and partial charges for the cofactor and substrate in different EVB states were obtained using Schrödinger’s MacroModel, v. 9.19,38 and Gaussian 16 Rev. A.03,39 at the HF/6-31G(d)/SMD level of theory and using the standard restrained electrostatic potential (RESP) procedure,40 respectively. All EVB parameters used in this work are provided as the Supporting Information. All systems were gradually heated up from 0.01 to 300 K over 140 ps, while initially applying 200 kcal·mol–1 Å–2 harmonic positional restraints on all heavy atoms in the system. These restraints were gradually removed during the heating procedure, until only weak (0.5 kcal·mol–1 Å–2) positional restraints remained on the atoms consisting of the “EVB region” of the simulations, described using the valence bond states, as shown in Figure 2, which was maintained during both equilibration and EVB simulations. Once each system had been heated to 300 K, a further 40 ns of classical MD equilibration was performed for each replica for each system, and the end-point of each classical MD equilibration run was used as the starting point for the subsequent EVB simulation. The convergence of the initial equilibration runs, over all replicas, is shown in Figure S1.
The EVB simulations were performed using the standard EVB free energy perturbation/umbrella sampling procedure that has been described in detail elsewhere.26,41 Each EVB simulation was performed in 51 EVB mapping windows of 200 ps in length, and 30 replicas were performed per system. This led to 40 ns equilibration time and 10.2 ns EVB simulation time per replica, 1.2 μs equilibration and 306 ns EVB simulation time per system (30 replicas/system), and 6.0 μs equilibration 1.530 μs EVB simulation time in total over all 4 independent enzyme variants being considered in this work (5 sets of simulations total, as, in the case of the K120A variant, we performed two separate sets of simulations with the adjacent D260 side chain either protonated or deprotonated, as described in the main text). In addition, all equilibrations and subsequent EVB simulations were performed at and propagated from the approximate EVB TS (λ = 0.5), in line with our previous work,28−31 in order to improve sampling and accelerate the simulations [as EVB trajectories can be propagated toward reactant and product states (PSs) simultaneously].
In order to calibrate our EVB parameters, that is, the coupling-parameter Hij and the gas-phase shift parameter α (for a more detailed definition of these parameters, see e.g. ref (41)), we calibrated the wild-type enzyme to reproduce experimental activation and reaction free energies, using the same valence bond states as for simulating the enzyme-catalyzed reactions (Figure 2). The activation and reaction free energies, ΔG⧧ and ΔG0, were fit to reproduce values of 14.2 and −6.2 kcal·mol–1 for the hydride transfer reaction based on data presented in refs (5) and (42). The resulting EVB parameters from this calibration are provided with all other EVB parameters used in this work in the Supporting Information, and once the EVB parameters had been calibrated to reproduce the energetics of the reaction catalyzed by the wild-type enzyme, the same parameters were then transferred, unchanged, to describe the corresponding reaction in all enzyme variants studied here.
HREX-MD Simulations
HREX-MD simulations were performed in order to explore the conformational sampling of the flexible loop (L292–L297) in wild-type hlGPDH and the R269A and Q295A variants, in their unliganded (apo) forms, binary hlGPDH·NAD complexes, as well as the corresponding hlGPDH·NAD·DHAP ternary complexes. In the case of the unliganded wild-type enzyme, binary complexes of the wild-type enzyme and R269A variant, as well as the ternary complex of the wild-type enzyme, PDB IDs: 6E8Y,5,66E8Z,5,66PYP, and 6E90,5,6 were used as simulation starting points, respectively. The starting structures for the Q295A variants were constructed from the wild-type enzyme by the manual truncation of the Q295 side chain. The binary and unliganded variants were constructed by deleting DHAP and both ligands, respectively. In the case of the R269A ternary complex, the starting structure was generated from the structure of the binary complex by manual placement of substrate DHAP in the active site based on overlaying this structure with the structure of the wild-type ternary complex, as in the case of our EVB simulations. The unliganded form of the R269A variant was constructed by simply deleting the ligands present in the crystal structure of the binary complex. In the case of the Q295A variant, all models were created by truncation of the Q295 side chain to alanine in the starting structures for the corresponding simulations of the wild-type enzyme.
All HREX-MD simulations were performed using GROMACS 5.0.4,43,44 interfaced with the PLUMED v. 2.5.0 plugin.45 In all cases, the protein was described using the Amber ff99SB-ILDN force field,46 whereas parameters to describe the substrate DHAP and the NAD cofactors were obtained using the General AMBER Force Field 2 (GAFF2).47,48 The partial charges of the substrate and cofactor were obtained using the RESP approach40 and Gaussian 16 Rev. A.03 with the level of theory mentioned above,39 using an Antechamber as implemented into AMBER 16,49 and based on the electrostatic potential obtained at the HF/6-31G(d)/SMD level of theory. All nonstandard (substrate and cofactor) parameters used in the HREX-MD simulations are provided in Tables S2–S4 of the Supporting Information. All ionizable residues were kept in their default protonation states at physiological pH, as both estimation of side chain pKa values using PROPKA 3.134 and visual inspection indicated no residues with pKa deviations.
All four starting structures were solvated in a cubic box of TIP3P water molecules,32 with a distance of at least 12 Å from the solute to the edge of the box. The system charge was then neutralized by the addition of Na+ counter ions, followed by 50,000 steps of steepest descent minimization, with 1000 kJ mol–1 nm–2 positional restraints placed on all heavy atoms in the system. This was followed by the first 5 ns of equilibration in a canonical (NVT) ensemble, and then a further 5 ns of equilibration at in an isothermal–isobaric (NPT) ensemble, with the positional restraints maintained on all solute heavy atoms in order to allow water molecules to penetrate the solvent accessible region of the protein. A final 5 ns of equilibration was performed in an NPT ensemble, with the positional restraints removed to allow the solute atoms to equilibrate. The root-mean-square deviation (RMSD) of all backbone atoms of each system after equilibration is shown in Figure S2.
In both the initial equilibration and subsequent HREX-MD simulations, the target temperature was maintained at 300 K using a v-rescale thermostat50 with a time constant of 0.1 ps, and pressure was maintained at 1 atm using a Parinello–Rahman barostat51 with a time constant of 2 ps. The cutoffs for short-range van der Waals (vdW) and electrostatic interactions were each set to 10 Å, and long-range electrostatic interactions were described using the particle mesh Ewald approach,52 in conjunction with periodic boundary conditions. All simulations were performed using a 2 fs time step.
Once equilibrated, the final configuration of the system after each equilibration was then used as the starting structure for the subsequent HREX-MD simulations. The loop region from residues L292 to L297 was selected as the “hot” region for the HREX-MD simulations. The partial charges and Lennard-Jones parameters of atoms in the hot region were scaled by √λ and λ, respectively. The proper dihedral angles were scaled by either √λ or λ, depending on whether both the first and fourth atoms of the dihedral, or just one of the two atoms of the dihedral, were located in the hot region, respectively. All HREX-MD simulations were performed using 6 replicas, with the scaling factor, λ, exponentially ranging from 1.0 to 0.6 (corresponding to an effective temperature range of 300–500 K). Exchanges between neighboring replicas were attempted every 2 ps, and configurations were saved every 2 ps. Each replica was sampled for 300 ns for all simulations, resulting in an average exchange rate of 20–30% in these simulations. Only the unscaled replica (λ = 1.0) was used for further analysis.
Simulation Analysis
All energy analysis in this work was performed using the QCalc module of Q5,36 and all structural analysis was performed using VMD 1.9.3,53 with the exception of the analysis of root mean square fluctuations (RMSF) of individual residues during the simulations, which was performed using GROMACS 5.0.4.43,44 Active site volumes for wild-type hlGPDH and its variants were calculated from 30 × 40 ns of MD equilibration performed at the respective TS complexes using a Pocket Volume Measurer (POVME) 3.0,54 with snapshots taken every 100 ps of the simulations.
In the case of our HREX-MD simulations, two-dimensional energy surfaces were generated based on the RMSD of all Cα atoms of the flexible loop and on the distance between the center of mass (CoM) of the N-terminal domain of the hlGPDH variants (due to its rigidity, as it provides a less mobile frame of reference for the loop position) and the CoM of the Cα atoms of the flexible loop. Crystallographic evidence suggests that the conformational changes of the loop mainly occur at the hinges connecting the N- and C-terminal domains of the protein5 and that the R269A substitution perturbs the C-terminal domain of the protein. The relative free energy surface at 300 K was derived from the probability distribution along the reaction coordinate, R. Here, R (so-called order parameters) are the loop Cα RMSD and the CoM distance. The free energy is then plotted along these order parameters obtain the corresponding free energy surface. We have also plotted protein–substrate hydrogen bonding interactions as a function of the same order parameters in order to examine how they change across each surface. The analysis of protein–substrate hydrogen bonding interactions and active site volumes were also performed on individual structures of core states obtained by performing clustering analysis on the free energy surfaces using InfleCS.55 Analysis was performed following ref (55), using 50 grids with a maximum of 10 components.
Dynamic cross-correlation matrices (DCCM) were calculated using Bio3D56 from simulations performed on wild-type hlGPDH and the R269A variant. This approach is based on measuring linear atomic displacements during the course of simulations. We calculated the covariance (cij) between atoms i and j, based on the displacement of all Cα atoms in our simulations. Subsequent network analysis of the correlated motions pinpointed from this analysis was used to identify protein segments with coupled dynamics. A weighted network graph was then constructed where each node represents an individual residue (based on the Cα atom), and the weight of the connection between nodes i and j represents their respective cross-correlation value, cij. Here, we used a network construction model similar to that introduced by Luthey-Schulten and co-workers.57 However, the network edges were constructed based on the minimum Cα–Cα cross-correlation value between all residues. Network edges were added for (i) residue pairs with |cij| ≥ 0.4 and with a Cα–Cα distance dij ≤ 8 Å. The edge weights were calculated from −log(|cij|). For each correlation network, hierarchical clustering was performed to generate aggregate nodal clusters, or communities, that are highly intraconnected but loosely interconnected. This was done using an edge-betweenness clustering algorithm similar to that introduced by Girvan and Newman,58 to yield a coarser community network.
Determination of the Structure of the hlGPDH R269A Variant
The structure of the R269A variant of hlGPDH was solved using methods similar to that used previously for the wild-type enzyme.5 The R269A variant of hlGPDH was crystallized using hanging drop vapor diffusion with a crystallization cocktail of 175 mM KCl, 23% PEG 20000, 0.1 M Bis–Tris propane, pH 7.0. The protein was incubated with 5 mM NAD and 15 mM DHAP. A crystal was cryoprotected by transferring the protein through three solutions containing 28% PEG 20000, 220 mM KCl, 0.1 M Bis–Tris propane, 15 mM DHAP, 1 mM NAD, and 7.5, 15, and 30% PEP42659 and plunging the loop containing the crystal directly in liquid nitrogen.
Data were collected at beamline 23-IDB of the Advanced Photon Source at the Argonne National Laboratory. Diffraction data were integrated and scaled with iMOSFLM.60 The structure was screened for molecular placement using models of both the open and closed conformations. The best solution and electron density for the complete model was obtained using a model of the open conformation from which ligand and solvent atoms were removed, along with the side chain of R269. The model was refined through iterative rounds of manual model building and refinement with the PHENIX suite of programs.61 The final model contains a dimer in the asymmetric unit; chain A is complete from residues A2 through M349, while chain B also consists of residues 2–349, with two disordered loops occurring between D123–L129 and L290–L297. A complete molecule of NAD is seen in chain A, along with a molecule of erythrose derived from the cryoprotectant. In chain B, density for the phosphates of the NAD cofactor is observed; however, density does not support the inclusion of the remainder of the ligand molecule. DHAP was not observed in either chain. Chain A, was used for modeling and analysis described herein. The final structure has been deposited with the Protein Data Bank,6 PDB ID: 6PYP.
Results and Discussion
Studying the Mechanism of the Reduction of DHAP by Wild-Type hlGPDH
There have been a range of structural analyses of glycerol-3-phosphate dehydrogenases from different organisms that provide important information into the overall structure of the enzyme5,11,62 (including characterizing the flexible loop 292-LNGQKL-297), as well as biochemical and kinetic studies of the catalytic activity of different GPDHs,1,5,11,63 and the activation of GPDH by phosphite dianions.9,64 In addition, the examination of primary deuterium kinetic isotope effects (1° DKIEs) of the hydride transfer catalyzed by wild-type and substituted GPDHs show that these values fall within a very narrow range (2.4–3.1) for reactions spanning a 9.1 kcal·mol–1 change in the reaction driving force (ΔΔG⧧).8,12 This strongly suggests that the rate acceleration for the GPDH-catalyzed reaction is because of the stabilization of the classical TS for hydride transfer, rather than having a large contribution from quantum mechanical tunneling, allowing us to model these hydride transfer reactions using classical EVB simulations.
While the cofactor is clearly the hydride donor in this process, either one of the two active site lysine residues (K120 and K204), with side chains within 2.8 Å of the DHAP carbonyl group, are positioned to act as viable proton donors (Figure 1, based on distances between the nitrogen atom of the lysine side chain, and the carbonyl oxygen of DHAP in PDB ID: 6E90(5,6)). It was recently suggested5 that the side chain alkyl ammonium cation of K120, which is ion paired with the side chain of D260, can function as a Brønsted acid and donate a proton to the carbonyl oxygen of the substrate. This was based on the fact that in the structure of the nonproductive ternary complex of hlGPDH·NAD·DHAP (PDB ID: 6E90(5,6)), the Nε atom of K120 lies nearly coplanar with the plane defined by the trigonal C=O bond of DHAP, facilitating proton transfer from K120 to the carbonyl oxygen, whereas the corresponding Nε atom of K204 (distance 2.8 Å) lies well below this plane and was therefore judged to be less likely to participate in the protonation of carbonyl oxygen (Figure 1). In fact, truncation of the cationic side chain of K120 to alanine (K120A) resulted in 5.3 kcal·mol–1 destabilization of the TS for reduction of DHAP by hlGPDH.5 Clearly, in addition to acting as potential Brønsted acids, both K120 and K204 will be important in stabilizing the developing negative charge at the carbonyl oxygen of the substrate during hydride transfer from NADH and DHAP, and therefore it would be expected that the truncation of either residue would be detrimental to catalysis. In addition, K120 is involved in an ion pair with D260, which would be expected to increase its pKa. However, empirical pKa estimates of the pKa of these two lysine side chains, performed using PROPKA 3.134 (using PDB ID: 6E90(5,6)), predict pKa values of ∼8 and ∼10 (chains A and B, in which DHAP is bound in the active site) for the side chains of K120 and K204, respectively.
In this work, we primarily focus on the rate-determining hydride transfer reaction, which we model by performing EVB simulations (Figure 1). Hydride transfer to the substrate DHAP results in the formation of an alkoxide product with a build-up of the negative charge on the carbonyl oxygen. At this point, the pKa difference between the resulting alkoxide (∼17)65 and either K120 or K204 (pKas in the range of 8–10 based on empirical estimates using PROPKA 3.1)34 will make the subsequent proton transfer reaction spontaneous and not rate limiting, and therefore we have not focused on this step in the present work. As described in the Methodology section, we calibrated the hydride transfer catalyzed by wild-type hlGPDH against existing experimental data, and then modeled the reaction catalyzed by all substituted variants using the same EVB parameters, allowing us to quantify and rationalize the effect of different amino acid substitutions.
The resulting activation and reaction free energies from our EVB simulations are shown in Figure 3 and Table 1 for all enzyme variants, and representative snapshots of key stationary points in the wild-type enzyme are shown in Figure 4. A similar computational protocol to model the effect of active site-directed substitutions on the activation barrier for TIM-catalyzed deprotonation of bound triosephosphate substrates showed good agreement (±1 kcal·mol–1) between ΔΔGexp⧧ and ΔΔGcalc for eight different variants.31 By contrast, in the present case, there is good agreement between ΔΔGexp⧧ and ΔΔGcalc for only the Q295A variant of hlGPDH, and large differences (ΔGcalc⧧ – ΔGexp) = ΔΔGcalc→exp⧧ of −3.8 and 3.6 kcal·mol–1, respectively, for the R269A and K120A variants (Table 1), resulting in a correlation coefficient of R2 = 0.45 between the calculated and experimental activation free energies (Figure 3).
Figure 3.

(A) Comparison of experimental (red, ΔGexp⧧) and calculated (blue, ΔGcalc) activation free energies for the hydride transfer reaction catalyzed by wild-type and substituted variants of hlGPDH. Experimental data were adapted from refs,5,20,66 and calculated values are averages and SEM over 30 individual EVB trajectories per system, as described in the Methodology section. We note that the error bars are not easy to see as the errors on both experimental and calculated activation free energies are small; these values are presented as raw data in Table 1. (B) Correlation between experimental and calculated activation free energies for the hydride transfer reaction catalyzed by hlGPDH. The correlation coefficient was calculated using linear regression analysis. All energies are provided in kcal·mol–1.
Table 1. Calculated and Experimental Activation Barriers (ΔG⧧), and Changes in Gibbs Free Energy (ΔG0) for Hydride Transfer from NADH to DHAP, Catalyzed by Wild-Type and Variants of Glycerol-3-phosphate Dehydrogenase (hlGPDH) at 25 °Ca.
| variant | ΔGexp⧧ | ΔGcalc⧧ | ΔG0,calc | ΔΔGWT→mut,exp⧧b | ΔΔGWT→mut,calc⧧c | ΔΔGcalc→exp⧧d |
|---|---|---|---|---|---|---|
| wild-type | 14.2 | 14.2 ± 0.3 | –6.2 ± 0.3 | 0.0 | 0.0 | 0.0 |
| K120A | 17.5 | 21.1 ± 0.2 | 0.4 ± 0.4 | 3.3 | 6.9 | 3.6 |
| K120A/D260[H+]e | 17.5 | 15.0 ± 0.2 | –8.4 ± 0.3 | 3.3 | 0.8 | –2.5 |
| R269A | 20.5 | 16.7 ± 0.2 | –1.1 ± 0.3 | 6.3 | 2.5 | –3.8 |
| Q295A | 14.7 | 15.6 ± 0.3 | –4.9 ± 0.4 | 0.5 | 1.4 | 0.9 |
The calculated energies are averages and SEM over 30 independent trajectories per system, determined as described in the Methodology section.
The difference between the experimental activation barrier for the hydride transfer reaction catalyzed by wild-type hlGPDH and the variant enzyme (ΔΔGWT→mut,exp⧧).
The difference between the calculated activation free energies for the hydride transfer reaction catalyzed by wild-type hlGPDH and the variant enzyme (ΔΔGWT→mut,calc⧧).
The difference between the experimental and calculated activation free energies for the hydride transfer reaction catalyzed by wild-type hlGPDH or the enzyme variant (ΔΔGcalc→exp⧧).
The EVB calculated energetics for the K120A variant with the D260 side chain protonated include a 2 kcal·mol–1 correction for the protonation of this side chain, based on a calculated pKa of 6 from PROPKA 3.1,34 obtained as described in the main text. The experimental activation free energies are calculated from kinetic data presented in refs (5, 20, 66) and in Table S5. All energies are presented in kcal·mol–1.
Figure 4.

Representative structures of the reacting atoms in the key stationary points for the hydride transfer reaction catalyzed by hlGPDH at the MC, TS, and PS extracted from EVB trajectories of this reaction. Structures were selected based on clustering analysis using the method of Daura et al.(67) as implemented in GROMACS 5.0.4.27,43,44 The distances of the hydride transfer from NADH are highlighted and changing during the reaction, and the hydride being transferred is shown as a sphere for clarity. Distances are shown as average distances over the entire simulation trajectory (for the corresponding distances for other variants see Table S6).
The quality of the calculated predictions of ΔG⧧ is only as good as the quality of the input structures provided for the calculations. While one might expect the amino acid substitutions presented in Table 1 to have only a conservative effect on structure, the failure of calculations to model the experimental effects of site-directed substitutions on ΔG⧧ for hydride transfer in the case of the K120A and R269A variants are likely due to structural effects upon amino acid substitution that are not captured in our model. Furthermore, based on our simulations [averages and standard error of the mean (SEM) from our equilibration runs] the smaller 2.7 ± 0.001 Å separation of the ε-NH3+ of K120 and the carbonyl oxygen of DHAP compared with the 6.9 ± 0.003 Å separation between this oxygen and the R269 side chain cation predicts the larger value of ΔΔGcalc⧧ for the K120A compared to the R269A variant. This suggests that the values of ΔΔGexp cannot be rationalized by a simple consideration of the electrostatic interactions of these side chains with a negative charge that develops at the carbonyl oxygen at the TS for hydride transfer. We propose that the effects of these substitutions on ΔGexp⧧ reflect possible changes in the protein structure, which have not been modeled by EVB calculations that assume similar structures for ternary complexes to wild-type and variants of hlGPDH. These have been outlined in detail below for each substitution.
R269A Substitution
The R269 side chain forms an ion pair with the phosphodianion at the Michaelis complex (MC) to DHAP (Figure 1). If this side chain at wild-type hlGPDH is positioned to provide optimal stabilization of the TS for hydride transfer, then any effect of the R269A substitution on the enzyme structure will result in an increase in ΔGexp⧧ compared with ΔGcalc, determined for wild-type hlGPDH. To explore the role of this side chain in catalysis, we determined a new crystal structure of the binary hlGPDH·NAD complex using the R269A variant (see the Methodology section and Table S7), in which it can be seen that truncation of R269 leads to the opening of the flexible loop (Figure 5) that would be expected to allow for greater solvent penetration of the active site. We note that we were unable to obtain a structure of the ternary hlGPDH·NAD·DHAP complex, despite the inclusion of DHAP in both the crystallization and cryoprotecting solutions at a concentration 3× higher than the KM for the R269A variant.20
Figure 5.

Overlay of the tertiary structure of the wild-type ternary hlGPDH·NAD·DHAP complex (gold, PDB ID: 6E90(5,6)), and the binary hlGPDH·NAD complex of the R269A variant (blue, this work). Shown here are also the positions of key active site side chains responsible for maintaining the closed conformation of the catalytic loop, as well as the relative position of the substrate DHAP and the cofactor NADH in the wild-type ternary complex. As can be seen from this figure, the R269A truncation leads to opening of the flexible catalytic loop (292-LNGQKL-297) coupled with the corresponding displacement of key catalytic residues such as K204.
We propose that elimination of the cation–anion pair at the R269A variant favors a change in the structure of the wild-type ternary complex (Figure 1) from the active, tightly closed structure4,5 to a less active open form, with a structure similar to that for the binary complex between the R269A variant and NAD reported in this work (Figure 5). The large value of ΔGexp⧧ = 20.5 kcal·mol–1 would then reflect the low catalytic activity of the open ternary complex of the R269A variant, and/or the small fraction of the total R269A variant that exists in the active closed form.5,20
The R269 side chain and 1.0 M exogenous guanidine cations provide similar 9.1 and 6.7 kcal·mol–1 stabilization,20 respectively, of TSs for biomolecular hydride transfer to DHAP catalyzed by the R269A variant of hlGPDH. This provides evidence that an inactive open ternary complex for the R269A variant is in equilibrium with a low concentration of the active closed enzyme and that the binding energy of the exogenous guanidine cation is utilized to drive this equilibrium to the closed enzyme.11,20 There is similar evidence that binding interactions of exogenous phosphite dianion and of ethyl ammonium cations, respectively, are utilized to stabilize active closed conformations of wild-type hlGPDH complexed to GA and of the K120A variant complexed to DHAP.68 These results emphasize the importance of the utilization of the substrate or side chain binding energy in the stabilization of rigid and structured active enzymes.69,70 It is not surprising that it might be difficult to model effects of side chain substitutions that promote a large relaxation of the tight MC to an open protein.
K120A Substitution
The ion pair between the K120 and D260 side chains at wild-type hlGPDH suggests a role for D260 in (pre)organization of the K120 side chain to provide optimal stabilizing interactions with the anionic TS.5,68 The K120A substitution replaces stabilizing interactions between the side chain cation and anionic TS with destabilizing interactions from the ionized D260 side chain anion. The K120A substitution results in a calculated increase in the pKa of the D260 side chain from 4.0 ± 0.003 to 6.0 ± 0.004 (average values and sem of pKa values estimated for snapshots taken every 100 ps of our equilibration runs, evaluated using PROPKA 3.134). This means that at pH 7.5, 4% of the total side chain will be protonated. Upon protonation of D260 in the K120A variant, two water molecules interact with the carbonyl oxygen of substrate DHAP, one of which is located in the hole created by the D260 side chain and is highly stable over our simulations. This water molecule interacts favorably with the developing O-2 anion at the TS for hydride transfer, and, when combined by the removal of the electrostatic repulsion between the D260 side chain and the developing charge on the O-2 anion at the TS for hydride transfer, leads to a lower calculated barrier of 15 kcal·mol–1 for this variant (Table 1). This value includes the energetic penalty for protonating the D260 side chain at pH 7.5 (we obtain an activation free energy of 13 kcal·mol–1 for this variant if assuming the side chain to be fully protonated). We note again, however, that the presence of this side chain in its protonated form is a rare event, and the deprotonated form of D260 will still dominate. In addition, a recent computational study71 has suggested that the protonated form of D260 acts as a general base donating a proton also in the wild-type enzyme; however, it is implausible that the D260 side chain would be protonated in the wild-type enzyme as this side chain clearly forms a salt-bridge with the side chain of K120 (Figure 1).
Probing the Molecular Basis for the Catalytic Effect of hlGPDH
Having examined the energetic impact of different amino acid substitutions on the enzyme-catalyzed reaction (Table 1 and Figure 3), we then proceeded to explore in more detail the molecular origin for the catalytic effect of hlGPDH as well as the effect of the different active site substitutions studied here. We first examined protein–substrate interactions in the form of total hydrogen bonds formed between the protein and the substrate DHAP (Table S8). We note the formation of nearly 8.5 hydrogen bonds between the substrate and protein residues at the MC in the case of the wild-type enzyme and the Q295A variant, and between 6.6 and 8 protein–substrate hydrogen bonds in the case of the K120A and R269A variants. These numbers increase by ∼1 hydrogen bond at the transition and PSs for the wild-type enzyme and the R269A and Q295A variants and decrease by about 0.5 hydrogen bonds in the case of the K120A variant (where we also over-estimate the activation free energy by 3.6 kcal·mol–1). It is clear that the loss of stabilizing hydrogen-bonding interactions would be catalytically unfavorable, and indeed, we obtain a good correlation between calculated activation free energies and the corresponding average number of protein–substrate hydrogen bonds at the TS (R2 = −0.7 calculated using linear regression analysis).
Following from this, we examined the electrostatic contributions of each individual amino acid to the calculated activation free energies (ΔG⧧, Figure 6 and Table S9), extracted from our calculated EVB trajectories using the linear response approximation (LRA),35,72 as in our previous work.29−31Figures 1 and 5 illustrate the position of key catalytic residues in the active site. Unsurprisingly, the main stabilizing interactions come from the two active site lysine side chains (K120 and K204), offset to some degree by a destabilizing interaction with the D260 side chain. The truncation of either lysine side chain to alanine would therefore lead to a significant loss in electrostatic stabilization of the TS, as observed also in Table 1 in the case of the K120A variant. Surprisingly, we obtain only modest stabilization from the R269A side chain (Figure 6), supporting that the role of this residue is primarily to facilitate binding of the phosphodianion group of the substrate and closure of the catalytic loop. Included in Figure 6 is also the sum total electrostatic contribution of all solvent molecules in the system for comparison.
Figure 6.

Electrostatic contributions (ΔΔGelec⧧, kcal·mol–1) to the calculated activation free energies for the hydride transfer reaction catalyzed by wild-type hlGPDH and variants. These values were calculated by applying the LRA35,72 to the calculated EVB trajectories, as in our previous work.29−31 Calculated values are averages and SEM extracted from 30 independent EVB trajectories. All energies are provided in kcal·mol–1. Shown here are only those residues that contribute at least 0.5 kcal·mol–1 to the calculated activation free energies, and the SEM is <0.1 kcal·mol–1 for all systems. The corresponding raw data for this figure are presented in Table S9.
Related to this, we also compared the active site volumes of wild-type and substituted forms of hlGPDH, calculated using the POVME 3.054 (Table S10). This yields an active site volume of 24.6 ± 7.2 Å3 for the wild-type enzyme, with smaller increases to 31.6 ± 10.2 and 26.9 ± 7.4 Å3 in the case of the K120A and Q295A variants, and a substantial increase to 78.0 ± 10.0 Å3 in the case of the R269A variant. The increase in the R269A variant would be consistent with incomplete closure of the catalytic loop, as suggested also by the crystal structure of the binary complex (Figure 5). Note that these data were calculated based on snapshots taken from our equilibration simulations, which were performed at the EVB TS, as described in the Methodology section, and are averages and standard deviations over all snapshots used for the calculations.
As larger active site volumes would be expected to also increase the solvent exposure of the reacting atoms, we additionally calculated the number of water molecules within 4.0 Å of the reacting atoms (donor, hydride, and acceptor), at the MCs and TSs of the hydride transfer reaction catalyzed by hlGPDH (Table S11), extracted from our EVB simulations. As can be seen from this data, the substitutions allow for a slight increase in the number of water molecules in close proximity to the reacting atoms, with up to an additional water molecule being able to enter the active site upon truncation of K120 and R269 site side chains to alanine (note that Q295A behaves similarly to the wild-type). We obtain a high correlation (R2 = 0.9, calculated using linear regression analysis) between the number of active site water molecules and the calculated activation free energies. The observed loss of enzyme activity upon increased solvation of the active site is in good agreement with previous computational studies on enzymes, such as TIM,29 ketosteroid isomerase,73 and serum paraoxonase 1,74 among others.
We also examined the impact of the active site substitutions on the geometric parameters (donor–acceptor distances and donor–hydride–acceptor angles) for the hydride transfer reaction catalyzed by this enzyme (Table S6). In the case of the substitutions, the donor–acceptor distance increases (again slightly) compared to the wild-type enzyme; however, the differences are typically small (<0.4 Å), and there is no clear trend between the geometric parameters and the calculated activation free energies. Therefore, based on this data, variations in the donor–acceptor distance are by themselves unlikely to account either for the catalytic effect of the wild-type enzyme, or for the detrimental effect of the substitutions on hlGPDH activity.
Finally, we considered the correlation between the calculated activation and reaction free energies (ΔGcalc⧧ and ΔG0,calc, respectively) for the redox reaction catalyzed by wild-type hlGPDH and its variants (Figure 7). From this data it can be seen that, as in our previous work on TIM,29,31 there is a good linear correlation between both the experimental (R2 = 0.8) and calculated (R2 = 0.9) activation free energies, and the calculated reaction free energies for the hlGPDH-catalyzed hydride transfer reactions, with slopes of 0.9 for both correlations (calculated using linear regression analysis). This suggests that our calculations are likely doing a good job of capturing the electrostatic stabilization of the intermediate/PSs of the energetically unfavorable charge transfer process occurring during the redox reaction. However, they are missing larger structural effects and changes to conformational dynamics upon introducing these amino acid substitutions, as is clear for example from our HREX simulations of the R269A variant (see the subsequent section for discussion of changes in loop dynamics upon the truncation of R269 to alanine).
Figure 7.
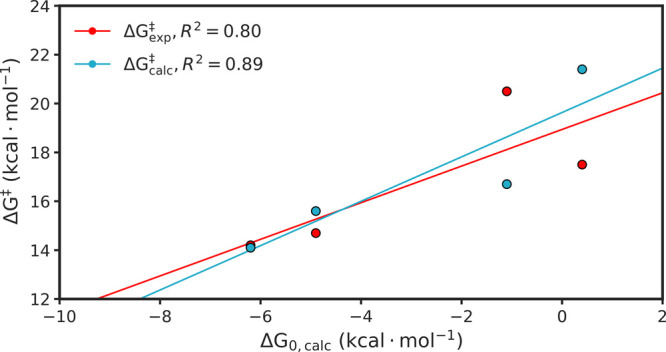
Correlation between calculated activation (ΔGcalc⧧) and reaction (ΔG0,calc) free energies for the hydride transfer reaction catalyzed by wild-type and substituted forms of hlGDPH. Correlation coefficients and Brønsted β values were calculated using linear regression analysis. For an overview of the reaction mechanism, see Figure 1, and for the raw data used to make this figure, see Table 1.
Exploring the Role of the Flexible Active Site Loop in Catalysis by hlGPDH
Based on the calculated active site volumes shown in Table S10, it can be seen that the amino acid substitutions considered in this work both expand the volume of the active site as well as increase its flexibility (as evidenced by the larger standard deviations on the calculated values for the different hlGPDH variants studied in this work, with the exception of Q295A which is similar to the wild-type enzyme) and that this effect is particularly pronounced in the case of single and double substitutions that include R269A. As a final point, in order to further explore potential differences in flexibility of the active site loop (L292–L297) between the wild-type enzyme and the R269A and Q295A variants, we also performed HREX-MD simulations as described in the Methodology section in order to explore the dynamics of the flexible loop in hlGPDH. Here, the loop motion was defined as a function of the RMSD of the flexible loop (residues L292–L297), and the distance between the centers of mass of the N-terminal domain and the Cα atoms of the flexible loop. The population probability obtained from the simulations was then translated into the free energy landscape, as shown in Figure 8 (for the convergence of the HREX-MD simulations see Figure S3).
Figure 8.

Relative free energy surfaces (T = 300 K) obtained from the HREX-MD simulations. Shown here are data obtained from simulations of the (A,D,G) unliganded, (B,E,H) binary, and (C,F,I) ternary complexes of wild-type hlGPDH, (A–C), Q295A (D–F), and R269A (G–I) variants, respectively. These surfaces are defined as a function of the CoMs between the Cα atoms of the flexible loop (residues 292–297) and the N-terminal domain (residue 1–191) of the enzyme, and the RMSD of the Cα atoms of the flexible loop. The closed and open states of the loops are projected onto the free energy surface, using as reference structures chains A of the crystal structures of wild-type hlGPDH in the closed state (PDB ID: 6E90,5,6 ▼), and the unliganded form of the enzyme in the open state (PDB ID: 6E8Y, ▲), respectively.
From Figure 8, it can be seen that in the case of the both binary complexes or unliganded forms of wild-type, Q295A and R269A hlGPDH (Figure 8A,B,D,E,G,H), the loop is highly flexible and occupies a large energy basin. In the case of the ternary complex of wild-type hlGPDH (Figure 8C), substrate binding focuses the conformational dynamics of the loop, confining it to a smaller basin at a CoM distance of ∼20 Å, closer to the crystallographically observed closed conformation of the enzyme (PDB ID: 6E90(5,6)). This is consistent with the expected ligand-gated conformational change upon binding of substrate DHAP.14,25,75−78 This conformational change is driven largely by the interactions between the substrate phosphodianion and the cationic side chain of R269, and is essential for the placement of the C-terminal domain of the enzyme in a catalytically competent position, through further interactions with other residues in the two helices (R269–T280 and E285–L291) and loops (G281–I284 and L292–L297) of this domain. Specifically, the catalytic loop (292-LNGQKL-297) undergoes closure upon hydrogen bond formation between R269 and Q295 side chains. Therefore, full loop closure is lost in the ternary complex of the R269A variant, where the loop is highly flexible, with the highest population of the loop occupying a “near-open” conformation of the loop, at a CoM distance of ∼23 Å (Figure 8I).
The inability of the loop to sample fully closed conformations in even the complex of the R269A variant is because of the loss of the key interaction network between the phosphodianion group of the substrate, the R269 side chain, and the Q295 side chain (Figure 1), which appears to be essential for maintaining the closed conformation of the loop. In addition, this interaction network is essential for the correct placement of the C-terminal domain of the enzyme, through further interactions with the other residues in the two helices (R269–T280 and E285–L291) and loops (G281–I284 and L292–L297) of this domain. The truncation of R269 to alanine disrupts this interaction network, causing the C-terminal domain to move further from the active site (Figures 5 and 8), resulting in the large loss of activity observed in this variant in large part because of greater solvent penetration into the active site. Interestingly, the Q295A variant (Figure 8D–F) behaves in a fashion that is more similar to that of the wild-type enzyme, and, in the ternary complex, this variant is also able to sample conformations of the catalytic loop that are similar to the closed conformation observed in the wild-type crystal structure. This is in agreement with the small impact of this substitution on the experimental activation free energy for the reduction of DHAP by hlGPDH (Table 1). However, even in this variant, the observed closed conformations are transient because of the increased flexibility of the loop as a result of the truncation of the Q295 side chain. Therefore, while the R269 side chain appears to play an important role in the closure of the enzyme, also the truncation of Q295 appears to be detrimental to the ability of the enzyme to sample catalytically competent fully closed conformations.
Furthermore, the observations of Figure 8 are supported by examining the RMSF of all backbone Cα atoms in each simulated system (Figure S4). This data indicate that while the catalytic loop (292-LNGQKL-297) is relatively rigid in the wild-type ternary complex and in the ternary complex of the Q295A variant, the loop is much more flexible in the ternary complex of the R269A variant, in agreement with our HREX-MD simulations (note that in the unliganded forms and the binary complexes, this loop shows similar flexibility in all variants).
Following from this, we have examined protein–substrate hydrogen bonding interactions and active site volumes during our HREX-MD simulations of the ternary complexes of the wild-type enzyme and the R269A and Q295A variants (Figure S5 and Tables S12–S14). From Figure 8, it can be seen that our HREX-MD simulations do not indicate the presence of individual discrete energy minima but rather indicate the presence of a wide range of loop conformations that are all thermodynamically accessible (within 1–2 kcal·mol–1 of the predicted minimum). Therefore, as a starting point for this analysis, we have projected the number of protein–substrate hydrogen bonding interactions onto the free energy landscapes, as shown in Figure 8, as a function of the same order parameters (Figure S5). As can be seen from this figure, unsurprisingly, we observe a larger number of protein–substrate hydrogen bonding interactions in the case of the wild-type enzyme and the Q295A variants, where the loop samples more closed conformations at the ternary complex than in the case of the R269A variant where the loop appears to be unable to easily sample a closed conformation (Figure 8).
This observation is supported by examining the protein–substrate hydrogen bonding interactions at the centroids of each of the core states obtained from clustering analysis performed on the HREX-MD free energy surfaces using InfleCS,55 as described in the Methodology section (Tables S12–S14). In the case of the wild-type enzyme (Table S12), the observed number of protein–substrate hydrogen bonding interactions ranges from 11 in the structure with the smallest CoM distance to 6 in the structure with the largest CoM distance (i.e., the least and most open conformations of the loop, defined as a function of the CoM distance). In the case of the Q295A variant, we observe a similar narrow range of values (4–8 interactions depending on loop conformation), which drops to 0–4 interactions in the R269A variant, again depending on loop conformation. This is a more radical drop than observed in our EVB simulations (Table S8), but this is likely representative of the fact that the much shorter timescales of our EVB simulations do not allow for full opening of the catalytic loop (the system maintains an average backbone RMSD of 0.46 Å across all trajectories in our EVB simulations). In contrast, in our HREX-MD simulations, we observe much greater conformational flexibility of the loop, with substantial loop opening (average RMSD of ∼11 Å from the initial crystal structure), which causes the more dramatic loss of key protein–substrate interactions in the R269A variant compared to the wild-type enzyme and the Q295A variant.
In addition, similarly to our EVB simulations (Table S10), which show similar average active site volumes for the wild-type enzyme and the Q295A variant, with a huge increase in the average active site volume in the R269A variant, we observe much larger active site volumes in the R269A variant (Table S14) than we do in either the wild-type enzyme (Table S12) or the Q295A variant. We note that we observe much larger active site volumes overall from our HREX-MD simulations than from our EVB simulations (Table S10), but, once again, this is due to the longer simulation timescales and the enhanced sampling, which allows for greater sampling of more open loop conformations in our HREX-MD simulations than in our EVB simulations. The increase in active site volume caused by the opening of the catalytic loop would be expected, in turn, to lead to greater solvent exposure of the active site, which our EVB simulations indicate is catalytically detrimental.
Overall, these observations agree well with kinetic data that indicates similar activation free energies for the hydride transfer reaction catalyzed by the wild-type enzyme and the Q295A variant, with significantly higher activation free energies in the case of the R269A variant (Table 1).5,20,66 That is, the R269A truncation is observed to increase the activation free energy for the hydride transfer reaction by 6.3 kcal·mol–1. Our EVB simulations capture 2.5 kcal·mol–1 of this effect, but, as the catalytic loop remains closed in our EVB simulations, they do not fully capture the active site changes caused by the increased mobility of the catalytic loop. The remaining ∼4 kcal·mol–1 of the observed increase in activation free energy in the R269A variant is likely linked to the altered conformational ensemble of the ternary complex of the R269A variant toward a more open conformation of the flexible loop, and the associated loss of stabilizing interactions with the substrate in the absence of the full loop closure.
Finally, we calculated DCCM in order to explore the correlated motions in the ternary complexes of wild-type hlGPDH and the R269A variant. Figure 9 indicates the existence of several anticorrelated motions in both enzyme variants, especially in the C-terminal domain. We note that while the HREX-MD simulations were performed for the full dimer, only DCCM for one monomer are shown in panels (B,E) for clarity. It can be seen here that both correlated and anticorrelated motions appear to be reduced in the R269A variant compared to the wild-type enzyme. In the case of the catalytic loop, this likely occurs due to the loss of interactions between the R269 side chain and the ligand, which keeps the loop in a relatively rigid closed state in the wild-type enzyme. We note also that the K120 and R269 side chains are a part of a highly conserved set of amino acid side chains that extend from Q295 to K120, and which include N270, N205, K204, T264, D260, and K120 (Figure 1). Clearly, any perturbation of this network is likely to disturb several hydrogen bonds.
Figure 9.

Exploring coupled motions in HREX simulations of wild-type hlGPDH and the R269A variant. (A,D) Representative structures of the wild-type enzyme and R269A variants, respectively, color coded according to the community network analysis shown in panels (C,F). (B,E) DCCM plots for wild-type and R269A hlGPDH, respectively. Here, the color coding from red to blue represents anticorrelated (−1) and correlated (+1) motions, respectively, and white (0) represents no correlation. (C,F) Results of the community network analysis on HREX-MD simulations of the dynamics of wild-type hlGPDH and the R269A variant. Note that while all analysis was performed on the HREX-MD simulations of the dimeric forms of these variants, we show here only DCCM data for one monomer for clarity (the community network analysis shown here is for the full dimer).
Our observations are further supported by the community network analysis performed using Bio3D,56 which shows 18 communities in total (Figure 9). The residues that fall into these community nodes are color coded in accordance to their community and as shown in Figure 9A,D [note that the community network analysis is shown for the full dimer, but only one monomer is shown in panels (A,D) for clarity]. The flexible loop and surrounding region (spanning residues E275–E300) exist as separate communities in the wild-type enzyme, which is relatively rigid compared to the R269A variant, due to the absence of the hydrogen bonding network the R269 side chain participates in the latter case. Therefore, this community vanishes and becomes part of the larger C-terminal domain community in the R269A variant. This provides further evidence that the R269 side chain plays a vital role in facilitating a network of hydrogen bonding interactions that are critical for attaining a catalytically optimal closed conformation of the enzyme.
Conclusions
Human glycerol-3-phosphate dehydrogenase is a biomedically important enzyme79 that, like related enzymes such as TIM,13,14 OMPDC,15 β-phosphoglucomutase,16 and 1-deoxy-d-xylulose-5-phosphate reductoisomerase,17,18 is activated by a ligand-gated conformational change that in turn ultimately stabilizes the TS for the hydride transfer reaction catalyzed by this enzyme.11
While there have been extensive structural5,11,62 and biochemical1,5,8−12,63,64 studies of this enzyme, corresponding computational investigations of the reaction mechanism of this enzyme and the role of flexibility of the catalytic loop (292-LNGQKL-297) in catalysis have been lacking. In particular, a limitation of structural studies is the static view that is provided in a single crystal structure. The use of multiple structures, including of wild-type and mutant enzymes bound to multiple ligands, can serve as the foundation for understanding the dynamic nature of enzymes to be investigated through detailed kinetic analyses and computational simulations. Simulations, in particular, can play an important role in providing a detailed analysis and thus expanding our understanding of the structural, energetic, and dynamical differences introduced by the substitution of key active site residues, thus rationalizing experimentally observed changes in turnover numbers upon introducing such substitutions.
In the present study, we perform detailed EVB26 simulations coupled with HREX-MD simulations27 of wild-type hlGPDH and variants, as well as providing a crystal structure of the R269A variant, in order to better understand the reaction mechanism and the role of R269 in maintaining the structural integrity of the active site and allowing for optimal catalysis.
We have considered only the initial hydride transfer step as the subsequent proton transfer would be expected to be spontaneous (Figure 1). In addition, based on pKa considerations, it is likely that any of the K120, K204, or D260 side chains could fulfill the role of the proton donor for the subsequent proton transfer step. That is, these three side chains appear to have very similar pKa values ranging from 6 to 8 based on empirical pKa estimates using PROPKA 3.1.34 Note that in the case of the D260 side chain, the value of ∼6 refers to the K120A variant where this side chain has the ability to be partially protonated and take over the role of K120 (Table 1), and not the wild-type enzyme. When this is compared to the pKa of the alkoxide ion resulting from the hydride transfer step (Figure 1), which would be estimated to be ∼17,65 it is clear that the protonation of this intermediate will be facile, and any of these three side chains could act as a potential proton source, with the thermodynamically preferred proton donor changing upon the introduction of active site amino acid substitutions, such as in the case of the K120A variant.
Our EVB simulations show significant loss of electrostatic stabilization upon truncation of the K120 side chain, resulting in a corresponding increase in activation free energy. We note that in the R269A variant, displacement of the C-terminal domain disrupts the positioning of the K204 side chain (Figure 5), which likely leads to the substantial experimentally observed loss of activity in the R269A-based variants (Table 1). However, our calculations are not able to fully reproduce this energetic effect, most likely due to structural changes in the ternary complex that our calculations are unable to capture. We have also explored the molecular origin of the observed effects, noting an interplay between loss of stabilizing interactions (both electrostatic interactions and hydrogen bonds), and increased active site volume (leading to increased solvent penetration of the active site) likely leading to the loss of activity in the K120A and R269A variants.
The truncation of the R269 side chain to alanine has been shown to be particularly detrimental to the catalytic efficiency of the enzyme, showing 9.1 kcal·mol–1 destabilization for the reduction of DHAP,11 (in terms of decrease in kcat/KM), and a 41,000-fold decrease in the turnover number (kcat).5,20 This is perhaps unsurprising in light of the fact that this residue interacts with both the Q295 side chain (which is located on the catalytic loop) and the phosphodianion substrate (Figure 1), and therefore provides both electrostatic stabilization of the TS, and structural stabilization of the active site. We present here a structure of the hlGPDH·NAD binary complex of this R269A variant, and demonstrate that truncation of this residue causes a shift in the position of the C-terminal domain, with an associated shift towards a more open conformation of the enzyme compared to the wild-type, as well as a shift in placement of key catalytic residues as a result of this (Figure 5). This conformational shift is clearly important, as our EVB simulations indicate that simply truncating the side chain of R269 to alanine using the structure of the wild-type enzyme as a starting point can only capture 2.5 kcal·mol–1 of the experimentally observed 6.3 kcal·mol–1 increase in activation free energy upon truncation of this side chain,5,20 and, therefore, electrostatic considerations alone are not sufficient to fully account for the tremendous observed loss of activity.
Following from this, detailed HREX-MD simulations of the wild-type enzyme, as well as computationally constructed models of the ternary complexes of the R269A and Q295A variants also highlight the greater conformational flexibility of the catalytic loop. Furthermore, these studies suggest that the R269A variant prevents the catalytic loop from reaching a fully closed conformation even in the ternary complex (interestingly, this effect is not as pronounced in the Q295A variant, in agreement with the minimal impact of this substitution on the experimental activation free energy, Table 1). DCCM analysis and community modeling illustrate changes in both correlated motions and community distribution upon truncation of R269 that provides further evidence of the vital role this residue plays in facilitating a network of hydrogen bonding interactions that are critically for being able to attain a catalytically optimal closed conformation of the enzyme. In analogy, detailed biochemical studies of the rate and equilibrium constants for an analogous ligand-gated conformational change in orotidine 5′-monophosphate decarboxylase from Saccharomyces cerevisiae (ScOMPDC) provide evidence that side chain substitutions, which destabilize the closed form of ScOMPDC, result in a decrease in kcat for decarboxylation when ΔGo > 0 for loop closure at the MC to OMP.80 In the current case, the R269 side chain appears to be critical for holding the catalytic loop of hlGPDH in a closed conformation, and therefore by analogy modulation of the equilibrium constant for loop closure (preventing full closure of the loop) upon truncation of this side chain to alanine may be contributing to the large unfavorable effect of this mutation on kcat.5,20 Therefore, in the case of the R269A variant, the dianion binding energy is no longer sufficient to drive full loop closure at the MC to DHAP, so that the complex to DHAP exists in the loop open form, that shows a low reactivity for hydride transfer to DHAP. In the case of the K120A variant, in contrast, the partially protonated D260 likely takes over the role of the excised side chain (Table 1).
In summary, our simulations rationalize the effect of the substitution of key catalytic residues, highlighting in particular the impact of the loss of key stabilizing interactions, as well as expansion of active site volume and increased solvation of the active site as amino acid side chains are truncated as driving forces for the experimentally observed loss of activity in the enzyme variants studied here. In addition, we show that regulation of conformational dynamics and structural stability through precision in placement of key catalytic residues is critical, and, in particular, the truncation of the R269 side chain to alanine blocks the ligand-gated conformational change that is absolutely essential to catalysis in this enzyme. As biochemical studies of the rate and equilibrium constants for the related ligand-gated conformational change in ScOMPDC suggest a similar correlation between the equilibrium constant for loop closure and the resulting turnover number,80 it is likely that this is observation is unique to hlGPDH but rather can be a more common feature of enzymes that are activated by ligand-gated conformational changes. Targeting this conformational change can therefore be harnessed both in protein engineering, and in the design of selective inhibitors for this biomedically important system.
Acknowledgments
This work was supported by the Swedish Research Council (VR, grants 2015-04298 and 2019-03499), the Human Frontier Science Program (grant RGP0041/2017), and the Knut and Alice Wallenberg Foundation (2018.0140). Computational resources were provided by the Swedish National Infrastructure for Computing (SNIC, 2017/12-11, 2018/12-3 and 2019/2-1). All calculations were performed on the Rackham cluster at UPPMAX, the Kebnekaise cluster at HPC2N Umeå, and the Tetralith Cluster at NSC Linköping through computational resources provided by the Swedish National Infrastructure for computing (SNIC 2017/12-11, 2018/2-3, and SNIC 2019/35-55). This work is additionally funded in part by grants from the National Institutes of Health (AI116998 to A.M.G. and GM116921 and GM134881 to J.P.R.). Work at the GM/CA@APS is funded in part by the National Cancer Institute (ACB-12002) and National Institutes of General Medical Sciences (AGM-12006).
Supporting Information Available
The Supporting Information is available free of charge at https://pubs.acs.org/doi/10.1021/acscatal.0c02757.
Additional simulation analysis and any nonstandard force field parameters used for our simulations (including all EVB parameters necessary to reproduce our work). Crystallographic coordinates of the R269A variant have been deposited to the Protein Data Bank, PDB ID: 6PYP (PDF)
The authors declare no competing financial interest.
Supplementary Material
References
- Bentley P.; Dickinson F. M. A Study of the Kinetics and Mechanism of Rabbit Muscle L-Glycerol 3-Phosphate Dehydrogenase. Biochem. J. 1974, 143, 19–27. 10.1042/bj1430019. [DOI] [PMC free article] [PubMed] [Google Scholar]
- Bentley P.; Dickinson F. M.; Jones I. G. Purification and Properties of Rabbit Muscle L-Glycerol 3-Phosphate Dehydrogenase. Biochem. J. 1973, 135, 853–859. 10.1042/bj1350853. [DOI] [PMC free article] [PubMed] [Google Scholar]
- Bentley P.; Dickinson F. M. A Study of the Coenzyme-Binding Characteristics of Rabbit Muscle L-Glycerol 3-Phosphate Dehydrogenase. Biochem. J. 1974, 143, 11–17. 10.1042/bj1430011. [DOI] [PMC free article] [PubMed] [Google Scholar]
- Ou X.; Ji C.; Han X.; Zhao X.; Li X.; Mao Y.; Wong L.-L.; Bartlam M.; Rao Z. Crystal Structures of Human Glycerol 3-phosphate Dehydrogenase 1 (GPD1). J. Mol. Biol. 2006, 357, 858–869. 10.1016/j.jmb.2005.12.074. [DOI] [PubMed] [Google Scholar]
- Mydy L. S.; Cristobal J. R.; Katigbak R. D.; Bauer P.; Reyes A. C.; Kamerlin S. C. L.; Richard J. P.; Gulick A. M. Human Glycerol 3-Phosphate Dehydrogenase: X-ray Crystal Structures That Guide the Interpretation of Mutagenesis Studies. Biochemistry 2019, 58, 1061–1073. 10.1021/acs.biochem.8b01103. [DOI] [PMC free article] [PubMed] [Google Scholar]
- Berman H. M.; Westbrook J.; Feng Z.; Gilliland G.; Bhat T. N.; Weissig H.; Shindyalov I. N.; Bourne P. E. The Protein Data Bank. Nucleic Acids Res. 2000, 28, 235–242. 10.1093/nar/28.1.235. [DOI] [PMC free article] [PubMed] [Google Scholar]
- Harding J. W. Jr.; Pyeritz E. A.; Copeland E. S.; White H. B. 3rd. Role of Glycerol 3-Phosphate Dehydrogenase in Glyceride Metabolism. Effect of Diet on Enzyme Activities in Chicken Liver. Biochem. J. 1975, 146, 223–229. 10.1042/bj1460223. [DOI] [PMC free article] [PubMed] [Google Scholar]
- Reyes A. C.; Amyes T. L.; Richard J. P. Structure-Reactivity Effects on Intrinsic Primary Kinetic Isotope Effects for Hydride Transfer Catalyzed by Glycerol-3-phosphate Dehydrogenase. J. Am. Chem. Soc. 2016, 138, 14526–14529. 10.1021/jacs.6b07028. [DOI] [PMC free article] [PubMed] [Google Scholar]
- Reyes A. C.; Amyes T. L.; Richard J. P. Enzyme Architecture: Self-Assembly of Enzyme and Substrate Pieces of Glycerol-3-Phosphate Dehydrogenase into a Robust Catalyst of Hydride Transfer. J. Am. Chem. Soc. 2016, 138, 15251–15259. 10.1021/jacs.6b09936. [DOI] [PMC free article] [PubMed] [Google Scholar]
- Reyes A. C.; Amyes T. L.; Richard J. P. Enzyme Architecture: A Startling Role for Asn270 in Glycerol 3-Phosphate Dehydrogenase-Catalyzed Hydride Transfer. Biochemistry 2016, 55, 1429–1432. 10.1021/acs.biochem.6b00116. [DOI] [PMC free article] [PubMed] [Google Scholar]
- He R.; Reyes A. C.; Amyes T. L.; Richard J. P. Enzyme Architecture: The Role of a Flexible Loop in Activation of Glycerol-3-phosphate Dehydrogenase for Catalysis of Hydride Transfer. Biochemistry 2018, 57, 3227–3236. 10.1021/acs.biochem.7b01282. [DOI] [PMC free article] [PubMed] [Google Scholar]
- Reyes A. C.; Amyes T. L.; Richard J. P. Primary Deuterium Kinetic Isotope Effects: A Probe for the Origin of the Rate Acceleration for Hydride Transfer Catalyzed by Glycerol-3-Phosphate Dehydrogenase. Biochemistry 2018, 57, 4338–4348. 10.1021/acs.biochem.8b00536. [DOI] [PMC free article] [PubMed] [Google Scholar]
- Richard J. P. A Paradigm for Enzyme-Catalyzed Proton Transfer at Carbon: Triosephosphate Isomerase. Biochemistry 2012, 51, 2652–2661. 10.1021/bi300195b. [DOI] [PMC free article] [PubMed] [Google Scholar]
- Richard J. P.; Zhai X.; Malabanan M. M. Reflections on the Catalytic Power of a TIM-barrel. Bioorg. Chem. 2014, 57, 206–212. 10.1016/j.bioorg.2014.07.001. [DOI] [PMC free article] [PubMed] [Google Scholar]
- Richard J. P.; Amyes T. L.; Reyes A. C. Orotidine 5′-Monophosphate Decarboxylase: Probing the Limits of the Possible for Enzyme Catalysis. Acc. Chem. Res. 2018, 51, 960–969. 10.1021/acs.accounts.8b00059. [DOI] [PMC free article] [PubMed] [Google Scholar]
- Ray W. J.; Long J. W.; Owens J. D. An Analysis of the Substrate-Induced Rate Effect in the Phosphoglucomutase System. Biochemistry 1976, 15, 4006–4017. 10.1021/bi00663a015. [DOI] [PubMed] [Google Scholar]
- Kholodar S. A.; Murkin A. S. DXP Reductoisomerase: Reaction of the Substrate in Pieces Reveals a Catalytic Role for the Nonreacting Phosphodianion Group. Biochemistry 2013, 52, 2302–2308. 10.1021/bi400092n. [DOI] [PubMed] [Google Scholar]
- Kholodar S. A.; Allen C. L.; Gulick A. M.; Murkin A. S. The Role of Phosphate in a Multistep Enzymatic Reaction: Reactions of the Substrate and Intermediate in Pieces. J. Am. Chem. Soc. 2015, 137, 2748–2756. 10.1021/ja512911f. [DOI] [PMC free article] [PubMed] [Google Scholar]
- Richard J. P. Protein Flexibility and Stiffness Enable Efficient Enzymatic Catalysis. J. Am. Chem. Soc. 2019, 141, 3320–3331. 10.1021/jacs.8b10836. [DOI] [PMC free article] [PubMed] [Google Scholar]
- Reyes A. C.; Koudelka A. P.; Amyes T. L.; Richard J. P. Enzyme Architecture: Optimization of Transition State Stabilization from a Cation–Phosphodianion Pair. J. Am. Chem. Soc. 2015, 137, 5312–5315. 10.1021/jacs.5b02202. [DOI] [PMC free article] [PubMed] [Google Scholar]
- Tokuriki N.; Tawfik D. S. Protein Dynamism and Evolvability. Science 2009, 324, 203–207. 10.1126/science.1169375. [DOI] [PubMed] [Google Scholar]
- Tyukhtenko S.; Rajarshi G.; Karageorgos I.; Zvonok N.; Gallagher E. S.; Huang H.; Vemuri K.; Hudgens J. W.; Ma X.; Nasr M. L.; Pavlopoulos S.; Makriyannis A. Effects of Distal Mutations on the Structure, Dynamics and Catalysis of Human Monoacylglycerol Lipase. Sci. Rep. 2018, 8, 1719. 10.1038/s41598-017-19135-7. [DOI] [PMC free article] [PubMed] [Google Scholar]
- Petrović D.; Risso V. A.; Kamerlin S. C. L.; Sanchez-Ruiz J. M. Conformational Dynamics and Enzyme Evolution. J. R. Soc., Interface 2018, 15, 20180330. 10.1098/rsif.2018.0330. [DOI] [PMC free article] [PubMed] [Google Scholar]
- Boehr D. D.; Dyson H. J.; Wright P. E. Conformational Relaxation following Hydride Transfer Plays a Limiting Role in Dihydrofolate Reductase Catalysis. Biochemistry 2008, 47, 9227–9233. 10.1021/bi801102e. [DOI] [PMC free article] [PubMed] [Google Scholar]
- Rozovsky S.; Jogl G.; Tong L.; McDermott A. E. Solution-State NMR Investigations of Triosephosphate Isomerase Active Site Loop Motion: Ligand Release in Relation to Active Site Loop Dynamics. J. Mol. Biol. 2001, 310, 271–280. 10.1006/jmbi.2001.4673. [DOI] [PubMed] [Google Scholar]
- Warshel A.; Weiss R. M. An Empirical Valence Bond Approach for Comparing Reactions in Solutions and in Enzymes. J. Am. Chem. Soc. 1980, 102, 6218–6226. 10.1021/ja00540a008. [DOI] [Google Scholar]
- Bussi G. Hamiltonian Replica Exchange in GROMACS: A Flexible Implementation. Mol. Phys. 2014, 112, 379–384. 10.1080/00268976.2013.824126. [DOI] [Google Scholar]
- Liao Q.; Kulkarni Y.; Sengupta U.; Petrović D.; Mulholland A. J.; van der Kamp M. W.; Strodel B.; Kamerlin S. C. L. Loop Motion in Triosephosphate Isomerase Is Not a Simple Open and Shut Case. J. Am. Chem. Soc. 2018, 140, 15889–15903. 10.1021/jacs.8b09378. [DOI] [PubMed] [Google Scholar]
- Kulkarni Y. S.; Liao Q.; Petrović D.; Krüger D. M.; Strodel B.; Amyes T. L.; Richard J. P.; Kamerlin S. C. L. Enzyme Architecture: Modeling the Operation of a Hydrophobic Clamp in Catalysis by Triosephosphate Isomerase. J. Am. Chem. Soc. 2017, 139, 10514–10525. 10.1021/jacs.7b05576. [DOI] [PMC free article] [PubMed] [Google Scholar]
- Kulkarni Y. S.; Liao Q.; Byléhn F.; Amyes T. L.; Richard J. P.; Kamerlin S. C. L. Role of Ligand-Driven Conformational Changes in Enzyme Catalysis: Modeling the Reactivity of the Catalytic Cage of Triosephosphate Isomerase. J. Am. Chem. Soc. 2018, 140, 3854–3857. 10.1021/jacs.8b00251. [DOI] [PMC free article] [PubMed] [Google Scholar]
- Kulkarni Y. S.; Amyes T. L.; Richard J. P.; Kamerlin S. C. L. Uncovering the Role of Key Active-Site Side Chains in Catalysis: An Extended Brønsted Relationship for Substrate Deprotonation Catalyzed by Wild-Type and Variants of Triosephosphate Isomerase. J. Am. Chem. Soc. 2019, 141, 16139–16150. 10.1021/jacs.9b08713. [DOI] [PMC free article] [PubMed] [Google Scholar]
- Jorgensen W. L.; Chandrasekhar J.; Madura J. D.; Impey R. W.; Klein M. L. Comparison of Simple Potential Functions for Simulating Liquid Water. J. Chem. Phys. 1983, 79, 926–935. 10.1063/1.445869. [DOI] [Google Scholar]
- Warshel A.; King G. Polarization Constraints in Molecular Dynamics Simulation of Aqueous Solutions: The Surface Constraint All Atom Solvent (SCAAS) Model. Chem. Phys. Lett. 1985, 121, 124–129. 10.1016/0009-2614(85)87168-2. [DOI] [Google Scholar]
- Olsson M. H. M.; Søndergaard C. R.; Rostkowski M.; Jensen J. H. PROPKA3: Consistent Treatment of Internal and Surface Residues in Empirical pKa Predictions. J. Chem. Theory Comput. 2011, 7, 525–537. 10.1021/ct100578z. [DOI] [PubMed] [Google Scholar]
- Lee F. S.; Warshel A. A Local Reaction Field Method for Fast Evaluation of Long-Range Electrostatic Interactions in Molecular Simulations. J. Chem. Phys. 1992, 97, 3100–3107. 10.1063/1.462997. [DOI] [Google Scholar]
- Marelius J.; Kolmodin K.; Feierberg I.; Åqvist J. Q: A Molecular Dynamics Program for Free Energy Calculations and Empirical Valence Bond Simulations in Biomolecular systems. J. Mol. Graphics Modell. 1998, 16, 213–225. 10.1016/s1093-3263(98)80006-5. [DOI] [PubMed] [Google Scholar]
- Jorgensen W. L.; Maxwell D. S.; Tirado-Rives J. Development and Testing of the OPLS All-Atom Force Field on Conformational Energetics and Properties of Organic Liquids. J. Am. Chem. Soc. 1996, 118, 11225–11236. 10.1021/ja9621760. [DOI] [Google Scholar]
- Schrödinger Release 2013-1. MacroModel, 9.1; Schrödinger, LLC: New York, NY, 2013.
- Frisch M. J.; Trucks G. W.; Schlegel H. B.; Scuseria G. E.; Robb M. A.; Cheeseman J. R.; Scalmani G.; Barone V.; Petersson G. A.; Nakatsuji H.; Li X.; Caricato M.; Marenich A. V.; Gloino J.; Janesko B. G.; Comperts R.; Mennucci B.; Hratchian H. P.; Ortiz J. V.; Izmaylov A. F.; Sonnenberg J. L.; Williams-Young D.; Ding F.; Lipparini F.; Egidi F.; Goings J.; Peng B.; Petrone A.; Henderson T.; Ranasinghe D.; Zakrzewski V. G.; Gao J.; Rega N.; Zheng G.; Lianog W.; Hada M.; Ehara M.; Toyota K.; Fukuda R.; Hasegawa J.; Ishida M.; Nakajima T.; Honda Y.; Kitao O.; Nakai H.; Vreven T.; Throssell K.; Montgomer J. A. Jr.; Peralta J. E.; Ogliaro F.; Bearpark M. J.; Heyd J. J.; Brothers E. N.; Kudin K. N.; Straroverov V. N.; Keith T. A.; Kobayashi R.; Normand J.; Raghavachari K.; Rendell A. P.; Burant J. C.; Iyengar S. S.; Tomasi J.; Cossi M.; Millam J. M.; Klene M.; Adamo C.; Cammi R.; Ochterski J. W.; Martin R. L.; Morokuma K.; Farkas O.; Foresman J. B.; Fox D. J.. Gaussian 16, Revision A.03; Gaussian, Inc.: Wallingford CT, 2016.
- Cieplak P.; Cornell W. D.; Bayly C.; Kollman P. A. Application of the Multimolecule and Multiconformational RESP Methodology to Biopolymers: Charge Derivation for DNA, RNA, and Proteins. J. Comput. Chem. 1995, 16, 1357–1377. 10.1002/jcc.540161106. [DOI] [Google Scholar]
- Shurki A.; Derat E.; Barrozo A.; Kamerlin S. C. L. How Valence Bond Theory Can Help You Understand Your (Bio)Chemical Reaction. Chem. Soc. Rev. 2015, 44, 1037–1052. 10.1039/c4cs00241e. [DOI] [PubMed] [Google Scholar]
- Cai J.; Pietzsch M.; Theobald U.; Rizzi M. Fast Purification and Kinetic Studies of the Glycerol-3-Phosphate Dehydrogenase from Yeast Saccharomyces cerevisiae. J. Biotechnol. 1996, 49, 19–27. 10.1016/0168-1656(96)01509-x. [DOI] [PubMed] [Google Scholar]
- Berendsen H. J. C.; van der Spoel D.; van Drunen R. GROMACS: A Message-Passing Parallel Molecular Dynamics Implementation. Comput. Phys. Commun. 1995, 91, 43–56. 10.1016/0010-4655(95)00042-e. [DOI] [Google Scholar]
- van Der Spoel D.; Lindahl E.; Hess B.; Groenhof G.; Mark A. E.; Berendsen H. J. C. GROMACS: Fast, Flexible, and Free. J. Comput. Chem. 2005, 26, 1701–1718. 10.1002/jcc.20291. [DOI] [PubMed] [Google Scholar]
- Tribello G. A.; Bonomi M.; Branduardi D.; Camilloni C.; Bussi G. PLUMED 2: New Feathers for an Old Bird. Comput. Phys. Commun. 2014, 185, 604–613. 10.1016/j.cpc.2013.09.018. [DOI] [Google Scholar]
- Best R. B.; Hummer G. Optimized Molecular Dynamics Force Fields Applied to the Helix–Coil Transition of Polypeptides. J. Phys. Chem. B 2009, 113, 9004–9015. 10.1021/jp901540t. [DOI] [PMC free article] [PubMed] [Google Scholar]
- Wang J.; Wolf R. M.; Caldwell J. W.; Kollman P. A.; Case D. A. Development and Testing of a General Amber Force Field. J. Comput. Chem. 2004, 25, 1157–1174. 10.1002/jcc.20035. [DOI] [PubMed] [Google Scholar]
- Wang J.; Wang W.; Kollman P. A.; Case D. A. Automatic Atom Type and Bond Perception in Molecular Mechanical Calculations. J. Mol. Graph. Mod. Model. 2006, 25, 247–260. [DOI] [PubMed] [Google Scholar]
- Case D. A.; Betz R. M.; Cerutti D. S.; Cheatham T. E. III; Darden T. A.; Duke R. E.; Giese T. J.; Gohlke H.; Goetz A. W.; Homeyer N.; Izadi S.; Janowski P.; Kaus J.; Kovalenko A.; Lee T. S.; LeGrand S.; Li P.; Lin C.; Luchko T.; Luo R.; Madej B.; Mermelstein D.; Merz K. M.; Monard G.; Nguyen H.; Nguyen H. T.; Omelyan I.; Onufriev A.; Roe D. R.; Roitberg A.; Sagui C.; Simmerlin C. L.; Botello-Smith W. M.; Swails J.; Walker R. C.; Wang J.; Wolf R. M.; Wu X.; Xiao L.; Kollman P. A.. AMBER 2016; University of California: San Francisco, 2016.
- Bussi G.; Donadio D.; Parrinello M. Canonical Sampling Through Velocity Rescaling. J. Chem. Phys. 2007, 126, 014101. 10.1063/1.2408420. [DOI] [PubMed] [Google Scholar]
- Parrinello M.; Rahman A. Polymorphic Transitions in Single Crystals: A New Molecular Dynamics Method. J. Appl. Phys. 1981, 52, 7182–7190. 10.1063/1.328693. [DOI] [Google Scholar]
- Darden T.; York D.; Pedersen L. Particle Mesh Ewald: An N·log(N) Method for Ewald Sums in Large Systems. J. Chem. Phys. 1993, 98, 10089–10092. 10.1063/1.464397. [DOI] [Google Scholar]
- Humphrey W.; Dalke A.; Schulten K. VMD: Visual Molecular Dynamics. J. Mol. Graphics 1996, 14, 33–38. 10.1016/0263-7855(96)00018-5. [DOI] [PubMed] [Google Scholar]
- Wagner J. R.; Sørensen J.; Hensley N.; Wong C.; Zhu C.; Perison T.; Amaro R. E. POVME 3.0: Software for Mapping Binding Pocket Flexibility. J. Chem. Theory Comput. 2017, 13, 4584–4592. 10.1021/acs.jctc.7b00500. [DOI] [PMC free article] [PubMed] [Google Scholar]
- Westerlund A. M.; Delemotte L. InfleCS: Clustering Free Energy Landscapes with Gaussian Mixtures. J. Chem. Theory Comput. 2019, 15, 6752–6759. 10.1021/acs.jctc.9b00454. [DOI] [PubMed] [Google Scholar]
- Grant B. J.; Rodrigues A. P. C.; ElSawy K. M.; McCammon J. A.; Caves L. S. D. Bio3D: An R Package for the Comparative Analysis of Protein Structures. Bioinformatics 2006, 22, 2695–2696. 10.1093/bioinformatics/btl461. [DOI] [PubMed] [Google Scholar]
- Sethi A.; Eargle J.; Black A. A.; Luthey-Schulten Z. Dynamical Networks in tRNA:Protein Complexes. Proc. Natl. Acad. Sci. U.S.A. 2009, 106, 6620–6625. 10.1073/pnas.0810961106. [DOI] [PMC free article] [PubMed] [Google Scholar]
- Girvan M.; Newman M. E. J. Community Structure in Social and Biological Networks. Proc. Natl. Acad. Sci. U.S.A. 2002, 99, 7821–7826. 10.1073/pnas.122653799. [DOI] [PMC free article] [PubMed] [Google Scholar]
- Gulick A. M.; Horswill A. R.; Thoden J. B.; Escalante-Semerena J. C.; Rayment I. Pentaerythritol Propoxylate: A New Crystallization Agent and Cryoprotectant Induces Crystal Growth of 2-Methylcitrate Dehydratase. Acta Crystallogr., Sect. D: Biol. Crystallogr. 2002, 58, 306–309. 10.1107/s0907444901018832. [DOI] [PubMed] [Google Scholar]
- Battye T. G. G.; Kontogiannis L.; Johnson O.; Powell H. R.; Leslie A. G. W. iMOSFLM: A New Graphical Interface for Diffraction-Image Processing with MOSFLM. Acta Crystallogr., Sect. D: Biol. Crystallogr. 2011, 67, 271–281. 10.1107/s0907444910048675. [DOI] [PMC free article] [PubMed] [Google Scholar]
- Adams P. D.; Afonine P. V.; Bunkóczi G.; Chen V. B.; Davis I. W.; Echols N.; Headd J. J.; Hung L.-W.; Kapral G. J.; Grosse-Kunstleve R. W.; McCoy A. J.; Moriarty N. W.; Oeffner R.; Read R. J.; Richardson D. C.; Richardson J. S.; Terwilliger T. C.; Zwart P. H. PHENIX: A Comprehensive Python-Based System for Macromolecular Structure Solution. Acta Crystallogr., Sect. D: Biol. Crystallogr. 2010, 66, 213–221. 10.1107/s0907444909052925. [DOI] [PMC free article] [PubMed] [Google Scholar]
- Fondy T. P.; Levin L.; Sollohub S. J.; Ross C. R. Structural Studies on Nicotinamide Adenine Dinucleotide-linked L-Glycerol 3-Phosphate Dehydrogenase Crystallized from Rat Skeletal Muscle. J. Biol. Chem. 1968, 243, 3148–3160. [PubMed] [Google Scholar]
- Koga Y.; Konishi K.; Kobayashi A.; Kanaya S.; Takano K. Anaerobic Glycerol-3-Phosphate Dehydrogenase Complex from Hyperthermophilic Archaeon Thermococcus kodakarensis KOD1. J. Biosci. Bioeng. 2019, 127, 679–685. 10.1016/j.jbiosc.2018.11.012. [DOI] [PubMed] [Google Scholar]
- Tsang W.-Y.; Amyes T. L.; Richard J. P. A Substrate in Pieces: Allosteric Activation of Glycerol 3-Phosphate Dehydrogenase (NAD+) by Phosphite Dianion. Biochemistry 2008, 47, 4575–4582. 10.1021/bi8001743. [DOI] [PMC free article] [PubMed] [Google Scholar]
- Smith M. B.Organic Chemistry: An Acid-Base Approach, 2nd ed.; Taylor & Francis: Boca Raton, FL, 2015. [Google Scholar]
- Reyes A. C.; Zhai X.; Morgan K. T.; Reinhardt C. J.; Amyes T. L.; Richard J. P. The Activating Oxydianion Binding Domain for Enzyme-Catalyzed Proton Transfer, Hydride Transfer, and Decarboxylation: Specificity and Enzyme Architecture. J. Am. Chem. Soc. 2015, 137, 1372–1382. 10.1021/ja5123842. [DOI] [PMC free article] [PubMed] [Google Scholar]
- Daura X.; Gademann K.; Jaun B.; Seebach D.; van Gunsteren W. F.; Mark A. E. Peptide Folding: When Simulation Meets Experiment. Angew. Chem., Int. Ed. 1999, 38, 236–240. 10.1002/(sici)1521-3773(19990115)38:1/2<236::aid-anie236>3.0.co;2-m. [DOI] [Google Scholar]
- Cristobal J. R.; Reyes A. C.; Richard J. P. The Organization of Active Site Side Chains of Glycerol-3-phosphate Dehydrogenase Promotes Efficient Enzyme Catalysis and Rescue of Variant Enzymes. Biochemistry 2020, 59, 1582–1591. 10.1021/acs.biochem.0c00175. [DOI] [PMC free article] [PubMed] [Google Scholar]
- Amyes T. L.; Malabanan M. M.; Zhai X.; Reyes A. C.; Richard J. P. Enzyme Activation Through the Utilization of Intrinsic Dianion Binding Energy. Protein Eng., Des. Sel. 2017, 30, 159–168. 10.1093/protein/gzw064. [DOI] [PMC free article] [PubMed] [Google Scholar]
- Moreira C.; Calixto A. R.; Richard J. P.; Kamerlin S. C. L. The Role of Ligand-Gated Conformational Changes in Enzyme Catalysis. Biochem. Soc. Trans. 2019, 47, 1449–1460. 10.1042/bst20190298. [DOI] [PMC free article] [PubMed] [Google Scholar]
- Yildiz I.; Yildiz B. S.. Computational Mechanistic Study of Human Liver Glycerol 3-Phosphate Dehydrogenase Using ONIOM Method. J. Phys. Org. Chem. 2020, No. e4104, in press. [Google Scholar]
- Muegge I.; Tao H.; Warshel A. A Fast Estimate of Electrostatic Group Contributions to the Free Energy of Protein-Inhibitor Binding. Protein Eng., Des. Sel. 1997, 10, 1363–1372. 10.1093/protein/10.12.1363. [DOI] [PubMed] [Google Scholar]
- van der Kamp M. W.; Chaudret R.; Mulholland A. J. QM/MM Modelling of Ketosteroid Isomerase Reactivity Indicates That Active Site Closure is Integral to Catalysis. FEBS J. 2013, 280, 3120–3131. 10.1111/febs.12158. [DOI] [PubMed] [Google Scholar]
- Blaha-Nelson D.; Krüger D. M.; Szeler K.; Ben-David M.; Kamerlin S. C. L. Active Site Hydrophobicity and the Convergent Evolution of Paraoxonase Activity in Structurally Divergent Enzymes: The Case of Serum Paraoxonase 1. J. Am. Chem. Soc. 2017, 139, 1155–1167. 10.1021/jacs.6b10801. [DOI] [PMC free article] [PubMed] [Google Scholar]
- Rozovsky S.; McDermott A. E. The Time Scale of the Catalytic Loop Motion in Triosephosphate Isomerase. J. Mol. Biol. 2001, 310, 259–270. 10.1006/jmbi.2001.4672. [DOI] [PubMed] [Google Scholar]
- Loria J. P.; Berlow R. B.; Watt E. D. Characterization of Enzyme Motions by Solution NMR Relaxation Dispersion. Acc. Chem. Res. 2008, 41, 214–221. 10.1021/ar700132n. [DOI] [PubMed] [Google Scholar]
- Kempf J. G.; Jung J.-Y.; Ragain C.; Sampson N. S.; Loria J. P. Dynamic Requirements for a Functional Protein Hinge. J. Mol. Biol. 2007, 368, 131–149. 10.1016/j.jmb.2007.01.074. [DOI] [PMC free article] [PubMed] [Google Scholar]
- Desamero R.; Rozovsky S.; Zhadin N.; McDermott A.; Callender R. Active Site Loop Motion in Triosephosphate Isomerase: T-Jump Relaxation Spectroscopy of Thermal Activation. Biochemistry 2003, 42, 2941–2951. 10.1021/bi026994i. [DOI] [PubMed] [Google Scholar]
- Mráček T.; Drahota Z.; Houštěk J. The Function and the Role of the Mitochondrial Glycerol-3-Phosphate Dehydrogenase in Mammalian Tissues. Biochim. Biophys. Acta 2013, 1827, 401–410. 10.1016/j.bbabio.2012.11.014. [DOI] [PubMed] [Google Scholar]
- Goldman L. M.; Amyes T. L.; Goryanova B.; Gerlt J. A.; Richard J. P. Enzyme Architecture: Deconstruction of the Enzyme-Activating Phosphodianion Interactions of Orotidine 5′-Monophosphate Decarboxylase. J. Am. Chem. Soc. 2014, 136, 10156–10165. 10.1021/ja505037v. [DOI] [PMC free article] [PubMed] [Google Scholar]
Associated Data
This section collects any data citations, data availability statements, or supplementary materials included in this article.