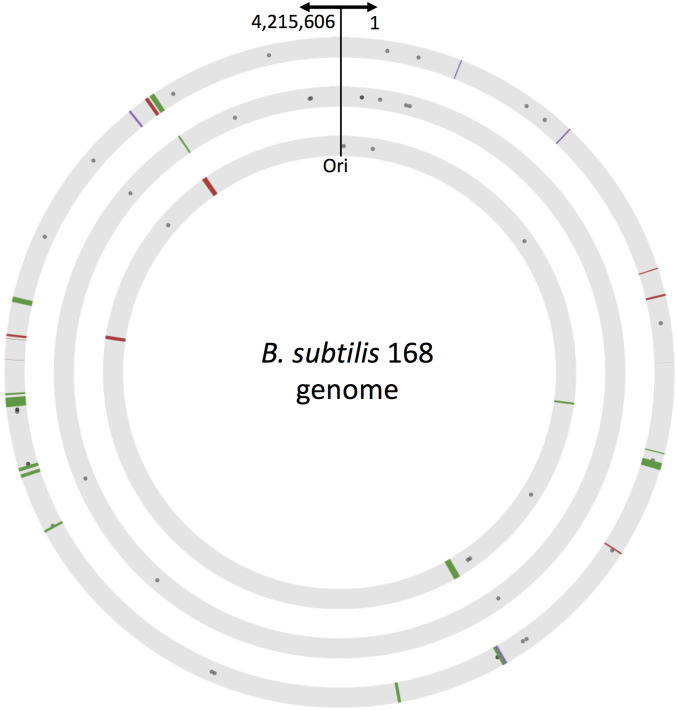
Figure 3.
Genomic location and distance distribution of mutations and HGT fragments. Graphic representation of the genomic location of mutations and HGT fragments identified in other-Bacillus populations 1 (inner circle), 2 (middle circle), and 3 (outer circle). Circles represent the genome of the recipient B. subtilis 168 (keeping the same scale); arrows indicate the location of the origin of replication and coordinates. The locations of all genomic alterations identified in each of the three other-Bacillus populations are marked to scale. Gray dots mark mutations, lines mark HGT-acquired fragments (red: B. spizizenii strain RO-E-2, green: B. subtilis strain RS-D-2 and purple: B. subtilis strain RO-FF-1). The width of each line is proportional to the size of the inserted fragment.

