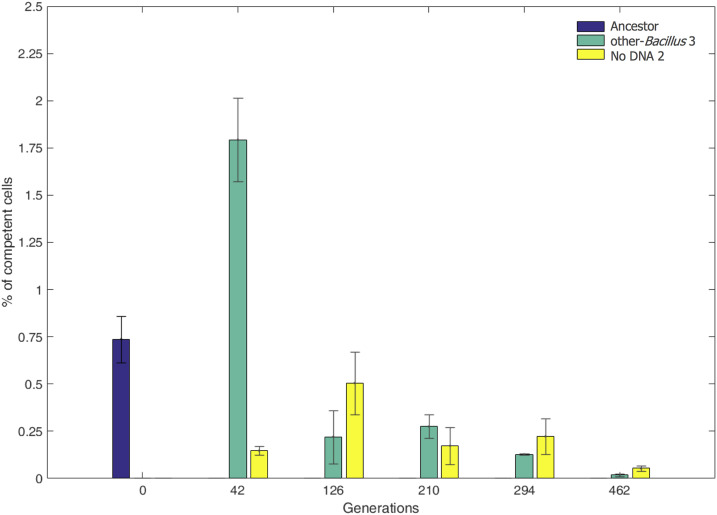
Figure 6.
Decline in competence level during evolution. The percent of competent cells (y-axis) in evolved other-Bacillus population 3 (green) and evolved No-DNA population 2 (yellow) is shown at different time points (x-axis) throughout the evolution experiment, as well as in the ancestral population (blue). Presented are averaged values of three biological replicates; error bars correspond to the SD from the mean.

