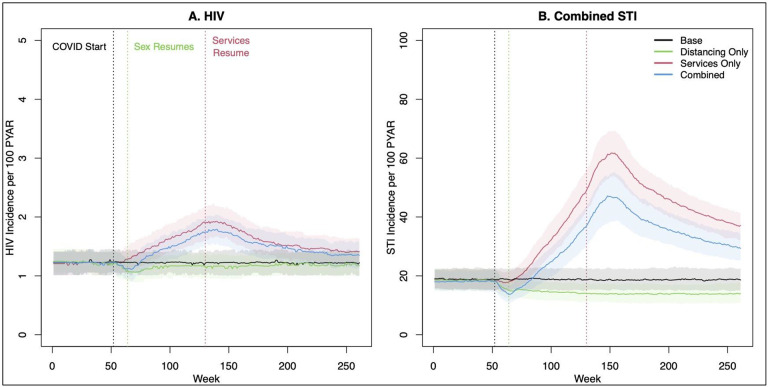
Figure 3.
HIV and combined STI incidence before, during, and after an 18-month period of clinical service interruption and 3-month period of sexual distancing. Model scenarios within each panel compare a 50% relative reduction in behavior only, service interruption only, or both jointly against the base (no change) model. Thick lines show median values and bands show inter-quartile range of values across 500 simulations per scenario.

