

Abstract
Background
Epidemiological and clinical features of patients with COVID‐19 have been reported, but none of them focused on medical staff, and few predictors of the duration of viral shedding have been reported. It is urgent to help healthcare workers prevent and recover quickly from the coronavirus disease 2019 (COVID‐19).
Methods
We enrolled 140 medical workers with COVID‐19 in Wuhan. Epidemiological, demographic, clinical, laboratory, radiological treatment and clinical outcome data were collected, and predictors of the duration of viral shedding were explored through multivariable linear regression analysis.
Results
The medical staff with COVID‐19 presented mild clinical symptoms and showed a low frequency of abnormal laboratory indicators. All the medical staff were cured and discharged, of whom 96 (68.6%) were female, 39 (27.9%) had underlying diseases, the median age was 36.0 years, and 104 (74.3%) were infected whilst working in hospital. The median duration of viral shedding was 25.0 days (IQR:20.0–30.0). Multivariable linear regression analysis showed reducing viral shedding duration was associated with receiving recombinant human interferon alpha (rIFN‐α) treatment, whilst the prolonged duration of viral shedding correlated with the use of glucocorticoid treatment, the durations from the first symptom to hospital admission and the improvement in chest computed tomography (CT) evidence. Moreover, infected healthcare workers with lymphocytes less than 1.1 × 10⁹/L on admission had prolonged viral shedding.
Conclusion
Medical staff with timely medical interventions show milder clinical features. Glucocorticoid treatment and lymphocytes less than 1.1 × 10⁹/L are associated with prolonged viral shedding. Early admission and rIFN‐α treatment help shorten the duration of viral shedding.
Keywords: COVID‐19, viral shedding duration, healthcare workers, clinical features, SARS‐CoV‐2, rIFN‐α

Introduction
Since December 2019, an increasing number of coronavirus disease 2019 (COVID‐19) cases have occurred in Wuhan, China [1, 2, 3, 4]. Initially, most of the patients diagnosed with pneumonia of unknown aetiology shared a history of exposure to the Huanan Seafood Market [1]. The pathogen was a novel coronavirus named severe acute respiratory coronavirus 2 (SARS‐CoV‐2) and discovered in samples of the lower respiratory tract from patients with COVID‐19 by deep sequencing analysis [5]. Similar to most coronaviruses, SARS‐CoV‐2 can infect various mammals (including humans) and birds and can cause respiratory, hepatic enteral and neurological diseases [5].
COVID‐19 emerged and rapidly spread amongst susceptible populations due to the high pathogenicity of SARS‐CoV‐2. A family cluster associated with COVID‐19 confirmed person‐to‐person transmission of SARS‐CoV‐2 [6]. As of 30 March 2020, 82447 SARS‐CoV‐2 infection cases (including 3310 deaths) in China and 693282 SARS‐CoV‐2 infection cases (including 33106 deaths) worldwide have been confirmed [7]. As a high‐risk population, healthcare workers perform their clinical activities in the hospital and are more likely to be exposed to respiratory pathogens. Up to 11 February 2020, 1716 confirmed COVID‐19 cases (including 5 deaths) have been observed amongst Chinese medical staff [8]. It has been confirmed that 8358 Italian health workers tested positive for SARS‐CoV‐2 and 61 doctors died in this pandemic until 30 March 2020, which aggravated the shortage of medical workers [9]. However, clinical manifestations of healthcare workers with COVID‐19 have not been reported.
In this study, we described the epidemiological and clinical characteristics of COVID‐19 amongst healthcare workers in Wuhan, China. Multivariable linear regression analysis was applied to explore predictors of reducing the duration of viral shedding and optimizing treatment options.
Methods
Study design and participants
This study focused on healthcare workers hospitalized between 16 January 2020 and 27 February 2020 with COVID‐19 in Union Hospital of Tongji Medical College, Huazhong University of Science and Technology and Renmin Hospital of Wuhan University (Wuhan, China). This research was approved by the Ethics Committee of Renmin Hospital of Wuhan University (WDRY2020‐K137). All healthcare workers with COVID‐19 enrolled were diagnosed according to the interim guidance from the World Health Organization (WHO) [10]. Severe cases are defined as those with resting blood oxygen saturation level below 93%, resting respiratory rate greater than 30 breaths per minute, or lung infiltration of over 50% within 24–48 h on pulmonary imaging [8], and nonsevere group included mild and moderate cases. Oral informed consent was obtained, and written consent was waived. The information was obtained from the available electronic medical records of patients. Clinical outcomes were followed until 31 March 2020.
Data collection
We collected epidemiological, demographic, clinical, laboratory, radiological treatment and outcome data. The data were analysed and checked by two clinicians. For unclear records, we directly contacted the involved doctors or other healthcare providers for clarification. The date of illness onset was defined as the date of initial symptom. Histories of exposure to patients with confirmed or suspected SARS‐CoV‐2 infection were tracked within two weeks before the onset of illness. The duration of viral shedding was defined as the duration from the illness onset to two consecutive negative results of real‐time RT‐PCR in lower respiratory samples collected at least one day apart. Fitness for discharge was based on abatement of fever for at least three days, significant relief of respiratory symptoms, improvement in chest computed tomography (CT) evidence and viral clearance. The durations from onset of disease to chest CT confirmation of viral pneumonia, aetiological diagnosis, hospital admission, improvement in chest CT evidence, treatment and the end of viral shedding were recorded.
Throat swab specimens were obtained from all patients after admission every three days and every one–two days after the first negative result of SARS‐CoV‐2 or the patient's subjective symptoms improved. SARS‐CoV‐2 was confirmed by real‐time RT‐PCR using a previously described protocol [11]. Laboratory tests included a complete blood count, evaluation of infection‐related biomarkers, evaluation of serum biochemistry, coagulation function evaluation, humoral and cellular immune response assessment, cytokine analysis and evaluation for any coexisting infection (including bacteria, fungi and other respiratory viruses). The other respiratory viruses included influenza A virus, influenza B virus, respiratory syncytial virus, adenovirus and coxsackievirus. Patients were also evaluated for mycoplasma and chlamydia.
Patients with SARS‐CoV‐2 infection received antiviral treatment with arbidol (200 mg, three times daily, oral), oseltamivir (75 mg, twice daily, oral), lopinavir and ritonavir tablets (400 mg and 100 mg, twice daily, oral), recombinant human interferon alpha (rIFN‐α) (50 μg, twice daily, inhaled), ribavirin (500 mg, twice daily, intravenous) or ganciclovir (250 mg, once daily, intravenous). Most patients received antibiotics, such as moxifloxacin, levofloxacin or cephalosporins, to prevent and treat the bacterial coinfection. Some patients were initially administered 40 mg day−1 dosages of methylprednisolone, and the dosage was reduced gradually. Moreover, gamma globulin (10 g day−1) was also given in some cases.
Statistical analysis
Categorical variables were described as the count (%) in each category and compared using the chi‐square test or Fisher’s exact test; continuous measurements were expressed as median (interquartile range, IQR) and compared with the independent‐samples t‐test (normal distribution), Mann–Whitney U‐test (non‐normal distribution) or one‐way analysis of variance (ANOVA) (more than two groups). Univariable and multivariable linear regression methods were used to explore predictors associated with the duration of viral shedding after COVID‐19 onset. P value less than 0.05 was regarded as statistically significant, and all statistical analyses were performed using SPSS software, version 18.0.
Results
Clinical features of healthcare workers with COVID‐19
By 27 February 2020, 140 admitted healthcare workers with laboratory‐confirmed COVID‐19 from two tertiary teaching hospitals were enrolled in this study. The median age was 36.0 years (IQR: 30.75–43.25; Table 1), and 96 (68.6%) patients were female. All the patients were hospital medical staff: 46 (32.9%) were doctors, 79 (56.4%) were nurses, and six (4.3%) were medical technicians. A hundred and four (74.3%) medical staff with COVID‐19 were infected whilst working in hospital. Thirty‐nine (27.9%) patients had underlying diseases, including hypertension (14 [10.0%]), diabetes (8 [5.7%]), chronic pulmonary disease (7 [5.0%]) and malignant tumour (6 [4.3%]). Of the 140 patients, 20 (14.3%) were classified as severe cases. Compared with nonsevere cases, severe cases were older and more likely to have comorbidities.
Table 1.
Basic characteristics of the study patients with COVID‐19
| All Patients (n = 140) | Nonsevere (n = 120) | Severe (n = 20) | P value | |
|---|---|---|---|---|
| Age, years | 36.0 (30.75–43.25) | 35.0 (30.0–41.0) | 47.5 (40.25–54.0) | <0.001 |
| Sex, no. (%) | 0.372 | |||
| Female | 96 (68.6%) | 84 (70.0%) | 12 (60.0%) | |
| Male | 44 (31.4%) | 36 (30.0%) | 8 (40.0%) | |
| Occupation, no. (%) | 0.179 | |||
| Doctor | 46 (32.9%) | 36 (30.0%) | 10 (50.0%) | |
| Nurse | 79 (56.4%) | 71 (59.2%) | 8 (40.0%) | |
| Medical technician | 6 (4.3%) | 6 (5.0%) | 0 | |
| Others | 9 (6.4%) | 7 (5.8%) | 2 (10.0%) | |
| Mode of infection, no. (%) | 0.909 | |||
| Nosocomial infection | 104 (74.3%) | 88 (73.3%) | 16 (80.0%) | |
| Intrafamilial infection | 9 (6.4%) | 8 (6.7%) | 1 (5.0%) | |
| Unknown | 27 (19.3%) | 24 (20%) | 3 (15.0%) | |
| Comorbidity, no. (%) | ||||
| Any | 39 (27.9%) | 27 (22.5%) | 12 (60.0%) | 0.01 |
| Hypertension | 14 (10.0%) | 8 (6.7%) | 6 (30.0%) | |
| Diabetes | 8 (5.7%) | 3 (2.5%) | 5 (25.0%) | |
| Chronic pulmonary disease | 7 (5.0%) | 6 (5.0%) | 1 (5.0%) | |
| Malignancy | 6 (4.3%) | 3 (2.5%) | 3 (15.0%) | |
| Digestive system disease | 5 (3.6%) | 3 (2.5%) | 2 (10.0%) | |
| Hypothyroidism | 4 (2.9%) | 4 (3.3%) | 0 | |
| Cerebrovascular disease | 3 (2.1%) | 2 (1.7%) | 1 (5.0%) | |
| Coronary heart disease | 2 (1.4%) | 0 | 2 (10.0%) | |
| Others | 8 (5.7%) | 6 (5.0%) | 2 (10.0%) | |
| First symptom, no. (%) | ||||
| Fever | 77 (55.0 %) | 65 (54.2%) | 12 (60.0%) | 0.627 |
| Fatigue | 45 (32.1%) | 36 (30.0%) | 9 (45.0%) | 0.184 |
| Dry cough | 38 (27.1%) | 31 (25.8%) | 7 (35.0%) | 0.393 |
| Myalgia | 31 (22.1%) | 27 (22.5%) | 4 (20.0%) | 1.000 |
| Pharyngalgia | 26 (18.6%) | 25 (20.8%) | 1 (5.0%) | 0.123 |
| Dyspnoea | 25 (17.9%) | 20 (16.7%) | 5 (25.0%) | 0.356 |
| Expectoration | 24 (17.1%) | 21 (17.5%) | 3 (15.0%) | 1.000 |
| Anorexia | 18 (12.9%) | 14 (11.7%) | 4 (20.0%) | 0.291 |
| Headache or dizziness | 14 (10.0%) | 12 (10.0%) | 2 (10.0%) | 1.000 |
| Diarrhoea | 9 (6.4%) | 7 (5.8%) | 2 (10.0%) | 0.616 |
| Rhinorrhea | 7 (5.0%) | 7 (5.8%) | 0 | 0.593 |
| Nausea or vomiting | 4 (2.9%) | 3 (2.5%) | 1 (5.0%) | 0.464 |
| Thoracalgia | 3 (2.1%) | 2 (1.7%) | 1 (5.0%) | 0.373 |
| Hyposmia | 2 (1.4%) | 2 (1.7%) | 0 | 0.734 |
| Eye itching | 1 (0.7%) | 0 | 1 (5.0%) | 0.143 |
| Duration from illness onset to, days | ||||
| CT confirmation of pneumonia | 3 (1–6) | 3 (1–6) | 3 (0–4.75) | 0.443 |
| Aetiological diagnosis | 6.5 (3–10) | 6.5 (3–10) | 6.5 (2–9) | 0.502 |
| Hospital admission | 8 (5–13.25) | 8 (5–14) | 7 (5.75–10) | 0.504 |
| Improvement in chest CT images | 18 (15.5–23) | 18 (15–23) | 20 (18–26.5) | 0.038 |
| The end of viral shedding | 25 (20–30) | 24 (20–30) | 27 (21–29.5) | 0.434 |
| The duration of hospital stay, days | 18 (11.25–25.75) | 17 (11–23) | 24 (16–33) | 0.018 |
Data are median (IQR) or no. (%), unless otherwise specified. P values comparing nonsevere patients with COVID‐19 and severe patients with COVID‐19 are obtained by the independent‐samples t‐test, or Mann–Whitney U‐test, chi‐square test or Fisher’s exact test. COVID‐19 = 2019 novel coronavirus.
The most common symptoms at the onset of illness were fever (77, 55.0%), fatigue (45, 32.1%), dry cough (38, 27.1%) and myalgia (31, 22.1%) (Table 1). Less common symptoms included pharyngalgia (26, 18.6%), dyspnoea (25, 17.9%), expectoration (24, 17.1%), anorexia (18, 12.9%) and headache or dizziness (14, 10.0%). The uncommon symptoms were hyposmia, thoracalgia and eye itching. Nearly half of patients had no fever at the onset. Symptoms in the severe group did not differ from those of the nonsevere group.
Amongst the 140 healthcare workers with COVID‐19, the onset date was identified from 21 to 31 January 2020, accounting for 59 (42.1%) cases, and 49 (34.3%) cases from 11 to 20 January 2020 (Fig. 1). All the infected healthcare workers exhibited pneumonia on chest CT scans, with typical bilateral patchy shadows or ground‐glass opacities. The median time from first symptoms to chest CT confirmation of pneumonia was 3.0 days (IQR: 1.0–6.0), to aetiological diagnosis was 6.5 days (IQR: 3.0–10.0), to hospital admission was 8.0 days (IQR: 5.0–13.25), to improvement in chest CT images was 18.0 days (IQR: 15.5–23.0) and to the end of viral shedding was 25.0 days (IQR: 20.0–30.0) (Table 1). Meanwhile, CT images improved earlier in the nonsevere group. The median length of hospital stay was 18.0 days (IQR: 11.25–25.75). The duration of hospital stay in nonsevere cases (median: 17 days, IQR: 11.0–23.0 days) was shorter than that in severe cases (median: 24 days, IQR: 16.0–33.0 days).
Fig. 1.
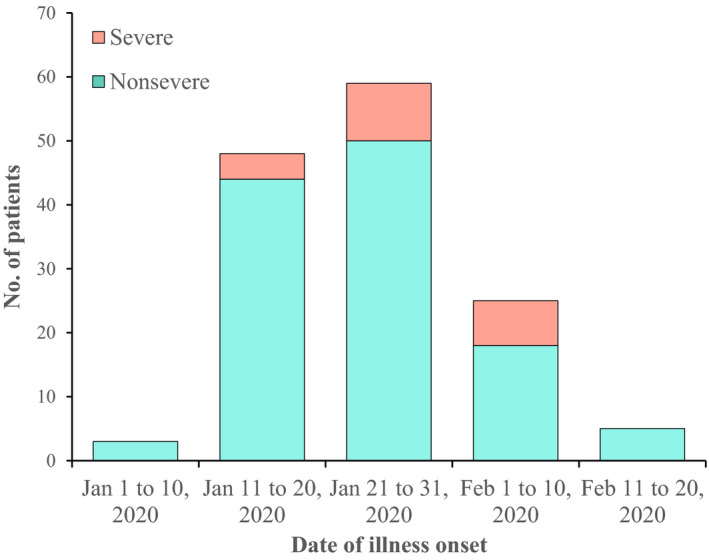
Date of Illness Onset of Patients with COVID‐19.
Laboratory results
On admission, leucocyte, neutrophil, lymphocyte and eosinophil counts were below the normal range in 45/114 (39.5%), 40/113 (35.4%), 66/117 (56.4%) and 55/113 (48.7%) healthcare workers, respectively (Table 2). Lymphocyte and eosinophil counts were lower in severe cases than those in nonsevere cases. Compared with those of the nonsevere cases, severe cases of COVID‐19 had higher levels of C‐reactive protein (CRP), interleukin‐6 (IL‐6), serum amyloid A (SAA) and serum ferritin. The levels of D‐dimer, fibrinogen degradation products (FDP), lactate dehydrogenase (LDH) and alpha‐hydroxybutyrate dehydrogenase (α‐HBDH) on admission were higher in severe cases (0.56 mg L−1 [IQR: 0.45–1.42]; 2.1 mg L−1 [IQR: 1.6–4.3]; 262.5 U L−1 [IQR: 226.75–320.25]; 193.5 U L−1 [IQR: 178.25–206.5]) than those in nonsevere cases (0.29 mg L−1 [IQR: 0.22–0.40], P < 0.001; 1.4 mg L−1 [IQR: 1.0–2.0], P = 0.003; 207.0 U L−1 [IQR: 176.5–269.0], P = 0.005; 149.0 U L−1 [IQR: 127.0–178.5], P = 0.004) (Table 2).
Table 2.
Laboratory results of study patients with COVID‐19
| Normal range | All patients (n = 140) | Nonsevere (n = 120) | Severe (n = 20) | P value | |
|---|---|---|---|---|---|
| White blood cells, ×109/L | 3.5–9.5 | 4.1 (3.14–5.6) | 4.17 (3.27–5.59) | 3.77 (2.71–5.56) | 0.287 |
| <3.5 | 45/114 (39.5%) | 36/96 (37.5%) | 9/18 (50.0%) | 0.319 | |
| Neutrophils, ×109/L | 1.8–6.3 | 2.3 (1.5–3.38) | 2.3 (1.5–3.37) | 2.43 (1.63–4.05) | 0.772 |
| <1.8 | 40/113 (35.4%) | 33/95 (34.7%) | 7/18 (38.9%) | 0.736 | |
| Lymphocytes, ×109/L | 1.1–3.2 | 1.04 (0.88–1.53) | 1.07 (0.9–1.59) | 0.88 (0.73–0.95) | 0.003 |
| <1.1 | 66/117 (56.4%) | 51/99 (51.5%) | 15/18 (83.3%) | 0.012 | |
| Eosinophils, ×109/L | 0.02–0.52 | 0.02 (0.00–0.06) | 0.02 (0.01–0.07) | 0.00 (0.00–0.01) | 0.004 |
| <0.02 | 55/113 (48.7%) | 41/95 (43.2%) | 14/18 (77.8%) | 0.007 | |
| ALT, U L−1 | 5.0–35.0 | 21.5 (15.0–37.0) | 20.0 (14.0–34.0) | 35.0 (18.0–52.25) | 0.050 |
| >35.0 | 30/110 (27.3%) | 22/92 (23.9%) | 8/18 (44.4%) | 0.087 | |
| AST, U L−1 | 8.0–40.0 | 24.0 (18.0–30.5) | 23.0 (17.0–29.0) | 25.5 (22.25–39.75) | 0.056 |
| >40.0 | 18/111 (16.2%) | 13/93 (14.0%) | 5/18 (27.8%) | 0.166 | |
| LDH, U L−1 | 109.0–245.0 | 215.0 (182.0–274.0) | 207.0 (176.5–269.0) | 262.5 (226.75–320.25) | 0.005 |
| >245.0 | 40/109 (36.7%) | 29/91 (31.9%) | 11/18 (61.1%) | 0.019 | |
| Serum amyloid A, mg L−1 | <10.0 | 55.9 (16.65–174.3) | 38.8 (15.55–151.0) | 235.0(67.13–592.23) | 0.005 |
| ≥10.0 | 61/82 (74.4%) | 52/72 (72.2%) | 9/10 (90.0%) | 0.440 | |
| α‐HBDH, U L−1 | 72.0–182.0 | 153.0 (128.0–190.0) | 149.0 (127.0–178.5) | 193.5 (178.25–206.5) | 0.004 |
| >182.0 | 19/61 (31.1%) | 12/51 (23.5%) | 7/10 (70.0%) | 0.007 | |
| Interleukin‐6, pg mL−1 | 0.1–2.9 | 5.83 (3.97–9.62) | 5.51 (3.81–8.67) | 10.13 (6.03–25.31) | 0.018 |
| >2.9 | 92/94 (97.9%) | 76/78 (97.4%) | 16/16 (100%) | 1.000 | |
| Interleukin‐10, pg mL−1 | 0.1–5.0 | 4.11 (3.45–4.98) | 3.97 (3.38–4.72) | 4.65 (3.94–5.68) | 0.055 |
| >5.0 | 22/93 (23.7%) | 17/77 (22.1%) | 5/16 (31.3%) | 0.519 | |
| C‐reactive protein, mg L−1 | <8.0 | 14.3 (7.3–29.0) | 11.8 (7.0–25.5) | 29.65 (16.83–47.9) | 0.016 |
| ≥8.0 | 60/94 (63.8%) | 48/79 (60.8%) | 12/15 (80.0%) | 0.155 | |
| ESR, mm h−1 | <20.0 | 28.0 (13.0–49.0) | 25.0 (10.0–44.5) | 34.0 (26.0–51.0) | 0.096 |
| ≥20.0 | 46/78 (59.0%) | 34/64 (53.1%) | 12/14 (85.7%) | 0.025 | |
| Serum ferritin, µg L−1 | 4.6–204.0 | 202.0 (84.4–415.6) | 165.0 (72.8–304.96) | 322.6 (224.0–632.9) | 0.020 |
| >204.0 | 22/45 (48.9%) | 12/33 (36.4%) | 10/12 (83.3%) | 0.005 | |
| Fibrinogen, g L−1 | 2.0–4.0 | 4.2 (3.18–5.05) | 4.09 (3.05–4.98) | 4.57 (4.25–5.21) | 0.279 |
| >4.0 | 57/95 (60.0%) | 44/79 (55.7%) | 13/16 (81.3%) | 0.057 | |
| D‐dimer, mg L−1 | <0.5 | 0.31 (0.22–0.47) | 0.29 (0.22–0.40) | 0.56 (0.45–1.42) | <0.001 |
| ≥0.5 | 23/92 (25.0%) | 12/77 (15.6%) | 11/15 (73.3%) | <0.001 | |
| FDP, mg L−1 | <5.0 | 1.6 (1.0–2.2) | 1.4 (1.0–2.0) | 2.1 (1.6–4.3) | 0.003 |
| ≥5.0 | 7/78 (9.0%) | 3/64 (4.7%) | 4/14 (28.6%) | 0.017 | |
| Coinfection, no. (%) | 33/92 (35.9%) | 30/76 (39.5%) | 3/16 (18.8%) | 0.116 | |
| Other viruses | 21/81 (25.9%) | 18/68 (26.5%) | 3/13 (23.1%) | 1.000 | |
| Mycoplasma or Chlamydia | 14/65 (21.5%) | 14/53 (26.4%) | 0 | 0.055 | |
| Bacteria or Fungus | 2/30 (6.7%) | 1/24 (4.2%) | 1/6 (16.7%) | 0.366 |
Data are no. (%) and median (IQR). P values comparing nonsevere patients with COVID‐19 and severe patients with COVID‐19 are from the independent‐samples t‐test, or Mann–Whitney U‐test, chi‐square test or Fisher’s exact test. ALT, Alanine aminotransferase; AST, Aspartate aminotransferase; ESR, Erythrocyte sedimentation rate; FDP, Fibrinogen degradation products; LDH, Lactate dehydrogenase; α‐HBDH, Alpha‐hydroxybutyrate dehydrogenase.
Some infected healthcare workers were tested for respiratory pathogens, and the most common was other respiratory viruses (Table 2). Few cases of SARS‐CoV‐2 infection had bacterial or fungal coinfection.
Treatment measures and clinical outcomes
Oxygen inhalation was given to 50.0% patients (Table 3). 97.9% of the patients received antiviral treatment, 93.6% received antibacterial treatment 85.7% received immunomodulatory treatment and 14.3% received intravenous glucocorticoids. Furthermore, arbidol was given to 130 (92.9%) patients, oseltamivir was given to 65 (46.4%) patients, lopinavir and ritonavir were administered to 28 (20.0%) patients, and rIFN‐α was administered to 102 (72.9%) patients. Further analysis showed that the median durations from illness onset to antiviral treatment, antibacterial treatment, immunomodulatory therapy, oxygen inhalation and glucocorticoid treatment were 3.0 days (IQR: 0–5.0), 3.0 days (IQR: 0–6.0), 9.0 days (IQR: 6.0–15.0), 10.0 days (IQR: 7.0–15.0) and 11.0 days (IQR: 7.5–17.0) for nonsevere cases, whilst 1 day (IQR: 0–3.5), 3.5 days (IQR: 0–6.25), 7.5 days (IQR: 5.25–14.25), 7.5 days (IQR: 6.75–12.5) and 9.0 days (IQR: 8.0–9.0) for severe cases, respectively. All the infected healthcare workers were cured and discharged. Except for oxygen inhalation and immunoglobulin treatment, there was no statistical difference in the duration from onset to initial treatment and treatment plan between the two groups.
Table 3.
The treatment of patients with COVID‐19
| All patients (n = 140) | Nonsevere (n = 120) | Severe (n = 20) | P value | |
|---|---|---|---|---|
| Duration from illness onset to, days | ||||
| Antiviral therapy | 2 (0–5) | 3 (0–5) | 1 (0–3.5) | 0.394 |
| Antibiotic therapy | 3 (0–6) | 3 (0–6) | 3.5 (0–6.25) | 0.855 |
| Immunomodulator therapy | 9 (6–15) | 9 (6–15) | 7.5 (5.25–14.25) | 0.600 |
| Oxygen inhalation | 10 (7–14) | 10 (7–15) | 7.5 (6.75–12.5) | 0.032 |
| Glucocorticoid therapy | 10 (8–15.5) | 11 (7.5–17) | 9 (8–9) | 0.663 |
| Hospital treatment | ||||
| Antiviral therapy, no. (%) | 137 (97.9%) | 118 (98.3%) | 19 (95.0%) | 0.373 |
| Arbidol | 130 (92.9%) | 111 (92.5%) | 19 (95.0%) | 1.000 |
| Oseltamivir | 65 (46.4%) | 58 (48.3%) | 7 (35.0%) | 0.268 |
| Lopinavir and ritonavir | 28 (20.0%) | 21 (17.5%) | 7 (35.0%) | 0.126 |
| Ganciclovir | 13 (9.3%) | 12 (10.0%) | 1 (5.0%) | 0.693 |
| Ribavirin | 8 (5.7%) | 5 (4.2%) | 3 (15.0%) | 0.088 |
| Antibiotic therapy, no. (%) | 131 (93.6%) | 111 (92.5%) | 20 (100%) | 0.358 |
| Immunomodulator therapy, no. (%) | 120 (85.7%) | 102 (85.0%) | 18 (90.0%) | 0.738 |
| rIFN‐α | 102 (72.9%) | 89 (74.2%) | 13 (65.0%) | 0.393 |
| Immunoglobulin | 45 (32.1%) | 33 (27.5%) | 12 (60.0%) | 0.04 |
| Thymosin | 51 (36.4%) | 41 (34.2%) | 10 (50.0%) | 0.173 |
| Oxygen inhalation, no. (%) | 70 (50.0%) | 54 (45.0%) | 16 (80.0%) | 0.004 |
| Glucocorticoid therapy, no. (%) | 20 (14.3%) | 15 (12.5%) | 5 (25.0%) | 0.166 |
Data are no. (%) or median (IQR), unless otherwise specified. P values comparing nonsevere patients with COVID‐19 and severe patients with COVID‐19 are obtained by the independent‐samples t‐test, or Mann–Whitney U‐test, chi‐square test or Fisher’s exact test. CT, computed tomography; rIFN‐α, recombinant human interferon alpha.
We used multivariable linear regression analysis to figure out whether different clinical characteristics could predict the duration of viral shedding. To reduce the potential variables for better multivariable linear regression, univariate linear regression analysis was carried out for each variable. Receiving antibacterial treatment receiving glucocorticoid treatment, receiving rIFN‐α treatment, and the durations from illness onset to aetiological diagnosis, hospital admission, chest CT confirmation of pneumonia and improvement in chest CT evidence were associated with the duration of viral shedding after COVID‐19 onset (Table 4). Variables with P values less than 0.1 were included in the multiple regression model. Further multivariable linear regression analysis (R 2 = 0.476, P < 0.001) exhibited that receiving glucocorticoid treatment and the durations from the first symptom to hospital admission, and improvement in chest CT evidence were proved to be positively correlated with the duration of viral shedding of COVID‐19, whereas receiving rIFN‐α treatment showed significant negative correlation.
Table 4.
Univariate and multivariate linear regression analyses of clinical characteristics predicting the duration of viral shedding
| Variables | Univariate analysis | Multivariate analysis | ||
|---|---|---|---|---|
| β (95% CI) | P value | β (95% CI) | P value | |
| Age, years | 0.078 (−0.058, 0.214) | 0.259 | ||
| Occupation, no. (%) | 1.469 (−0.445, 3.384) | 0.131 | ||
| Sex, no. (%) | −2.472 (−5.692, 0.747) | 0.131 | ||
| Mode of infection, no. (%) | 0.193 (−1.675, 2.062) | 0.838 | ||
| Comorbidity, no. (%) | 0.036 (−3.282, 3.353) | 0.983 | ||
| Severity of diseases, no. (%) | 1.772 (−2.549, 6.093) | 0.419 | ||
| Oxygen inhalation, no. (%) | −1.022 (−4.012, 1.967) | 0.500 | ||
| Immunomodulator therapy, no. (%) | ||||
| rIFN‐alpha | −6.482 (−9.639, −3.326) | <0.001 | −5.249 (−8.140, −2.358) | <0.001 |
| Immunoglobulin | −1.085 (−4.305, 2.136) | 0.507 | ||
| Thymosin | −1.062 (−4.154, 2.030) | 0.498 | ||
| Antibiotic therapy, no. (%) | −7.036 (−13.307, −0.765) | 0.028 | −4.253 (−9.675, 1.169) | 0.123 |
| Glucocorticoid therapy, no. (%) | 4.644 (0.385, 8.903) | 0.033 | 6.187 (2.767, 9.607) | <0.001 |
| Antiviral therapy, no. (%) | ||||
| Arbidol | 2.805 (−2.931, 8.540) | 0.335 | ||
| Oseltamivir | −2.292 (−5.271, 0.686) | 0.130 | ||
| Lopinavir and ritonavir | −3.546 (−7.209, 0.117) | 0.058 | −1.716 (−4.712, 1.279) | 0.259 |
| Ganciclovir | 1.360 (−3.743, 6.463) | 0.599 | ||
| Ribavirin | 1.656 (−5.137, 8.449) | 0.630 | ||
| Duration from illness onset to, days | ||||
| Aetiological diagnosis | 0.336 (0.075, 0.596) | 0.012 | −0.009 (−0.262, 0.244) | 0.944 |
| Hospital admission | 0.497 (0.293, 0.701) | <0.001 | 0.250 (0.024, 0.476) | 0.030 |
| Chest CT confirmation of pneumonia | 0.567 (0.235, 0.899) | 0.001 | 0.071 (−0.236, 0.378) | 0.650 |
| Improvement in chest CT images | 0.759 (0.558, 0.959) | <0.001 | 0.493 (0.255, 0.731) | <0.001 |
The results were expressed as β with 95% CI. β, regression coefficients; CI, confidence interval; rIFN‐alpha, recombinant human interferon alpha; CT, computed tomography.
We again used the multivariable linear regression method to test whether different laboratory markers could predict the duration of viral shedding. Univariable linear regression analysis showed that abnormalities of lymphocytes, erythrocyte sedimentation rate (ESR) and fibrinogen correlated significantly with the duration of viral shedding (Table 5). α‐HBDH (P = 0.060) and D‐dimer (P = 0.052) were also included in the final model. Multivariable linear regression analysis (R 2 = 0.314, P = 0.004) revealed lymphocytes less than 1.1 × 10⁹/L and D‐dimer over 0.5 mg L−1 contributed significantly to prolonged duration of viral shedding.
Table 5.
Univariate and multivariate linear regression analyses of laboratory findings predicting the duration of viral shedding
| Variables | Univariate analysis | Multivariate analysis | ||
|---|---|---|---|---|
| β (95% CI) | P value | β (95% CI) | P value | |
| White blood cells, ×109/L; <3.5 | 0.376 (−2.843, 3.595) | 0.817 | ||
| Neutrophils, ×109/L; <1.8 | 1.020 (−2.216, 4.257) | 0.533 | ||
| Lymphocytes, ×109/L; <1.1 | 3.488 (0.471, 6.504) | 0.024 | 4.262 (0.317, 8.207) | 0.035 |
| Eosinophils, ×109/L; <0.02 | −0.608 (−3.705, 2.488) | 0.698 | ||
| ALT, U L−1; >35.0 | −0.008 (−3.554, 3.538) | 0.997 | ||
| AST, U L−1; >40.0 | −3.613 (−7.809, 0.583) | 0.091 | ||
| LDH, U L−1; >245.0 | 2.368 (−0.940, 5.677) | 0.159 | ||
| Serum amyloid A, mg L−1; ≥10.0 | 1.483 (−2.721, 5.687) | 0.485 | ||
| α‐HBDH, U L−1; >182.0 | 3.587 (−0.161, 7.336) | 0.060 | −0.586 (−5.118, 3.946) | 0.796 |
| Interleukin‐6, pg mL−1; >2.9 | 8.181 (−2.890, 19.253) | 0.146 | ||
| Interleukin‐10, pg mL−1; >5.0 | 1.646 (−2.234, 5.526) | 0.402 | ||
| C‐reactive protein, mg L−1; ≥8.0 | 1.395 (−2.250, 5.040) | 0.449 | ||
| ESR, mm h−1; ≥20 | 5.030 (1.919, 8.141) | 0.002 | 0.466 (−4.066, 4.998) | 0.837 |
| Serum ferritin, µg L−1; >204.0 | 3.152 (−0.727, 7.031) | 0.109 | ||
| Fibrinogen, g L−1; >4.0 | 3.687 (0.500, 6.874) | 0.024 | 3.323 (−1.168, 7.814) | 0.143 |
| D‐dimer, mg L−1; ≥0.5 | 3.630 (−0.035, 7.295) | 0.052 | 5.229 (0.403, 10.054) | 0.034 |
| FDP, mg L−1; ≥5.0 | 1.500 (−4.979, 7.979) | 0.646 | ||
The results were expressed as β with 95% CI. ALT, Alanine aminotransferase; AST, Aspartate aminotransferase; CI, confidence interval; ESR, Erythrocyte sedimentation rate; FDP, Fibrinogen degradation products; LDH, Lactate dehydrogenase; α‐HBDH, Alpha‐hydroxybutyrate dehydrogenase; β, regression coefficients.
To validate the above‐mentioned six significant predictors of viral shedding duration, further analyses were conducted. To help further investigate the factors affecting viral shedding, we changed the observation interval from illness onset to hospital admission and improvement in chest CT evidence. Patients with symptoms lasting 7 days or less before hospitalization had a shortened duration of viral shedding, compared with patients with 8 to 11 days and 12 days or more (Fig. 2a). Patients with duration from disease onset to improvement of chest CT no more than 12 days had the shortest duration of viral shedding, followed by patients with 13 to 20 days, and then patients with 21 days or more (Fig. 2b). The duration of viral shedding in the rIFN‐α group was shorter than that in the non‐rIFN‐α group (Fig. 2c). On the contrary, a longer viral shedding duration was observed in the group with glucocorticoid applying (Fig. 2d). The group with lymphocytes less than 1.1 × 10⁹/L exhibited a longer duration of viral shedding than group with more than 1.1 × 10⁹/L (Fig. 2e). However, there was no statistical significance between the increased D‐dimer group and the normal D‐dimer group (Fig. 2f).
Fig. 2.
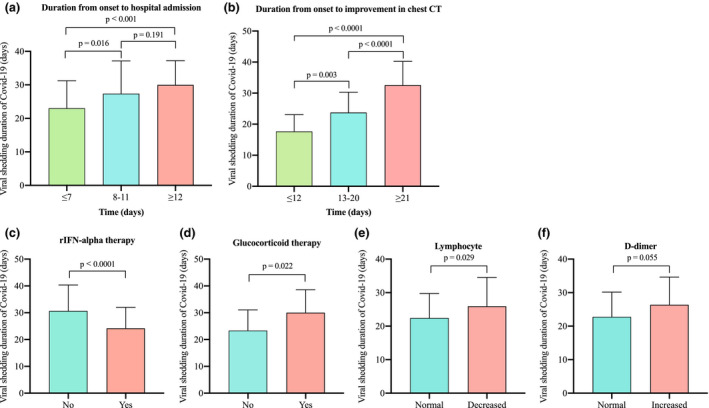
Factors Influencing Viral Shedding Duration of Patients with COVID‐19. (a) The duration of viral shedding was prolonged when the duration from illness onset to hospital admission was more than seven days. (b) The duration from illness onset to improvement in chest CT could influence viral shedding duration of COVID‐19 conspicuously. (c, d) The rIFN‐α group had shorter viral shedding duration, whilst the glucocorticoid group did the opposite. (e) The lengthened duration of viral shedding was found in the group with lymphocytes less than 1.1 × 10⁹/L. (f) There was no statistical difference in the duration of virus shedding between the elevated d‐dimer group and the normal d‐dimer group. P values were obtained by Mann–Whitney U‐test or one‐way analysis of variance (ANOVA) (more than two groups). rIFN‐α = recombinant human interferon alpha. COVID‐19 = coronavirus disease 2019.
Discussion
We report data from 140 healthcare workers with confirmed COVID‐19 from two hospitals in Wuhan. All the medical staff were cured and discharged, and none of them in our study died. Moreover, receiving rIFN‐α treatment, reducing usage rate of glucocorticoids and reducing the duration from illness onset to hospital admission might be useful for shortening the duration of viral shedding. However, the prolonged duration of viral shedding could be correlated with lymphocytes less than 1.1 × 10⁹/L on admission.
The main complications of COVID‐19 include acute respiratory distress syndrome (ARDS), acute respiratory injury, acute kidney injury, acute cardiac injury, ventilator‐associated pneumonia, coinfection, septic shock and death [2, 11, 12]. Previous reports indicated that 5.0–32% of inpatients were transferred to the intensive care unit (ICU) [4, 11, 13], and 1.4–15% died [2, 4, 11, 13], due to these complications. However, symptoms of all medical staff with COVID‐19 were milder in our study, and none of the infected medical workers were taken to the ICU or died in our study. Patients in this study were much younger (36.0 years vs. 62.0 years) [12], with a lower incidence of comorbidities (39 [26.5%] vs. 133 [49%]) [12], lymphopenia (66 [56.4%] vs. 731 [83.2%]) [13] and elevated D‐dimer (23 [25.0%] vs. 36 [36.0%]) [2], which might be the contributory mechanisms. Age and the presence of underlying diseases were considered to be predictors of a fatal outcome in COVID‐19 cases[14]. Furthermore, decreased lymphocytes and elevated D‐dimer exhibited positive association with the duration of viral shedding in this study. The concentrations of CRP, ESR, serum ferritin, alanine aminotransferase (ALT), aspartate aminotransferase (AST), LDH, IL‐6, interleukin‐10 (IL‐10) and D‐dimer in healthcare workers with COVID‐19 were lower than those of previously described cases [2, 4, 11, 12]. They might be explained by early hospitalization for supportive and advanced treatment, which has been considered to be related to viral shedding.
In laboratory tests, compared with nonsevere cases, severe cases of COVID‐19 had lower levels of lymphocyte. Lymphopenia has been related to induced T‐cell apoptosis and cellular immune deficiency [4, 15], suggesting that the immune ability of severe group was reduced. As for infection‐related biomarkers and coagulation function evaluation, severe cases of COVID‐19 had higher levels of CRP, IL‐6, SAA, serum ferritin, D‐dimer and FDP, indicating severe patients had higher virus loads, stronger immune responses and more serious coagulation abnormalities. In the evaluation of serum biochemistry, the levels of LDH and α‐HBDH were higher in severe cases of COVID‐19, suggesting that severe cases had more severe cardiac injury. Previous studies had identified LDH, lymphocytes, CRP, IL‐6, serum ferritin and D‐dimer as predictors of the development of severe COVID‐19 infections [16]. This indicates that all the above indicators should be closely monitored to find out patients with a tendency to deteriorate.
SARS‐CoV‐2 is the seventh human‐infecting Betacoronavirus identified and can cause viral pneumonia with varying degrees of disease severity. Human‐to‐human transmission of SARS‐CoV‐2 has been confirmed, especially hospital‐associated transmission [4, 17]. Medical staff accounted for 22%‐40% of SARS‐CoV infections and 29% of SARS‐CoV‐2 infections [4, 18]. Patients with SARS‐CoV‐2 infection mainly present with fever, fatigue, dry cough, dyspnoea and myalgia [13, 19]. However, their clinical characteristics were atypical, and approximately half of the infected medical staff had no fever at the illness onset in our study. Thus, symptom‐based screening of COVID‐19 is easy to miss atypical patients. Furthermore, the aetiological diagnosis of COVID‐19 exhibited high false‐negative rate in the early inspection. Delayed diagnosis, as well as delayed hospital interventions, might result in secondary cases amongst healthcare workers, hospitalized patients and family members [4, 18]. Our data showed that the duration from illness onset to hospital interventions was significantly correlated with the duration of viral shedding. Typical hallmarks on chest CT scans were bilateral patchy shadows or ground‐glass opacities [4, 11], and chest CT confirmation of COVID‐19 was earlier than aetiological diagnosis, suggesting that early chest CT examination could be useful for screening patients with SARS‐CoV‐2 infection and shortening the duration of hospital interventions.
Similar to SARS‐CoV infection and Middle East respiratory syndrome coronavirus (MERS‐CoV) infection, no specific treatment is currently available for SARS‐CoV‐2 infection. To disrupt viral replication, inhibit virus transmission and enhance host immunity, patients with SARS‐CoV‐2 infection mainly receive supportive treatments as early as possible and are administered diverse combinations of drugs. In this study, 97.9% of patients received antiviral treatment, 93.6% received antibacterial treatment, and 85.7% received immunomodulatory treatment. Potential antiviral agents mainly include arbidol, oseltamivir, lopinavir and ritonavir. Arbidol was the most frequently used antiviral which could impact on the virus, on cellular functions or critical steps in virus–cell interactions and demonstrated antiviral capacity against enveloped viruses [20]. The protease inhibitors, lopinavir and ritonavir, which have the potential to treat SARS and were once the most anticipated effective antiviral, are initially approved for first‐line treatment of human immunodeficiency virus infection in patients with increasing aminotransferase levels [15, 21]. However, none of these antivirals demonstrated the potential to shorten the duration of viral shedding in our study, which is consistent with existing researches [22]. Further studies are needed to evaluate the efficacies of potential drugs against SARS‐CoV‐2.
As no drugs were available to eliminate the virus, those with SARS‐CoV‐2 infection had to rely on their immune systems. If the host’s immune system reacts violently forming an inflammatory storm, it will lead to ARDS or even MODS [12]. Glucocorticoids were used frequently in patients with severe illness or excessive inflammatory response to reduce inflammatory‐induced injury [11]. However, delayed viral clearance and secondary infections had been observed in SARS patients treated with high‐dose glucocorticoids [11, 15]. To date, the use of glucocorticoids to treat SARS‐CoV‐2 infection remains controversial and their therapeutic effect needs further evaluation. In our study, moderate dose of glucocorticoids (methylprednisolone, 40 mg d−1 per day) was given to some healthcare workers with COVID‐19, who were accompanied by prolonged duration of viral shedding. It is necessary to monitor the therapeutic effect and adverse effects of systematic glucocorticoids treatment. Reducing unnecessary use of glucocorticoids may be beneficial for recovery in the future therapy of COVID‐19. rIFN‐α could enhance the cytotoxicity of immune cells to viruses and could be used in combination with other antivirals for the treatment of SARS [23], which is in accordance with our findings that rIFN‐α contributed to shortening the duration of viral shedding. Studies have reported that IFN‐α can reduce SARS‐CoV‐2 titres in Vero cells [24], indicating that IFN‐α can be used as a future treatment option for COVID‐19.
This study had limitations. First, the sample size was relatively low, and no critical healthcare workers were enrolled in this research, nor were deceased patients, because no eligible patients were admitted in the two hospitals during data‐collecting period. Second, there are still no commercial vaccines available against SARS‐CoV‐2. Although the S protein is a potential target for the development of vaccines, no effective outcomes have been observed. There are no effective measures to control nosocomial transmission before the vaccine is available, except early screening, quarantine and treatment for patients with COVID‐19, monitoring their close contacts and ensuring the supplies of personal protective equipment. Third, the accuracy of the duration of viral shedding might be limited by the frequency of throat swab tests and the high false‐negative rate of RT‐PCR. Finally, not all the medical staffs in both hospitals were screened for SARS‐CoV‐2 infection to assess the nosocomial infection rate in the medical staff and the efficacy of nosocomial infection control.
In summary, we provided the clinical features of medical staff, which were milder than those of nonhealthcare patients reported previously. We found that glucocorticoid treatment and lymphocytes less than 1.1 × 10⁹/L are associated with prolonged viral shedding, whilst early admission and rIFN‐α help shorten the duration of viral shedding. Therefore, early hospitalization and rIFN‐α might help the medical workers dealing with SARS‐CoV‐2, as well as the public living in high‐risk areas, to fight against the SARS‐CoV‐2 infection.
Author Contribution
Wei Liu: Conceptualization (equal); Data curation (equal); Investigation (equal); Resources (equal); Validation (equal); Writing – original draft (equal); Writing – review and editing (equal). Yutian Liu: Conceptualization (equal); Data curation (equal); Formal analysis (equal); Methodology (equal); Validation (equal); Writing – original draft (equal); Writing – review and editing (equal). Zhao Xu: Data curation (equal); Formal analysis (equal); Methodology (equal); Validation (equal); Visualization (equal); Writing – original draft (equal); Writing – review and editing (equal). Tao Jiang: Data curation (equal); Methodology (equal); Resources (equal); Visualization (equal); Writing – review and editing (equal). Yu Kang: Methodology (equal); Software (equal); Visualization (equal); Writing –review and editing (equal). Gangyan Zhu: Methodology (equal); Resources (equal); Validation (equal); Writing – review and editing (equal). Zhenbing Chen: Conceptualization (equal); Data curation (equal); Funding acquisition (equal); Project administration (equal); Supervision (equal); Writing – review and editing (equal).
Conflict of interest statement
All authors declared that there were no competing interests.
Funding
This study was supported by the National Natural Science Foundation of China (grant numbers 81471270, 81271967 and 81772094).
Ethics approval
This study was performed in accordance with the Helsinki Declaration and was approved by the Ethics Committee of Renmin Hospital of Wuhan University.
Acknowledgments
We thank all the involved healthcare workers and their doctors in the study.
Liu W, Liu Y, Xu Z, Jiang T, Kang Y, Zhu G, Chen Z (Renmin Hospital of Wuhan University; Union Hospital, Tongji Medical College, Huazhong University of Science and Technology, Wuhan, China). Clinical characteristics and predictors of the duration of SARS‐CoV‐2 viral shedding in 140 healthcare workers. J Intern Med, 2020; 288: 725–736. 10.1111/joim.13160
Contributor Information
Y. Liu, Email: liuyutian1987@gmail.com.
Z. Chen, Email: zhenbingchen@hotmail.com.
References
- 1. Lu H, Stratton CW, Tang YW. Outbreak of pneumonia of unknown etiology in Wuhan, China: The mystery and the miracle. J Med Virol 2020; 92: 401–2. [DOI] [PMC free article] [PubMed] [Google Scholar]
- 2. Chen N, Zhou M, Dong X et al. Epidemiological and clinical characteristics of 99 cases of 2019 novel coronavirus pneumonia in Wuhan, China: a descriptive study. Lancet 2020; 395: 507–13. [DOI] [PMC free article] [PubMed] [Google Scholar]
- 3. Li Q, Guan X, Wu P et al. Early transmission dynamics in Wuhan, China, of novel coronavirus‐infected pneumonia. N Engl J Med 2020; 382: 1199–207. [DOI] [PMC free article] [PubMed] [Google Scholar]
- 4. Wang D, Hu B, Hu C et al. Clinical characteristics of 138 hospitalized patients with 2019 novel coronavirus‐infected pneumonia in Wuhan, China. JAMA 2020; 323: 1061–9. [DOI] [PMC free article] [PubMed] [Google Scholar]
- 5. Zhu N, Zhang D, Wang W et al. A novel coronavirus from patients with pneumonia in China, 2019. N Engl J Med 2020; 382: 727–33. [DOI] [PMC free article] [PubMed] [Google Scholar]
- 6. Chan JF, Yuan S, Kok KH et al. A familial cluster of pneumonia associated with the 2019 novel coronavirus indicating person‐to‐person transmission: a study of a family cluster. Lancet 2020; 395: 514–23. [DOI] [PMC free article] [PubMed] [Google Scholar]
- 7.https://www.who.int./docs/default‐source/coronaviruse/situation‐reports/20200330‐sitrep‐70‐covid‐19.pdf?sfvrsn=7e0fe3f8_4.
- 8. Wu Z, McGoogan JM. Characteristics of and important lessons from the coronavirus disease 2019 (COVID‐19) Outbreak in China: summary of a report of 72314 cases from the chinese center for disease control and prevention. JAMA 2020; 323: 1239–42. [DOI] [PubMed] [Google Scholar]
- 9. https://edition.cnn.c om/world/live‐news/coronavirus‐outbreak‐03‐30‐20‐intl‐hnk/h_d385acb67991afbdcf4c87aed856f0e6.
- 10. World Health Organization . Clinical management of severe acute respiratory infection when novel coronavirus (nCoV) infection is suspected: interim guidance, 12 January 2020. Available at https://apps.who.int/iris/bitstream/handle/10665/332299/WHO‐2019‐nCoV‐Clinical‐2020.1‐eng.pdf. [Google Scholar]
- 11. Huang C, Wang Y, Li X et al. Clinical features of patients infected with 2019 novel coronavirus in Wuhan, China. Lancet 2020; 395: 497–506. [DOI] [PMC free article] [PubMed] [Google Scholar]
- 12. Chen T, Wu D, Chen H et al. Clinical characteristics of 113 deceased patients with coronavirus disease 2019: retrospective study. BMJ 2020; 368: m1091. [DOI] [PMC free article] [PubMed] [Google Scholar]
- 13. Guan WJ, Ni ZY, Hu Y et al. Clinical characteristics of coronavirus disease 2019 in China. N Engl J Med 2020; 382: 1708–20. [DOI] [PMC free article] [PubMed] [Google Scholar]
- 14. Du RH, Liang LR, Yang CQ et al. Predictors of mortality for patients with COVID‐19 pneumonia caused by SARS‐CoV‐2: a prospective cohort study. Eur Respir J 2020; 55: 2000524. [DOI] [PMC free article] [PubMed] [Google Scholar]
- 15. Skowronski DM, Astell C, Brunham RC et al. Severe acute respiratory syndrome (SARS): a year in review. Annu Rev Med 2005; 56: 357–81. [DOI] [PubMed] [Google Scholar]
- 16. Cecconi M, Piovani D, Brunetta E et al. Early predictors of clinical deterioration in a cohort of 239 patients hospitalized for Covid‐19 infection in Lombardy, Italy. J Clin Med 2020; 9: 1548. [DOI] [PMC free article] [PubMed] [Google Scholar]
- 17. Riou J, Althaus CL. Pattern of early human‐to‐human transmission of Wuhan 2019 novel coronavirus (2019‐nCoV), December 2019 to January 2020. Eurosurveillance 2020; 25: 2000058. [DOI] [PMC free article] [PubMed] [Google Scholar]
- 18. Song Z, Xu Y, Bao L et al. From SARS to MERS, thrusting coronaviruses into the spotlight. Viruses 2019; 11: 59. [DOI] [PMC free article] [PubMed] [Google Scholar]
- 19. Xu XW, Wu XX, Jiang XG et al. Clinical findings in a group of patients infected with the 2019 novel coronavirus (SARS‐Cov‐2) outside of Wuhan, China: retrospective case series. BMJ 2020; 368: m606. [DOI] [PMC free article] [PubMed] [Google Scholar]
- 20. Blaising J, Polyak SJ, Pécheur EI. Arbidol as a broad‐spectrum antiviral: an update. Antiviral Res 2014; 107: 84–94. [DOI] [PMC free article] [PubMed] [Google Scholar]
- 21. Oldfield V, Plosker GL. Lopinavir/ritonavir: a review of its use in the management of HIV infection. Drugs 2006; 66: 1275–99. [DOI] [PubMed] [Google Scholar]
- 22. Sanders JM, Monogue ML, Jodlowski TZ, Cutrell JB. Pharmacologic treatments for coronavirus disease 2019 (COVID‐19): A Review. JAMA 2020; 323: 1824–36. [DOI] [PubMed] [Google Scholar]
- 23. Cinatl J, Morgenstern B, Bauer G, Chandra P, Rabenau H, Doerr HW. Treatment of SARS with human interferons. Lancet 2003; 362: 293–4. [DOI] [PMC free article] [PubMed] [Google Scholar]
- 24. Mantlo E, Bukreyeva N, Maruyama J, Paessler S, Huang C. Antiviral activities of type I interferons to SARS‐CoV‐2 infection. Antiviral Res 2020; 179: 104811. [DOI] [PMC free article] [PubMed] [Google Scholar]