

Abstract
During the first few months of severe acute respiratory syndrome coronavirus 2 (SARS‐CoV‐2) evolution in a new host, contrasting hypotheses have been proposed about the way the virus has evolved and diversified worldwide. The aim of this study was to perform a comprehensive evolutionary analysis to describe the human outbreak and the evolutionary rate of different genomic regions of SARS‐CoV‐2. The molecular evolution in nine genomic regions of SARS‐CoV‐2 was analyzed using three different approaches: phylogenetic signal assessment, emergence of amino acid substitutions, and Bayesian evolutionary rate estimation in eight successive fortnights since the virus emergence. All observed phylogenetic signals were very low and tree topologies were in agreement with those signals. However, after 4 months of evolution, it was possible to identify regions revealing an incipient viral lineage formation, despite the low phylogenetic signal since fortnight 3. Finally, the SARS‐CoV‐2 evolutionary rate for regions nsp3 and S, the ones presenting greater variability, was estimated as 1.37 × 10⁻³ and 2.19 × 10⁻³ substitution/site/year, respectively. In conclusion, results from this study about the variable diversity of crucial viral regions and determination of the evolutionary rate are consequently decisive to understand essential features of viral emergence. In turn, findings may allow the first‐time characterization of the evolutionary rate of S protein, crucial for vaccine development.
Keywords: evolution, evolutionary rate, phylogeny, SARS‐CoV‐2
Highlights
‐The phylogenetic signal of nine viral genomic regions was determined
‐Phylogenetic trees for each analyzed region were generated
‐Positions of amino acids with greater variations were detected
‐It was possible to identify regions revealing different levels of variability
‐The evolutionary rate was estimated to range from 1.37‐2.19 x10‐3 substitution/site/year
1. INTRODUCTION
Coronaviruses belong to Coronaviridae family and have a single strand of positive‐sense RNA genome of 26–32 kb in length. 1 They have been identified in different avian hosts as well as in various mammals including bats, mice, dogs, etc. 2 , 3 Periodically, new mammalian coronaviruses are identified. In late December 2019, Chinese health authorities identified groups of patients with pneumonia of an unknown cause in Wuhan, Hubei Province, China. 4 The pathogen, a new coronavirus called severe acute respiratory syndrome coronavirus 2 (SARS‐CoV‐2), 5 was identified by local hospitals using a surveillance mechanism for “pneumonia of unknown etiology.” 4 , 6 , 7 The pandemic spread rapidly, and >28 million confirmed cases and nearly 900,000 deaths were reported in just an 8‐month period. 8 The rapid viral spread raised interesting questions about the way its evolution is driven during the pandemic. From the SARS‐CoV‐2 genome, 16 nonstructural proteins (nsp1‐16), 4 structural proteins (spike [S], envelope [E], membrane [M], and nucleoprotein [N]), and other proteins essential to complete the replication cycle have been translated. 3 , 9 The large amount of currently available information allows knowing, as never before, the real‐time evolution history of a virus since its interspecies jump. 10 Most studies published to date have characterized the viral genome and evolution by analyzing complete genome sequences. 11 , 12 , 13 , 14 Despite this, until now, the viral genomic region providing the most accurate information to characterize SARS‐CoV‐2 could not be established. This lack of information prevents from investigating its molecular evolution and monitoring of biological features, affecting the development of antiviral drugs and vaccines. Therefore, the aim of this study was to perform a comprehensive viral evolutionary analysis to describe the human outbreak and the molecular evolution rate of different genomic regions of SARS‐CoV‐2.
2. MATERIALS AND METHODS
2.1. Data sets
To generate a data set representing different geographic regions and time evolution of the SARS‐CoV‐2 pandemic from December 2019 to April 2020, data of all the complete genome sequences available at Global Initiative on Sharing All Influenza Data (GISAID) (https://www.gisaid.org/) on April 18, 2020 were collected. Data inclusion criteria were as follows: (a) complete genomes, (b) high coverage level, and (c) human hosts only (no other animals, cell culture, or environmental samples). Complete genomes were aligned using MAFFT against the Wuhan‐Hu‐1 reference genome (NC_045512.2, EPI_ISL_402125). The resulting multiple sequence alignment (Data set 1) was split in nine data sets corresponding to nine coding regions: (a) four structural proteins (envelope [E], nucleocapsid [N], spike [S], and Orf3a), (b) four nonstructural proteins (nsp1, nsp3, Orf6, and nsp14), and (c) an unknown function protein (Orf8).
More than 6000 SARS‐CoV‐2 publicly available nucleotide sequences were downloaded. After selection of data according to the inclusion criteria, 1616 SARS‐CoV‐2 complete genomes were included in Data set 1. Sequences of Data set 1 came from 55 countries belonging to the five continents as follows: Africa: 39 sequences, Americas: 383 sequences, Asia: 387 sequences, Europe: 686 sequences, and Oceania: 121 sequences. After elimination of sequences with indeterminate or ambiguous positions, the number of analyzed sequences for each region was as follows: nsp1, 1608; nsp3, 1511; nsp14, 1550; S, 1488; Orf3a, 1600; E, 1615; Orf6, 1616; Orf8, 1612; and N, 1610. Finally, nucleotide sequences were grouped by fortnight (FN) according to their collection date. Table 1 summarizes the number of sequences per fortnight since the beginning of the pandemic up to FN8. However, Data set 2 was created using only variable sequences of each region analyzed in Data set 1. Thus, Data set 1 was used for the analysis of amino acid substitutions and Data set 2 was used for the phylogenetic signal analysis and the Bayesian coalescent trees' construction.
Table 1.
The number of SARS‐CoV‐2 sequences by fortnight (temporal structure)
| Fortnight | Date | Median of analyzed sequences (Q1–Q3) |
|---|---|---|
| FN1 | 12/24/2019–12/31/2019 | 15 |
| FN2 | 01/01/2020–01/15/2020 | 19 |
| FN3 | 01/16/2020–01/31/2020 | 145 (136–145.5) |
| FN4 | 02/01/2020–02/15/2020 | 119 (113–120) |
| FN5 | 02/16/2020–03/02/2020 | 258 (247–259) |
| FN6 | 03/03/2020–03/17/2020 | 403 (390–406) |
| FN7 | 03/18/2020–04/01/2020 | 447 (416–450) |
| FN8 | 04/02/2020–04/17/2020 | 199 (197–201) |
| Total | 1488–1616 |
Note: The total number of sequences is variable, depending on the analyzed region (nsp1, 1608; nsp3, 1511; nsp14, 1550; S, 1488; Orf3a, 1600; E, 1615; Orf6, 1616; Orf8, 1612; and N, 1610).
Abbreviations: FN, fortnight; Q1, quartile 1; Q3, quartile 3.
2.2. Phylogenetic signal
To determine the phylogenetic signal of each of the nine generated alignments, Likelihood Mapping analyses were carried out, 15 using the Tree Puzzle v5.3 program 16 and the Quartet puzzling algorithm. This algorithm allowed analyzing the tree topologies that can be completely solved from all possible quartets of the n alignment sequences using maximum likelihood. An alignment with defined tree values >70%–80% presents strong support from the statistical point of view. 16 Identical sequences were also removed with ElimDupes (available at https://www.hiv.lanl.gov/content/sequence/elimdupesv2/elimdupes.html), as they increase computation time and provide no additional information about dated phylogeny. The best‐fit evolutionary model to each data set was selected on the basis of the Bayesian Information Criterion obtained with the JModelTest v2.1.10 software. 17
2.3. Analysis of amino acid substitutions
Entropy‐one (available at https://www.hiv.lanl.gov/content/sequence/ENTROPY/entropy_one.html) was used in determining the frequency of amino acids at each position for the nine genomic regions analyzed and evaluating their permanence in the eight investigated fortnights in Data set 1.
2.4. Bayesian coalescence and phylogenetic analysis
To study the relationship among SARS‐CoV‐2 sequences, nine regions of the viral genome were investigated by Bayesian analyses. Phylogenetic trees were constructed using Bayesian inference with MrBayes v3.2.7a. 18 Each gene was analyzed independently with the same data set used for the phylogenetic signal analysis, so that non‐identical sequences were included in the analysis. Analyses were run for five million generations and sampled every 5000 generations. Convergence of parameters (effective sample size [ESS] ≥ 200, with a 10% burn‐in) was verified with Tracer v1.7.1. 19 Phylogenetic trees were visualized with FigTree v1.4.4.
2.5. Evolutionary rate
The estimation of the nucleotide evolutionary rate was made with the Beast v1.10.4 program package. 20 Analyses were run at the CIPRES Science Gateway server. 21 In total, 312 sequences without indeterminations corresponding to the nsp3 (5835 nt) and S (3822 nt) genes were randomly selected from Data set 1. The sequences represent all the fortnights and most of the geographical locations sampled until April 17. Temporal calibration was performed by the date of sampling. The appropriate evolutionary model was selected as described above for phylogenetic signal analysis. The nucleotide substitution TIM model was used for nsp3 and HKY model for S. Analyses were carried out under a relaxed (uncorrelated lognormal) molecular clock model, as suggested by Duchene et al. 22 and with an exponential demographic, appropriate for early viral samples from an outbreak. 23 Independent runs were performed for each data set, and a Markov chain Monte Carlo technique with a length of 1.3 × 10⁹ steps, sampling every 1.3 × 10⁶ steps, was utilized. The convergence of the “mean rate” parameter (effective sample size [ESS] ≥ 200, burn‐in 10%) was verified with Tracer v1.7.1. 19 Additionally, to verify the obtained results, 15 independent replicates of the analysis were performed with the time calibration information (date of sampling) randomized, as described by Rieux and Khatchikian. 24 Finally, the obtained parameters for real data and the randomized replicates were compared.
3. RESULTS
3.1. Phylogenetic signal
Using bioinformatics tools, a phylogenetic signal study was carried out to identify the most informative SARS‐CoV‐2 genomic regions. The likelihood mapping analysis showed that most genes have a very poor phylogenetic signal with high values in the central region that represents the area of unresolved quartets (Figure 1). Accordingly, genes could be separated into three groups: the first group with little or no phylogenetic signal (E, Orf6, Orf8, nsp1, and nsp14), the second group with a low phylogenetic signal (Orf3a and N), and the last group with a relatively more phylogenetic signal (S and nsp3), but still low to be considered a robust one (unresolved quartets >40%).
Figure 1.
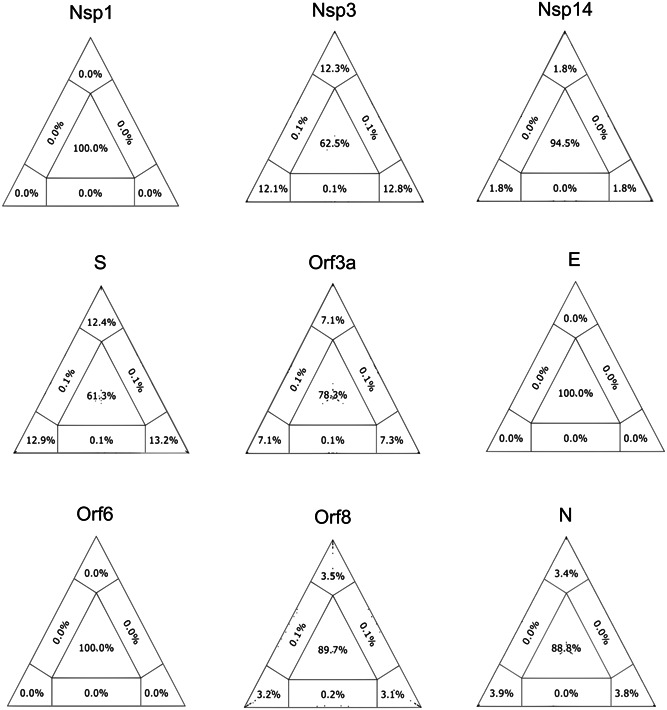
The phylogenetic signal for SARS‐CoV‐2 data sets. The presence of the phylogenetic signal was evaluated by likelihood mapping, unresolved quartets (center), and partly resolved quartets (edges) for genomes available on April 17 for the nine analyzed regions: nsp1 (29 sequences), nsp3 (225 sequences), nsp14 (65 sequences), S (183 sequences), Orf3a (74 sequences), E (11 sequences), Orf6 (12 sequences), Orf8 (23 sequences), and N (113 sequences). The presence of a strong phylogenetic signal (<40% unresolved quartets) was not observed for any region
3.2. Analysis of amino acid substitutions
The analysis of amino acid substitutions by fortnights was useful to study the viral evolutionary dynamics in the context of the beginning of the pandemic. When analyzing amino acid sequences from different time periods, changes were observed in 5 of 9 genomic regions and only in 14 of 4975 (0.28%) evaluated residues. In most of the regions, except nsp1, nsp14, E, and Orf6, 2–6 amino acids emerge since FN3 and remain unchanged until the end of the follow‐up period (Table 2). Particularly, in the Orf8 region, early selection of two amino acid substitutions (V62L and L84S) was observed in FN2. However, in the S region, the D614G substitution started with <2% in FN3 and FN4 and reached 88% in the last fortnight. In a similar way, the Q57H (Orf3a) substitution increased from 6% to 34%, whereas selection of L84S (Orf8) substitution started in FN2 and reached 6% at FN8. The R203K and G204R substitutions from the N region emerged in FN4 and increased their population proportion to values >20% toward the end of the follow‐up period. Moreover, the emergence of a great number of sporadic substitutions that remain in the population for a short period (1–3 fortnights) was observed in the nine analyzed regions. Indeed, 333 (6.83%) positions from the total analyzed presented at least one substitution throughout the eight fortnights. Table 3 summarizes the number of variable positions, number of mutations, and number of sequences with mutations by region.
Table 2.
Amino acids selected by region and fortnight. The number indicates the amino acid location in its protein
| Amino acid percentage by FN | |||||||||
|---|---|---|---|---|---|---|---|---|---|
| Region | Amino acid substitution | FN1 | FN2 | FN3 | FN4 | FN5 | FN6 | FN7 | FN8 |
| nsp3 | A58T | 0 | 0 | 0 | 1.0 | 6.0 | 3.0 | 3.0 | 2.5 |
| P135L | 0 | 0 | 0.8 | 0 | 0 | 1.5 | 0.5 | 2.5 | |
| S | D614G | 0 | 0 | 1.5 | 1.8 | 37.0 | 64.0 | 75.0 | 88.0 |
| Orf3a | Q75H | 0 | 0 | 0 | 0 | 6.0 | 22.0 | 23.0 | 34.0 |
| G196V | 0 | 0 | 0 | 0 | 0.8 | 4.0 | 0.9 | 0.5 | |
| G251V | 0 | 0 | 8.0 | 24.0 | 8.0 | 9.0 | 10.0 | 3.0 | |
| Orf8 | V62L | 0 | 5.0 | 1.0 | 3.3 | 0.0 | 1.5 | 1.3 | 3.0 |
| L84S | 0 | 42.0 | 37.0 | 21.0 | 21.0 | 18.0 | 7.0 | 6.0 | |
| N | P13L | 0 | 0 | 0 | 0 | 1.0 | 1.0 | 2.5 | 0.5 |
| S197L | 0 | 0 | 0 | 0 | 1.1 | 5.0 | 0.9 | 0.5 | |
| S202N | 0 | 0 | 3.5 | 4.2 | 0 | 0.5 | 2.2 | 2.5 | |
| R203K | 0 | 0 | 0 | 0 | 17.0 | 19.0 | 24.0 | 23.0 | |
| G204R | 0 | 0 | 0 | 0 | 17.0 | 19.0 | 24.0 | 23.0 | |
| I292T | 0 | 0 | 0 | 0 | 2.0 | 0.2 | 0.2 | 0.5 | |
Note: Only regions where amino acid change was selected and remained until the last analyzed fortnight are shown.
Abbreviation: FN, fortnight.
Table 3.
The number of variable positions, number of mutations, and number of sequences with mutation by region
| Region | No. of variable aa positions (%) | No. of aa substitutions | No. of sequences with aa substitutions (%) |
|---|---|---|---|
| nsp1 (180aa) | 3 (1.7) | 37 | 37 (2.4) |
| nsp3 (1945aa) | 158 (8.1) | 322 | 294 (19.3) |
| nsp14 (527aa) | 6 (1.4) | 83 | 83 (5.5) |
| S (1273aa) | 76 (5.9) | 1013 | 904 (59.4) |
| Orf3a (275aa) | 11 (4) | 491 | 468 (30.7) |
| E (75aa) | 5 (6.7) | 6 | 6 (0.4) |
| Orf6 (60aa) | 7 (11.6) | 9 | 9 (0.6) |
| Orf8 (121aa) | 14 (11.6) | 312 | 288 (18.9) |
| N (419aa) | 53 (12.6) | 760 | 470 (30.9) |
| Total (4875aa) | 333 (6.8) | 3033 | – |
Abbreviation: aa, amino acid.
3.3. Bayesian coalescence analysis
In this study, trees were analyzed by Bayesian analysis instead of distance, likelihood, or parsimony methods. Consistent with the phylogenetic signal analysis, trees for nsp1, E, and Orf6 showed a star‐like topology. Nevertheless, different proportions of clade formation could be observed in trees of Orf8, nsp14, Orf3a, N, S, and nsp3 regions (Figure 2). Finally, from the mentioned regions, nsp3 and S showed a better clade constitution. This analysis allowed to differentiate regions displaying a diversification process (nsp3, nsp14, Orf3a, S, Orf8, and N) from those that even after 4 months showed an incipient one (nsp1, E, and Orf6). Furthermore, this nucleotide analysis is complemented by the previous study of amino acid variations in each region. However, it is important to note that due to the low phylogenetic signal observed for each region, results can only be considered as preliminary.
Figure 2.
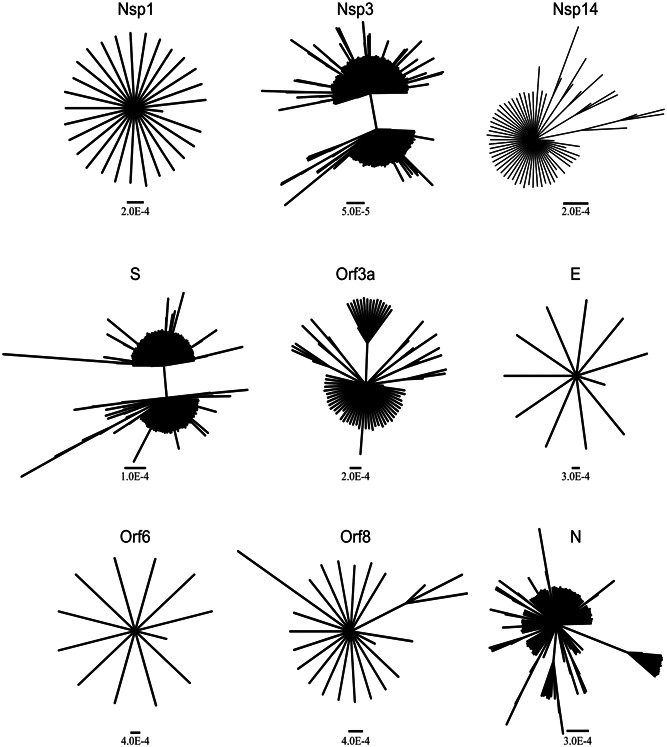
Bayesian trees of 29 sequences of nsp1 (540 nt), 225 sequences of nsp3 (5835 nt), 65 sequences of nsp14 (1581 nt), 183 sequences of S (3822 nt), 74 sequences of Orf3a (828 nt), 11 sequences of E (228 nt), 12 sequences of Orf6 (186 nt), 23 sequences of Orf8 (366 nt), and 113 sequences of N (1260 nt). Scale bar represents substitutions per site
3.4. Evolutionary rate
Nsp3 and S sequences were selected to perform the evolutionary rate analysis, as both regions provided the best phylogenetic information among studied regions. The observed evolutionary rate for SARS‐CoV‐2 nsp3 protein was estimated as 1.37 × 10⁻³ nucleotide substitutions per site per year (s/s/y) (95% HPD interval 9.16 × 10⁻⁴ to 1.91 × 10⁻³). However, the corresponding figures for S were estimated in 2.19 × 10⁻³ nucleotide s/s/y (95% HPD interval 3.19 × 10⁻³ to 1.29 × 10⁻³). In both genomic regions, date randomization analyses showed no overlapping between the 95% HPD substitution rate intervals obtained from real data and date‐randomized data sets. This fact suggests that the original data set has enough temporal signal to perform analyses with temporal calibration based on tip dates (Figure 3).
Figure 3.
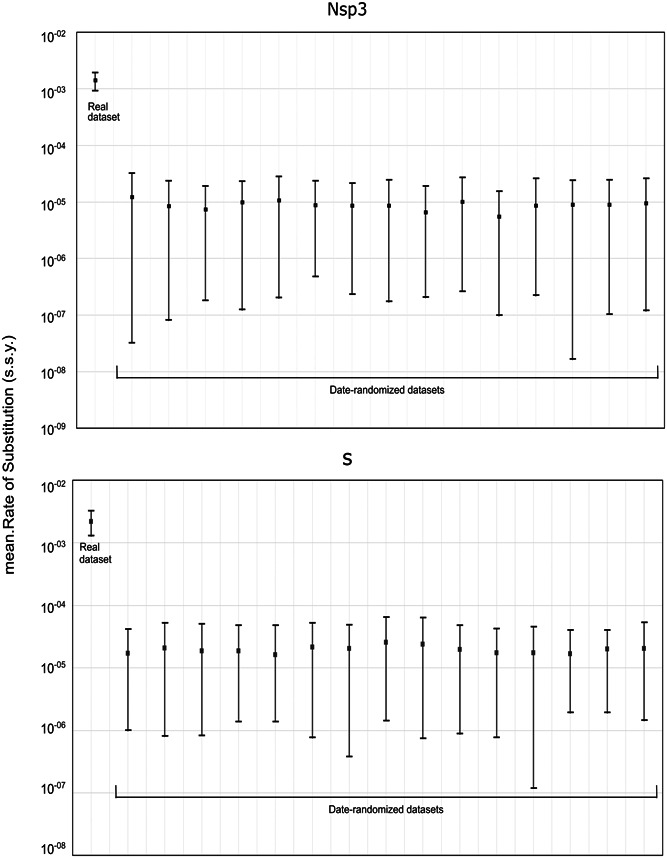
A comparison of the evolutionary rates estimated using BEAST for the original data set and the date‐randomized data sets (312 sequences). This analysis was performed for regions nsp3 (5835 nt) and S (3822 nt). s.s.y. = substitutions/site/year
4. DISCUSSION
The phylogenetic characterization of an emerging virus is crucial to understand the way the virus and the pandemic will evolve. Thus, a detailed study of the SARS CoV‐2 genome allows, on the one hand, to contribute to the knowledge of viral diversity to detect the most suitable regions to be used as antivirals or vaccines targets. On the other hand, the large amount of information that has been continuously generated since SARS CoV‐2 emergence in human beings is allowing study of its genome and describing the real‐time evolution of a new virus like never before.
In the present study, the molecular evolution and viral lineages of SARS‐CoV‐2 in nine genomic regions, during eight successive fortnights, were analyzed using three different approaches: phylogenetic signal assessment, the emergence of amino acid substitutions, and Bayesian evolutionary rate estimation. In this context, the observed phylogenetic signals of nine coding regions were very low and the obtained trees were consistent with this finding, showing star‐like topologies in some viral regions (nsp1, E, and Orf6). However, after a 4‐month evolution period, it was possible to identify regions (nsp3, S, Orf3a, Orf8, and N) revealing an incipient formation of viral lineages, despite the phylogenetic signal, both at the nucleotide and amino acid levels from FN3. On the basis of these findings, the SARS‐CoV‐2 evolutionary rate was estimated, for the first time, for the two regions showing higher variability (S and nsp3).
With respect to the phylogenetic signal, several simulation studies have proven that for a set of sequences to be considered robust, the central and lateral areas representing the unresolved quartets must not be >40%. 15 In this regard, none of the nine analyzed regions have met this requirement. Three regions (E, nsp1, and Orf6) presented values of 100% unresolved quartets. Most regions (nsp14, Orf3a, Orf8, and N) reached values higher than 85%. Only in regions nsp3 and S, the number of unresolved quartets dropped to ~60%. Thus, despite being a virus with an RNA genome, the short time elapsed since its emergence, and possibly genetic restrictions have led to a constrained evolution of SARS‐CoV‐2 in these months. For this reason, it is expected that trees generated from SARS‐CoV‐2 partial sequences in the first months of the pandemic are unreliable for defining clades. Therefore, they should be analyzed with caution.
As Bayesian analysis allows to infer phylogenetic patterns from tree distributions, it represents a more reliable tool to compare different evolutionary behaviors. Bayesian analysis helps to obtain a tree topology that is closer to reality in the current conditions of SARS‐CoV‐2 pandemic. 25 The phylogenetic analysis for nsp1, E, and Orf6 regions confirmed the star‐like topologies in accordance with a lower diversification of these regions using the sequences available up to FN8 (Figure 2). Trees generated from nsp14 and Orf8 are at an intermediate point, where the formation of small clusters can be observed. In fact, a mutation at position 28 144 (Orf8: L84S) has been proposed as a possible marker for viral classification. 26 , 27 Finally, trees obtained from regions Orf3a, N, nsp3, and S showed the best clade formation. Indeed, in the most variable regions nsp3 and S, it can be clearly seen that sequences are separated into two large groups. Although the clusters observed for nsp3 and S showed high support values, these results should be taken with precaution and longer periods should be considered to obtain more accurate phylogenetic data. However, even when data are not the most accurate to study the spread or clade formation, 28 , 29 they provide a good representation of the way the virus is evolving.
The analysis of amino acid frequencies allowed identifying different degrees of region conservation throughout the viral genome due to positive and negative pressures. In particular, nsp3, S, Orf8, and N showed some substitutions in high frequencies. This would indicate, as other authors have previously reported, the frequent circulation of polymorphisms due to a significant positive pressure. 12 , 26 , 30 Additionally, as S and N are among the candidates to be used in the formulation of vaccines and antibody treatment, it will be important to monitor these substitutions in different geographic regions to improve treatment and vaccination efficacy. 31 , 32 , 33 In particular, the appearance of the D614G variant in the third week and its rapid increase until reaching an 88% prevalence in the eighth week could reflect an improvement in viral fitness, as it has been previously reported. 34 This is supported by studies on SARS CoV showing that predicted S protein domains underwent the most extensive amino acid substitutions and the strongest positive selection. 35
Contrarily, in regions nsp1, nsp14, E, and Orf6, no substitutions were selected during the first 4 months of the pandemic. This would suggest that these regions present constraints to change due to a great negative selection pressure, as it has been recently reported. 12
In the present study, the evolutionary rate for SARS‐CoV‐2 genes was estimated by analyzing a large number of sequences, which were carefully curated and had a good temporal and spatial structure. Additionally, the most phylogenetically informative regions of the genome (nsp3 and S) were used for analysis, reinforcing the results confidence. Previous studies on SARS‐CoV‐2 have reported similar data, ranging from 1.79 × 10⁻³ to 6.58 × 10⁻³ s/s/y, for the complete genome. 6 , 36 However, in both articles, small data sets of complete genomes were used (N = 32 and 54, respectively). As studies were performed early in the outbreak and due to data sets' temporal structure, analysis could have led to less precise estimates of the evolutionary rate. 22 Alternatively, another study from van Dorp et al., 14 analyzing 7666 sequences, has obtained different results with a remarkably low evolutionary rate (6 × 10⁻⁴ nucleotide/genome/year). However, it is important to consider that van Dorp et al. 14 estimated the evolutionary rate using the complete genome, including several highly conserved genomic regions, whereas in our work, the estimation was performed with the most variable regions of the genome. Additionally, tests randomizing the dates of nsp3 and S data sets were carried out; they showed that these partial genomic regions have enough temporal structure and that they are informative, allowing the estimation of evolutionary rates. In this context, our results (1.37 × 10⁻³ s/s/y for NSp3 and 2.19 × 10⁻³ s/s/y for S) are in close agreement with those published for SARS‐CoV genome, which have been estimated to range between 0.80 and 3.01 × 10⁻³ s/s/y. 35 , 37 , 38 In particular, Zhao et al. 38 estimated a similar evolutionary rate for the SARS‐CoV S gene. Moreover, our estimated values are in the same order of magnitude as other RNA viruses. 39 Although we should be cautious with the interpretation of these results, our date randomization analysis indicated a robust temporal signal.
In addition, the importance of separately studying the evolutionary rate of the S genomic region arises from the fact that it represents the main target for antiviral agents and vaccines, as it includes the SARS‐CoV‐2 receptor‐binding domain, a crucial structure for the virus to enter host cells, and binding site for neutralizing antibodies. 40 “Furthermore, a re‐infection case occurring 142 days after the first infection episode has been reported. The second infection virus sequence showed 4 changes out of 14 amino acids in the spike protein and 2 changes in nsp3, 41 the two genome genes considered phylogenetically most informative in our work. As neutralizing antibodies are targeted against the spike protein, 42 a high evolutionary rate in this gene can imply changes in the circulating virus, thereby turning it less susceptible to neutralizing antibodies generated during the first infection. In fact, certain mutations in the spike protein, more precisely in the receptor‐binding and in the N‐terminal domain, have been reported to confer a reduced susceptibility to neutralizing antibodies. 43 , 44 For this reason, the evolutionary rate of S and nsp3 genes, reported separately here for the first time, is a crucial issue, as it may have implications for vaccines development, vaccine efficacy, or natural re‐infections.”
Despite limitations of the evolutionary study of an emerging virus, where the selection pressures are still low, and thus low variability, this study has an advantage: the extremely careful selection of a big sequence data set to be analyzed. First, sequences were selected considering their good temporal signal and their balanced spatial (geographic) distribution. Second, attention was paid to eliminate sequences with low coverage and indeterminacies that could generate bias in the phylogenetic analysis of a virus that is beginning to evolve in a new host.
The appearance of a virus means an adaptation challenge. In this sense, both SARS‐CoV and SARS‐CoV‐2 have shown a rapid emergence of several lineages in a short period, 35 , 45 reflecting a high adaptability. However, the spike of SARS‐CoV‐2 binds to the host cell receptor with a 10–20‐fold greater affinity as compared with SARS‐CoV and contains a polybasic (furin) cleavage site insertion, which may enhance the virus infectivity. 46 Thus, changes in the S protein make an important contribution, turning SARS‐CoV 2 to spillover stage, which shows a significantly higher spread than SARS‐CoV and MERS‐CoV. Due to this fact, SARS‐CoV 2 becomes the most important pandemic of the century. In this context, results obtained in this study about the uneven diversity of nine crucial viral regions and the determination of the evolutionary rate are decisive to understanding essential features of viral emergence. Nevertheless, monitoring SARS‐CoV‐2 population will be required to determine the evolutionary dynamics of new mutations as well as to understand the way they affect viral fitness in human hosts.
CONFLICT OF INTERESTS
The authors declare that there are no conflict of interests.
AUTHOR CONTRIBUTIONS
Data curation, acquisition of data, analysis and interpretation of data, drafting the article, final approval of the version to be submitted: Matías J. Pereson. Data curation, acquisition of data, analysis and interpretation of data, revising the article critically for important intellectual content, final approval of the version to be submitted: Laura Mojsiejczuk. Data curation, Validation, revising the article critically for important intellectual content, final approval of the version to be submitted: Alfredo P. Martínezc. Data curation, Validation, drafting the article, final approval of the version to be submitted: Diego M. Flichman. Data curation, acquisition of data, analysis and interpretation of data, drafting the article, final approval of the version to be submitted: Gabriel H. Garcia. Conception and design of the study, acquisition of data, analysis and interpretation of data, drafting the article, final approval of the version to be submitted: Federico A. Di Lello.
ACKNOWLEDGMENTS
Matías J. Pereson, Laura Mojsiejczuk, Diego M. Flichman, and Federico A. Di Lello are members of the National Research Council (CONICET). Authors would like to thank the researchers who generated and shared the sequencing data from GISAID (https://www.gisaid.org/) and Mrs. Silvina Heisecke from CEMIC‐CONICET for providing language assistance.
Pereson MJ, Mojsiejczuk L, Martínez AP, Flichman DM, Garcia GH, Di Lello FA. Phylogenetic analysis of SARS‐CoV‐2 in the first few months since its emergence. J Med Virol. 2021;93:1722–1731. 10.1002/jmv.26545
DATA AVAILABILITY STATEMENT
Data derived from public domain resources.
REFERENCES
- 1. Su S, Wong G, Shi W, et al. Epidemiology, genetic recombination, and pathogenesis of coronaviruses. TIM. 2016;24:490‐502. 10.1016/j.tim.2016.03.003 [DOI] [PMC free article] [PubMed] [Google Scholar]
- 2. Cavanagh D. Coronavirus avian infectious bronchitis virus. Vet Res. 2007;38:281‐297. 10.1051/vetres:2006055 [DOI] [PubMed] [Google Scholar]
- 3. Cui J, Li F, Shi ZL. Origin and evolution of pathogenic coronaviruses. Nat Rev Microbiol. 2019;17(3):181‐192. 10.1038/s41579-018-0118-9 [DOI] [PMC free article] [PubMed] [Google Scholar]
- 4. Zhu N, Zhang D, Wang W, et al. A novel coronavirus from patients with pneumonia in China, 2019. N Engl J Med. 2020;382:727‐733. 10.1056/NEJMoa2001017 [DOI] [PMC free article] [PubMed] [Google Scholar]
- 5. Coronaviridae Study Group of the International Committee on Taxonomy of Viruses . The species severe acute respiratory syndrome‐related coronavirus: classifying 2019‐nCoV and naming it SARS‐CoV‐2. Nat Microbiol. 2020;5:536‐544. 10.1038/s41564-020-0695-z [DOI] [PMC free article] [PubMed] [Google Scholar]
- 6. Li X, Wang W, Zhao X, et al. Transmission dynamics and evolutionary history of 2019‐nCoV. J Med Virol. 2020;92:501‐511. 10.1002/jmv.25701 [DOI] [PMC free article] [PubMed] [Google Scholar]
- 7. Li Q, Guan X, Wu P, et al. Early transmission dynamics in Wuhan, China, of novel coronavirus‐infected pneumonia. N Engl J Med. 2020;382:1199‐1207. 10.1056/NEJMoa2001316 [DOI] [PMC free article] [PubMed] [Google Scholar]
- 8. World Health Organization. Coronavirus disease (COVID‐19) Situation report—118 , 2020. https://www.who.int/docs/default-source/coronaviruse/situation-reports/20200517-covid-19-sitrep-118.pdf?sfvrsn=21c0dafe_6
- 9. Luk HKH, Li X, Fung J, et al. Molecular epidemiology, evolution and phylogeny of SARS coronavirus. Infect Genet Evol. 2019;71:21‐30. 10.1016/j.meegid.2019.03.001 [DOI] [PMC free article] [PubMed] [Google Scholar]
- 10. Zhou P, Yang XL, Wang XG, et al. A pneumonia outbreak associated with a new coronavirus of probable bat origin. Nature. 2020;579:270‐273. 10.1038/s41586-020-2012-7 [DOI] [PMC free article] [PubMed] [Google Scholar]
- 11. Benvenuto D, Giovanetti M, Salemi M, et al. The global spread of 2019‐nCoV: a molecular evolutionary analysis. Pathogen Global Health 2020;114:64‐67. 10.1080/20477724.2020.1725339 [DOI] [PMC free article] [PubMed] [Google Scholar]
- 12. Cagliani R, Forni D, Clerici M, Sironi M. Computational inference of selection underlying the evolution of the novel coronavirus, SARS‐CoV‐2. J Virol. 2020;94. 10.1128/JVI.00411-20 [DOI] [PMC free article] [PubMed] [Google Scholar]
- 13. Phan T. Genetic diversity and evolution of SARS‐CoV‐2. Infect Genet Evol. 2020;81:104260. 10.1016/j.meegid.2020.104260 [DOI] [PMC free article] [PubMed] [Google Scholar]
- 14. van Dorp L, Acman M, Richard D, et al. Emergence of genomic diversity and recurrent mutations in SARS‐CoV‐2. Infect Genet Evol. 2020;5:104351. 10.1016/j.meegid.2020.104351 [DOI] [PMC free article] [PubMed] [Google Scholar]
- 15. Strimmer K, von Haeseler A. Likelihood‐mapping: a simple method to visualize phylogenetic content of a sequence alignment. Proc Natl Acad Sci U S A. 1997;94:6815‐6819. 10.1073/pnas.94.13.6815 [DOI] [PMC free article] [PubMed] [Google Scholar]
- 16. Schmidt HA, Strimmer K, Vingron M, von Haeseler A. TREE‐PUZZLE: maximum likelihood phylogenetic analysis using quartets and parallel computing. Bioinformatics. 2002;18:502‐504. 10.1093/bioinformatics/18.3.502 [DOI] [PubMed] [Google Scholar]
- 17. Darriba D, Taboada GL, Doallo R, Posada D. jModelTest 2: more models, new heuristics and parallelcomputing. Nature Methods. 2012;9:772. 10.1038/nmeth.2109 [DOI] [PMC free article] [PubMed] [Google Scholar]
- 18. Ronquist F, Teslenko M, van der Mark P, et al. MrBayes 3.2: efficient Bayesian phylogenetic inference and model choice across a large model space. Syst Biol. 2012;61:539‐542. 10.1093/sysbio/sys029 [DOI] [PMC free article] [PubMed] [Google Scholar]
- 19. Rambaut A, Drummond AJ, Xie D, Baele G, Suchard MA. Posterior summarization in Bayesian phylogenetics using Tracer 1.7. Syst Biol. 2018;67:901‐904. 10.1093/sysbio/syy032 [DOI] [PMC free article] [PubMed] [Google Scholar]
- 20. Suchard MA, Lemey P, Baele G, et al. Bayesian phylogenetic and phylodynamic data integration using BEAST 1.10. Virus Evol. 2018;4:vey016. 10.1093/ve/vey016 [DOI] [PMC free article] [PubMed] [Google Scholar]
- 21. Miller MA, Pfeiffer X, Schwartz T. Creating the CIPRES science gateway for inference of large phylogenetic trees. Gateway Comput Env Workshop. 2010:1‐8. 10.1109/GCE.2010.5676129 [DOI] [Google Scholar]
- 22. Duchene S, Featherstone L, Haritopoulou‐Sinanidou M, et al. Temporal signal and the phylodynamic threshold of SARS‐CoV‐2. Preprints. 2020. 10.1101/2020.05.04.077735 [DOI] [PMC free article] [PubMed] [Google Scholar]
- 23. Grassly NC, Fraser C. Mathematical models of infectious disease transmission. Nat Rev Microbiol. 2008;6:477‐487. 10.1038/nrmicro1845 [DOI] [PMC free article] [PubMed] [Google Scholar]
- 24. Rieux A, Khatchikian CE. tipdatingbeast: an r package to assist the implementation of phylogenetic tip‐dating tests using beast. Mol Ecol Resource. 2017;17:608‐613. 10.1111/1755-0998.12603 [DOI] [PubMed] [Google Scholar]
- 25. Drummond AJ, Ho SYW, Phillips MJ, Rambaut A. Relaxed phylogenetics and dating with confidence. PLOS Biol. 2006;4:e88. 10.1371/journal.pbio.0040088 [DOI] [PMC free article] [PubMed] [Google Scholar]
- 26. Tang X, Wu C, Li X, et al. On the origin and continuing evolution of SARS‐CoV‐2. Natl Sci Rev. 2020;0:1‐12. 10.1093/nsr/nwaa036 [DOI] [PMC free article] [PubMed] [Google Scholar]
- 27. Yin C. Genotyping coronavirus SARS‐CoV‐2: methods and implications. Genomics. 2020:30318‐30319. 10.1016/j.ygeno.2020.04.016 [DOI] [PMC free article] [PubMed] [Google Scholar]
- 28. Mavian C, Marini S, Prosperi M, Salemi M. A snapshot of SARS‐CoV‐2 genome availability up to 30th March, 2020 and its implications. JMIR Public Health Surveill. 2020;6:e19170. 10.2196/19170 [DOI] [PMC free article] [PubMed] [Google Scholar]
- 29. Sánchez‐Pacheco SJ, Kong S, Pulido‐Santacruz P, Murphy RW, Kubatko L. Median‐joining network analysis of SARS‐CoV‐2 genomes is neither phylogenetic nor evolutionary. Proc Natl Acad Sci U S A. 2020;117:9241‐9243. 10.1073/pnas.2007062117 [DOI] [PMC free article] [PubMed] [Google Scholar]
- 30. Issa E, Merhi G, Panossian B, Salloum T, Tokajian S. SARS‐CoV‐2 and ORF3a: nonsynonymous mutations, functional domains, and viral pathogenesis. mSystmse. 2020;5. 10.1128/mSystems.00266-20 [DOI] [PMC free article] [PubMed] [Google Scholar]
- 31. Ahmed SF, Quadeer AA, McKay MR. Preliminary identification of potential vaccine targets for the COVID‐19 coronavirus (SARS‐CoV‐2) based on SARS‐CoV immunological studies. Viruses. 2020;12:254. 10.3390/v12030254 [DOI] [PMC free article] [PubMed] [Google Scholar]
- 32. Callaway E. The race for coronavirus vaccines: a graphical guide. Nature. 2020;580:576‐577. 10.1038/d41586-020-01221-y [DOI] [PubMed] [Google Scholar]
- 33. Koyama T, Weeraratne D, Snowdon JL, Parida L. Emergence of drift variants that may affect COVID‐19 vaccine development and antibody treatment. Pathogens. 2020;9:324. 10.20944/preprints202004.0024.v1 [DOI] [PMC free article] [PubMed] [Google Scholar]
- 34. Li Q, Wu J, Nie J, et al. The impact of mutations in SARS‐CoV‐2 spike on viral infectivity and antigenicity. Cell. 2020;182:1284‐1294. 10.1016/j.cell.2020.07 [DOI] [PMC free article] [PubMed] [Google Scholar]
- 35. The Chinese SARS Molecular Epidemiology Consortium . Molecular evolution of the SARS coronavirus during the course of the SARS epidemic in China. Science. 2004;303:1666‐1669. 10.1126/science.1092002 [DOI] [PubMed] [Google Scholar]
- 36. Giovanetti M, Benvenuto D, Angeletti S, Ciccozzi M. The first two cases of 2019‐nCoV in Italy: where they come from? J Med Virol. 2020;92:518‐521. 10.1002/jmv.25699 [DOI] [PMC free article] [PubMed] [Google Scholar]
- 37. Vega VB, Ruan Y, Liu J, et al. Mutational dynamics of the SARS coronavirus in cell culture and human populations isolated in 2003. BMC Infect Dis. 2004;4:32. 10.1186/1471-2334-4-32 [DOI] [PMC free article] [PubMed] [Google Scholar]
- 38. Zhao Z, Li H, Wu X, et al. Moderate mutation rate in the SARS coronavirus genome and its implications. BMC Evol Biol. 2004;4:21. 10.1186/1471-2148-4-21 [DOI] [PMC free article] [PubMed] [Google Scholar]
- 39. Sanjuán R. From molecular genetics to phylodynamics: evolutionary relevance of mutation rates across viruses. PLOS Pathog. 2012;8:e1002685. 10.1371/journal.ppat.1002685 [DOI] [PMC free article] [PubMed] [Google Scholar]
- 40. Ju B, Zhang Q, Ge J, et al. Human neutralizing antibodies elicited by SARS‐CoV‐2 infection. Nature. 2020;584:115‐119. 10.1038/s41586-020-2380-z [DOI] [PubMed] [Google Scholar]
- 41. To KKW, Hung IFN, Ip JD, et al. COVID‐19 re‐infection by a phylogenetically distinct SARS‐coronavirus‐2 strain confirmed by whole genome sequencing. Clin Infect Dis. 2020;ciaa1275. 10.1093/cid/ciaa1275 [DOI] [PMC free article] [PubMed] [Google Scholar]
- 42. Liu L, Wang P, Nair MS, et al. Potent neutralizing antibodies against multiple epitopes on SARS‐CoV‐2 spike. Nature. 2020;584:450‐456. [DOI] [PubMed] [Google Scholar]
- 43. Weisblum Y, Schmidt F, Zhang F, et al. Escape from neutralizing antibodies by SARS‐CoV‐2 spike protein variants. Preprints. 2020. 10.1101/2020.07.21.214759 [DOI] [PMC free article] [PubMed] [Google Scholar]
- 44. Barnes CO, Jette CA, Abernathy ME, et al. Structural classification of neutralizing antibodies against the SARS‐CoV‐2 spike receptor‐binding domain suggests vaccine and therapeutic strategies. Preprints. 2020. 10.1101/2020.08.30.273920 [DOI] [Google Scholar]
- 45. Rambaut A, Holmes EC, O'Toole Á, et al. A dynamic nomenclature proposal for SARS‐CoV‐2 lineages to assist genomic epidemiology [online ahead of print]. Nat Microbiol. 2020. 10.1038/s41564-020-0770-5 [DOI] [PMC free article] [PubMed] [Google Scholar]
- 46. Zhang YZ, Holmes EC. A genomic perspective on the origin and emergence of SARS‐CoV‐2. Cell. 2020;181(2):223‐227. 10.1016/j.cell.2020.03.035 [DOI] [PMC free article] [PubMed] [Google Scholar]
Associated Data
This section collects any data citations, data availability statements, or supplementary materials included in this article.
Data Availability Statement
Data derived from public domain resources.