

Abstract
Background
Serological immunoassays that can identify protective immunity against SARS‐CoV‐2 are needed to adapt quarantine measures, assess vaccination responses, and evaluate donor plasma. To date, however, the utility of such immunoassays remains unclear. In a mixed‐design evaluation study, we compared the diagnostic accuracy of serological immunoassays that are based on various SARS‐CoV‐2 proteins and assessed the neutralizing activity of antibodies in patient sera.
Methods
Consecutive patients admitted with confirmed SARS‐CoV‐2 infection were prospectively followed alongside medical staff and biobank samples from winter 2018/2019. An in‐house enzyme‐linked immunosorbent assay utilizing recombinant receptor‐binding domain (RBD) of the SARS‐CoV‐2 spike protein was developed and compared to three commercially available enzyme‐linked immunosorbent assays (ELISAs) targeting the nucleoprotein (N), the S1 domain of the spike protein (S1), and a lateral flow immunoassay (LFI) based on full‐length spike protein. Neutralization assays with live SARS‐CoV‐2 were performed.
Results
One thousand four hundred and seventy‐seven individuals were included comprising 112 SARS‐CoV‐2 positives (defined as a positive real‐time PCR result; prevalence 7.6%). IgG seroconversion occurred between day 0 and day 21. While the ELISAs showed sensitivities of 88.4% for RBD, 89.3% for S1, and 72.9% for N protein, the specificity was above 94% for all tests. Out of 54 SARS‐CoV‐2 positive individuals, 96.3% showed full neutralization of live SARS‐CoV‐2 at serum dilutions ≥ 1:16, while none of the 6 SARS‐CoV‐2‐negative sera revealed neutralizing activity.
Conclusions
ELISAs targeting RBD and S1 protein of SARS‐CoV‐2 are promising immunoassays which shall be further evaluated in studies verifying diagnostic accuracy and protective immunity against SARS‐CoV‐2.
Keywords: Antibodies, Neutralizing [Mesh], COVID‐19 [Supplementary Concept], COVID‐19 diagnostic testing [Supplementary Concept], Enzyme‐Linked Immunosorbent Assay [Mesh], Severe Acute Respiratory Syndrome Coronavirus 2 [Supplementary Concept]
1477 individuals are tested with 4 different serological SARS‐CoV‐2 immunoassays. ELISA against S1, RBD and N show superior accuracy compared to LFI against S. 96.4% of patient sera that are positive in ELISA show full neutralization of live SARS‐CoV‐2.
Abbreviations: ELISA, enzyme‐linked immunosorbent assay; LFI, lateral flow immunoassay; S1, S1 domain of the spike protein; S, spike protein; sens, sensitivity; spec, specificity; RBD, receptor‐binding domain of the spike protein; N, nucleocapsid protein.
Abbreviations
- ELISA
enzyme‐linked immunosorbent assay
- LFI
lateral flow immunoassay
- S1
S1 domain of the spike protein
- S
spike protein
- sens
sensitivity
- spec
specificity
- RBD
receptor binding domain of the spike protein
- N
nucleocapsid protein
1. INTRODUCTION
Governments worldwide are facing a unique challenge: to save thousands of lives threatened by coronavirus disease 2019 (COVID‐19), while minimizing economic and social damage caused by lockdown and other strict measures. Serological immunoassays will play a central role in addressing these challenges for the following reasons. 1 First, serological tests might improve the rate of diagnosis as real‐time RT‐PCR is associated with a high number of false‐negative results due to pre‐analytical and other issues. 2 Second, antibody assays may support intensive surveillance measures such as universal testing, active case‐finding, contact tracing, and linking clusters and thereby may facilitate an exit strategy from lockdown. 3 , 4 , 5 , 6 Third, immunoassays are important to identify individuals with previous severe acute respiratory syndrome coronavirus 2 (SARS‐CoV‐2) infection who have recovered and to enable adjustment of quarantine measures and physical distancing. Fourth, medical staff with protective immunity against SARS‐CoV‐2 might be identified and allocated to critical tasks with highly contagious patients. And fifth, vaccination responses in clinical studies could be more effectively monitored. Thus, global authorities including the World Health Organization strongly encourage studies that investigate performance and application of serological tests for COVID‐19.
Various receptors including the angiotensin‐converting enzyme 2 (ACE2) expressed by epithelial barrier tissues and immune cells play an important role in SARS‐CoV‐2 infection as they represent a crucial entry point for the virus. 7 , 8 , 9 The sustained inflammatory immune response caused by SARS‐CoV‐2 infection contributes the development of clinical manifestations of COVID‐19 and the related prothrombotic state. 9 , 10 In patients with severe disease, extensive activation of cytokine‐secreting cells from the innate and adaptive immune system has been reported to result in a cytokine storm contributing to acute respiratory distress syndrome and multiorgan failure. 11 , 12 , 13 , 14 , 15 Antibody responses against different SARS‐CoV‐2 antigens have been described in serological samples of infected patients. Few patients with antiviral antibodies have been identified in the first 5 days following symptom onset but the positive rate rapidly increases thereafter. 16 , 17 To date, antibody testing has focused primarily on two highly abundant structural antigens of SARS‐CoV‐2, specifically the nucleoprotein (N) protein and the spike (S) protein. 18 While the N phosphoprotein ensures the linkage of the viral RNA to the membrane, 19 the S glycoprotein binds to ACE2 and thereby initiates viral entry into the host cell. 13 , 20 , 21 , 22 Neutralizing antibodies (NAb) are typically generated against the S protein and often target the receptor‐binding domain (RBD). 23 , 24 As demonstrated in a vaccination approach using inactivated virus, the RBD represents an immunodominant viral antigen since at least half of the detectable anti‐S IgG antibodies were directed against the RBD. 25 In contrast, the amount of anti‐N antibodies was 30‐fold lower.
Lateral flow immunoassays (LFI) 26 , 27 and enzyme‐linked immunosorbent assays (ELISA) 28 , 29 have been developed but not yet adequately evaluated. While LFIs are remarkably fast and only require minutes to perform, significant concern regarding their sensitivity and specificity has been raised. 30 ELISAs are considered more robust but require highly specialized laboratories with the capacity to run automated high‐throughput measurements.
At the time of compiling this paper, the diagnostic performance of different immunoassays and their predictive value for protective immunity remains unclear. Before a broad implementation of immunoassays can be justified, the following points need to be carefully assessed in adequately powered and designed diagnostic studies: (a) diagnostic accuracy (or sensitivity/specificity, respectively) in the acute and subacute phase of the disease, (b) antibody kinetics over time in patients with confirmed COVID‐19, (c) extent of cross‐reactivity with other pathogens and patients with autoimmune disorders, (d) reliability between different assay settings and material characteristics, and (e) correlate of protective immunity. 3
With the present study, we aimed to comprehensively establish the utility and diagnostic accuracy of serological immunoassays for SARS‐CoV‐2 infection and to explore protective immunity 12 as predicted by such immunoassays in a mixed‐method observational study of hospital inpatients and medical personnel.
2. METHODS
2.1. Study design, setting, and population
International guidelines on study design were strictly followed 31 and cross‐sectional, prospective observational, and case‐control designs were used. Participants were recruited via three different routes: (a) inpatients with a SARS‐CoV‐2 test result (real‐time PCR; RT‐PCR), (b) medical personnel of the Inselspital, and (c) residual material from patients stored at the Liquid Biobank Bern (www.biobankbern.ch). Inclusion criteria of inpatients are (a) hospitalization in Inselspital, (b) tested positive for SARS‐CoV‐2 using RT‐PCR (nasopharyngeal swab), (c) aged 18 or older, and (d) signed general consent (exemption was granted for a few patients). For this manuscript, only inpatients who had tested positive for SARS‐CoV‐2 with more than 4 days of residual material available were considered. The temporal pattern of antibody response and seroconversion rate was assessed in a subgroup of inpatients; the first 25 consecutive patients were selected. Inclusion criteria of medical personnel were (a) medical staff at Inselspital since February 2020, (b) aged 18 or older, and (c) signed informed consent. The personnel were recruited via mailing lists. A limited number of fully anonymized, residual biobank samples were also used for the purpose of this study with the inclusion criterion of having been collected from inpatients between December 2018 and February 2019. A total of 54 randomly selected sera from individuals who were tested positive in either of the three ELISA immunoassays and 6 negative controls were assessed in a live SARS‐CoV‐2 neutralization assay (all collected in April 2020).
The University Hospital Bern (Inselspital) is one of the largest tertiary hospitals in Switzerland covering a catchment area of more than 1 million inhabitants. With several associated smaller hospitals, it provides the full spectrum of general and highly specialized medical services. More than 10,000 employees work at the Insel Gruppe AG.
The study was supported by the local COVID‐19 task force. The study protocol was approved by the appropriate ethics committee and the authorities of the University Hospital and conducted in accordance with the Declaration of Helsinki. The manuscript was prepared according to the Standards for Reporting Diagnostic accuracy studies (STARD) guideline. 32
2.2. Handling of samples and collection of data
Blood was taken following an established in‐house protocol to ensure adequate pre‐analytical conditions, and samples were collected using plastic syringes (serum or lithium heparin, respectively, S‐Monovette®, Sarstedt). Only residual material was used in the case of inpatients. Two tubes (serum and lithium heparin, respectively) were drawn in the case of medical personnel. Samples were immediately transported to the central laboratory, processed using a GLP laboratory track, and centrifuged within 30 minutes with an established protocol. 33
With regard to inpatients, pseudonymized demographical, clinical and laboratory data were extracted and transferred by the Insel Data Science Center (IDSC) from electronic patient documentation. Limited data were collected for the purpose of this sub‐study: age, gender, and time interval since RT‐PCR (nasopharyngeal swab). A positive SARS‐CoV‐2 RT‐PCR result was used as additional inclusion criterion. With regard to medical personnel, a REDCap database survey was constructed collecting demographical data, COVID‐19 symptoms (presence, extent, and date), comorbidities and risk factors, professional exposure, and date of RT‐PCR.
2.3. Generation of recombinant RBD protein
The S1 protein and RBD are regarded as ideal candidates for the development of diagnostic tests and vaccines targeting SARS‐CoV‐2. 34 The pCAGGS plasmid containing the human codon‐optimized sequence of the SARS‐CoV‐2 S protein receptor‐binding domain (RBD, amino acids R319‐F541) with native S signal sequence (amino acids M1‐S14) and a C‐terminal hexahistidine tag was kindly provided by Prof. Florian Krammer. Plasmid DNA was prepared using the Gene Elute HP Plasmid Maxiprep Kit (Sigma‐Aldrich). Prior to transfection Expi293F cells (Thermo Fisher) were grown to a density of 3.0 x 10⁶ cells/mL in culture medium (a mixture of 33% Expi293 and 66% FreeStyle‐293 media from Thermo Fisher). For each liter of transfection, 0.5 mg of plasmid DNA was diluted in 100 ml of culture medium, mixed with 1.3 mL FectoPro transfection reagent (Polyplus), and incubated for 10 minutes at room temperature prior to addition to cells. Immediately following transfection cells were supplemented with 100x D‐glucose (400g/l) and 100 x Valproic acid (300mM) boost solutions. Three days post‐transfection the cell culture supernatants were harvested by centrifugation at 7000 g for 15 minutes. Supernatants were passed through a 0.22 µm filter and 1:1 diluted with PBS containing 10 mM imidazole. For purification of his‐tagged RBD protein, 5 mL NiNTA resin (HisPur NiNTA Thermo Fisher) was washed three times with washing buffer (PBS with 10 mM imidazole) and incubated on a stir plate at 4°C for 1 hour. Subsequently, the mixture was poured into a glass column with a frit and washed 3 times with 5 column volumes of washing buffer. The protein was then eluted three times with 15 mL PBS containing 250 mM imidazole. Elutions were pooled and dialyzed overnight against PBS using 3.5 kDa cutoff SnakeSkin dialysis tubing. The final protein concentration was determined by NanoDrop measurement at A280. The quality of recombinant RBD protein was analyzed by SDS‐PAGE and analytical size‐exclusion chromatography.
2.4. Development of an in‐house ELISA
All ELISA assays were performed on a DSX automated ELISA system device (DYNEX Technologies). The in‐house assay was prepared as follows: 96‐well plates were coated overnight at 4°C with 100 µL of 1 µg/mL RBD protein in PBS. The following day, each well was blocked with 300 µL of PBS/0.15% casein at 4°C until use and at least overnight. Subsequently, plates were washed twice with PBS and 100µl sera were added at a 1:100 dilution in PBS/0.15% casein for 1 hour at RT. After five washes with 300 µL PBS/0.1% Tween, 100 µL of HRP‐labeled secondary polyclonal anti‐human IgM (Sigma, A0420) and anti‐human IgG (Sigma, A0170) antibodies was added in a 1:10’000 dilution for 30 minutes at RT. Again, the plates were washed 5 times with PBS/0.1% Tween and 100 µL of TMB substrate solution (Sigma, T4444) was added for 15 minutes at RT. The development was stopped by adding 100 µL of 0.5M H2SO4, and results were measured at OD450‐620nm. All samples with an OD > 0.5 were assigned as positive.
2.5. Determination of commercially available immunoassays
Several commercial tests were conducted according to the manufacturers’ instructions. An ELISA produced by Euroimmun AG, Lübeck, Germany targeting the S1 protein as the immobilized antigen for the detection of IgG antibodies was employed. Briefly, samples were diluted 1:100 in sample buffer and 100 μL of diluted samples, prediluted positive and negative controls, as well as prediluted calibrator were added for 1 hour at 37°C. After three wash steps with 300 µL wash buffer, 100µl of HRP‐labeled secondary anti‐human IgG antibodies was added for 30 minutes at 37°C. The plates were washed again three times with wash buffer, and 100 µL of TMB solution was added for 20 minutes at RT. The development was stopped by adding 100 µL of 0.5M H2SO4, and results were measured at OD450‐620 nm. Antibody values were expressed as a ratio (ODsample/ODcalibrator). All samples with a ratio > 1.1 were assigned as positive.
A different ELISA determining IgG and IgM antibodies against N (Epitope Diagnostics Inc) was used as follows. For IgG, samples were added to the immobilized antigen in a 1:100 dilution (in IgG sample diluent) for 30 minutes at RT. After washing the plates five times with diluted wash concentrate, 100µl of HRP‐labeled secondary anti‐human IgG antibodies was added for 30 minutes at RT. The plates were washed again five times with diluted wash concentrate, and 100 µL of TMB solution was added for 20 minutes at RT. The development was stopped by adding 100 µL of 0.5M H2SO4, and results were measured at OD450‐620nm. Cutoff for a positive reaction was calculated by the following formula: 1.1*(mean ODNegative Control + 0.18). For IgM, 10µl of undiluted samples was added to the immobilized anti‐IgM in the microtiter plate, and 100µl of IgM Sample Dilution buffer was added and incubated at 37°C for 30 minutes. After washing the plates five times with diluted wash concentrate, 100 µL of HRP‐conjugated SARS‐CoV‐2 antigen was added for 30 minutes at 37°C. The plates were washed again five times with diluted wash concentrate, and 100 µL of TMB solution was added for 20 minutes at RT. The development was stopped by adding 100 µL of 0.5M H2SO4, and results were measured at OD450‐620nm. Cutoff for positive reaction was calculated by the following formula: 1.1*(mean ODNegative Control + 0.10).
A lateral flow rapid test determining IgG and IgM antibodies against the recombinant S protein (Autobio Diagnostics Co, LTD) was used according the instructions. Briefly, 5 μL of serum or heparin plasma, or alternatively, 10 μL of whole capillary blood were added to both IgM and IgG cavities of the cassette. 60 μL of reaction buffer was added, and reactions were visually read after 15 minutes and assessed as negative, equivocal, or positive reactions.
2.6. Determination of real‐time PCR
Patient sample material was obtained by performing nasopharyngeal swabs using Copan FLOQSwabs and Copan UTM Viral Transport medium (Copan). Collected patient sample material was transported to the laboratory at room temperature and stored at 4°C until processing. For nucleic acid testing (NAT), three different methodologies were used in the respective time period of sample collection. An laboratory‐developed test (LDT) RT‐PCR workflow based on the published protocol of Corman et al was utilized for pan‐Sarbecovirus E‐gene detection 35 followed by the detection of the SARS‐CoV‐2 specific RdRP‐gene. Additionally, two commercial, fully automated workflows, the Seegene Allplex 2019‐nCoV Assay (Seegene), and the Roche cobas® SARS‐CoV‐2 Assay (Roche Diagnostics) were used.
RNA for the LDT RT‐PCR workflow was extracted after inactivation of patient samples using AVL buffer (Qiagen) in a ratio of 200 µL sample + 800 µL buffer using the MagNA Pure 24 system (Roche Diagnostics) or ELITe InGenius SP 1000 extraction cassette on an InGenius System (Elitech) and eluted in 100 μL. Alternatively, an adapted cobas 4800 workflow used the extraction chemicals and protocol for the IVD workflow for the cobas HIV‐1 Assay for the cobas® 4800 System (Roche Diagnostics) in which 400 μL noninactivated patient sample eluted in 100 μL was performed. RNA for the Allplex 2019‐nCoV workflow was extracted according to the manufacturer's instructions using Seegene's STARlet IVD workflow. RNA for cobas® SARS‐CoV‐2 was extracted according to the manufacturer's instructions using Roche's cobas® 8800 system.
Seegene Allplex 2019‐nCoV and cobas® SARS‐CoV‐2 were performed according to the manufacturer's instructions using a STARlet IVD System or a cobas 8800 system, respectively.
For the LDT E‐gene and RdRP‐gene detection, the following was used: RT‐PCR assays RNA Process Control Kit (Roche Diagnostics; Cat. No. 07 099 592 001) containing LightCycler Multiplex RNA Virus Master for reverse transcription/amplification, RNA Process Control as an internal control for extraction and PCR and RNA Process Control Detection Assay (proprietary Cy5‐labeled probe and primers) for RNA Process Control detection. A 20 μL reaction contained 5 μL of RNA, 1.0 μL of 20x RNA Process Control Detection Assay, 0.1 μL of 200x RT Enzyme Solution, and 4.0 μL of 5x RT‐qPCR Reaction Mix. For E‐gene detection, primer/probe sequences and concentrations were used according to the published protocol. 35 Primer/probe sequences and concentrations used for the LDT‐RdRP Assay are as follows: RdRP1‐F1; AAATGGTCATGTGTGGCGGT; 900 nM/RdRP1‐R2; ATTAACATTGGCCGTGACAGCT; 900 nM/RdRP1‐P3mgb; FAM‐CTCATCAGGAGATGCC‐MQ530; 100 nM/RdRP2‐F4; ATGGTCATGTGTGGCGGC; 900 nM/RdRP2‐R5; GCATTTACATTGGCTGTAACAGCT; 900 nM/RdRP2‐P6mgb; HEX‐CATCATCCGGTGATGCT‐MQ530; 100 nM. Primer/probe system RdRP1 is specific for detection of SARS‐CoV‐2 and primer/probe system RdRP2 is specific for detection of SARS‐CoV‐1. All oligonucleotides were synthesized and provided by Microsynth AG (Balgach, Switzerland). Thermal cycling was performed at 50°C for 10 minutes for reverse transcription, followed by 95°C for 30 seconds and 45 cycles of 95°C for 5 seconds, and 60°C for 30 seconds. A Roche Light Cycler 480 instrument was used for amplification and fluorescence detection (Roche Diagnostics).
2.7. Definition of diagnoses
As the primary reference standard test, a positive RT‐PCR test from a nasopharyngeal swab was defined as “confirmed SARS‐CoV‐2 infection” (SARS‐CoV‐2+). In light of the limitations of this test, it was used as the only reference standard for the purpose of this first analysis. Sensitivity analyses using additional reference standards will be employed in subsequent phases of this study (focusing on different clinical manifestations). “SARS‐CoV‐2 negative” (SARS‐CoV‐2‐) was defined as (a) a negative RT‐PCR result in all nasopharyngeal swabs conducted or (b) RT‐PCR not performed (because all patients and medical staff would have been tested in case of symptoms according to applicable regulations). Biobank samples from Winter 2018/2019 were also categorized as negative. Comorbidities and risk factors, which will be used as covariables in subsequent phases of this study, will be extracted from electronic patient records and asked in the RedCap survey of medical staff, assuming that classifications have been made according to current guidelines.
2.8. Live SARS‐CoV‐2 neutralization assay
Serum samples were tested for the presence of neutralizing antibodies determined by the inhibition of virus‐induced cytopathic effect (CPE). Briefly, sera from 56 SARS‐CoV‐2‐positive individuals (inpatients and medical personnel) and 6 sera from SARS‐CoV‐2‐negative individuals (medical personnel) were incubated at 56°C for 30 minutes for complement inactivation, centrifuged at 13,000 rpm for 10 minutes, and diluted 1:8 in cell culture medium (MEM Eagle with EBSS, 20mM HEPES with 0.85 g/L NaHCO3, supplemented with 2% FCS, penicillin (100 U/mL), streptomycin (100 mg/mL), and L‐glutamine (2 mmol/L); all from Bioswisstec AG). Of the 1:8 serum dilutions, 112.5 µL was transferred into a 96‐well plate in duplicates. From there, 12.5 µL was used to produce a fivefold serial dilution in 50 µL culture medium; 50 µL was transferred to another row to control for serum toxicity on control cells. Then, serially diluted sera were mixed with 50 µL/well of diluted virus culture corresponding to 100 TCID50 of infectious SARS‐CoV‐2 (BetaCoV/France/IDF0372/2020). The serum/virus mixture was incubated for 1 hour at 37°C and subsequently transferred to a confluent 96‐well plate with Vero‐E6 cells. Plates were incubated for 3 days at 37°C with CO2 bags, and CPE was determined by crystal violet staining. Wells which showed no CPE as judged by a complete cell layer were rated (‐), and wells showing signs of CPE were rated (+). Full neutralization titer was determined as the serum dilution was no signs of CPE (‐) was observed in both duplicates. The strain BetaCoV/France/IDF0372/2020 was supplied by the National Reference Centre for Respiratory Viruses hosted by Institut Pasteur (Paris, France) and headed by Pr Sylvie van der Werf. The human sample from which strain BetaCoV/France/IDF0372/2020 was isolated has been provided by Dr X. Lescure and Pr Y. Yazdanpanah from the Bichat Hospital, Paris, France. Moreover, the strain BetaCoV/France/IDF0372/2020 was supplied through the European Virus Archive goes Global (Evag) platform, a project that has received funding from the European Union's Horizon 2020 research and innovation program under grant agreement No 653316.
2.9. Statistical analysis
Descriptive statistics have been used to illustrate the distribution of immunoassay test results in patients and medical staff with and without SARS‐CoV‐2 infection and to show temporal patterns. Days until seroconversion were plotted following the occurrence of symptoms or a positive RT‐PCR result, respectively. To calculate measures of diagnostic accuracy, we pooled all patients and medical personnel being aware that the composition of this cohort is artificial. The time point since RT‐PCR or symptoms, respectively, was not taken into account because criteria for a clear cutoff are lacking. Two‐by‐two tables were generated, sensitivities and specificities calculated, and receiver operating characteristics (ROC) curves plotted and c‐statistics performed for comparative purposes. A formal power analysis has not been performed, but we have included as many inpatients and medical staff as possible for the purpose of this preliminary analysis and generated confidence intervals as appropriate. Analyses were carried out using the Stata 14.2 statistical software (StataCorp. 2014. Stata statistical software: Release 14: StataCorp LP). Figures were created using Prism 6 (GraphPad Software, Inc).
3. RESULTS
3.1. Characteristics of participants
At University Hospital Bern, we first established a carefully designed mixed‐method diagnostic accuracy study (Figure 1). Forty‐two inpatients with confirmed SARS‐CoV‐2 infection as defined by a positive RT‐PCR (nasopharyngeal swab) with more than 4 days of residual material were available, and 202 data points have been analyzed. Median age was 66 years (range 24 to 86), 21% of the patients were female. The median number of days of symptoms before hospitalization was 7 (range 0 to 18); 48% of the patients were admitted to the intensive care unit. More detailed patient characteristics are reported in Table S1. We additionally included the first 1403 individuals who participated in the cohort of medical staff for the purpose of this analysis. Out of these individuals, 70 were positive for SARS‐CoV‐2 in RT‐PCR, and 75% of SARS‐CoV‐2‐positive individuals (n = 53) reported COVID‐19‐associated symptoms (fever, breathlessness, coughing, or loss of smell). The median age was 39 (range 23, 65), 60.7% of the individuals were women (n = 851). Further, we included residual serum samples of patients stored at the Liquid Biobank Bern (n = 32). These samples were frozen between December 2018 and February 2019 before the global outbreak of SARS‐CoV‐2 infections.
Figure 1.
Flowchart of study cohort and study design. Only RT‐PCR‐positive inpatients were considered in the current phase of the study (*). Consecutive patients admitted with confirmed SARS‐CoV‐2 infection were prospectively followed alongside medical staff and biobank samples from winter 2018/2019 (pooled data were used for calculation of diagnostic accuracy). RT‐PCR, real‐time PCR; ELISA, enzyme‐linked immunosorbent assay; LFI, lateral flow immunoassay
3.2. Analytical characteristics of in‐house ELISA (RBD)
Recombinantly expressed RBD has been used to establish an in‐house ELISA for the detection of IgM and IgG anti‐SARS‐CoV‐2 antibodies in human serum samples (Figure S1A,B). Optimal serum dilutions were determined by titration of sera derived from six SARS‐CoV‐2 + and six SARS‐CoV‐2‐ individuals. The serum dilution of 1:100 allowed efficient discrimination between positive and negative outcome (Figure S2). After automatization on a DYNEX DSX device, the intra‐assay (within‐run) and inter‐assay (day‐to‐day) precisions of the in‐house RBD ELISA were assessed (Figure S3A‐D, Table S2a,b and Table S3a,b). We further compared serum and heparin plasma (Figure S3E,F). Overall, the in‐house RBD ELISA assay showed high intra‐ and inter‐assay reproducibility and demonstrated a high degree of agreement between plasma and serum samples.
3.3. Temporal pattern of antibody response as measured by different immunoassays
Among a subgroup of 25 SARS‐CoV‐2 + inpatients, seroconversion for IgM and IgG antibodies was observed between day 0 and day 21 after the RT‐PCR result and between day 2 and day 21 after the start of symptoms (Figure 2). Interestingly, IgM and IgG antibody responses against RBD and S1 were substantially more pronounced as compared to N. Assessment of the longitudinal dynamics of patient sera revealed a marked and consistent increase of IgG antibodies for RBD and S1 (Figure 3A). IgM antibodies were measured in the RBD and N ELISA and detectable at least for two weeks after seroconversion (Figure 3B). Interestingly, the individual temporal IgG and IgM patterns showed a high degree of inter‐individual variability with one group of patients displaying high antibody responses already at the time of hospitalization, while a second group seroconverted within the first week of hospitalization and a third group that mounted only a week response within the time of analysis (Figure 4 and Figure S5). Additionally, we analyzed serum samples from 32 inpatients between December 2018 and February 2019 (biobank samples from winter 2018/2019). Of these samples, all were negative for anti‐RBD IgM and IgG, as well as anti‐S1 IgG. However, two biobank samples tested positive for anti‐N IgG (ELISA; 6.2%), and one tested positive for anti‐N IgM (ELISA; 3%). All samples were negative for anti‐S IgG and IgM (100%) as tested by LFI.
Figure 2.
Seroconversion rate since symptoms and positive RT‐PCR result. The percentage of consecutive patients (n = 25) positively tested for anti‐SARS‐CoV‐2 protein antibodies is shown as a function of time (since symptom onset: red; since positive RT‐PCR result: blue line) for IgG in the RBD (A), IgG in the S1 (B), IgG in the N (C), IgM in the RBD (D), and IgM in the N ELISA (E). Curves were calculated using nonlinear fitting
Figure 3.
Temporal pattern of antibody responses against SARS‐CoV‐2 since seroconversion. IgG and IgM antibody responses of consecutive patients (n = 25) as measured by three ELISAs targeting different proteins of SARS‐CoV‐2: (A) IgG against the receptor‐binding domain (RBD), the S1 domain of the spike protein (S1), and the nucleoprotein (N); (B) IgM against the receptor‐binding domain (RBD) and the nucleoprotein (N). Data are shown as mean ± SEM. Curves were calculated using nonlinear fitting
Figure 4.
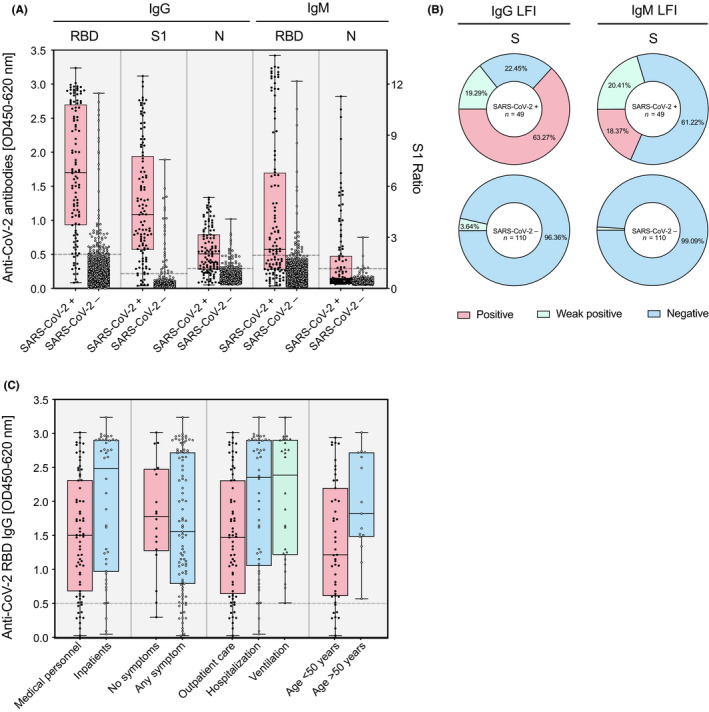
Distribution of immunoassay results among SARS‐CoV‐2‐positive and negative individuals. Consecutive patients admitted with confirmed SARS‐CoV‐2 infection were prospectively followed alongside medical staff and biobank samples from winter 2018/2019 (pooled data). (A) IgG and IgM responses against the receptor‐binding domain (RBD), the S1 domain of the spike protein (S1), and the nucleoprotein (N) of SARS‐CoV‐2 in SARS‐CoV‐2‐positive (n = 112) and negative (n = 1365) individuals as measured by ELISA. Data are shown as individual data points with a box and whiskers plot indicating minimum to maximum response. (B) IgG and IgM responses against the S1 domain of the spike protein of SARS‐CoV‐2 as measured by LFI in RT‐PCR‐positive and negative patients. Positive (red), weak positive (green), and negative (blue) responses are shown as percentage of the whole in a pie chart. (C) Antibody response in salient subgroups of RT‐PCR‐positive individuals (inpatients vs. medical personnel, patients with symptoms vs. patients without, hospitalized patients vs. outpatients, patients with ventilation vs. patients without, patients above 50 years vs. patients below 50 years of age)
3.4. Diagnostic accuracy
The pooled study population consisted of 1477 individuals, 112 of whom tested as RT‐PCR positive (prevalence 7.6%). Sera from all individuals were tested in the three different ELISA setups for IgG and IgM anti‐SARS‐CoV‐2 antibodies (Figure 4A). A subgroup of samples (n = 159) was additionally assessed on LFI (Figure 4B). Both assay formats showed high specificity above 94% for IgG and IgM measurements (Table S4). However, the sensitivity between assays and formats varied considerably. The highest sensitivities were reached for IgG measurements with the S1 (89.3%) and RBD (88.4%) ELISA, followed by IgG measurements on N (72.9%) ELISA. Sensitivities for IgM measurements were all considerably lower for both ELISA and LFI formats, which could be due to the more transient detectability of IgM upon infection.
To detect potential sources of variability, we additionally studied the antibody response in salient subgroups of RT‐PCR‐positive individuals (Figure 4C). First, higher IgG antibodies were found in inpatients compared to medical personnel, potentially reflecting the higher proportion of patients with severe disease (RBD ELISA; mean OD difference 0.44; SD 0.19; P = .01). Second, no significant difference was found between individuals with and without COVID‐19 symptoms (mean OD difference 0.11; SD 0.24; P = .64). Third, the IgG response was higher in hospitalized patients compared to outpatients (0.50; SD 0.18; P = .005), but not in ventilated patients compared to hospitalized patients (mean OD difference 0.08; SD 0.23; P = .72). Fourth, IgG response was higher in patients above 50 years than patients below (0.54; SD 0.25; P = .03).
In the tested inpatient population, we observed three “false‐negative” (negative in S1 ELISA despite positive RT‐PCR) outcomes. Among three false‐negative inpatients (P07, P041, and P042), two were measured at an early time point (Patient 7 and 41), and one patient (P042) might have experienced seroconversion at a very late time point because of a significant increase of antibody titers at day 24 (Figure S3 and Figure S4). In the assessed hospital staff, seven were classified as “false‐negative.” All of these reported mild diseases and had symptoms clearly associated with COVID‐19 (fever, breathlessness, cough, and loss of taste or smell). Twenty‐two individuals in the hospital staff group tested “false‐positive” (positive S1 ELISA results despite negative RT‐PCR). Fourteen of them experienced one or more symptoms clearly associated with COVID‐19. The remaining eight individuals were clearly positive in at least three assays. All other individuals were either classified as “true‐positive” (positive in S1 ELISA, and positive in RT‐PCR), or as “true‐negative” (negative in S1 ELISA, and negative in RT‐PCR).
In terms of performance, the calculated area under the receiver operating characteristic (ROC) curve for IgG measurements was 0.96 (95% CI: 0.94 to 0.98) in the RBD, 0.98 (95% CI: 0.97 to 0.99) in the S1, and 0.91 in the N (95% CI: 0.86 to 0.95) ELISA (Figure 5A), while for IgM measurements it reached 0.86 (95% CI: 0.81 to 0.90) for RBD ELISA and 0.84 (95% CI: 0.80 to 0.89) for N ELISA (Figure 5B).
Figure 5.
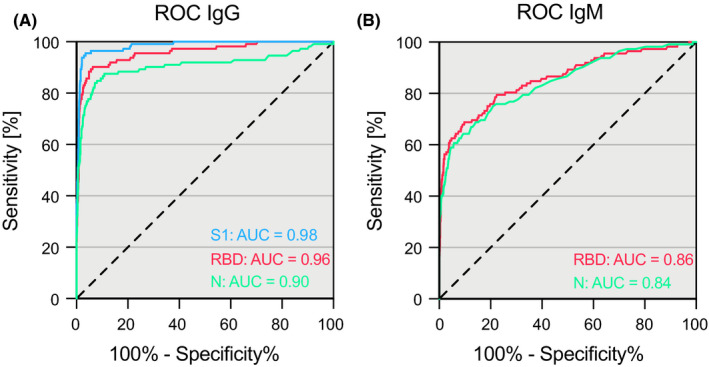
Accuracy of three different SARS‐CoV‐2 ELISAs. Receiver operating characteristics curves of IgG (A) and IgM (B) measurements against the receptor‐binding domain (RBD), the S1 domain of the spike protein (S1), and the nucleoprotein (N) of SARS‐CoV‐2 in SARS‐CoV‐2‐positive (n = 112) and negative (n = 1365) individuals
3.5. SARS‐CoV‐2 neutralization corresponds with ELISA positivity
A total of 54 randomly selected sera from individuals who were tested positive in either of the three ELISA immunoassays and 6 negative controls were assessed in a live SARS‐CoV‐2 neutralization assay using ACE2‐expressing Vero‐E6 cells (34 inpatient samples and 26 samples of medical personnel). Full neutralization of viral infection has been determined based on 100% inhibition of the cytopathic effect in a serial dilution of the sera (Figure S6). The means of highest serum dilutions at which full neutralization was observed correlated remarkably well with the measured antibody responses in the ELISA immunoassays (Figure 6A‐C). Importantly, 96.3% of the sera from ELISA‐positive individuals showed full inhibition at serum dilutions ≥ 1:16. The two sera that did not show neutralization (P037 and P042) were drawn at an early time point where the patients did not yet show antiviral antibodies. Both patients, however, fully neutralized the virus after seroconversion at a later time point (Figure 6D). Further, all 6 sera from ELISA negative individuals showed no neutralizing activity. Of note, one or two ELISA assays were negative in 17 samples with full neutralization.
Figure 6.
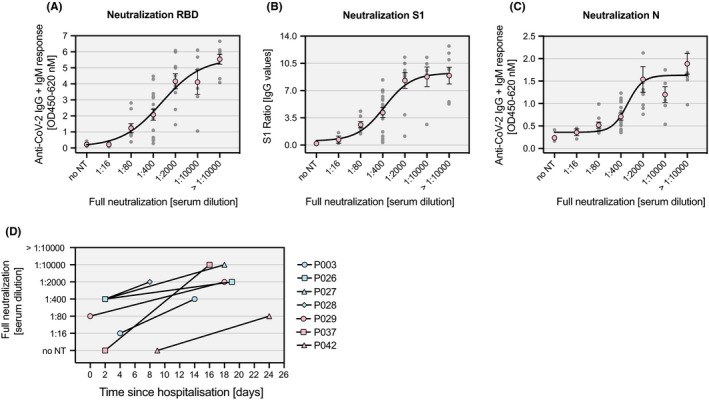
Live SARS‐CoV‐2 neutralization. Individual antibody responses (gray dots) against RBD (A), S1 (B) and N protein (C) in sera of 54 SARS‐CoV‐2‐positive and 6 SARS‐CoV‐2‐negative individuals as measured by ELISA are shown together with the corresponding serum dilution at which full neutralization of SARS‐CoV‐2 is observed. Nonlinear curve fitting was calculated based on the means of each serum dilution group (red circles). (D) Changes in the serum dilution for full neutralization of SARS‐CoV‐2 over time are depicted for seven individual SARS‐CoV‐2 patients. no NT: no neutralization detectable
4. DISCUSSION
We report first results of a large, mixed‐design evaluation study which was implemented to compare the diagnostic accuracy of serological immunoassays for SARS‐CoV‐2 antibodies. While the time to seroconversion varied substantially between infected individuals, the mounted IgG responses were robust and stable over time in all assays relying on RBD, S1, and N. With regard to the ELISA assays, the overall diagnostic accuracy was adequate with a high specificity. Some “false‐positive” results are likely due to a rather narrow diagnostic window and limited sensitivity of the RT‐PCR and asymptomatic disease course. 36 “False‐negative” results may be caused by a long seroconversion period observed in some patients and mild disease course in other individuals. The accuracy measures of LFI and N were inferior compared to ELISA targeting S1 and RBD. Strikingly, there is a high degree of correlation between antibody responses to these viral surface proteins and the neutralizing activity against live SARS‐CoV‐2.
A few other studies have previously assessed the diagnostic accuracy of serological immunoassays. Recently, Long and colleagues studied the antibody response in 285 patients with COVID‐19 using a magnetic chemiluminescent immunoassay. 37 In accordance with their results, we observed high inter‐individual variation in the time to seroconversion. In contrast to their study, we confirmed these findings with an appropriate diagnostic accuracy protocol using different serological immunoassays. In another case‐control study, Infantino et al analyzed 61 COVID‐19 inpatient samples and 64 selected patients collected before 2020 using a magnetic chemiluminescent immunoassay. 38 In agreement with their results, we found limited sensitivity but high specificity of the serological SARS‐CoV‐2 immunoassays. In further study conducted at the Geneva University Hospital, 181 samples of COVID‐19 patients were included and 176 controls collected before 2020 and analyzed with the same S1 ELISA that we used in our study. Similar to our results they report a high specificity for IgG, particularly with an adjusted cutoff value. 39 In line with other studies, the accuracy and performance LFIs were rather weak. 40 , 41
The study presented here adds important value to previous reports as it (a) was designed as a comprehensive diagnostic accuracy study combining different research methods, (b) directly compares major assay approaches, (c) was fully approved by all appropriate authorities, (d) was independently conducted at a University Hospital, (e) includes comprehensive neutralization experiments with live virus, and (f) fully describes all clinical and technical procedures. Additionally, the study design allows straight forward expansion to automated immunoassay testing. On the other hand, a potential shortcoming of this study is the limited number of tested individuals. Besides, the observation period was limited to approximately one month, making it impossible to conclude beyond this time point.
Our findings emphasize that serological immunoassays are an important diagnostic tool in the context of the current COVID‐19 pandemic. While positive ELISA test results correctly identified SARS‐CoV‐2 infected individuals with high probability in our study, the results also revealed that not all cases could be captured. This confirms other studies reporting that many asymptomatic and mild cases of SARS‐CoV‐2 infections do not lead to a detectable seroconversion. 42 , 43 In this study, we further confirm that a general time point of seroconversion cannot be predicted. However, longitudinal tracing of patients reveals individual seroconversion. So far, the extent of cross‐reactivity to other pathogens appears low, but this must as well be addressed in larger patient populations.
Moreover, our results from the live SARS‐CoV‐2 neutralization assays strongly indicate the presence of protective antibodies in 96.3% of tested sera within the one‐month follow‐up period assessed in this study. Previous work in nonhuman primates has reported that serum dilutions of 1:16 were protective for re‐infection with SARS‐CoV‐2. 44 Our findings are in line with previous reports describing a close correlation of antibody responses against RBD, S1, and N protein of SARS‐CoV‐2 with full neutralizing activity and indicate that such serological tests might even be used to predict protective immunity in near future. 45 , 46 To draw further conclusions, however, SARS‐CoV‐2‐positive patients have to be followed over an extended time period in future studies.
In line with previous studies, 47 we observed that the antibody response is more pronounced in patients with severe disease than patients without (Figure 4, panel C; inpatients, hospitalized patients, older patients). However, the response was similar in patients with mechanical ventilation and hospitalized patients. This is most likely due to limitations in sensitivity, which does not contradict our general observations.
In summary, we report the first results of a large, mixed‐design evaluation study that has been conducted in an independent academic setting at the University Hospital Bern to assess the diagnostic accuracy of various immunoassays to determine antibody responses against SARS‐CoV‐2. While antibody responses of individual COVID‐19 patients against RBD and S1 protein were similar, a weaker reactivity against N protein became apparent. The time to seroconversion varied substantially between COVID‐19 patients but the IgG response was robust and stable in all three ELISA setups. Their overall diagnostic accuracy was adequate with a high specificity but limited sensitivity. The antibody responses measured in these ELISAs correlated remarkably well with SARS‐CoV‐2 neutralizing activity of the sera. On the other hand, accuracy measures of S protein‐based LFIs were poor. Together, our results emphasize that appropriate serological immunoassays represent a valuable tool to identify a good portion of patients with previous SARS‐CoV‐2 infection, will help to facilitate exit strategies from lockdown and might even be used to predict immunity to SARS‐CoV‐2 in near future.
CONFLICT OF INTEREST
All authors declare that there is no conflict of interests.
AUTHOR CONTRIBUTION
DB, LFP, AP, PK, TSJ, and AE expressed and analyzed recombinant proteins; DB, MPH, AE, and MN developed and validated the RBD immunoassay. PB and HPS developed and implemented the RT‐PCR. DS, BW, and OE performed virus neutralization assays. MN developed the study design, the protocol, and the analysis plan. TF and CL developed the biobanking solutions. VP, LD, PI, CH, MF, and JM contributed to study design and interpretation. PMV, MF, MFB, and SLB provided infrastructure and intellectual reviewed the manuscript. MPH, AE, and MN analyzed the data and wrote the manuscript.
Supporting information
Figure S1‐S6
Table S1‐S4
ACKNOWLEDGEMENTS
The DNA plasmid encoding the SARS‐CoV‐2 receptor‐binding domain of the spike protein was kindly provided by Prof. Florian Krammer. Development of SARS‐CoV‐2 reagents was partially supported by the NIAID Centers of Excellence for Influenza Research and Surveillance (CEIRS) contract HHSN272201400008C. MN is supported by a research grant of the Swiss National Science Foundation (#179334). AE received grant support from the Research Fund of the Swiss Lung Association, Bern and the Uniscientia foundation. We thank Daniela Sturny, Barbara Pula, Juliette Schlatter, Raphael Bratschi, and Vincent Benites, Karin Volken, Dominique Rowedder, Karin Balmer, and Michelle Rickli for the great support.
Brigger D, Horn MP, Pennington LF, et al. Accuracy of serological testing for SARS‐CoV‐2 antibodies: First results of a large mixed‐method evaluation study. Allergy.2021;76:853–865. 10.1111/all.14608
Daniel Brigger and Michael P. Horn contributed equally.
Alexander Eggel and Michael Nagler jointly supervised this work.
Contributor Information
Alexander Eggel, Email: Alexander.eggel@insel.ch.
Michael Nagler, Email: michael.nagler@insel.ch.
REFERENCES
- 1. Krammer F, Simon V. Serology assays to manage COVID‐19. Science. 2020;368(6495):1060‐1061. [DOI] [PubMed] [Google Scholar]
- 2. Tang YW, Schmitz JE, Persing DH, Stratton CW. The Laboratory Diagnosis of COVID‐19 Infection: Current Issues and Challenges. J Clin Microbiol. 2020.58(6):e00512–20. [DOI] [PMC free article] [PubMed] [Google Scholar]
- 3. Winter AK, Hegde ST. The important role of serology for COVID‐19 control. Lancet Infect Dis. 2020;20(7):758‐759. [DOI] [PMC free article] [PubMed] [Google Scholar]
- 4. Yong SEF, Anderson DE, Wei WE, et al. Connecting clusters of COVID‐19: an epidemiological and serological investigation. Lancet Infect Dis. 2020;20(7):809‐815. [DOI] [PMC free article] [PubMed] [Google Scholar]
- 5. Pung R, Chiew CJ, Young BE, et al. Investigation of three clusters of COVID‐19 in Singapore: implications for surveillance and response measures. Lancet. 2020;395(10229):1039‐1046. [DOI] [PMC free article] [PubMed] [Google Scholar]
- 6. Peto J, Alwan NA, Godfrey KM, et al. Universal weekly testing as the UK COVID‐19 lockdown exit strategy. Lancet. 2020;395(10234):1420‐1421. [DOI] [PMC free article] [PubMed] [Google Scholar]
- 7. Sokolowska M, Lukasik Z, Agache I, et al. Immunology of COVID‐19: mechanisms, clinical outcome, diagnostics and perspectives – a report of the European Academy of Allergy and Clinical Immunology (EAACI). Allergy. 2020; 10.1111/all.14462. [DOI] [PMC free article] [PubMed] [Google Scholar]
- 8. Radzikowska U, Ding M, Tan G, et al. Distribution of ACE2, CD147, CD26, and other SARS‐CoV‐2 associated molecules in tissues and immune cells in health and in asthma, COPD, obesity, hypertension, and COVID‐19 risk factors. Allergy. 2020;75:2828–2844. [DOI] [PMC free article] [PubMed] [Google Scholar]
- 9. Novak N, Peng W, Naegeli MC, et al. SARS‐CoV‐2, COVID‐19, skin and immunology – What do we know so far?. Allergy. 2021;76:698–713. [DOI] [PMC free article] [PubMed] [Google Scholar]
- 10. Zhang J, Dong, Cao Y‐y, et al. Clinical characteristics of 140 patients infected with SARS‐CoV‐2 in Wuhan, China. Allergy. 2020;75 (7):1730–1741. 10.1111/all.14238. [DOI] [PubMed] [Google Scholar]
- 11. Gursel M, Gursel I. Is global BCG vaccination‐induced trained immunity relevant to the progression of SARS‐CoV‐2 pandemic? Allergy. 2020;75(7):1815‐1819. [DOI] [PMC free article] [PubMed] [Google Scholar]
- 12. Azkur AK, Akdis M, Azkur D, et al. Immune response to SARS‐CoV‐2 and mechanisms of immunopathological changes in COVID‐19. Allergy. 2020;75(7):1564‐1581. [DOI] [PMC free article] [PubMed] [Google Scholar]
- 13. Riggioni C, Comberiati P, Giovannini M, et al. A compendium answering 150 questions on COVID‐19 and SARS‐CoV‐2. Allergy. 2020;75:2503–2541. 10.1111/all.14449. [DOI] [PMC free article] [PubMed] [Google Scholar]
- 14. Du H, Dong X, Zhang J‐j, et al. Clinical characteristics of 182 pediatric COVID‐19 patients with different severities and allergic status. Allergy. 2021;76:510–532. 10.1111/all.14452. [DOI] [PMC free article] [PubMed] [Google Scholar]
- 15. Guéant J‐L, Fromonot J, Guéant‐Rodriguez R, et al. Blood myeloperoxidase‐DNA, a biomarker of early response to SARS‐CoV‐2 infection?. Allergy. 2020; 10.1111/all.14533. [DOI] [PMC free article] [PubMed] [Google Scholar]
- 16. Liu L, Liu W, Zheng Y, et al. A preliminary study on serological assay for severe acute respiratory syndrome coronavirus 2 (SARS‐CoV‐2) in 238 admitted hospital patients. Microbes and Infection. 2020;22 (4‐5):206–211. 10.1016/j.micinf.2020.05.008. [DOI] [PMC free article] [PubMed] [Google Scholar]
- 17. Long Q‐X, Deng H‐J, Chen J, et al. Antibody responses to SARS‐CoV‐2 in COVID‐19 patients: the perspective application of serological tests in clinical practice. medRxiv. 2020:2020.2003.2018.20038018.
- 18. Liu W, Liu L, Kou G, et al. Evaluation of Nucleocapsid and Spike Protein‐based ELISAs for detecting antibodies against SARS‐CoV‐2. J Clin Microbiol. 2020, 58(6):e00461‐20 [DOI] [PMC free article] [PubMed] [Google Scholar]
- 19. McBride R, van Zyl M, Fielding B. The Coronavirus Nucleocapsid Is a Multifunctional Protein. Viruses. 2014;6(8):2991‐3018. [DOI] [PMC free article] [PubMed] [Google Scholar]
- 20. Bosch BJ, van der Zee R, de Haan CAM, Rottier PJM. The Coronavirus Spike Protein Is a Class I Virus Fusion Protein: Structural and Functional Characterization of the Fusion Core Complex. Journal of Virology. 2003;77(16):8801‐8811. [DOI] [PMC free article] [PubMed] [Google Scholar]
- 21. Hoffmann M, Kleine‐Weber H, Schroeder S, et al. SARS‐CoV‐2 Cell Entry Depends on ACE2 and TMPRSS2 and Is Blocked by a Clinically Proven Protease Inhibitor. Cell. 2020;181(2):271‐280.e278. [DOI] [PMC free article] [PubMed] [Google Scholar]
- 22. Pavel AB, Wu J, Renert‐Yuval Y, et al. SARS‐CoV‐2 receptor ACE2 protein expression in serum is significantly associated with age. Allergy. 2020; 10.1111/all.14522. [DOI] [PMC free article] [PubMed] [Google Scholar]
- 23. Jiang S, Hillyer C, Du L. Neutralizing Antibodies against SARS‐CoV‐2 and Other Human Coronaviruses. Trends Immunol. 2020. 41(5):355‐359 [DOI] [PMC free article] [PubMed] [Google Scholar]
- 24. Tai W, He L, Zhang X, et al. Characterization of the receptor‐binding domain (RBD) of 2019 novel coronavirus: implication for development of RBD protein as a viral attachment inhibitor and vaccine. Cell Mol Immunol. 2020;7:1‐8. [DOI] [PMC free article] [PubMed] [Google Scholar]
- 25. Gao Q, Bao L, Mao H, et al. Development of an inactivated vaccine candidate for SARS‐CoV‐2. Science. 2020;369 (6499):77–81. 10.1126/science.abc1932. [DOI] [PMC free article] [PubMed] [Google Scholar]
- 26. Sajid M, Kawde A‐N, Daud M. Designs, formats and applications of lateral flow assay: A literature review. J Saudi Chem Soc. 2015;19(6):689‐705. [Google Scholar]
- 27. Escribese MM, Nistal‐Villan E, Fernandez P, et al. Cross‐sectional pilot study exploring the feasibility of a rapid SARS‐CoV‐2 immunization test in health and nonhealthcare workers. Allergy. 2020; 10.1111/all.14545. [DOI] [PMC free article] [PubMed] [Google Scholar]
- 28. Amanat F, Stadlbauer D, Strohmeier S, et al. A serological assay to detect SARS‐CoV‐2 seroconversion in humans. medRxiv. 2020:2020.2003.2017.20037713. [DOI] [PMC free article] [PubMed]
- 29. Stadlbauer D, Amanat F, Chromikova V, et al. SARS‐CoV‐2 Seroconversion in Humans: A Detailed Protocol for a Serological Assay, Antigen Production, and Test Setup. Curr Protoc Microbiol. 2020;57(1):A.3A.1. [DOI] [PMC free article] [PubMed] [Google Scholar]
- 30. Adams ER, Anand R, Andersson MI, et al. Evaluation of antibody testing for SARS‐Cov‐2 using ELISA and lateral flow immunoassays. medRxiv. 2020:2020.2004.2015.20066407.
- 31. Bossuyt PM. Studies for Evaluating Diagnostic and Prognostic Accuracy. In: Price CP, Christenson RH, editors. Evidence‐based laboratory medicine. Washington DC: AACC Press; 2007: pp 67‐81. [Google Scholar]
- 32. Bossuyt PM, Cohen JF, Gatsonis CA, Korevaar DA, group S . STARD 2015: updated reporting guidelines for all diagnostic accuracy studies. Ann Transl Med. 2016;4(4):85. [DOI] [PMC free article] [PubMed] [Google Scholar]
- 33. Wolfensberger N, Georgiou G, Giabbani E, et al. Rapid Centrifugation in the Routine Hemostasis Laboratory. Thromb Haemost. 2019;119(12):2025‐2033. [DOI] [PubMed] [Google Scholar]
- 34. Karamloo F, Konig R. SARS‐CoV‐2 immunogenicity at the crossroads. Allergy. 2020;75(7):1822‐1824. [DOI] [PMC free article] [PubMed] [Google Scholar]
- 35. Corman VM, Landt O, Kaiser M, et al. Detection of 2019 novel coronavirus (2019‐nCoV) by real‐time RT‐PCR. Euro Surveill. 2020;25:3. [DOI] [PMC free article] [PubMed] [Google Scholar]
- 36. Zhang J‐J, Cao Y‐Y, Dong X, et al. Distinct characteristics of COVID‐19 patients with initial rRT‐PCR‐positive and rRT‐PCR‐negative results for SARS‐CoV‐2. Allergy. 2020;75(7):1809‐1812. [DOI] [PMC free article] [PubMed] [Google Scholar]
- 37. Long QX, Liu BZ, Deng HJ, et al. Antibody responses to SARS‐CoV‐2 in patients with COVID‐19. Nat Med. 2020. 26(6):845‐848 [DOI] [PubMed] [Google Scholar]
- 38. Infantino M, Grossi V, Lari B, et al. Diagnostic accuracy of an automated chemiluminescent immunoassay for anti‐SARS‐CoV‐2 IgM and IgG antibodies: an Italian experience. J Med. Virol. 2020;92(9):1671‐1675. [DOI] [PMC free article] [PubMed] [Google Scholar]
- 39. Meyer B, Torriani G, Yerly S, et al. Validation of a commercially available SARS‐CoV‐2 serological immunoassay. Clinical Microbiology and Infection. 2020; 26 (10):1386–1394. 10.1016/j.cmi.2020.06.024. [DOI] [PMC free article] [PubMed] [Google Scholar]
- 40. Döhla M, Boesecke C, Schulte B, et al. Rapid point‐of‐care testing for SARS‐CoV‐2 in a community screening setting shows low sensitivity. Public Health. 2020;182:170‐172. [DOI] [PMC free article] [PubMed] [Google Scholar]
- 41. Whitman JD, Hiatt J, Mowery CT, et al. Evaluation of SARS‐CoV‐2 serology assays reveals a range of test performance. Nat Biotechnol. 2020. 38(10):1174‐1183 [DOI] [PMC free article] [PubMed] [Google Scholar]
- 42. Grzelak L, Temmam S, Planchais C, et al. A comparison of four serological assays for detecting anti‐SARS‐CoV‐2 antibodies in human serum samples from different populations. Sci Transl Med. 2020. 12 (559):eabc3103. [DOI] [PMC free article] [PubMed] [Google Scholar]
- 43. Shields AM, Faustini SE, Perez‐Toledo M, et al. SARS‐CoV‐2 seroconversion in health care workers. medRxiv. 2020:2020.2005.2018.20105197.
- 44. Bao L, Deng W, Gao H, et al. Lack of Reinfection in Rhesus Macaques Infected with SARS‐CoV‐2. bioRxiv. 2020.
- 45. Haveri A, Smura T, Kuivanen S, et al. Serological and molecular findings during SARS‐CoV‐2 infection: the first case study in Finland, January to February 2020. Euro Surveill. 2020;25:11. [DOI] [PMC free article] [PubMed] [Google Scholar]
- 46. Okba NMA, Müller MA, Li W, et al. Severe Acute Respiratory Syndrome Coronavirus 2‐Specific Antibody Responses in Coronavirus Disease Patients. Emerg Infect Dis. 2020;26(7):1478‐1488. [DOI] [PMC free article] [PubMed] [Google Scholar]
- 47. Choe PG, Kang CK, Suh HJ, et al. Antibody Responses to SARS‐CoV‐2 at 8 Weeks Postinfection in Asymptomatic Patients. Emerg Infect Dis. 2020;26:10. [DOI] [PMC free article] [PubMed] [Google Scholar]
Associated Data
This section collects any data citations, data availability statements, or supplementary materials included in this article.
Supplementary Materials
Figure S1‐S6
Table S1‐S4