

Abstract
Coronavirus disease‐2019 (COVID‐19) caused by severe acute respiratory syndrome coronavirus (SARS‐CoV‐2) has rapidly spread worldwide, threatening the health and lives of many people. Unfortunately, information regarding the immunological characteristics of COVID‐19 patients remains limited. Herein, we collected blood samples from 18 healthy donors (HDs) and 38 COVID‐19 patients to analyse changes in the adaptive immune cell populations and their phenotypes. We observed that the lymphocyte percentage moderately decreased, CD4 and CD8 T cell percentage among lymphocytes were similar, and B cell percentage was increased in COVID‐19 patients in comparison to that in HDs. T cells, especially CD8 T cells, showed an enhanced expression of late activation marker CD25 and exhaustion marker PD‐1. Importantly, SARS‐CoV‐2 infection increased the percentage of T follicular helper– and germinal centre B–like cells in the blood. The parameters in COVID‐19 patients remained unchanged across various age groups. Therefore, we demonstrated that the T and B cells are activated naturally and are functional during SARS‐CoV‐2 infection. These data provide evidence that the adaptive immunity in most patients could be primed to induce a significant immune response against SARS‐CoV‐2 infection upon receiving standard medical care.
Keywords: adaptive immunity, COVID‐19, lymphocyte, SARS‐CoV‐2
1. INTRODUCTION
A severe pneumonia‐associated respiratory syndrome began in Wuhan, China, in December 2019, which was subsequently declared as a public health emergency of international concern by WHO. The novel coronavirus strain was officially named severe acute respiratory syndrome coronavirus 2 (SARS‐CoV‐2). 1 , 2 Coronavirus infections, such as severe acute respiratory syndrome (SARS) and Middle East respiratory syndrome (MERS), can cause severe respiratory diseases. 3 , 4 SARS‐CoV‐2 is an enveloped positive‐strand RNA virus, which belongs to the same family as SARS‐CoV and MERS‐CoV based on genome similarity, Coronaviridae. 2 , 5 , 6 , 7
A number of studies have demonstrated that the adaptive immunity responds to coronavirus infections and is required for efficient clearance of the virus. In patients infected with SARS‐CoV, the acute phase of infection is associated with a severe reduction in T cell numbers in the blood, involving a dramatic loss of CD4 and CD8 T cells in comparison to healthy control individuals. 8 , 9 This suggests that SARS‐CoV infection impairs cellular immunity in the early stages of the disease. With the prolonged recovery time of SARS‐infected patients, expression of activated T cell markers, such as CD69 and CD25, decreases, 10 , 11 indicating that T cell activation in response to the virus is impaired. 12 With the improvement of the disease, the ratio of CD4 to CD8 T cells increases, indicating that CD4 T cells recover faster than CD8 T cells. 13 In addition, out of the 92% of cured SARS patients whose B cells initially declined and then increased or continued to increase during the course of the disease, only 8% had a constant or decreasing cell count. 14 Similar to SARS patients, leucopenia and lymphopenia are also observed in MERS patients, albeit to a lesser degree than that observed in SARS patients. A clinical study showed that 14% of MERS patients had leucopenia, while 34% of the patients had lymphopenia. 15 MERS‐CoV‐infected patients that exhibited distinctively high frequencies of MERS coronavirus–reactive CD8 T cells were associated with severe/moderate illness, whereas CD4 T cell response was minimally detected at this stage. In the convalescent phase, a moderate increase in CD4 T cells was detected. 15
Currently, very few studies have reported that COVID‐19 patients develop lymphopenia and exhibit an increase in pro‐inflammatory cytokines in severe condition. 16 , 17 , 18 The information on changes in immune cells and their functions in response to SARS‐CoV‐2 infection is still very limited. Based on the fact that T and B cells respond to infections and play critical roles in defending against virus infections, a systematic study on the changes in T and B cells in COVID‐19 patients will help uncover the immune response against SARS‐CoV‐2 infection and will also provide insights for COVID‐19 diagnosis and treatment.
A new study showed that people infected with betacoronaviruses including SARS‐CoV and MERS could establish T cell immunity to nucleocapsid protein (NP). 19 The analysis of blood samples of 14 COVID‐19 patients displayed a strong correlation between neutralization antibody titres and the numbers of virus‐specific T cells. 20 Wen et al reported that during the recovery stage of COVID‐19, plasma cells underwent a significant increase, whereas naïve B cells decreased remarkably. 21 Several studies reported that SARS‐CoV‐2 elicits a robust B cell response, as evidenced by the detection of virus‐specific IgM, IgA and neutralizing IgG antibodies (nAbs) in the days following infection. 20 , 22 Importantly, Zost and colleagues identified several human monoclonal antibodies (mAbs) targeting the spike (S) glycoprotein, which exhibited potent neutralizing activity and fully blocked the receptor‐binding domain of S (SRBD) from interacting with human ACE2 (hACE2). 23 In addition, two of the most potently ACE2 blocking mAbs have been proven to protect rhesus macaques from SARS‐CoV‐2 infection. 23 However, further studies will be required to identify, design and synthesize antibodies and drugs targeting SARS‐CoV‐2.
In this study, we analysed the blood samples from 18 healthy donors (HDs) and 38 patients and focused on the characterization of adaptive immune cell populations and their phenotypes upon SARS‐CoV‐2 infection. We showed that upon infection, lymphocyte percentage declined, CD4 and CD8 T cells percentage within the lymphocyte population remained unchanged, and B cell percentage was relatively increased. CD4 and CD8 T cells exhibited a mild and strong activation phenotype. Notably, the percentage of T follicular helper (Tfh)– and germinal centre B–like (GCB‐like) cells increased. Similar phenotypes among the patients in various age groups indicate that aged individuals are also capable of responding to SARS‐CoV‐2 infection. Our data support the notion that adaptive immunity could be normally activated, and it could defend against SARS‐CoV‐2 infection.
2. MATERIALS AND METHODS
2.1. Ethics statement
This study was approved by the Research Ethics Commission of the Eighth Hospital of Xi'an (20190730‐1346) with a waiver of informed consent due to a public health outbreak investigation. Information regarding all the cases was taken from the Eighth Hospital of Xi'an (Xi'an, Shaanxi Province), a designated hospital for the COVID‐19 by the local authorities.
2.2. Patients
From 18 February to 4 March 2020, 18 healthy controls and 38 confirmed COVID‐19 patients were included in the study. Patients were diagnosed and admitted in accordance with the guidelines of the national health commission of China. All the 38 patients were diagnosed with SARS‐CoV‐2 infection using the RT‐PCR test on throat swab specimens. The study included 23 male patients (60.53%) and 15 female patients (39.47%) with median age of the patients being 39.06 ± 4.26 years (Table 1).
TABLE 1.
Characteristic analysis of COVID‐19 patients and healthy donors
| Sample information | ||
|---|---|---|
| Gender | Age | |
| HD | 9/18, 50% | 39.06 ± 4.26 |
| Patients | 23/38, 60.53% | 45.08 ± 4.06 |
2.3. Flow cytometry analysis
The Abs used in the flow cytometry analysis were as follows: FITC anti‐human CD3 (UCHT1), FITC anti‐human TCR γ/δ (B1), APC/Cyanine7 anti‐human CD4 (OKT4), PerCP/Cyanine5.5 anti‐human CD8 (SK1), APC anti‐human CD19 (HIB19), APC anti‐human CD25 (BC96), PE anti‐human CD69 (FN50), PE anti‐human CD185 (CXCR5) (J252D4), PE anti‐human CD183 (CXCR3) (G025H7), APC anti‐human CD279 (PD‐1) (EH12.2H7), PE anti‐human CD95 (Fas) (DX2), PE anti‐human CD127 (A019D5), APC/Cyanine7 anti‐human CD45RA (HI100), PE/Cy5 anti‐human CD45RO (UCHL1), PE anti‐human CD95 (Fas) (DX2) and FITC antimouse/human GL7 Antigen (GL7). They were purchased from BioLegend. Blood cells were stained with Abs in the dark at room temperature for 15 minutes and analysed on a FACSCanto II flow cytometer (BD Biosciences). FlowJo 8 was used for data analysis.
2.4. Statistical analysis
The continuous variable of normal distribution is represented by mean ± standard deviation, the non‐normal distribution is represented by median [IQR], and the classified variable is represented by count (percentage). Student’s t test was performed for two group analysis using SPSS 22.0 software. * and ** stand for P<0.05 and P<0.01, respectively.
3. RESULTS
3.1. The percentage analysis of T and B cells in COVID‐19 patients
To determine the change in the composition of adaptive immune cells, we compared the percentage of T and B cells in the blood samples from HDs and COVID‐19 patients using flow cytometry. Lymphocyte percentage in the whole blood was not significantly different between HDs and COVID‐19 patients, though it exhibited a decreasing trend in the patients (Figure 1A). Within the lymphocyte population, the percentages of CD4+ and CD8+ T cells were comparable (Figure 1B and C), whereas B cell percentage was significantly increased (Figure 1D) in COVID‐19 patients.
FIGURE 1.
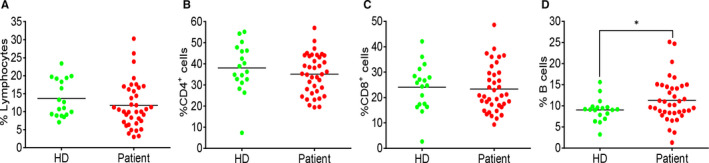
Percentage changes in T and B cells between HDs and COVID‐19 patients. (A) The percentage of lymphocytes in total blood cells. (B) The percentage of CD4+ T cells in lymphocyte population. (C) The percentage of CD8+ T cells in lymphocyte population. (D) The percentage of B cells in lymphocyte population. Each dot represents a single patient of COVID‐19 or healthy donor. *P<0.05 was considered statistically significant
3.2. An activated phenotype of T cells in COVID‐19 patients
To evaluate the T cell status in response to SARS‐CoV‐2 infection, we analysed the expression of CD69, CD25, PD‐1, CD45RA, CD45RO and CXCR3 in both CD4+ and CD8+ T cells. In CD4+ T cells of the COVID‐19 patients, the expression of CD69 and CD25 (Figure 2A and B) and the percentage of regulatory T cells, marked by CD3+CD4+CD25+CD127‐ (Figure 2F), were similar to that of HDs. CD25 expression was significantly up‐regulated in CD8+ T cell population of the patients (Figure 3B). The proportion of naive and effector/memory cells in both CD4+ T cells (Figure 2D and E) and CD8+ T cells (Figure 2E and F) of the two groups were not significantly different. PD‐1 expression was up‐regulated in both CD4+ (Figure 2C) and CD8+ T cells (Figure 3C) of the patients. The data demonstrated a weak activation of CD4+ T cells, but a strong activation of CD8+ T cells during SARS‐CoV‐2 infection.
FIGURE 2.
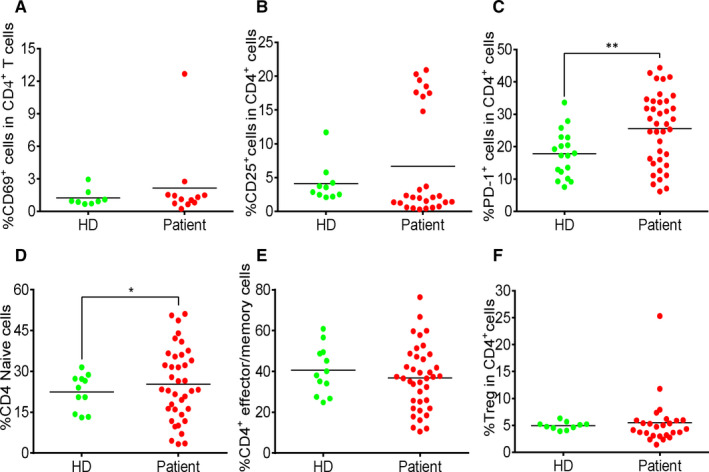
Moderate increase in activated CD4+ T cells in COVID‐19 patients. (A) The percentage of CD69+ cells in CD4+ T cells. (B) The percentage of CD25+ cells in CD4+ T cells. (C) The percentage of PD‐1+ cells in CD4+ T cells. (D) The percentage of CD45RA+CD45RO‐ cells in CD4+ T cells. (E) The percentage of CD45RA‐CD45RO+ cells in CD4+ T cells. (F) The percentage of regulatory T cells in CD4+ T cells. Each dot represents a single patient of COVID‐19 or healthy donor. *P<0.05 and **P<0.01 were considered statistically significant and extremely significant, respectively
FIGURE 3.
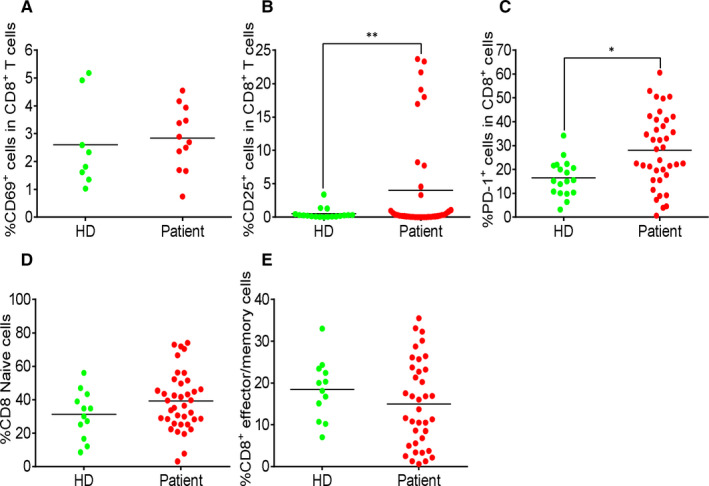
Strong increase in activated CD8+ T cells in COVID‐19 patients. (A) The percentage of CD69+ cells in CD8+ T cells. (B) The percentage of CD25+ cells in CD8+ T cells. (C) The percentage of PD‐1+ cells in CD8+ T cells. (D) The percentage of CD45RA+CD45RO‐ cells in CD8+ T cells. (E) The percentage of CD45RA‐CD45RO+ cells in CD8+ T cells. Each dot represents a single patient of COVID‐19 or healthy donor. *P<0.05 and **P<0.01 were considered statistically significant and extremely significant, respectively
3.3. An increase in germinal centre–like cells in COVID‐19 patients
T follicular helper (Tfh) cells help in activation of B cells and differentiation into effector cells, production of high‐affinity antibodies and formation of germinal centres. 24 To study whether COVID‐19 patients produced efficient adaptive immune response, we analysed the expression of PD‐1 and CXCR5 in CD4+ T cells and the expression of Fas and GL7 in B cells. As shown in Figure 4A and B, there was a significant increase in Tfh‐ and GCB‐like cells in the blood samples of the patients compared to that of the HD group.
FIGURE 4.
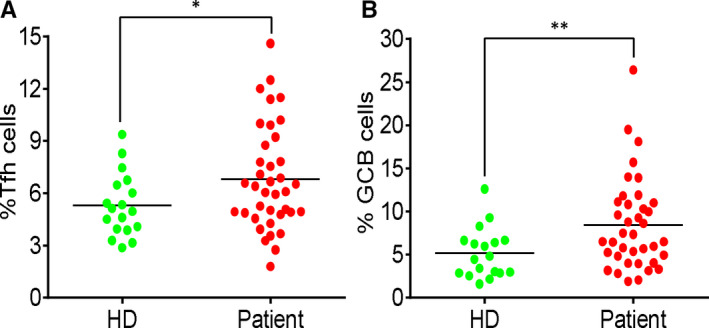
Increase of germinal centre–like cells in COVID‐19 patients. (A) The percentage of PD‐1+CXCR5+ cells in CD4+ T cells. (B) The percentage of Fas+GL7+ cells in B cells. Each dot represents a single patient of COVID‐19 or healthy donor. *P<0.05 and **P<0.01 were considered statistically significant and extremely significant, respectively
3.4. Correlation analysis between activation signature and patient age
To study whether age affects adaptive immune cell populations and effector features, we performed correlation analysis between T cell activation markers and age. No dramatic change was observed with increase in age of the patients (Figure 5). The results indicate that there was no defect in CD8+ T cell activation and Tfh‐ and GCB‐like cell differentiation in the aged individuals infected by SARS‐CoV‐2.
FIGURE 5.
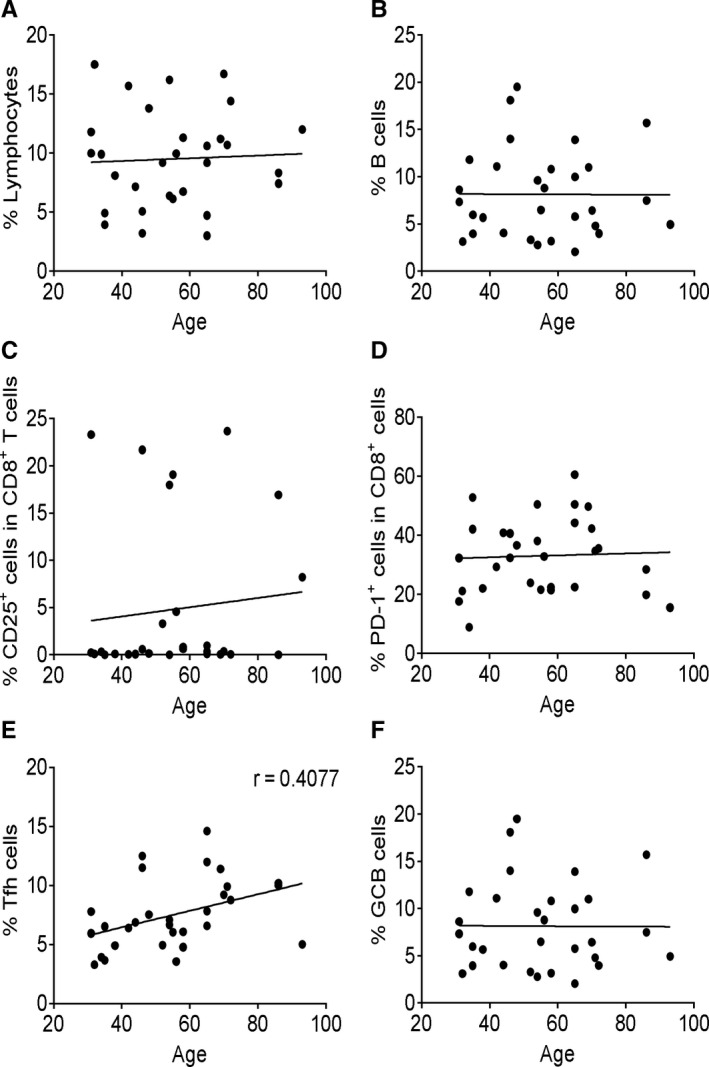
Correlation analysis between functional signature and patient age. The correlation analysis between patient age and immune parameters was performed using Pearson’s correlation coefficient. The percentage of total lymphocytes (A), B cells (B), CD8+CD25+ T cells (C), CD8+PD‐1+ T cells (D), Tfh‐like cells (E) and GCB‐like cells (F) was correlated with age in COVID‐19 patient group. Each dot represents a single patient of COVID‐19 or healthy donor. Patients under the age of 15 years were excluded
4. DISCUSSION
SARS‐CoV‐2 infection is spreading rapidly around the world. The patients present typical symptoms of pneumonia, such as dry cough, dyspnoea, fever and bilateral lung infiltrates on imaging. 25 Although post‐mortem study has revealed intensive inflammation in lungs of the patients, little is known about the immunological features in response to this new virus. In the present study, we have focused on characterizing adaptive immune cell populations and their phenotypes in COVID‐19 patients.
Generally, the phenotypical T and B cell subsets were found to be different with varying disease severity in COVID‐19 patients, which may be directly correlated with the viral load. Currently, the profile changes of T and B cell populations in patients suffering from COVID‐19 remain poorly established, especially in mild or moderate patients. In accordance with several previous reports, our results revealed that patients with mild or moderate symptoms were shown to have an apparent increase in follicular helper CD4 T cells (TFH) and germinal centre B (GCB) cells, while severe COVID‐19 patients displayed dysregulation of lymphocytes characterized by a profound depletion of CD4+ lymphocytes and subsequently B cell lymphopenia. 26 Also, Wen and colleagues utilized single‐cell RNA sequencing to demonstrate that both CD4+ and CD8+ T cells decreased remarkably, whereas the B cells underwent a significant increase during the recovery phase of COVID‐19. 21 Furthermore, Zhang et al developed an immune response phenotyping strategy based on neutrophil‐to‐lymphocyte ratio (NLR) and IgG level to stratify patients with varying disease severities and outcome, which would be helpful to guide treatment options in the clinic. 27 Collectively, these studies provide a first glimpse into the phenotypes of T and B cell subsets associated with COVID‐19. However, the relevant conclusions need to be interpreted with caution due to the limited number of patients enrolled in these studies. 28 Therefore, further investigation is needed to better determine the phenotype and function of T and B cell subsets in COVID‐19 patients.
Lymphopenia was observed in COVID patients in previous studies, 25 Epidemiological investigation of coronavirus infection showed that lymphopenia is present in more than 80% of the patients, and serious decline in lymphocytes is correlated with a poor prognosis. 29 However, we did not observe a significant decrease in lymphocyte populations in the COVID‐19 patients. This finding could be attributed to the fact that most of the patients in this study showed mild symptoms besides fever. Interestingly, following the division of patients into symptomatic and asymptomatic, we observed a decrease in lymphocytes in the symptomatic patients (data not shown). PD‐1 is a marker of exhausted T cells during chronic and acute infections. 30 , 31 A number of studies have shown that PD‐1+CD8+ T cells increase in the peripheral blood of patients with a variety of acute viral infections, such as HBV, HIV and Ebola virus. 32 , 33 In our study, the expression of PD‐1 was up‐regulated in both CD4+ and CD8+ T cells of COVID‐19 patients, which may explain the observed reduction in the lymphocyte population.
In response to viral infections, normally both CD4+ and CD8+ T cells become activated. In COVID‐19 patients, we observed mild activation of CD4+ T cells but stronger activation of CD8+ T cells based on CD25 expression. This reflects that CD8+ cells are major responders of COVID‐19 infection and are consistently activated. It is possible that CD4+ T cells may be strongly activated earlier during the infection and then revert to the quiescent state after providing helper functions, which could explain the undetected activated phenotype. This could be explained by the comparable expression of CD69, an early activation marker, in HDs and patients. CD4+ T cells may indeed be weakly activated in response to the virus, which warrants further studies.
During viral infections, the antigen‐specific immune response is executed by Tfh and GCB cells. Tfh cells help B cell differentiate into antigen‐specific effector cells to produce high‐affinity antibodies and facilitate GC formation, 24 which are essential for inducing efficient virus clearance. In COVID‐19 patients, there was an increase in both Tfh‐ and GBC‐like cells in the blood, which reflected that an antigen‐specific response can be activated upon SARS‐CoV‐2 infection.
Elderly individuals typically exhibit a reduction in the lymphocyte populations and a weaker ability to defend against viral infections. 34 In our correlation analysis, we did not observe a significant correlation between lymphocyte proportions, effector features and age. Our data suggest that the specific populations of T and B cells for SARS‐CoV‐2 are reserved in aged individuals; this needs to be proven by repertoire sequencing analysis of T cell and B cell receptors in elderly patients.
In summary, our study shows that SARS‐CoV‐2 could induce relatively normal adaptive immune response in patients. Most people across different age groups are capable of mobilizing the adaptive immune cells, and activating cellular and humoral immunity to defend against the virus with sufficient medical care and anti‐viral treatment.
CONFLICT OF INTEREST
We declare no competing interests.
AUTHORS’ CONTRIBUTIONS
Xiaofeng Yang, Xiaobo Zhou, Lei Lei, Xingzhe Zhang and Dan Zhang: Data analysis and writing of the manuscript. Tongxin Dai, Hongbo Qian, Rui Guo and Yaling Guo: Sample collection and information. Lin Shi and Yanbin Cheng: Data analysis discussion. Jinsong Hu: FCAS analysis. Baojun Zhang: Generation of idea, experiment design and writing of the manuscript. All authors agree to be responsible for their own part of the work. Xiaofeng Yang: Data curation (lead). Tongxin Dai: Data curation (lead). Xiaobo Zhou: Data curation (equal). Hongbo Qian: Data curation (equal). Rui Guo: Data curation (equal). Lei Lei: Data curation (equal). Xingzhe Zhang: Data curation (equal). Dan Zhang: Data curation (equal). Lin Shi: Formal analysis (equal). Yanbin Cheng: Formal analysis (equal). Jinsong Hu: Methodology (lead). Yaling Guo: Data curation (lead). Baojun Zhang: Project administration (lead); Writing‐review & editing (lead).
Supporting information
Fig S1
ACKNOWLEDGEMENTS
This manuscript has been released as a pre‐print at [https://doi.org/10.1101/2020.03.23.20040675], (Yang et al.). 35
Yang X, Dai T, Zhou X, et al. Naturally activated adaptive immunity in COVID‐19 patients. J Cell Mol Med. 2020;24:12457–12463. 10.1111/jcmm.15771
Xiaofang Yang and Tongxin Dai, these authors contributed equally to this work.
[Correction Statement: Correction added on 31 December 2020 after first online publication: The first author’s name has been corrected in this version.]
Funding information
This work was supported by grants from Natural Science Foundation of China (No. 81820108017), National Natural Science Foundation of China (No. 81771673), COVID‐19 special project of Xi’an Jiaotong University Foundation (No. xzy032020002), COVID‐19 special project funded by Qinnong Bank and Xi'an Jiaotong University (No. 01), Project funded by China Postdoctoral Science Foundation (No. 2019M653673) and Opening Project of Key Laboratory of Shaanxi Province for Craniofacial Precision Medicine Research, College of Stomatology, Xi’an Jiaotong University (No. 2019LHM‐KFKT003). We thank all the doctors, nurses, public health workers and patients for their contribution against SARS‐CoV‐2 infection.
Contributor Information
Jinsong Hu, Email: jinsong.hu@xjtu.edu.cn.
Yaling Guo, Email: jinsong.hu@xjtu.edu.cn, Email: 15102915638@126.com, Email: bj.zhang@mail.xjtu.edu.cn.
Baojun Zhang, Email: bj.zhang@mail.xjtu.edu.cn.
DATA AVAILABILITY STATEMENT
All data, models and code generated or used during the study are available in the submitted article.
REFERENCES
- 1. Wang C, Horby PW, Hayden FG, Gao GF. A novel coronavirus outbreak of global health concern. Lancet. 2020;395(10223):470–473. [DOI] [PMC free article] [PubMed] [Google Scholar]
- 2. Zhou P, Yang XL, Wang XG, et al. A pneumonia outbreak associated with a new coronavirus of probable bat origin. Nature. 2020;579(7798):270–273. [DOI] [PMC free article] [PubMed] [Google Scholar]
- 3. Drosten C, Gunther S, Preiser W, et al. Identification of a novel coronavirus in patients with severe acute respiratory syndrome. N Engl J Med. 2003;348(20):1967–1976. [DOI] [PubMed] [Google Scholar]
- 4. Azhar EI, Hui DSC, Memish ZA, Drosten C, Zumla A. The middle east respiratory syndrome (MERS). Infect Dis Clin North Am. 2019;33(4):891–905. [DOI] [PMC free article] [PubMed] [Google Scholar]
- 5. Gralinski LE, Menachery VD. Return of the Coronavirus: 2019‐nCoV. Viruses. 2020;12(2):135 [DOI] [PMC free article] [PubMed] [Google Scholar]
- 6. Lu R, Zhao X, Li J, et al. Genomic characterisation and epidemiology of 2019 novel coronavirus: Implications for virus origins and receptor binding. Lancet. 2020;395(10224):565–574. [DOI] [PMC free article] [PubMed] [Google Scholar]
- 7. Zhu N, Zhang D, Wang W, et al. A novel coronavirus from patients with pneumonia in China, 2019. New Engl J. Med. 2020;382(8):727–733. [DOI] [PMC free article] [PubMed] [Google Scholar]
- 8. Wong RS, Wu A, To KF, et al. Haematological manifestations in patients with severe acute respiratory syndrome: Retrospective analysis. BMJ. 2003;326(7403):1358–1362. [DOI] [PMC free article] [PubMed] [Google Scholar]
- 9. Li T, Qiu Z, Zhang L, et al. Significant changes of peripheral T lymphocyte subsets in patients with severe acute respiratory syndrome. J Infect Dis. 2004;189(4):648–651. [DOI] [PMC free article] [PubMed] [Google Scholar]
- 10. Caruso A, Licenziati S, Corulli M, et al. Flow cytometric analysis of activation markers on stimulated T cells and their correlation with cell proliferation. Cytometry. 1997;27(1):71–76. [DOI] [PubMed] [Google Scholar]
- 11. Gonzalez‐Amaro R, Cortes JR, Sanchez‐Madrid F, Martin P. Is CD69 an effective brake to control inflammatory diseases? Trends Mol Med. 2013;19(10):625–632. [DOI] [PMC free article] [PubMed] [Google Scholar]
- 12. Cai C, Zeng X, Ou AH, Huang Y, Zhang X. Study on T cell subsets and their activated molecules from the convalescent SARS patients during two follow‐up surveys. Xi Bao Yu Fen Zi Mian Yi Xue Za Zhi. 2004;20(3):322–324. [PubMed] [Google Scholar]
- 13. Janice Oh HL, Ken‐En Gan S, Bertoletti A, Tan YJ. Understanding the T cell immune response in SARS coronavirus infection. Emerg Microbes Infect. 2012;1(9):e23. [DOI] [PMC free article] [PubMed] [Google Scholar]
- 14. Liu SA, Dai WS, Zhang JP, et al. The study of T lymphocyte in severe acute respiratory syndrome (SARS). Chinese Journal of Immunology. 2003;19(6):375–380. [Google Scholar]
- 15. Assiri A, Al‐Tawfiq JA, Al‐Rabeeah AA, et al. Epidemiological, demographic, and clinical characteristics of 47 cases of Middle East respiratory syndrome coronavirus disease from Saudi Arabia: a descriptive study. Lancet Infect Dis. 2013;13(9):752–761. [DOI] [PMC free article] [PubMed] [Google Scholar]
- 16. Wu F, Zhao S, Yu B, et al. A new coronavirus associated with human respiratory disease in China. Nature. 2020;579(7798):265–269. [DOI] [PMC free article] [PubMed] [Google Scholar]
- 17. Huang C, Wang Y, Li X, et al. Clinical features of patients infected with 2019 novel coronavirus in Wuhan. China. Lancet. 2020;395(10223):497–506. [DOI] [PMC free article] [PubMed] [Google Scholar]
- 18. Xu Z, Shi L, Wang Y, et al. Pathological findings of COVID‐19 associated with acute respiratory distress syndrome. Lancet. Respir Med. 2020;8(4):420–422. [DOI] [PMC free article] [PubMed] [Google Scholar]
- 19. Le Bert N, Tan AT, Kunasegaran K, et al. SARS‐CoV‐2‐specific T cell immunity in cases of COVID‐19 and SARS, and uninfected controls. Nature. 2020;584(7821):457–462. [DOI] [PubMed] [Google Scholar]
- 20. Ni L, Ye F, Cheng ML, et al. Detection of SARS‐CoV‐2‐specific humoral and cellular immunity in COVID‐19 convalescent individuals. Immunity. 2020;52(6):971–977. e973. [DOI] [PMC free article] [PubMed] [Google Scholar]
- 21. Wen W, Su W, Tang H, et al. Immune cell profiling of COVID‐19 patients in the recovery stage by single‐cell sequencing. Cell Discov. 2020;6:31. [DOI] [PMC free article] [PubMed] [Google Scholar]
- 22. Ma H, Zeng W, He H, et al. Serum IgA, IgM, and IgG responses in COVID‐19. Cell Mol Immunol. 2020;17(7):773–775. [DOI] [PMC free article] [PubMed] [Google Scholar]
- 23. Zost SJ, Gilchuk P, Case JB, et al. Potently neutralizing and protective human antibodies against SARS‐CoV‐2. Nature. 2020;584(7821):443–449. [DOI] [PMC free article] [PubMed] [Google Scholar]
- 24. Sage PT, Sharpe AH. T follicular regulatory cells in the regulation of B cell responses. Trends Immunol. 2015;36(7):410–418. [DOI] [PMC free article] [PubMed] [Google Scholar]
- 25. Guan WJ, Ni ZY, Hu Y, et al. China medical treatment expert group for C. clinical characteristics of coronavirus disease 2019 in China. N Engl J Med. 2020;382(18):1708–1720. [DOI] [PMC free article] [PubMed] [Google Scholar]
- 26. Giamarellos‐Bourboulis EJ, Netea MG, Rovina N, et al. Complex immune dysregulation in COVID‐19 patients with severe respiratory failure. Cell Host Microbe. 2020;27(6):992–1000. e1003. [DOI] [PMC free article] [PubMed] [Google Scholar]
- 27. Zhang BC, Zhou XY, Zhu CL, Song YX, Feng F, Qiu YR, Feng J, Jia QZ, Song QB, Zhu B, Wang J. Immune Phenotyping Based on the Neutrophil‐to‐Lymphocyte Ratio and IgG Level Predicts Disease Severity and Outcome for Patients With COVID‐19. Front Mol Biosci, Posted March 16, 2020. 2020;7(157). 10.1101/2020.03.12.20035048 [DOI] [PMC free article] [PubMed] [Google Scholar]
- 28. Vabret N, Britton GJ, Gruber C, et al. Immunology of COVID‐19: Current state of the science. Immunity 2020, 52(6): 910–941. [DOI] [PMC free article] [PubMed] [Google Scholar]
- 29. Tan L, Wang Q, Zhang D, et al. Lymphopenia predicts disease severity of COVID‐19: a descriptive and predictive study. 2020;5(1): 33. 10.1038/s41392-020-0148-4 [DOI] [PMC free article] [PubMed] [Google Scholar]
- 30. Blackburn SD, Shin H, Haining WN, et al. Coregulation of CD8+ T cell exhaustion by multiple inhibitory receptors during chronic viral infection. Nat Immunol. 2009;10(1):29–37. [DOI] [PMC free article] [PubMed] [Google Scholar]
- 31. Sanmamed MF, Chen L. A Paradigm shift in cancer immunotherapy: From enhancement to normalization. Cell. 2018;175(2):313–326. [DOI] [PMC free article] [PubMed] [Google Scholar]
- 32. Schonrich G, Raftery MJ. The PD‐1/PD‐L1 axis and virus infections: A delicate balance. Front Cell Infect Microbiol. 2019;9:207. [DOI] [PMC free article] [PubMed] [Google Scholar]
- 33. McElroy AK, Akondy RS, Davis CW, et al. Human Ebola virus infection results in substantial immune activation. Proc Natl Acad Sci USA. 2015;112(15):4719–4724. [DOI] [PMC free article] [PubMed] [Google Scholar]
- 34. Palmer S, Albergante L, Blackburn CC, Newman TJ. Thymic involution and rising disease incidence with age. Proc Natl Acad Sci USA. 2018;115(8):1883–1888. [DOI] [PMC free article] [PubMed] [Google Scholar]
- 35. Yang XF, Dai TX, Zhou XB et al. Analysis of adaptive immune cell populations and phenotypes in the patients infected by SARS‐CoV‐2. medRxiv. 2020. 10.1101/2020.03.23.20040675 [DOI] [Google Scholar]
Associated Data
This section collects any data citations, data availability statements, or supplementary materials included in this article.
Supplementary Materials
Fig S1
Data Availability Statement
All data, models and code generated or used during the study are available in the submitted article.