

Abstract
OBJECTIVE
To describe variations in COVID‐19 confirmed cases and deaths among assisted living (AL) residents and examine their associations with key AL characteristics.
DESIGN
Observational study employing data on confirmed COVID‐19 cases and deaths in ALs from seven states, through May 29, 2020.
SETTING
Information on COVID‐19 cases/deaths in ALs was obtained from state government websites. A national inventory of ALs was used to identify communities with and without COVID‐19 cases/deaths. Medicare Beneficiary Summary File identifying AL residents was employed to develop AL characteristics. County‐level COVID‐19 laboratory‐confirmed cases/deaths were obtained from publicly available data.
PARTICIPANTS
We found 4,865 ALs (2,647 COVID‐19 cases and 777 deaths) in the seven states. After excluding missing data, the sample consisted of 3,994 ALs (82.1%) with 2,542 cases (96.0%) and 675 deaths (86.9%).
MAIN OUTCOMES AND MEASURES
Outcomes were AL‐level counts of cases and deaths. Covariates were AL characteristics and county‐level confirmed COVID‐19 cases/deaths. Multivariable two‐part models determined the associations of independent variables with the likelihood of at least one case and death in the AL, and with the count of cases (deaths).
RESULTS
State case fatality ranged from 3.32% in North Carolina to 9.26% in Connecticut, but for ALs in these states it was 12.89% and 31.59%, respectively. Among ALs with at least one case, midsize communities had fewer cases (incidence rate ratio (IRR) = 0.829; P = .004) than small ALs. ALs with higher proportions of racial/ethnic minorities had more COVID‐19 cases (IRR = 1.08; P < .001), as did communities with higher proportions of residents with dementia, chronic obstructive pulmonary disease, and obesity.
CONCLUSIONS AND RELEVANCE
ALs with a higher proportion of minorities had more COVID‐19 cases. Many of the previously identified individual risk factors are also present in this vulnerable population. The impact of COVID‐19 on ALs is as critical as that on nursing homes, and is worth equal attention from policy makers.
Keywords: COVID‐19, assisted living, risk factors
INTRODUCTION
The COVID‐19 pandemic has disproportionately affected older and minority individuals, and residents of nursing homes and other long‐term care facilities. By July 30, 2020, 362,000 people in virtually every U.S. nursing home were infected with the virus, representing about 8% of all cases in the country. At least 62,000 nursing home residents died of COVID‐19, accounting for 41% of COVID‐19 deaths nationally. 1
Although residents of assisted living (AL) communities share many characteristics and vulnerabilities with nursing home residents, 2 , 3 , 4 little is known about the impact of COVID‐19 in this residential care setting. Most ALs are ill prepared to deal with epidemics let alone with a pandemic. They are often financially challenged, care for increasingly sicker residents, operate under limited oversight, and experience staff shortages. 5 Workers providing daily care in ALs are mostly personal care aids rather than certified nursing assistants or registered nurses (RNs). Most states do not require staffing levels for these workers to be proportionate to the number of residents, and more than half have no hourly requirements for staff training. 6 As these AL workers are not considered a “healthcare workforce,” they receive little if any training on the use of personal protective equipment (PPE), such as masks or gloves, even though they assist the residents with daily personal care needs. ALs typically have little PPE on hand, and have been experiencing significant shortages during COVID‐19. 7 Although staffing hours per resident per day are not commonly reported by ALs, staff shortages in this care setting have been endemic and were further exacerbated during the COVID‐19 pandemic. 8 Furthermore, the level of pandemic preparedness, be it due to influenza or novel coronavirus, has also been challenging in this setting. 9
To date, almost nothing is known about the impact of COVID‐19 on the AL population. The first attempt to quantify this has been undertaken by the members of Congress, specifically Senators Warren and Markey, and the House Oversight and Reform Committee, who commissioned a survey of 11 largest AL chain operators on April 29, 2020. 10 These providers reported that as of the end of May, 4,412 residents in 2,173 communities tested positive for COVID‐19, accounting for 2.9% of all residents, a rate five times higher than the national average. The survey also showed that 31% of residents who tested positive died from the disease, a fatality rate six times higher than the national average. 10
By the end of May 2020, several states took the initiative to publicly report COVID‐19 cases and deaths in their AL communities. Taking advantage of the availability of these data, our study objectives were to: describe variations in COVID‐19 confirmed cases and deaths among AL communities in the reporting states and examine their associations with key AL characteristics, controlling for county‐level presence of COVID‐19.
METHODS
Variables and Data Sources
Our primary outcomes of interest were the numbers of COVID‐19 confirmed cases and deaths occurring among the residents of AL communities by May 29, 2020. The independent variables included AL‐level characteristics (defined below) and county‐level COVID‐19 confirmed cases and deaths where AL communities were located. Four sources of data were used in this study.
First, we obtained information on COVID‐19 cases and/or deaths in ALs from states reporting these data on their official state websites. By the end of May, 13 states have reported AL‐specific COVID‐19 data. However, the quality of this reporting varied considerably by state. For example, Pennsylvania did not report the actual number of cases in ALs with fewer than five, whereas Massachusetts and Rhode Island provided only a range of cases, not the actual counts. North Dakota and Florida reported only new outbreaks or weekly cases, respectively, but did not report cumulative counts. Kentucky, which showed a disproportionately small number of COVID‐affected ALs and cases, was also excluded, leaving seven states in our final analytical sample: Colorado, Connecticut, New York (reporting deaths but not cases), Georgia, Ohio (reporting cases but not deaths), North Carolina, and South Carolina (see Supplementary Appendix S1 for links to data sources). Each of these states started their COVID‐19 data reporting at different times, but all reported their first COVID‐19 case during the first 9 days of March. Since these initial cases were reported, the data were cumulated through May 29, 2020.
Second, we used a 2019 national inventory of AL communities in each state, which we had previously constructed based on data obtained from state licensing agencies. We linked ALs identified in the COVID‐19 state reports (above) with those in our inventory using AL community names and physical addresses.
Third, we used the previously obtained calendar year (CY) 2018 Medicare Beneficiary Summary File (MBSF) for residents of AL communities. We employed a two‐step process to obtain this file. First, we purchased a file of nine‐digit zip codes for every U.S. street and address range from a commercially available source (https://www.zip-codes.com/zip-plus-4-database.asp). Using the zip code file and the inventory of AL communities, we identified 90,859 unique nine‐digit zip codes corresponding to those ALs. Under our Data Use Agreement with the Centers for Medicare & Medicaid Services (CMS), we submitted this finder file to be searched against the Medicare Enrollment Database for all beneficiaries ever associated with these zip codes. We received a file containing just over 1M unique Medicare beneficiary identification numbers, and their residence change dates. We subset this file to include only beneficiaries who resided in ALs between 2016 and 2020 and submitted this as our second finder file to be searched for unique beneficiaries matching CY2017 to 2018 MBSF records, with flags for the year in which beneficiaries were found. Using this method, we obtained information on 494,590 resident‐stays in 28,745 AL communities in CY2018.
The MBSF contains sociodemographic, Medicare enrollment, and other beneficiary‐level information, which we used to characterize AL communities in our study sample, focusing specifically on COVID‐19 risk factors. We developed the following independent variables for each AL: average resident age; proportion of males; proportion of residents dually eligible for Medicare and Medicaid; number of residents who were Medicare beneficiaries (based on the overall distribution; categories were defined as <9, 9–29, and ≥30); and the proportion of minority residents (non‐White and/or Hispanic). We also characterized ALs based on the proportion of residents with the following chronic conditions: dementia, chronic obstructive pulmonary disease (COPD), asthma, congestive heart failure (CHF), obesity, hypertension, and diabetes mellitus.
Fourth, for each county where the ALs were located, we identified the number of COVID‐19 laboratory‐confirmed cases and deaths using the publicly available database developed by the New York Times (https://github.com/nytimes/covid-19-data). This database has been continuously updated based on reports from state and local health agencies going back to the first reported case in Sonomish County in Washington in January of 2020. 11
Analytical Sample
After linking residential care facilities identified in states' COVID‐19 reports of cases/deaths with our national inventory, we found 4,865 ALs (with 2,647 COVID‐19 cases and 777 deaths) in seven states. Of these, 871 ALs had no Medicare beneficiary residents in the 2018 MBSF, either because they did not serve Medicare residents or because they were new communities that opened in 2019. Therefore, in the multivariable models, our analytical sample consisted of 3,994 ALs (82.1%) with 2,542 cases (96.0%) and 675 deaths (86.9%).
Statistical Analyses
First, we examined the distribution of COVID‐19 cases and deaths, as well as AL‐specific characteristics, by the number of confirmed cases (0, 1–6, and 7–58), and by the number of deaths (0, 1–3, and 4–26). We also summarized state‐level characteristics with regard to COVID‐19 impact both on the general population and on AL communities.
We employed multivariable analyses to examine the association of the two dependent variables and confirmed COVID‐19 cases and deaths (separate models) with the independent variables. We fit two‐part zero‐inflated models at the AL level to account for a relatively large number of communities with zero confirmed cases or deaths. 12 In the first part, we used a generalized linear model with a logit link function and, assuming binomial distribution, we estimated the likelihood of AL having at least one confirmed COVID‐19 case (or death). In the second part, assuming a Poisson distribution, we estimated the number of cases (or deaths) conditional on at least one confirmed case (death) having been recorded in the AL through May 29, 2020. In both parts of the model, we controlled for the same AL covariates, the total number of cases (deaths) recorded in the county (per 1,000 population) where the ALs were located, and state fixed effects.
RESULTS
Significant variations in state‐level COVID‐19 cases and deaths in the general population and in AL communities were reported (Table 1). New York and Connecticut led the states in the rate of cases and deaths per 10,000 population, and in case fatality. Overall, case fatality ranged from 3.32% in North Carolina to 9.26% in Connecticut. Within AL communities, case fatality rate was considerably greater, 12.89% in North Carolina and 31.59% in Connecticut. AL‐specific case fatality rates for New York and Ohio cannot be calculated as the former did not report cases and the latter did not report deaths. Through the end of May, most ALs (91.61%) were unaffected by COVID‐19 cases or deaths, but that also varied considerably from only 5.21% of ALs in North Carolina being impacted to 32.87% of ALs in Connecticut.
Table 1.
COVID‐10 Characteristics by State
| Characteristics | Colorado | Connecticut | Georgia | North Carolina | New York | Ohio | South Carolina | Overall |
|---|---|---|---|---|---|---|---|---|
| State level | ||||||||
| Confirmed cases, No. | 25,602 | 41,762 | 43,888 | 26,735 | 373,108 | 34,566 | 11,131 | 556,792 |
| Confirmed deaths, No. | 1,437 | 3,868 | 1,953 | 888 | 29,535 | 2,131 | 483 | 40,295 |
| Case fatality % (deaths/cases) | 5.61 | 9.26 | 4.45 | 3.32 | 7.92 | 6.17 | 4.34 | 7.24 |
| Confirmed cases/10,000 | 45.01 | 116.26 | 40.75 | 25.75 | 292.13 | 29.57 | 21.89 | 93.25 |
| Confirmed deaths/10,000 | 2.53 | 10.83 | 1.86 | 0.86 | 23.12 | 1.82 | 0.95 | 6.75 |
| AL level | ||||||||
| Confirmed AL cases, No. | 517 | 975 | 225 | 450 | NA | 408 | 72 | 2,647 |
| Confirmed AL deaths, No | 133 | 308 | 53 | 58 | 210 | NA | 14 | 776 |
| Case fatality % (deaths/cases) | 25.73 | 31.59 | 23.56 | 12.89 | NA | NA | 19.44 | 29.32 |
| No. ALs in state | 715 | 216 | 1,392 | 614 | 544 | 737 | 467 | 4,685 |
| COVID‐19 impacted ALs, % | 7.41 | 32.87 | 4.24 | 5.21 | 13.24 | 9.5 | 7.71 | 8.39 |
Abbreviations: AL, assisted living; NA, not available.
In most states, over 90% of ALs did not report any COVID‐19 cases (Figure 1A) or deaths (Figure 1B), with a notable exception of Connecticut. Over 20% of ALs in Connecticut reported cases in the two top quartiles of the distribution (4–26), and over 11% reported between 1 and 3 cases. Similar distribution held true for COVID‐19 deaths, with Connecticut reporting most ALs experiencing multiple deaths of their residents.
Figure 1.
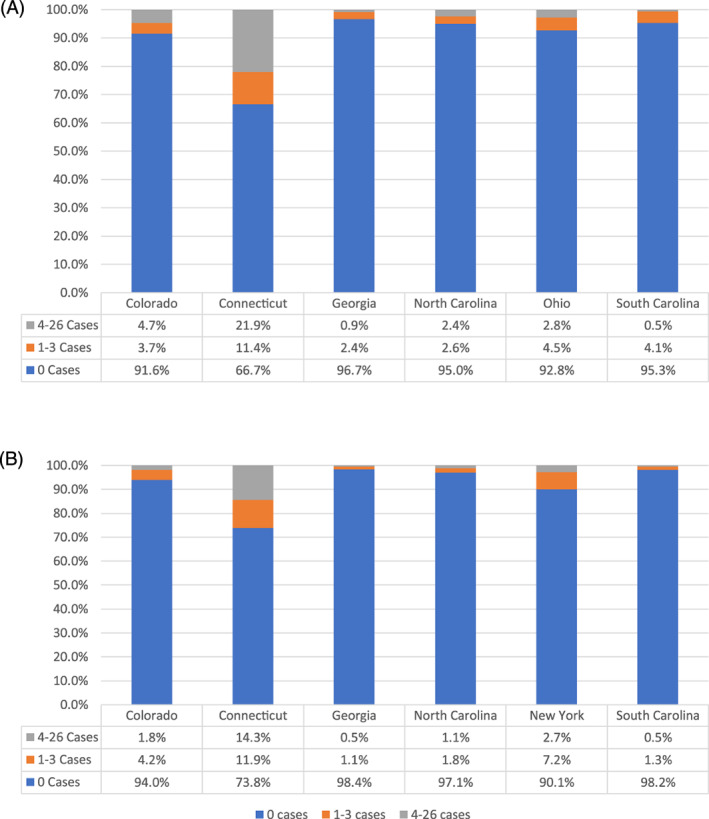
Distribution of COVID‐19 confirmed cases (A) and deaths (B) in assisted living communities: by state.
By the end of May 2020, the average number of confirmed cases was 0.72 per AL with a standard deviation (SD) of 3.95 (Table 2). Although in most ALs, there were no COVID‐19 cases, 252 (7.1%) of communities experienced between 1 to as many as 58 cases. The number of confirmed deaths was 0.20 per AL on average (SD = 1.21). There were no COVID‐19 deaths in most ALs (94.8%), and in the remaining 5.2% of ALs, deaths ranged from 1 to 26, with 2% of ALs (N = 67) experiencing on average 7.43 deaths (SD = 3.69). The average age of residents tended to be lower in ALs without any cases (74.8 years) compared with those with 1 to 6 cases (82.8 years) or with 7 or more cases (83.4 years), with a similar pattern observed for deaths. In ALs with no cases (deaths), the proportion of males was higher, as was the percentage of dual‐eligible residents, compared with ALs with one or more confirmed cases (deaths). Furthermore, more than half (54.0%) of ALs with 0 cases (and 55.1% with no deaths) were small (i.e., with <9 Medicare‐eligible residents), whereas among those ALs with 7 to 58 cases (or 4–26 deaths), well over half had more than 30 residents. Compared with ALs with no cases (deaths), those with presence of COVID‐19 had fewer Black/Hispanic residents (e.g., 7.84% of minority residents in ALs with 7–58 cases, vs 22.6% in ALs with none). ALs with more confirmed cases appeared to have higher proportions of residents with dementia, COPD, CHF, and hypertension compared with ALs with no cases.
Table 2.
Characteristics of Assisted Living Communities by Confirmed COVID‐19 Number of Cases and Deaths as of May 29, 2020
| Variable | Total No. of confirmed cases | Total No. of confirmed deaths | Overall | ||||
|---|---|---|---|---|---|---|---|
| 0 | 1–6 | 7–58 | 0 | 1–3 | 4–26 | ||
| No. of ALs | 3,298 | 134 | 118 | 3,128 | 109 | 67 | 3,994 |
| Confirmed cases | 0 | 2.5 (1.6) | 18.8 (11.1) | 0.1 (0.9) | 8.3 (8.8) | 23.0 (11.8) | 0.7 (3.9) |
| Confirmed deaths | 0 | 0.5 (0.8) | 4.9 (4.3) | 0 | 1.6 (0.8) | 7.4 (3.7) | 0.2 (1.2) |
| Age, y | 74.8 (11.2) | 82.8 (7.7) | 83.4 (5.7) | 74.1 (11.3) | 83.4 (6.7) | 85.4 (4.1) | 76.0 (11.1) |
| Male residents, % | 36.0 (26.8) | 27.3 (17.7) | 30.0 (16.0) | 37.1 (27.3) | 30.2 (17.8) | 29.2 (14.0) | 35.2 (25.7) |
| Residents with dual eligibility for Medicare and Medicaid, % | 30.5 (33.2) | 17.4 (27.5) | 19.4 (27.7) | 31.5 (34.0) | 19.0 (27.2) | 11.0 (18.2) | 29.9 (32.9) |
| No. of Medicare beneficiaries in AL | |||||||
| <9 | 1,782 (54.0) | 34 (25.4) | 26 (22.0) | 1,724 (55.1) | 23 (21.1) | 10 (14.9) | 1,906 (47.7) |
| 9–29 | 908 (27.5) | 48 (35.8) | 26 (22.0) | 780 (24.9) | 28 (25.7) | 15 (22.4) | 1,107 (27.7) |
| ≥30 | 608 (18.4) | 52 (38.8) | 66 (55.9) | 624 (19.9) | 58 (53.2) | 42 (62.7) | 981 (24.6) |
| Black/Hispanic residents, % | 22.6 (32.9) | 7.8 (17.3) | 7.8 (15.4) | 24.0 (33.4) | 5.98 (11.7) | 5.8 (14.3) | 19.9 (31.0) |
| Residents with dementia, % | 34.3 (27.9) | 42.3 (20.4) | 44.8 (22.2) | 33.5 (28.0) | 45.2 (22.9) | 51.5 (19.4) | 35.4 (26.8) |
| Residents with COPD, % | 28.9 (24.1) | 28.8 (17.4) | 29.0 (13.6) | 28.9 (24.5) | 30.5 (15.8) | 32.4 (15.1) | 29.5 (23.1) |
| Residents with asthma, % | 14.4 (17.6) | 14.3 (12.1) | 14.8 (12.4) | 14.7 (17.7) | 16.9 (14.0) | 15.8 (13.7) | 14.7 (16.7) |
| Residents with CHF, % | 29.3 (24.5) | 38.0 (19.5) | 38.7 (19.2) | 28.7 (24.7) | 38.6 (18.6) | 44.8 (19.6) | 30.8 (23.8) |
| Residents with obesity, % | 23.7 (23.5) | 19.3 (15.8) | 20.1 (14.0) | 23.7 (23.7) | 17.7 (11.8) | 19.2 (14.5) | 23.2 (22.2) |
| Residents with hypertension, % | 69.1 (27.0) | 72.7 (19.4) | 72.7 (18.4) | 68.5 (27.5) | 72.9 (21.3) | 76.8 (15.8) | 69.7 (25.7) |
| Residents with diabetes mellitus, % | 35.7 (26.0) | 33.2 (19.1) | 32.6 (16.1) | 36.1 (26.5) | 36.5 (19.0) | 36.9 (18.5) | 36.2 (25.0) |
Note: Data are given as mean (standard deviation) or number (percentage).
Abbreviations: AL, assisted living; CHF, congestive heart failure; COPD, chronic obstructive pulmonary disease.
The multivariable two‐part models confirmed these bivariate observations (Table 3). After controlling for AL‐level resident characteristics and county‐level COVID‐19 spread, the likelihood of ALs having at least one resident case was 5% greater (odds ratio (OR) = 1.05; P = .001) in communities with higher average resident age. The odds of a community having at least one case were considerably higher in ALs with 9 to 29 (OR = 1.822; P = .004) and with 30 or more (OR = 2.778; P < .001) Medicare residents, compared with the small ALs (<9 residents). The odds were also higher in communities with a greater proportion of residents with heart failure (OR = 1.139; P = .005), and in those located in counties with higher COVID‐19 rates (OR = 1.165; P < .001). The likelihood of having at least one case did not vary across states in which these ALs were located.
Table 3.
COVID‐19 Confirmed Cases Among AL Residents: Association with AL and County Characteristics
| Variable | Likelihood of at least 1 case (all ALs) | Count of cases in ALs with at least 1 case | ||||
|---|---|---|---|---|---|---|
| Beta‐coefficient | OR (95%CI) | P value | Beta‐coefficient | IRR (95%CI) | P value | |
| AL‐level variables | ||||||
| Age | 0.049 | 1.050 (1.02–1.08) | .001 | 0.004 | 1.004 (0.99–1.01) | .479 |
| % Male (vs female) | −0.011 | 0.989 (0.91–1.07) | .784 | 0.029 | 1.030 (1.00–1.06) | .045 |
| % Dual eligible (vs Medicare only) | −0.057 | 0.944 (0.88–1.01) | .095 | 0.009 | 1.009 (0.99–1.03) | .347 |
| AL with 9–29 residents (vs <9) | 0.600 | 1.822 (1.22–2.72) | .004 | −0.188 | 0.829 (0.73–0.94) | .004 |
| AL with ≥30 residents (vs <9) | 1.022 | 2.778 (1.85–4.18) | <.001 | −0.034 | 0.966 (0.86–1.09) | .569 |
| % Blacks/Hispanics | −0.062 | 0.940 (0.87–1.03) | .162 | 0.077 | 1.080 (1.05–1.11) | <.001 |
| % Residents with dementia | 0.055 | 1.056 (0.98–1.14) | .172 | 0.067 | 1.070 (1.04–1.10) | <.001 |
| % Residents with COPD | −0.069 | 0.933 (0.85–1.03) | .158 | 0.089 | 1.093 (1.06–1.13) | <.001 |
| % Residents with asthma | 0.011 | 1.011 (0.90–1.13) | .848 | −0.054 | 0.947 (0.91–0.98) | .006 |
| % Residents with CHF | 0.130 | 1.139 (1.04–1.25) | .005 | −0.039 | 0.962 (0.93–0.99) | .008 |
| % Residents with obesity | 0.025 | 1.026 (0.93–1.13) | .608 | 0.038 | 1.039 (1.01–1.07) | .032 |
| % Residents with hypertension | −0.062 | 0.940 (0.85–1.04) | .216 | 0.023 | 1.023 (0.99–1.06) | .221 |
| % Residents with diabetes mellitus | −0.042 | 0.959 (0.88–1.05) | .354 | −0.041 | 0.959 (0.93–0.99) | .011 |
| County‐level variable | ||||||
| COVID‐19 cases/1,000 population | 0.152 | 1.165 (1.10–1.24) | <.001 | 0.002 | 1.002 (0.99–1.02) | .789 |
| State‐level fixed effect (reference = South Carolina) | ||||||
| Colorado | 0.370 | 1.448 (0.78–2.68) | .240 | 1.167 | 3.214 (2.40–4.30) | <.001 |
| Connecticut | 0.567 | 1.762 (0.75–4.14) | .194 | 1.426 | 4.163 (3.02–5.74) | <.001 |
| Georgia | 0.112 | 1.118 (0.60–2.07) | .723 | 0.601 | 1.824 (1.35–2.46) | <.001 |
| North Carolina | −0.066 | 0.937 (0.49–1.77) | .840 | 1.458 | 4.296 (3.26–5.66) | <.001 |
| Ohio | −0.240 | 0.786 (0.44–1.42) | .426 | 0.986 | 2.681 (2.02–3.55) | <.001 |
Note: For proportions, the marginal effect of 10% increase is reported.
Abbreviations: AL, assisted living; CHF, congestive heart failure; CI, confidence interval; COPD, chronic obstructive pulmonary disease; IRR, incidence rate ratio; OR, odds ratio.
Among ALs with at least one case, several AL characteristics were significantly associated with the count of cases. Compared with small ALs (<9 residents), midsize communities (9–29 residents) had 17% fewer cases (incidence rate ratio (IRR) = 0.829; P = .004), but larger ALs (≥30 residents) were not statistically different. ALs with higher proportions of Black/Hispanic residents had more COVID‐19 cases (IRR = 1.08; P < .001), as did communities with higher proportions of residents with dementia (IRR = 1.07; P < .001), COPD (IRR = 1.093; P < .001), and obesity (IRR = 1.039; P = .032), and those with higher proportion of males (IRR = 1.03; P = .045). Higher proportions of residents with asthma (IRR = 0.947; P = .006), heart failure (IRR = 0.962; P = .008), and diabetes mellitus (IRR = 0.959; P = .011) were associated with fewer cases. After controlling for AL characteristics, greater county penetration of COVID‐19 cases was not associated with a higher case count in ALs with at least one positive case. Compared with South Carolina (reference state), ALs in North Carolina, Colorado, and Connecticut had three to over four times as many cases (IRRs ranging from 3.214–4.296; P < .001), whereas those in Georgia and Ohio had fewer confirmed cases.
In Table 4, we show the results of the two‐part models for confirmed COVID‐19 deaths. The results of the binomial model for deaths are similar to that for COVID‐19 cases. In the Poisson model, for ALs with at least one death, the percentage of minority residents was not significantly associated with the count of deaths (IRR = 0.98; P = .739). In counties with higher COVID‐19 penetration, the likelihood of ALs having at least one death was four times greater (OR = 4.437; P < .001), but the count of deaths in ALs was not similarly affected. Compared with the reference state of South Carolina, both the likelihood of one death and the count of deaths were significantly higher in Colorado (OR = 2.726 and IRR = 1.979) and in Connecticut (OR = 2.971 and IRR = 2.787).
Table 4.
COVID‐19 Confirmed Deaths Among AL Residents: Association with AL and County Characteristics
| Variable | Likelihood of at least 1 death (all ALs) | Count of cases in ALs with at least 1 death | ||||
|---|---|---|---|---|---|---|
| Beta‐coefficient | OR (95% CI) | P value | Beta‐coefficient | IRR (95% CI) | P value | |
| AL‐level variables | ||||||
| Age | 0.053 | 1.055 (1.01–1.09) | .009 | 0.005 | 1.005 (0.97–1.04) | .785 |
| % Male (vs female) | 0.062 | 1.064 (0.96–1.18) | .242 | 0.024 | 1.024 (0.96–1.10) | .496 |
| % Dual eligible (vs Medicare only) | −0.093 | 0.911 (0.84–0.99) | .038 | −0.032 | 0.969 (0.92–1.02) | .223 |
| AL with 9–29 residents (vs <9) | 0.575 | 1.777 (1.02–3.10) | .044 | 0.308 | 1.361 (0.97–1.91) | .074 |
| AL with ≥30 residents (vs <9) | 1.039 | 2.826 (1.62–4.93) | <.001 | 0.351 | 1.420 (1.04–1.95) | .030 |
| % Blacks/Hispanics | −0.054 | 0.948 (0.83–1.08) | .435 | −0.020 | 0.980 (0.87–1.10) | .739 |
| % Residents with dementia | 0.128 | 1.136 (1.02–1.26) | .020 | 0.085 | 1.089 (1.02–1.16) | .008 |
| % Residents with COPD | −0.089 | 0.915 (0.80–1.04) | .189 | 0.162 | 1.175 (1.09–1.26) | <.001 |
| % Residents with asthma | 0.131 | 1.140 (0.98–1.32) | .081 | −0.095 | 0.910 (0.83–0.99) | .042 |
| % Residents with CHF | 0.040 | 1.041 (0.92–1.18) | .523 | 0.083 | 1.086 (1.02–1.16) | .014 |
| % Residents with obesity | −0.021 | 0.979 (0.85–1.12) | .762 | 0.031 | 1.032 (0.94–1.13) | .508 |
| % Residents with hypertension | −0.059 | 0.943 (0.82–1.08) | .390 | −0.116 | 0.890 (0.82–0.97) | .008 |
| % Residents with diabetes mellitus | −0.049 | 0.952 (0.84–1.08) | .441 | 0.005 | 1.005 (0.92–1.09) | .905 |
| County‐level variable | ||||||
| COVID‐19 deaths/1,000 population | 1.490 | 4.437 (2.93–6.71) | <.001 | −0.114 | 0.892 (0.83–0.95) | .001 |
| State‐level fixed effect (reference = South Carolina) | ||||||
| Colorado | 1.003 | 2.726 (1.10–6.75) | .030 | 0.683 | 1.979 (0.96–4.06) | .063 |
| Connecticut | 1.089 | 2.971 (1.11–7.99) | .031 | 1.025 | 2.787 (1.38–5.62) | .004 |
| Georgia | 0.547 | 1.727 (0.67–4.45) | .258 | 0.182 | 1.199 (0.58–2.50) | .627 |
| North Carolina | −0.466 | 0.628 (0.21–1.89) | .407 | 0.301 | 1.351 (0.64–2.84) | .429 |
| Ohio | 0.381 | 1.464 (0.57–3.78) | .432 | 0.566 | 1.761 (0.84–3.68) | .132 |
Note: For proportions, the marginal effect of 10% increase is reported.
Abbreviations: AL, assisted living; CHF, congestive heart failure; CI, confidence interval; COPD, chronic obstructive pulmonary disease; IRR, incidence rate ratio; OR, odds ratio.
DISCUSSION
To the best of our knowledge, this is the first study to examine presence of COVID‐19 cases and deaths in ALs in the United States, and to identify their associations with AL characteristics, using state reported data. In the seven states comprising the study sample, COVID‐19 case fatality averaged 7.24% through May 29, 2020. In the same time period, case fatality in ALs across these states was four times higher, even though fewer than 10% of ALs reported being affected by the pandemic. The impact of the pandemic on ALs varied significantly by state, reflecting the evolving local infection rates, as well as perhaps testing and reporting. The initial wave of COVID‐19, for the time period covered, spread largely through the northeastern states and this is reflected by the considerably higher confirmed cases and deaths (per 10,000 population), and by case fatality experienced in Connecticut and New York.
Our findings showed that ALs in counties with higher COVID‐19 infection rates had a greater likelihood of having at least one COVID‐19 case or death. As in nursing homes, AL residents are highly vulnerable to COVID‐19 infections because of their individual risk factors. We found that ALs with greater proportion of residents with dementia, COPD, and obesity had significantly more cases and deaths related to COVID‐19. In larger AL communities, the likelihood of infections and deaths was generally higher, similar to findings from recent studies of COVID‐19 in nursing homes. 13 , 14 , 15 Also consistent with recent nursing home studies, 13 , 14 , 16 we found that ALs with a higher proportion of minority residents had more cases, but not of deaths, after controlling for AL characteristics. Prior AL studies have shown that minorities are more represented in small (i.e., <16 beds) communities, 17 which tend to have fewer staffing hours per resident and are less likely to have licensed and skilled care staff. 4 , 18 It is possible that ALs with more minority residents face higher rates of COVID‐19 infections because they tend to have lower staffing capacity and perhaps less know‐how and resources to deal with the pandemic. Indeed, recent nursing home studies showed lower rates of COVID‐19 in homes with higher RN staffing and more resources. 14 , 15
COVID‐19 has wreaked havoc on populations receiving institutional long‐term care services. Nowhere has this been more noted than in nursing homes, which have received the much deserved attention of researchers, policy experts, and regulators. 19 , 20 , 21 , 22 For example, the CMS now requires all nursing homes to collect and report COVID‐19 cases. 23 However, for ALs, there is no uniform requirement vis a vis such data collection and reporting, leaving the decision largely to the states and making data collection haphazard. 24 Although the Centers for Disease Control and Prevention has issued guidance on COVID‐19 prevention and mitigation in ALs, 25 the guidance is not binding and the communities are not required to adhere to it. Furthermore, in June of 2020, CMS has refocused the nursing home survey process on infection control (https://www.cms.gov/files/document/qso-20-31-all.pdf), which, although criticized as being inadequate, 20 is still superior to general absence of infection control regulations and requirements in ALs. 9 , 26 And although the federal government has allocated over $10 billion to specifically assist nursing homes with the pandemic, including support for testing, PPE, and staff shortages, 27 , 28 federal assistance to ALs has been limited to those communities serving Medicaid‐eligible residents (i.e., about 16% of AL communities), 29 even though ALs and nursing homes care for similar populations and share many of the same pandemic‐related challenges. Relying on AL communities to muster a rigorous response to the COVID‐19 pandemic largely on their own is clearly unrealistic. ALs and their residents urgently need local, state, and the federal governments to pay at least the same level of attention as that given to nursing homes.
Several study limitations should be acknowledged. First, this study focuses only on seven states, which account for less than one‐fifth of all AL communities in the United States, so that our findings’ generalizability may be limited. Second, the period covered in our study, through end of May 2020, precedes the summer explosion of COVID‐19 in many states, and thus our findings may not be measuring the full impact of the epidemic in these states. Third, as in other observational studies, our estimates of associations may be biased due to unmeasured confounders, such as AL staffing or the specific infection control and prevention practices within individual communities. Finally, the lack of significant association between COVID‐19 and the proportion of dual beneficiaries, and several other AL characteristics, may be because we did not have sufficient power due to relatively few ALs with COVID‐19 confirmed deaths.
In conclusion, larger AL communities appear more likely to experience at least one COVID‐19 case, but they are not necessarily more likely to experience a greater count of cases. However, if COVID‐19 deaths occur, larger communities tend to experience more deaths. As in nursing homes, AL communities with a higher proportion of minority residents tend to have a higher count of COVID‐19 cases. Many of the previously identified individual risk factors are also present in this vulnerable population of AL residents and contribute to higher COVID‐19 case and death counts. As the pandemic continues, more attention should be devoted to AL communities whose needs to protect their vulnerable residents from the ravages of COVID‐19 are arguably as critical as those of nursing homes.
Editor's Note.
This is an important and timely article. As the authors point out, a lot has been published in the Journal of the American Geriatrics Society and elsewhere about the impacts of COVID‐19 on nursing homes. But assisted living (AL) facilities are just as if not a more important setting in which to focus national, state, and local efforts to mitigate the effects of this pandemic. Why? The limited data the authors had access to when writing this article surely substantially underestimate the magnitude of the effects of COVID‐19 in this setting. Most AL residents are similar to nursing home residents. They are older and have multiple comorbidities, which predispose them to acquiring the severe acute respiratory syndrome coronavirus 2 and COVID‐19 disease, and the related complications—including a much higher mortality rate than in the community. In addition to the vulnerable population, AL facilities are not subject to the breadth of federal and state regulations that serve to protect residents of nursing homes. In many states, staff and visitors come in and out of AL facilities without thorough screening; infection control policies and procedures are often not in place, and, similar to the situation in nursing homes, staffing is often inadequate and viral testing and personal protective equipment are not as available as they should be. Moreover, most AL facilities are run more based on a hospitality than a healthcare paradigm. They generally have few if any licensed nursing staff, and most do not have on‐site care by physicians and advance practice clinicians. We certainly do not want to overmedicalize residential care settings for older people, but the prevalence of geriatric conditions in the AL population, and their vulnerability to COVID‐19, demand that this population receive adequate health care and as much protection from the effects of the pandemic as nursing homes and other healthcare settings. This is an urgent national issue, with the opening of society in many areas and the upcoming flu season sure to make the COVID‐19 much worse. Time is running out to try to prevent tens of thousands of unnecessary and potentially preventable deaths in AL facilities. Federal, state, and local authorities must collaborate with the AL industry to provide desperately needed support. Although guidance on the AL setting is available from the Centers for Disease Control and Prevention, the federal government has not mandated appropriate infection control policies and procedures for AL facilities. The federal government is providing billions of dollars to support the nursing home industry, and should also support AL facilities. Because most nursing homes and AL facilities are run for profit, it is essential to provide financial support and protection from legal liability in ways that ensure the dollars are used fully for their intended purposes, and that egregious violations of recommendations in public health guidance that are known to be effective are identified and fixed as quickly as possible.
–Joseph G. Ouslander, MD
Supporting information
Supplementary Appendix S1: State sources of COVID‐19 data.
ACKNOWLEDGMENTS
Financial Disclosure
This work was supported with funding from the Agency for Healthcare Research and Quality Grant R01HS026893.
Conflict of Interest
The authors have no conflicts of interest to disclose.
Author Contributions
H.T.‐G., Y.L., and X.C.: Study concept and design. H.T.‐G., Y.M., Y.L., W.G., and X.C.: Acquisition of data. H.T.‐G., Y.M., X.C., Y.L., and W.G.: Analysis and interpretation. H.T.‐G., Y.L., and W.G.: Drafting of the manuscript. H.T.‐G., X.C., W.G., Y.M., and Y.L.: Critical revisions.
Sponsorʼs Role: The content is solely the responsibility of the authors.
REFERENCES
- 1. Conlen M, Ivory D, Yourish K, et al. More than 40% of US coronavirus death are linked to nursing homes. New York Times, August 13, 2020. https://www.nytimes.com/interactive/2020/us/coronavirus-nursing-homes.html. Accessed August 13, 2020.
- 2. Wiener J, Feng Z, Coots L, Johnson R. What is the effect of dementia on hospitalization and emergency department use in residental care facilities? Washington, DC; 2014. https://aspe.hhs.gov/basic-report/what-effect-dementia-hospitalization-and-emergency-department-use-residential-care-facilities. Accessed July 8, 2020.
- 3. Caffrey C, Harris‐Kojetin L, Sengupta M. Variation in Residential Care Community Resident Characteristics, by Size of Community: United States, 2014. NCHS data brief. 2015:1–8. [PubMed]
- 4. Han K, Trinkoff AM, Storr CL, Lerner N, Yang BK. Variation across U.S. assisted living facilities: admissions, resident care needs, and staffing. J Nurs Scholarsh. 2017;49:24‐32. [DOI] [PubMed] [Google Scholar]
- 5. Ungar L, Hancock J. COVID‐19 crisis threatens beleaguered assisted living industry. 2020. https://khn.org/news/covid-19-crisis-threatens-beleaguered-assisted-living-industry/. Accessed May 1, 2020.
- 6. Trinkoff AM, Yoon JM, Storr CL, Lerner NB, Yang BK, Han K. Comparing residential long‐term care regulations between nursing homes and assisted living facilities. Nurs Outlook. 2019;68:114‐122. [DOI] [PubMed] [Google Scholar]
- 7. American Geriatrics Society . American Geriatrics Society (AGS) policy brief: COVID‐19 and assisted living facilities. J Am Geriatr Soc. 2020;68:1131‐1135. 10.1111/jgs.16510. [DOI] [PMC free article] [PubMed] [Google Scholar]
- 8. Bucy T, Smith L, Carder P. Variability in state regulations pertaining to infection control and pandemic response in US assisted living communities. J Am Med Dir Assoc. 2020;21:701‐705. [DOI] [PMC free article] [PubMed] [Google Scholar]
- 9. Lum HD, Mody L, Levy CR, Ginde AA. Pandemic influenza plans in residential care facilities. J Am Geriatr Soc. 2014;62:1310‐1316. [DOI] [PMC free article] [PubMed] [Google Scholar]
- 10. Warren E, Markey E, Maloney C. COVID‐19 in assisted living facilities.2020. https://www.warren.senate.gov/imo/media/doc/Assisted%20Living%20Facilities%20Staff%20Report.pdf. Accessed August 10, 2020.
- 11. Holshue ML, DeBolt C, Lindquist S, et al. First case of 2019 novel coronavirus in the United States. N Engl J Med. 2020;382:929‐936. [DOI] [PMC free article] [PubMed] [Google Scholar]
- 12. Cameron A, Trivedi P. Regression Analysis of Count Data. 2nd ed. Cambridge, England: Cambridge University Press; 2013. [Google Scholar]
- 13. Abrams HR, Loomer L, Gandhi A, Grabowski DC. Characteristics of U.S. nursing homes with COVID‐19 cases. J Am Geriatr Soc. 2020;68:1653‐1656. [DOI] [PMC free article] [PubMed] [Google Scholar]
- 14. Li Y, Temkin‐Greener H, Shan G, Cai X. COVID‐19 infections and deaths among Connecticut nursing home residents: facility correlates. J Am Geriatr Soc. 2020;68(9):1899–1906. [DOI] [PMC free article] [PubMed] [Google Scholar]
- 15. Harrington C, Ross L, Chapman S, Halifax E, Spurlock B, Bakerjian D. Nurse staffing and coronavirus infections in California nursing homes. Policy Polit Nurs Pract. 2020;21:174‐186. [DOI] [PubMed] [Google Scholar]
- 16. Li Y, Cen X, Cai X, Temkin‐Greener H. Racial and ethnic disparities in COVID‐19 infections and deaths across U.S. nursing homes. J Am Geriatr Soc. 2020;68(11):2454–2461. 10.1111/jgs.16847. [DOI] [PMC free article] [PubMed] [Google Scholar]
- 17. Howard DL, Sloane PD, Zimmerman S, et al. Distribution of African Americans in residential care/assisted living and nursing homes: more evidence of racial disparity? Am J Public Health. 2002;92:1272‐1277. [DOI] [PMC free article] [PubMed] [Google Scholar]
- 18. Stearns SC, Park J, Zimmerman S, Gruber‐Baldini AL, Konrad TR, Sloane PD. Determinants and effects of nurse staffing intensity and skill mix in residential care/assisted living settings. Gerontologist. 2007;47:662‐671. [DOI] [PubMed] [Google Scholar]
- 19. Grabowski DC, Mor V. Nursing home care in crisis in the wake of COVID‐19. JAMA. 2020;324(1):23‐24. [DOI] [PubMed] [Google Scholar]
- 20. Ouslander J, Grabowski DC. COVID‐19 in nursing homes: calming the perfect storm. J Am Geriatr Soc. 2020;68(10). 10.1111/jgs.16784. [DOI] [PubMed] [Google Scholar]
- 21. Gaur S, Dumyati G, Nace DA, Jump RLP. Unprecedented solutions for extraordinary times: helping long‐term care settings deal with the COVID‐19 pandemic. Infect Control Hosp Epidemiol. 2020;41(6):729‐730. [DOI] [PMC free article] [PubMed] [Google Scholar]
- 22. McGregor M, Harrington C. COVID‐19 and long‐term care facilities: does ownership matter? CMAJ. 2020;192:e961‐e962. [DOI] [PMC free article] [PubMed] [Google Scholar]
- 23. Nursing Home Compare . https://www.medicare.gov/nursinghomecompare/Data/About.html. Accessed August 10, 2020.
- 24. True, S , Neuman T, Cubanski J, Ochleng N, Koma W. Under the Radar: States Vary in Regulating and Reporting COVID‐19 in Assisted Living Facilities. Kaiser Family Foundation; 2020. https://www.kff.org/coronavirus-covid-19/issue-brief/under-the-radar-states-vary-in-regulating-and-reporting-covid-19-in-assisted-living-facilities/. Accessed July 8, 2020.
- 25. CDC . Preparing for COVID‐19: long‐term care facilities, nursing homes. 2020. https://www.cdc.gov/coronavirus/2019-ncov/hcp/long-term-care.html. Accessed June 10, 2020.
- 26. Kossover RA, Chi CJ, Wise ME, Tran AH, Chande ND, Perz JF. Infection prevention and control standards in assisted living facilities: are residents' needs being met? J Am Med Dir Assoc. 2014;15:47‐53. [DOI] [PMC free article] [PubMed] [Google Scholar]
- 27. Spanko A. HHS releases $4.9B in COVID‐19 relief for skilled nursing facilities. 2020. https://skillednursingnews.com/2020/05/hhs-releases-4-9b-in-covid-19-relief-for-skilled-nursing-facilities/. Accessed May 24, 2020.
- 28. Berklan JM. Feds increase COVID‐19 funding dedicated to nursing homes to nearly $10 billion. July 22, 2020. https://www.mcknights.com/news/breaking-feds-increase-covid-19-funding-dedicated-to-nursing-homes-to-nearly-10-billion/. Accessed July 22, 2020.
- 29. Bowers L. HHS announces $15 billion in COVID‐19 relief funding for assisted living operators, others. McKinghtʼs Senior Living, 2020. https://www.mcknightsseniorliving.com/home/news/hhs-announces-15-billion-in-covid-19-relief-funding-for-assisted-living-operators-others/. Accessed June 15, 2020.
Associated Data
This section collects any data citations, data availability statements, or supplementary materials included in this article.
Supplementary Materials
Supplementary Appendix S1: State sources of COVID‐19 data.