

Abstract
Angiotensin‐converting enzyme 2 (ACE2) has been identified as the functional receptor of severe acute respiratory syndrome coronavirus 2 (SARS‐CoV‐2) and a target for disease prevention. However, the relationship between ACE2 expression and its clinical implications in SARS‐CoV‐2 pathogenesis remains unknown. Here, we explored the location and expression of ACE2, and its correlation with gender, age, and cigarette smoke (CS), in a CS‐exposed mouse model and 224 non‐malignant lung tissues (125 non‐smokers, 81 current smokers, and 18 ex‐smokers) by immunohistochemistry. Moreover, the correlations of ACE2 with CS‐induced oxidative stress‐related markers, hypoxia‐inducible factor‐1α (HIF‐1α), inducible nitric oxide synthase (iNOS), and 4‐hydroxynonenal (4‐HNE) were investigated. Chromatin immunoprecipitation and luciferase reporter assays identified the cause of ACE2 overexpression in human primary lung epithelial cells. We demonstrated that ACE2 was predominantly overexpressed on the apical surface of bronchial epithelium, while reduced in alveolar epithelium, owing to the dramatically decreased abundance of alveolar type II pneumocytes in CS‐exposed mouse lungs. Consistent with this, ACE2 was primarily significantly overexpressed in human bronchial and alveolar epithelial cells in smokers regardless of age or gender. Decreased ACE2 expression was observed in bronchial epithelial cells from ex‐smokers compared with current smokers, especially in those who had ceased smoking for more than 10 years. Moreover, ACE2 expression was positively correlated with the levels of HIF‐1α, iNOS, and 4‐HNE in both mouse and human bronchioles. The results were further validated using a publicly available dataset from The Cancer Genome Atlas (TCGA) and our previous integrated data from Affymetrix U133 Plus 2.0 microarray (AE‐meta). Finally, our results showed that HIF‐1α transcriptionally upregulates ACE2 expression. Our results indicate that smoking‐induced ACE2 overexpression in the apical surface of bronchial epithelial cells provides a route by which SARS‐CoV‐2 enters host cells, which supports clinical relevance in attenuating the potential transmission risk of COVID‐19 in smoking populations by smoking cessation. © 2020 The Pathological Society of Great Britain and Ireland. Published by John Wiley & Sons, Ltd.
Keywords: ACE2, cigarette smoke, bronchial epithelial cells, alveolar epithelial cells, SARS‐CoV‐2, COVID‐19
Introduction
Since late December 2019, the emergence of coronavirus disease 2019 (COVID‐19) caused by severe acute respiratory syndrome coronavirus 2 (SARS‐CoV‐2) and its rapid international spread have posed a global health threat [1]. As of 4 September 2020, the pandemic accounts for 26 121 999 cases and 864 618 deaths worldwide [2]. SARS‐CoV‐2 greatly resembles SARS‐CoV, but is distinguished by its strikingly higher reproductive number and human‐to‐human transmission potential, targeting epithelial cells of the respiratory tract for its entry and replication [3]. The highly aggressive and contagious SARS‐CoV‐2 was identified by the furin activation sites in SARS‐CoV‐2 spike proteins and key receptors on host cells [4]. A novel metallopeptidase named angiotensin‐converting enzyme 2 (ACE2) has recently been identified as the functionally sufficient cell‐entry receptor for SARS‐CoV‐2, the same receptor as that for SARS‐CoV and human respiratory coronavirus NL63‐CoV [5, 6]. SARS‐CoV‐2 attaches to ACE2, which mediates the subsequent fusion between the viral envelope and the host cell membrane through receptor‐mediated endocytosis, thereby allowing viral entry into host cells. ACE2 is believed to be a prime target to determine cell susceptibility of SARS‐CoV‐2, as well as disease pathogenesis and clinical intervention.
ACE2 was physiologically defined as a negative regulator of the renin–angiotensin system (RAS), a facilitator of amino acid transport, and a functional receptor for SARS‐CoV‐2 and SARS‐CoV [7]. ACE2 mRNA was reported to be expressed in 72 healthy human tissues by using RT‐PCR [8], and in all major cell types along normal airway epithelium using single‐cell RNA‐sequencing (RNA‐seq) [9]. Zhao et al demonstrated that ACE2 was mainly expressed in human alveolar type II (ATII) cells, alveolar type I (ATI) cells, bronchial epithelial cells, fibroblasts, endothelial cells, and macrophages in the respiratory system [10]. Using immunohistochemistry (IHC) assays, ACE2 was detected in human tissues from 15 different organs, with marked immunostaining in ATI and ATII cells of normal lungs, and weak positive staining in the cytoplasm of bronchial epithelial cells [11]. Duclos et al found much higher expression of ACE2 in airway mucus cells than in other epithelial cells, including alveolar cells [12]. However, factors inducing the expression of ACE2 and its potential clinical implications and mechanisms remain largely unclear. The latest transcriptomic database analysis revealed cigarette smoking (CS) or nicotine‐induced upregulation of ACE2 expression, indicating its pathogenic role in facilitating virus entry [13, 14, 15, 16]. Cai et al found that smoking remodeled cells in the bronchial epithelium, with loss of club cells and extensive hyperplasia of goblet cells; ACE2 is mainly expressed in goblet cells in smokers and club cells in never‐smokers [17, 18]. Conversely, several studies have demonstrated ACE2 downregulation after infection, implying its protective role in alleviating inflammation and disease severity [19, 20], via its multifaceted role in ACE/ACE2 homeostasis within the RAS, which converts angiotensin II to angiotensin‐(1–7) [21, 22]. Aveyard et al concluded that CS and/or nicotine might downregulate ACE2 in certain lung cells [23]. Therefore, a systematic investigation of the levels of functional ACE2 protein and its possible regulatory mechanisms in human lung samples and its potential clinicopathological significance in the current COVID‐19 pandemic is of paramount importance.
In this study, we systemically explored the expression pattern of ACE2 in relation to gender, age, smoking history, and its potential clinical implications. We determined the effect of CS on ACE2 expression using IHC analyses of a well‐established CS‐exposed mouse model and 224 non‐malignant human lung tissues. Furthermore, the expression of oxidative stress‐related genes and their correlation with ACE2 expression were investigated. On the basis of previous clinical case reports, this study aimed to provide evidence for understanding the impact of CS on ACE2 expression and to assess the potential effect on smokers, who may be more susceptible to COVID‐19 infection, in order to provide deeper understanding of the population disparities and pathogenesis of COVID‐19 in smoking populations.
Materials and methods
Patients and non‐malignant human lung tissues
A total of 224 paraffin‐embedded non‐malignant human lung tissues from 125 non‐smokers, 81 current smokers, and 18 ex‐smokers were collected during bronchoscopy, percutaneous lung biopsy or surgery at the Affiliated Jiangmen Hospital of Sun Yat‐sen University (Jiangmen, Guangdong, PR China) between January 2008 and December 2019. The 125 lung tissues from non‐smokers were defined as the relative healthy control group. Among current smokers, heavy smokers (n = 38) were defined as individuals with ≥20 pack‐years (1 pack year = 1 pack per day for 1 year); light smokers (n = 43) were defined as <20 pack‐years. Ex‐smokers were divided into those who had ceased smoking for more than 10 years (n = 8) and those who had ceased for less than 10 years (n = 10). The tissue fragments were from microscopically normal lung tissue, sampled distant from lesion areas. Clinicopathological features of the patients were defined by two pathologists and are summarized in Table 1, including 191 pulmonary bullae, 22 hamartomas, five congenital cystic adenomatoid malformations (CCAMs), five pneumothoraces, and one bronchopulmonary sequestration (BPS). Patient consent and approval from the Institutional Research Ethics Committee of the Affiliated Jiangmen Hospital of Sun Yat‐sen University were obtained (Approval number: 2020‐13).
Table 1.
Clinical characteristics of 224 non‐malignant human lung disease subjects available for IHC analyses.
| Cases (n) | % | ||
|---|---|---|---|
| Histology | Pulmonary bulla | 191 | 85.3 |
| Hamartoma | 22 | 9.8 | |
| CCAM | 5 | 2.2 | |
| Pneumothorax | 5 | 2.2 | |
| BPS | 1 | 0.5 | |
| Gender | Female | 91 | 40.6 |
| Male | 133 | 59.4 | |
| Age, years | Younger (0–19) | 32 | 14.3 |
| Middle‐aged (20–59) | 132 | 58.9 | |
| Older (≥60) | 60 | 26.8 | |
| Smoking status | Non‐smoker | 125 | 55.8 |
| Current smoker | 81 | 36.2 | |
| Ex‐smoker | 18 | 8.0 | |
| Smoking history (pack‐years) | <20 | 43 | 53.1 |
| ≥20 | 38 | 46.9 | |
BPS, bronchopulmonary sequestration; CCAM, congenital cystic adenomatoid malformation.
Immunohistochemistry (IHC)
IHC analysis was performed to examine ACE2, hypoxia‐inducible factor‐1α (HIF‐1α), inducible nitric oxide synthase (iNOS) expression, and 4‐hydroxynonenal (4‐HNE) levels in mouse lung tissues and 224 paraffin‐embedded and archived non‐malignant human lung tissues, using specific antibodies from Abcam (ACE2: ab108252, 1:400 dilution; HIF‐1α: ab51608, 1:1600 dilution; iNOS: ab3523, 1:100 dilution; 4‐HNE: ab48506, 1:800 dilution; Abcam, Cambridge, MA, USA). Human lung tissues were stained with cell type‐specific markers: surfactant protein C (SFTPC, ATII cell marker, 10774‐1‐AP, 1:1600 dilution; Proteintech, Wuhan, Hubei, PR China); CD68 (pulmonary alveolar macrophage marker, 28058‐1‐AP, 1: 1500 dilution; Proteintech); CC10 (club cell marker, 10490‐1‐AP, 1:400 dilution; Proteintech); and Ac‐α‐tubulin (ciliated cell marker, ab179484, 1:2000 dilution; Abcam). The IHC procedures and expression scoring were as described previously [24, 25]. Two experienced independent investigators blindly determined the staining index (SI); these indexes were averaged for further comparative evaluation of ACE2 expression. The detailed scoring criteria for SI are presented in Table 2. Images were collected under 10× and 40× objective magnification in human lung tissues, and 20× and 63× magnification in mouse lung tissues using M8 Digital Microscopy (PreciPoint, Freising, Bavaria, Germany).
Table 2.
Staining index (SI) score criteria for ACE2, HIF‐1α, iNOS, and 4‐HNE expression.
| Expression level | SI | Positive epithelial cell proportion score (%) | Staining intensity score |
|---|---|---|---|
|
Low expression (SI ≤ 4) |
0 | 0 (0) | 0 (no staining) |
| 1 | 1 (<10%) | 1 (weak staining, light yellow) | |
| 2 | 2 (10–35%) | 1 (weak staining, light yellow) | |
| 1 (<10%) | 2 (moderate staining, yellow brown) | ||
| 3 | 1 (<10%) | 3 (strong staining, brown) | |
| 3 (35–70%) | 1 (weak staining, light yellow) | ||
|
High expression (SI ≥ 6) |
6 | 2 (10–35%) | 3 (strong staining, brown) |
| 3 (35–70%) | 2 (moderate staining, yellow brown) | ||
| 8 | 4 (>70%) | 2 (moderate staining, yellow brown) | |
| 9 | 3 (35–70%) | 3 (strong staining, brown) | |
| 12 | 4 (>70%) | 3 (strong staining, brown) |
SI was calculated by multiplying the positive epithelial cells proportion score by the staining intensity score. For lung bronchial epithelial cells, nine fields in each sample were randomly selected, and the SI was calculated as the average of all scored fields. For lung alveolar epithelial cells, four integrated pulmonary alveoli were randomly selected in each biopsy, and the SI was expressed as the average of all scored pulmonary alveoli of biopsies in every group.
Animal study
The animal study was approved by the Ethical Committee of Xiangya Hospital, Central South University (Approval number: 201703654). Five‐ to 6‐week‐old male C57BL/6 mice (20 ± 2 g) were randomly divided into a CS group and a non‐smoking group. CS group mice were exposed to 20 commercial, non‐filtered cigarettes (each containing 14.0 mg of tar and 1.0 mg of nicotine), with five cigarettes each time, four times per day with 30‐min smoke‐free intervals in a ventilated whole‐body smoking glass chamber (69 cm × 47 cm × 38 cm) 6 days per week for 1, 4, or 8 months. The control non‐smoking group was exposed to fresh air in a similar chamber for the same duration. Mice were sacrificed by cervical dislocation after 1, 4, or 8 months of exposure. Lungs from each group were dissected and fixed with 4% paraformaldehyde. All tissues were finally paraffin wax‐embedded for IHC analysis, following the same protocol as the clinical samples.
Detailed methods for Cells and cell culture; Plasmids, small interfering RNA, and transfection; Preparation of cigarette smoke extract (CSE); Cell treatments; Western blotting analyses; Chromatin immunoprecipitation (ChiP); Dual luciferase reporter experiments; and High‐throughput data processing and visualization are presented in Supplementary materials and methods. The list of primers used in cloning reactions is presented in Table 4 and the primers used to detect DNA fragments in ChIP assays are described in Table 5, respectively.
Table 4.
List of primers used in the PCR reactions for cloning.
| Gene primer name | Sequence (5'–3') |
|---|---|
| ACE2‐up | gccGCTAGCgccATGGACTACAAGGACGACGATGACAAGTCAAGCTCTTCCTGGCTCCT |
| ACE2‐dn | gccTCTAGACTAAAAGGAGGTCTGAACAT |
| HIF‐1α‐up | gccGCTAGCgccATGGACTACAAGGACGACGATGACAAGAGCTCCCAATGTCGGAGTTT |
| HIF‐1α‐dn | gccTCTAGATCAGTTAACTTGATCCAAAG |
| ACE2‐FL‐up | gccGCTAGCgccAACAGGTCTTCGGCTTCG |
| ACE2‐FL‐dn | gccAAGCTTCACTGTAGACTATTCTCCCT |
| ACE2‐F1‐up | gccGCTAGCgccAACAGGTCTTCGGCTTCG |
| ACE2‐F1‐dn | gccAAGCTTTTCCGTGTATCTTTAACAGC |
| ACE2‐F2‐3‐up | gccGCTAGCgccTTCCGTGTATCTTTAACAGC |
| ACE2‐F2‐3‐dn | gccAAGCTTTGACCTGTGGAGTGGAGA |
| ACE2‐F4‐up | gccGCTAGCgccTGACCTGTGGAGTGGAGA |
| ACE2‐F4‐dn | gccAAGCTTAGGAAAAGCAGTGGACAT |
| ACE2‐F5‐up | gccGCTAGCgccAGGAAAAGCAGTGGACAT |
| ACE2‐F5‐dn | gccAAGCTTCACTGTAGACTATTCTCCCT |
Table 5.
List of primers used in the reactions for ChIP assay.
| Gene primer name | Sequence (5'–3') | |
|---|---|---|
| ACE2‐P1 | Forward | AACAGGTCTTCGGCTTCG |
| Reverse | GAGGTTTTAGTCTAGGGA | |
| ACE2‐P2‐3 | Forward | GCTGGGACTACAGGTGCC |
| Reverse | CATGGAAATTAAAACTGATCA | |
| ACE2‐P4 | Forward | AAACTCAGTCAAGGTCAC |
| Reverse | TACATACACTCTGGCAAT | |
| ACE2‐P5 | Forward | CCACATTCCAGGAAACCT |
| Reverse | TTTGGACTACTCCCATTT | |
Statistical analyses
For variables with a normal distribution, Student's t‐test was used to determine statistical differences between two groups. One‐way ANOVA was used to determine statistical differences between multiple groups. Spearman's correlation analysis was used to estimate the correlations between ACE2 expression and HIF‐1α, iNOS, and 4‐HNE. For categorical data, the chi‐squared test was used to analyze the relationship between ACE2 expression and clinicopathological characteristics (gender, age, smoking status, and smoking history). Continuous variables without normal distribution are presented as median and interquartile range. Significance of differences was assessed using a non‐parametric test (Mann–Whitney U‐test). In vitro experiments were repeated three times, and data are presented as the mean ± SD. p < 0.05 was considered significant. All analyses were performed using SPSS 23.0 software (IBM Corp, Chicago, IL, USA) and diagrams were drawn using GraphPad Prism 8.0 software (GraphPad Inc, San Diego, CA, USA).
Results
Smoking‐induced ACE2 upregulation is predominately expressed in bronchial, not alveolar, epithelial cells
As is well known, ACE2 has been extensively reported to be the sufficient cell‐entry receptor for several coronaviruses, including SARS‐CoV‐2, SARS‐CoV, and NL63‐CoV [5, 6], and smoking is a well‐established risk factor for respiratory infection by various pathogens [26, 27, 28, 29]. However, evidence for a correlation between ACE2 expression and smoking remains scant. First, a CS‐exposed mouse model was established based on our previous project to examine the effects of CS on ACE2 expression. As shown in Figure 1A, apparent emphysema changes were observed in the lung sections as characterized by enlargement and destruction of the alveolar walls, and infiltrated inflammatory cells marked with CD68 in the alveolar septum and alveolar cavity following 4 and 8 months of CS exposure. Notably, we found that ACE2 staining intensity was increased in mouse alveolar epithelial cells after 4 and 8 months in the CS group (Figure 1A and supplementary material, Figure S1A), but ACE2 expression was significantly downregulated in alveolar epithelial cells in the 8‐months CS group compared with the non‐smoking group (p = 0.032), which was not found in the alveolar epithelial cells from the 1‐month and 4‐months mouse groups (Figure 1A,B). Furthermore, we found that the SFTPC marker in ATII pneumocytes was reduced in alveolar epithelial cells after at least 4 months duration of CS exposure (Figure 1C). This finding suggests that CS‐induced ACE2 downregulation in alveolar epithelial cells may be caused by the decreased quantity of ATII cells.
Figure 1.
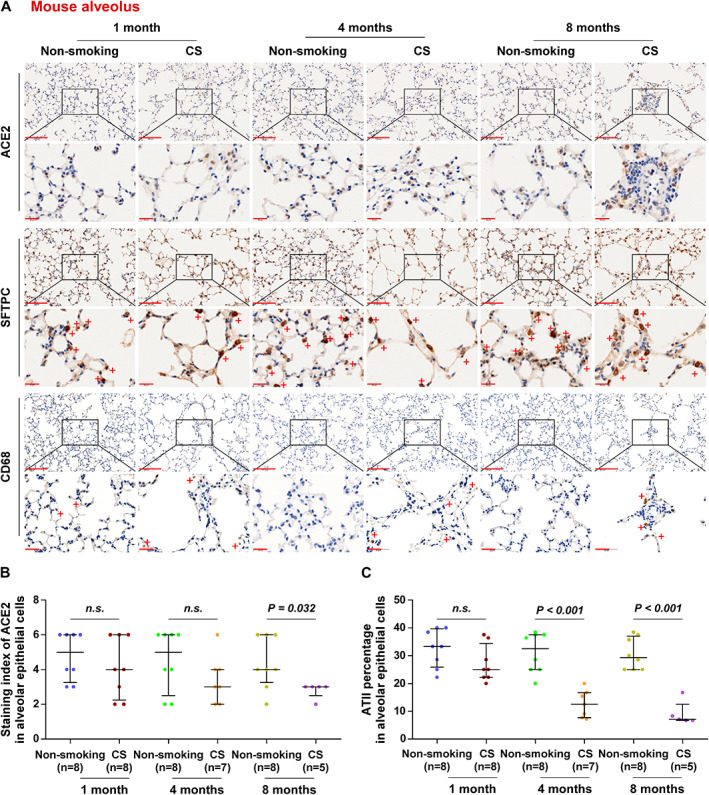
Overall expression of ACE2 is downregulated in lung alveolar epithelial cells of mice exposed to CS. (A) Representative images of ACE2, SFTPC, and CD68 immunostaining of lung alveolar sections from mice in non‐smoking (1 month, n = 8; 4 months, n = 8; 8 months, n = 8) and cigarette smoke‐exposure (CS, 1 month, n = 8; 4 months, n = 7; 8 months, n = 5) groups. (B) Staining index of ACE2 in lung alveolar epithelial cells from different exposure groups. (C) The percentage of ATII cells as assessed by SFTPC staining of alveolar epithelial cells. Exact P values are shown above each graph. n.s., not significant. Scale bars: upper panel, 100 μm; lower panel, 20 μm.
Since the extent and location of ACE2 in lung tissues under physiological and pathological conditions remain controversial, we performed a systematic investigation of ACE2 protein levels in lung tissues. In‐depth analysis of ACE2 expression in lung tissues revealed that ACE2 expression was remarkably upregulated in bronchial epithelial cells marked with CC10 for club cells and Ac‐α‐tubulin for ciliated cells from the CS‐exposed mice, even in the bronchial epithelial cells from the 1‐month CS‐exposed mouse groups (Figure 2A,B). These findings indicated that the net result of CS enables the upregulation of ACE2, although reduced ACE2 expression was found in alveolar epithelial cells after longer durations of CS exposure (8 months). Collectively, our results indicate that ACE2 upregulation induced by smoking is predominantly in bronchial cells, rather than in alveolar epithelial cells in mouse lung tissues.
Figure 2.
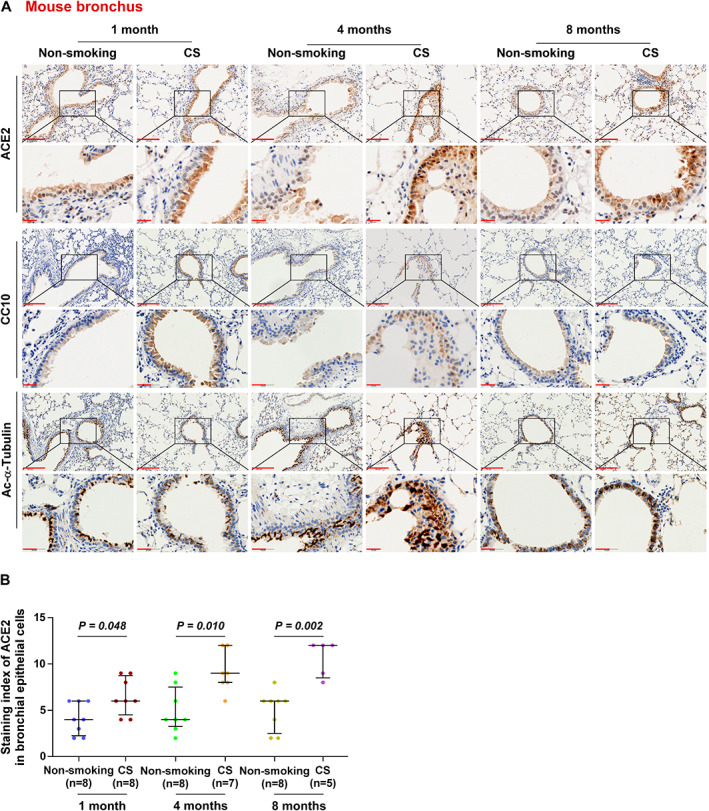
ACE2 is significantly overexpressed in bronchial epithelial cells of mice exposed to CS. (A) Representative images of ACE2, CC10, and Ac‐α‐tubulin immunostaining of lung bronchial tissues from mice in non‐smoking (1 month, n = 8; 4 months, n = 8; 8 months, n = 8) and cigarette smoke‐exposure (CS, 1 month, n = 8; 4 months, n = 7; 8 months, n = 5) groups. (B) Staining index of ACE2 in bronchioles from the different groups. Exact P values are shown above each graph. Scale bars: upper panel, 100 μm; lower panel, 20 μm.
ACE2 expression positively correlates with the expression of the CS‐induced oxidative stress‐related markers HIF‐1α, iNOS, and 4‐HNE in mouse bronchioles, rather than in mouse alveoli
CS contains a considerable number of reactive oxygen species, which accelerate apoptosis of alveolar epithelial cells and enhance inflammatory responses by causing oxidative stress [30]. To further explore CS‐induced oxidative stress and its association with ACE2 expression, we examined the expression of several oxidative stress biomarkers, including HIF‐1α, iNOS, and 4‐HNE, in mouse bronchioles and alveoli. HIF‐1α and iNOS expression was continuously increased in bronchial epithelial cells from 4 months to 8 months in the CS group, and 4‐HNE levels were steadily upregulated from 1 month to 8 months in the CS group (Figure 3A, supplementary material, Figure S1B–D). In mouse alveoli, HIF‐1α expression was continuously increased from 4 months to 8 months in the CS group, and iNOS and 4‐HNE expression was significantly increased at 8 months in the CS group (supplementary material, Figure S2A–D). Furthermore, we found that HIF‐1α and 4‐HNE levels were differentially upregulated in bronchioles with high ACE2 expression compared with those with low ACE2 expression (Figure 3B–D). However, due to the downregulation of ACE2 expression in CS‐exposed alveolar epithelial cells, levels of HIF‐1α, iNOS, and 4‐HNE were not significantly different in alveoli with high ACE2 expression compared with those with low ACE2 expression (supplementary material, Figure S2E–G). Spearman's correlation analysis showed that the staining index (SI) of ACE2 was positively correlated with that of HIF‐1α (r = 0.478, p = 0.001), iNOS (r = 0.312, p = 0.039), and 4‐HNE (r = 0.584, p < 0.001) (Figure 3E–G) in bronchioles. In alveoli, ACE2 expression showed no correlation with levels of HIF‐1α, iNOS, and 4‐HNE (supplementary material, Figure S2H,I). These results suggest that ACE2 expression is positively correlated with the levels of HIF‐1α, iNOS, and 4‐HNE in mouse bronchioles in the context of CS exposure.
Figure 3.
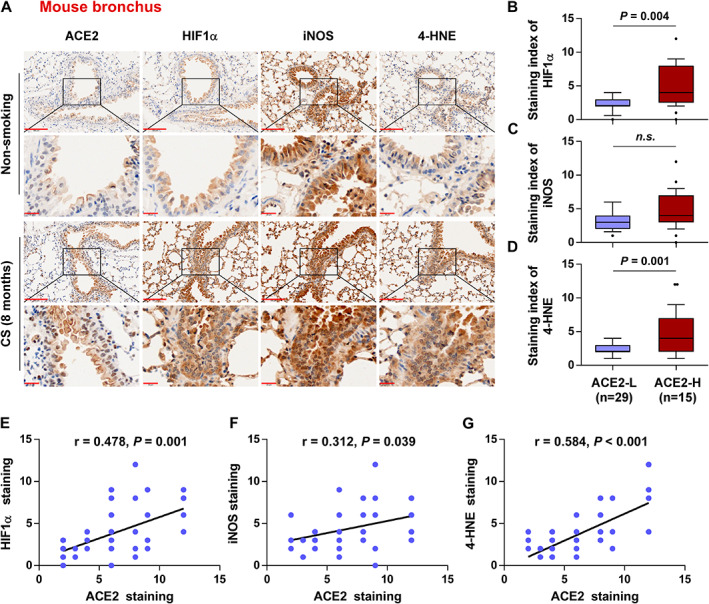
ACE2 expression positively correlates with the levels of CS‐induced oxidative stress‐related markers HIF‐1α, iNOS, and 4‐HNE in mouse bronchioles. (A) Representative images of ACE2, HIF‐1α, iNOS, and 4‐HNE immunostaining in lung bronchial tissues in non‐smoking (n = 8) and CS (n = 5) mouse groups exposed for 8 months. (B–D) Levels of HIF‐1α (B), iNOS (C), and 4‐HNE (D) in ACE2‐low (n = 29) and ACE2‐high (n = 15) tissues. (E–G) Correlation of ACE2 expression with the levels of HIF‐1α (E), iNOS (F), and 4‐HNE (G) in mouse bronchioles. Exact P values are shown above each graph. n.s., not significant. Scale bars: upper panel, 100 μm; lower panel, 20 μm.
ACE2 is significantly overexpressed in human lung epithelial cells of non‐malignant lung tissues with a smoking history
The clinical correlation of ACE2 expression with smoking history was validated by evaluating ACE2 expression in 224 non‐malignant lung tissues, including 125 non‐smokers, 81 current smokers, and 18 ex‐smokers, using IHC. As shown in Figure 4A,B and Table 3, ACE2 expression was significantly increased in bronchial epithelial cells both in current smokers and in ex‐smokers compared with non‐smokers, and was significantly correlated with pack‐years of smoking. Moreover, ACE2 expression was significantly decreased in human bronchial epithelial cells from ex‐smokers compared with that from current smokers, particularly in those who had ceased smoking for more than 10 years (p = 0.024, Figure 4A,B). Consistent with this, analyses of The Cancer Genome Atlas (TCGA) and Affymetrix U133 Plus 2.0 microarray (AE‐meta) datasets showed that ACE2 expression was increased in the whole lung tissues of smokers compared with non‐smokers, and was significantly decreased in ex‐smokers who had ceased smoking for more than 10 years compared with that in current smokers (Figure 4C,D). Further analysis revealed that smoking history was also associated with a significantly elevated level of ACE2 expression in both male and female subgroups, and in different‐aged groups of patients, compared with that in non‐smokers (supplementary material, Figure S3A,B). However, neither non‐smokers nor smokers showed significant differences in ACE2 expression between separate female and male groups (supplementary material, Figure S3A and Table 3), or between young, middle‐aged, and elderly groups (supplementary material, Figure S3B and Table 3), which was further supported by the findings of two independent datasets from the TCGA and AE‐meta (supplementary material, Figure S3C–F). Additionally, ACE2 expression showed a generally upward trend in human alveoli in smokers, compared with non‐smokers, which was particularly marked with SFTPC and CD68 (supplementary material, Figure S4A,B). Surprisingly, we found that smoking had no significant influence on the number of alveolar epithelial cells (supplementary material, Figure S4C), which was contradictory to the findings presented in Figure 1 in smoke‐exposed mouse AT2 cells. Further analysis revealed that neither non‐smokers nor smokers showed significant differences in ACE2 expression between separate female and male groups (supplementary material, Figure S4D), or between young, middle‐aged, and elderly groups (supplementary material, Figure S4E) in human alveoli. Furthermore, the expression of ACE2 in primary human small airway epithelial (PHSAE) cells and primary human type II alveolar epithelial (PHATII) cells was examined in the presence and absence of CSE treatment by western blotting. As shown in supplementary material, Figure S5, ACE2 expression was upregulated in both cell lines after CSE treatment. Therefore, our results show the clinical positive correlation of smoking with ACE2 expression in human non‐malignant lung tissues regardless of age or gender status.
Figure 4.
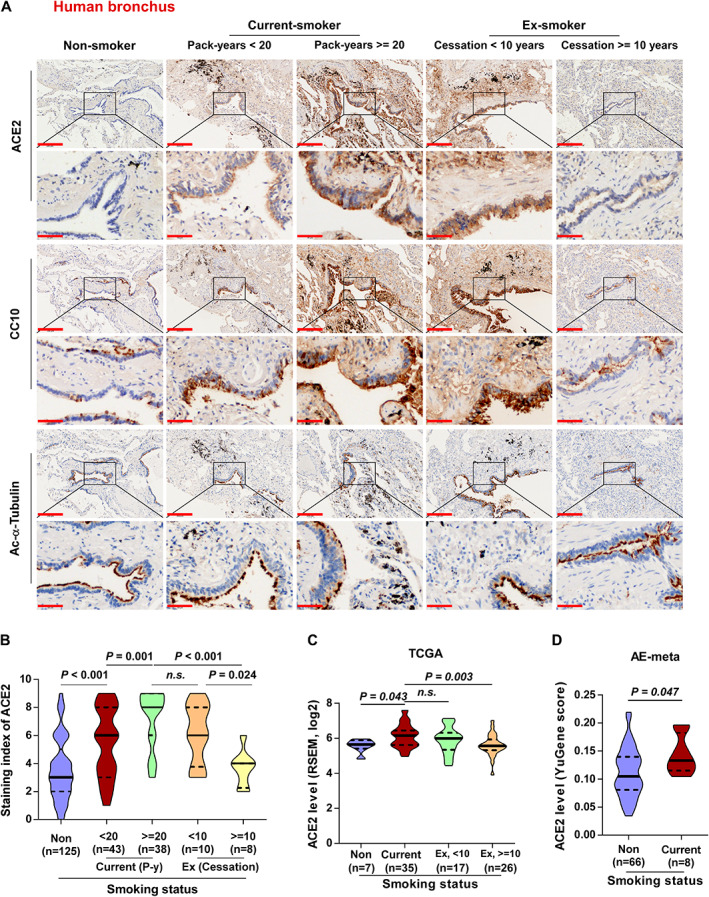
ACE2 is significantly overexpressed in human bronchial epithelial cells of non‐malignant lung tissues with a smoking history. (A) Representative images of ACE2 immunostaining of bronchi of lung tissues in non‐smoker (n = 125), current smoker (pack‐years < 20, n = 43; pack‐years ≥ 20, n = 38), and ex‐smoker (smoking cessation < 10 years, n = 10; smoking cessation ≥ 10 years, n = 8) groups classified by smoking pack‐years and cessation time. (B) Statistical analysis of ACE2 staining index classified by different smoking status. (C) mRNA expression of ACE2 in non‐smoker (n = 7), current smoker (n = 35), and ex‐smoker (ceased smoking less than 10 years ago, n = 17; ceased more than 10 years ago, n = 26) groups of normal lung tissues from the TCGA dataset. (D) mRNA expression of ACE2 in non‐smoker (n = 66) and current smoker (n = 8) groups of normal lung tissues from the AE‐meta dataset. Exact P values are shown above each graph. n.s., not significant. Scale bars: upper panel, 200 μm; lower panel, 50 μm.
Table 3.
Relationship between ACE2 expression level and clinicopathological characteristics in 224 adjacent normal lung tissues from benign human lung disease subjects.
| Parameters | Total | ACE2 IHC expression | P values* † | |
|---|---|---|---|---|
| Low (n = 130) | High (n = 94) | |||
| Gender (number of cases) | ||||
| Female | 92 | 56 | 36 | 0.473 |
| Male | 132 | 74 | 58 | |
| Age (number of cases) | ||||
| Younger | 32 | 16 | 16 | 0.069 |
| Middle‐aged | 132 | 85 | 47 | |
| Older | 60 | 29 | 31 | |
| Smoking status (number of cases) | ||||
| Non‐smoker | 125 | 94 | 31 | <0.0001 † |
| Current smoker | 81 | 26 | 55 | |
| Ex‐smoker | 18 | 10 | 8 | |
|
Smoking history (pack‐years) Mean (SD) |
||||
| <20 | 11.9 (5.7) | 9 (5.3) | 14.0 (5.1) | 0.003 * |
| ≥20 | 35.4 (7.8) | 29.5 (7.8) | 37.0 (7.1) | 0.022 * |
Data for gender, age, and smoking status are presented as number of cases.
Significant differences (p ˂ 0.05) were determined using non‐parametric (Mann–Whitney U) testing. P values in bold are statistically significant.
Significant differences (p ˂ 0.05) were determined using the chi‐square test. Data for smoking history (pack‐years) are presented as mean ± SD.
ACE2 expression positively correlates with the expression of CS‐induced oxidative stress‐related markers in human lung epithelial cells of non‐malignant lung tissues
Consistent with the above relationships between ACE2 and oxidative stress‐related biomarkers in mice, the levels of HIF‐1α, iNOS, and 4‐HNE were significantly elevated in smokers compared with non‐smokers in human bronchial epithelial cells of non‐malignant lung tissues (Figure 5A–D). The levels of HIF‐1α, iNOS, and 4‐HNE were upregulated in bronchial tissues with high ACE2 expression compared with those with low ACE2 expression (Figure 5E–G). Consistent with this, Spearman's correlation analysis showed that the 4‐HNE staining had the strongest positive correlation with ACE2 staining (p < 0.001, r = 0.683) compared with that for HIF‐1α (p < 0.001, r = 0.583) or iNOS (p < 0.001, r = 0.389) (Figure 5H–J). Moreover, the levels of HIF‐1α, iNOS, and 4‐HNE were significantly elevated in smokers compared with non‐smokers in human alveolar cells of clinical non‐malignant lung tissues (supplementary material, Figure S6A–D). While HIF‐1α was differentially upregulated, iNOS and 4‐HNE levels were not significantly different in human alveoli with high ACE2 expression compared with those with low ACE2 expression (supplementary material, Figure S6E–G), and ACE2 expression was positively correlated with that of HIF‐1α (r = 0.391, p < 0.001) and showed no correlation with iNOS or 4‐HNE (supplementary material, Figure S6H,I). These results indicate that ACE2 expression is positively correlated with the expression of HIF‐1α in both human bronchial and alveolar cells, and is positively correlated with the levels of iNOS and 4‐HNE in human bronchial epithelial cells in the context of CS exposure (Table 4).
Figure 5.
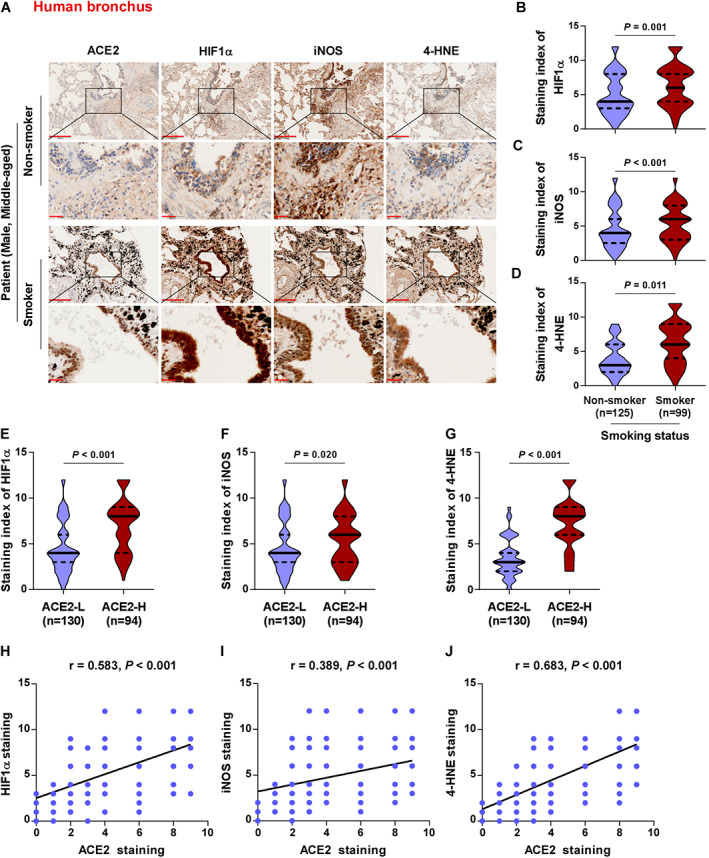
ACE2 expression positively correlates with the levels of CS‐induced oxidative stress‐related markers HIF‐1α, iNOS, and 4‐HNE in human bronchial epithelial cells of lung tissues. (A) Representative images of ACE2, HIF‐1α, iNOS, and 4‐HNE immunostaining of human lung bronchial tissues in non‐smoker (n = 125) and smoker (n = 99) groups are shown. (B–D) Levels of HIF‐1α (B), iNOS (C), and 4‐HNE (D) in non‐smoker (n = 125) and smoker (n = 99) tissues. (E–G) Levels of HIF‐1α (E), iNOS (F), and 4‐HNE (G) in ACE2‐low (n = 130) and ACE2‐high expression (n = 94) tissues. (H–J) Correlation of ACE2 expression with the levels of HIF‐1α (H), iNOS (I), and 4‐HNE (J) in lung bronchial tissues with smoking history. Exact P values are shown above each graph. Scale bars: upper panel, 200 μm; lower panel, 50 μm.
HIF‐1α contributes to ACE2 overexpression in primary human lung epithelial cells
The above results showed that HIF‐1α, iNOS, and 4‐HNE were differently correlated with ACE2 overexpression. To determine which of these were particularly involved in upregulation of ACE2, we used CoCl2, cytomix, and 4‐HNE treatments, respectively, to mimic the increased levels of HIF‐1α, iNOS, and 4‐HNE in both PHSAE and PHATII cells. As shown in Figure 6A–C, upregulating HIF‐1α by CoCl2 treatment dramatically enhanced ACE2 expression, while cytomix and 4‐HNE treatment did not affect ACE2 expression. To further determine the underlying mechanism mediating the role of HIF‐1α in ACE2 upregulation, we exogenously overexpressed and endogenously silenced HIF‐1α in PHSAE and PHATII cells. Western blotting assays showed that upregulating HIF‐1α elevated, while inhibiting HIF‐1α reduced, ACE2 expression (Figure 6D). Through UCSC bioinformatics analysis and JASPAR2018 algorithms [31], we found five HIF‐1α binding motifs in the putative promoter region of ACE2 (Figure 6E). A ChIP assay showed that HIF‐1α had high affinity for the P2–3 and P5 binding sites in the promoter region of ACE2 in PHSAE and PHATII cells (Figure 6F). Consistently, enhanced luciferase activity of the ACE2 promoter was observed in HIF‐1α‐overexpressing primary lung cells (Figure 6G). Furthermore, we observed that the luciferase activity of ACE2 promoter fragments F2–3 and F5 was increased by HIF‐1α overexpression, but was not significantly influenced by fragments F1 and F4 (Figure 6G). Taken together, our results demonstrated that HIF‐1α transcriptionally upregulates ACE2 expression (Table 5).
Figure 6.
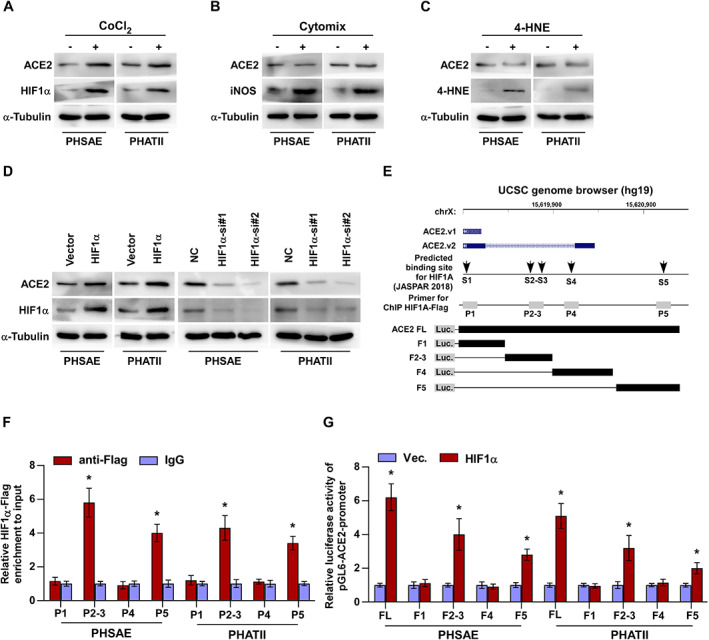
HIF‐1α contributes to ACE2 expression in primary human lung epithelial cells. (A–C) Western blotting for ACE2 expression after treatment of PHSAE and PHATII cells with (A) CoCl2, (B) cytomix, and (C) 4‐HNE. (D) Western blotting for ACE2 in PHSAE and PHATII cells with different expression of HIF‐1α. (E) HIF‐1α‐binding motifs in the putative promoter region of ACE2 in the UCSC genome browser. (F) ChIP analysis of the binding sites of HIF‐1α in the promoter region of ACE2 in PHSAE and PHATII cells. IgG was used as a negative control. Each bar represents the mean ± SD of three independent experiments. *p < 0.05. (G) Luciferase reporter activity of the ACE2 promoter [full length (FL) or truncations] in HIF‐1α‐overexpressing lung cells. Each bar represents the mean ± SD of three independent experiments. *p < 0.05.
Discussion
The critical findings of the current study provide novel insights into the potential cell entry route of virus during the pathogenesis of SARS‐CoV‐2 infection, mediated by ACE2 overexpression at the apical surface of bronchial epithelial cells in smokers. Here, we found that CS induced remarkable ACE2 overexpression on the apical surface of bronchial epithelial cells but reduced expression by alveolar epithelial cells in mouse lung tissues. Importantly, ACE2 was preferentially overexpressed in human bronchial and alveolar epithelial cells of non‐malignant lung tissues from patients with a smoking history. Our results further demonstrated that oxidative stress‐related indicators including HIF‐1α, 4‐HNE, and iNOS were increased in bronchial epithelium with high ACE2 expression, both in CS‐exposed mice and in tissues from human subjects. Moreover, we demonstrated that ACE2 was transcriptionally upregulated by HIF‐1α in PHSAE and PHATII cells. Collectively, our results may reveal the potentially increased risk of COVID‐19 infection among smoking populations.
The extent and location of ACE2 in lung tissues under physiological and pathological conditions remain controversial, despite the various studies published recently. Physiologically, ACE2 protein is reported to be expressed mainly by alveolar epithelial cells, especially ATII pneumocytes [10], while bronchial epithelial cells showed only minimal staining [11]. Another study demonstrated that ACE2 is expressed largely in tracheal and large airway epithelium, and minimally expressed in small airway epithelium [9]. Sungnak et al found ACE2 expression in multiple epithelial cell types across the airway, including ATII cells and notably high levels in nasal epithelial cells by using single‐cell RNA‐seq, with co‐expressed genes being involved in innate immunity, highlighting the potential role in initial viral infection, spread, and clearance [32]. Recently, studies have shown that the location and expression of ACE2 were dramatically affected by smoking status. Zhang et al demonstrated that ACE2 was transcriptionally upregulated by smoking in small airway epithelial cells, including basal, intermediate, club, mucus, and ciliated cells, while showing no correlation with smoking in tracheal and large airway epithelia [9]. Smith et al showed that CS causes a dose‐dependent upregulation of ACE2 in secretory club and goblet cells, ciliated cells, and ATII cells in rodent and human lungs by using single‐cell sequencing [33]. Controversially, after smoking exposure in a mouse model, ACE2 was found to be downregulated in alveolar epithelial cells in several independent studies [21, 22], as well as in ours, as indicated by the reduced ACE2 expression of alveolar epithelial cells due to the decreased number of ATII pneumocytes. Our results revealed that smoking dramatically upregulates ACE2 in the secretory club cells of the bronchial epithelium, which expressed a relatively low level of ACE2 under physiological conditions. Importantly, cigarette smoking exacerbates several pathological changes including oxidative stress, hypoxia, and inflammation, which may lead to the accumulation of HIF‐1α, iNOS, and 4‐HNE. In our study, we demonstrated that HIF‐1α transcriptionally upregulated ACE2 expression through binding its promoter. Consistent with this, Joshi et al identified that ACE2 was increased in a HIF‐1α‐dependent manner in CD34+ cells, which may contribute to vascular repair [34]. Therefore, the differential expression pattern of ACE2 in lung epithelial cells between physiological conditions and smoking status suggests that smoking‐induced overexpression of ACE2 may be inherently linked with smoking‐related disease and, consistent with that, COVID‐19 lung infiltrates located in distal small airways [35, 36, 37]. Importantly, our further subgroup analysis showed higher ACE2 expression in current smokers than in ex‐smokers, which may indicate the beneficial effect of smoking cession regarding reducing COVID‐19 susceptibility.
Recently, Hikmet et al presented a systematic evaluation of ACE2 protein expression in various tissue samples and cell lines, and revealed that ACE2 expression was lower in the normal respiratory tract than in other barrier tissues [38]. Nawijn and Timens further commented that although low protein expression level of ACE2 in upper airway epithelial cells maintains the infection potential of SARS‐CoV‐2, virus infection‐mediated interferon upregulation inducing a rapid increase of ACE2 expression in lower airways and lung parenchyma dramatically increased the infection risk and, meanwhile, set the stage for viral spread across the respiratory mucosa contributing to severe COVID‐19 [39]. This conclusion supported the idea that external factors, such as smoking, virus infection, and pre‐existing lung disease, might be considered to affect ACE2 location and expression, which are inherently associated with the increased infection risk of SARS‐CoV‐2. Thus, exploration of prevalent external factors that increase the infection risk of SARS‐CoV‐2, such as smoking identified in this study, will be beneficial for COVID‐19 prevention. Here, we found that ACE2 expression was limited in normal lung tissues without a smoking history, which was consistent with the finding from Hikmet et al [38]. However, smoking significantly triggered upregulation of ACE2. Mechanistic investigation further demonstrated that ACE2 overexpression was dependent on transcriptional upregulation of HIF‐1α. Therefore, our results might provide a clue that the smoking population may show increased risk for SARS‐CoV‐2 infection, though a more solid conclusion regarding the correlation of smoking with ACE2 expression and SARS‐CoV‐2 infection should be investigated in prospective studies.
The risk of SARS‐CoV‐2 infection was significantly increased in patients with pulmonary emphysema. Obstructive ventilation may very likely cause prolonged exposure of alveolar epithelial cells to virus‐containing air, even with reduced numbers of ACE2‐positive cells due to a decrease in ATII cells in CS‐exposed mice in our study. Very interestingly, we found that smoking had no significant influence on the number of human ATII cells, which was contrary to the finding in smoke‐exposed mouse ATII cells. Furthermore, smoking differentially increased expression of ACE2 in alveolar epithelial cells and macrophages in human lung tissues. Therefore, in the clinical scenario, it is conceivable that the risk of SARS‐CoV‐2 infection was markedly higher in patients with pulmonary emphysema, due to prolonged exposure of alveolar epithelial cells to possible virus‐containing inhaled air combined with the increased presence of ACE2‐positive cells.
Limitations of our study should be highlighted when interpreting and extrapolating our data. A more solid conclusion regarding the correlation of smoking with SARS‐CoV‐2 should be investigated in prospective studies in the future. Additionally, the absence of a smoking cessation mouse model, due to temporal limitations, needs to be considered further. We gained insight into the effects of smoking cessation by studying 224 non‐malignant human lung tissues and demonstrated that ACE2 expression was significantly decreased in human bronchial epithelial cells in ex‐smokers who had ceased smoking for more than 10 years compared with less than 10 years.
In summary, our study demonstrated that smoking is significantly correlated with ACE2 overexpression on the apical surface of bronchial epithelial cells both in the smoke‐exposure mouse model and in the human clinical lung tissue samples. Since smoking is one of the six important indexes in the MuLBSTA score for predicting mortality in viral pneumonia [40, 41], our findings in the current study have great clinical relevance for attenuating the potential transmission risk of COVID‐19 in the smoking population by highlighting the importance of smoking cessation.
Author contributions statement
QC and MX conceived the project and drafted the manuscript. AL designed the study and analyzed the data. XZ and MZ performed the IHC experiments and analyzed the images. SY and LD performed the animal experiments. RL organized the patients' information. CH, AW, and YH revised the manuscript.
Supporting information
Supplementary materials and methods
Supplementary figure legends
Figure S1. Levels of ACE2 and CS‐induced oxidative stress‐related markers HIF‐1α, iNOS, and 4‐HNE are increased by smoking
Figure S2. ACE2 expression differently correlates with the levels of CS‐induced oxidative stress‐related markers HIF‐1α, iNOS, and 4‐HNE in mouse alveoli
Figure S3. ACE2 expression has no correlation with age and gender
Figure S4. ACE2 is significantly overexpressed in human alveolar epithelial cells of non‐malignant lung tissues in smokers
Figure S5. ACE2 expression is upregulated by CSE treatment in primary human lung epithelial cells
Figure S6. ACE2 expression positively correlates with the expression of HIF‐1α in human alveolar epithelial cells of lung tissues
Acknowledgements
This study was funded by grants from the National Natural Science Foundation of China (81602028, 81770045, 81702917, 81802918), a China Postdoctoral Science Foundation Grant (2019M660206), the Natural Science Foundation of Hunan Province (2019JJ50970), the Science and Technology Project of Guangdong Province (2019A1515011565, 2018A030310007), the Medical Science Foundation of Guangdong Province (A2017103), the Science Foundation of Guangdong Province Bureau of Traditional Chinese Medicine (20181273), the Science and Technology Project of Jiangmen (2019‐252‐2‐1, 2019030102430012905, 2018090106380023859), and the Medical Science Foundation of Jiangmen Central Hospital (J201801), Emergency project of prevention and control for COVID‐19 of Central South University (160260003). We thank Dr Zhanzhan Li for his generous help with statistical analysis and graph drafting.
No conflicts of interest were declared.
Contributor Information
Mingxuan Xie, Email: xiemx2015@163.com.
Qiong Chen, Email: qiongch@163.com.
References
- 1. Zhou P, Yang XL, Wang XG, et al. A pneumonia outbreak associated with a new coronavirus of probable bat origin. Nature 2020; 579 : 270–273. [DOI] [PMC free article] [PubMed] [Google Scholar]
- 2. World Health Organization . Weekly Operation Update on COVID‐19, 4 September 2020. [Accessed 6 September 2020]. Available from: https://www.who.int/docs/default-source/coronaviruse/situation-reports/wou-4-september-2020-approved.pdf
- 3. Xie M, Chen Q. Insight into 2019 novel coronavirus – an updated interim review and lessons from SARS‐CoV and MERS‐CoV. Int J Infect Dis 2020; 94 : 119–124. [DOI] [PMC free article] [PubMed] [Google Scholar]
- 4. Walls AC, Park YJ, Tortorici MA, et al. Structure, function, and antigenicity of the SARS‐CoV‐2 spike glycoprotein. Cell 2020; 181 : 281–292.e6. [DOI] [PMC free article] [PubMed] [Google Scholar]
- 5. Tipnis SR, Hooper NM, Hyde R, et al. A human homolog of angiotensin‐converting enzyme. Cloning and functional expression as a captopril‐insensitive carboxypeptidase. J Biol Chem 2000; 275 : 33238–33243. [DOI] [PubMed] [Google Scholar]
- 6. Donoghue M, Hsieh F, Baronas E, et al. A novel angiotensin‐converting enzyme‐related carboxypeptidase (ACE2) converts angiotensin I to angiotensin 1‐9. Circ Res 2000; 87 : E1–E9. [DOI] [PubMed] [Google Scholar]
- 7. Li W, Moore MJ, Vasilieva N, et al. Angiotensin‐converting enzyme 2 is a functional receptor for the SARS coronavirus. Nature 2003; 426 : 450–454. [DOI] [PMC free article] [PubMed] [Google Scholar]
- 8. Harmer D, Gilbert M, Borman R, et al. Quantitative mRNA expression profiling of ACE 2, a novel homologue of angiotensin converting enzyme. FEBS Lett 2002; 532 : 107–110. [DOI] [PubMed] [Google Scholar]
- 9. Zhang H, Rostami MR, Leopold PL, et al. Expression of the SARS‐CoV‐2 ACE2 receptor in the human airway epithelium. Am J Respir Crit Care Med 2020; 202 : 219–229. [DOI] [PMC free article] [PubMed] [Google Scholar]
- 10. Zhao Y, Zhao Z, Wang Y, et al. Single‐cell RNA expression profiling of ACE2, the receptor of SARS‐CoV‐2. Am J Respir Crit Care Med 2020; 202 : 756–759. [DOI] [PMC free article] [PubMed] [Google Scholar]
- 11. Hamming I, Timens W, Bulthuis ML, et al. Tissue distribution of ACE2 protein, the functional receptor for SARS coronavirus. A first step in understanding SARS pathogenesis. J Pathol 2004; 203 : 631–637. [DOI] [PMC free article] [PubMed] [Google Scholar]
- 12. Duclos GE, Teixeira VH, Autissier P, et al. Characterizing smoking‐induced transcriptional heterogeneity in the human bronchial epithelium at single‐cell resolution. Sci Adv 2019; 5 : eaaw3413. [DOI] [PMC free article] [PubMed] [Google Scholar]
- 13. He X, Zhang L, Ran Q, et al. Integrative bioinformatics analysis provides insight into the molecular mechanisms of 2019‐nCoV. medRxiv 2020; 10.1101/2020.02.03.20020206. Not peer reviewed. [DOI]
- 14. Muus C, Luecken MD, Eraslan G, et al. Integrated analyses of single‐cell atlases reveal age, gender, and smoking status associations with cell type‐specific expression of mediators of SARS‐CoV‐2 viral entry and s inflammatory programs in putative target cells. bioRxiv 2020; 10.1101/2020.04.19.049254. Not peer reviewed. [DOI]
- 15. Russo P, Bonassi S, Giacconi R, et al. COVID‐19 and smoking: is nicotine the hidden link? Eur Respir J 2020; 55 : 2001116. [DOI] [PMC free article] [PubMed] [Google Scholar]
- 16. Leung JM, Yang CX, Sin DD. COVID‐19 and nicotine as a mediator of ACE‐2. Eur Respir J 2020; 55 : 2001261. [DOI] [PMC free article] [PubMed] [Google Scholar]
- 17. Cai G. Bulk and single‐cell transcriptomics identify tobacco‐use disparity in lung gene expression of ACE2, the receptor of 2019‐nCov. medRxiv 2020; 10.1101/2020.02.05.20020107. Not peer reviewed. [DOI]
- 18. Cai G, Bosse Y, Xiao F, et al. Tobacco smoking increases the lung gene expression of ACE2, the receptor of SARS‐CoV‐2. Am J Respir Crit Care Med 2020; 201 : 1557–1559. [DOI] [PMC free article] [PubMed] [Google Scholar]
- 19. Mossel EC, Huang C, Narayanan K, et al. Exogenous ACE2 expression allows refractory cell lines to support severe acute respiratory syndrome coronavirus replication. J Virol 2005; 79 : 3846–3850. [DOI] [PMC free article] [PubMed] [Google Scholar]
- 20. Hung YH, Hsieh WY, Hsieh JS, et al. Alternative roles of STAT3 and MAPK signaling pathways in the MMPs activation and progression of lung injury induced by cigarette smoke exposure in ACE2 knockout mice. Int J Biol Sci 2016; 12 : 454–465. [DOI] [PMC free article] [PubMed] [Google Scholar]
- 21. Oakes JM, Fuchs RM, Gardner JD, et al. Nicotine and the renin–angiotensin system. Am J Physiol Regul Integr Comp Physiol 2018; 315 : R895–R906. [DOI] [PMC free article] [PubMed] [Google Scholar]
- 22. Han SX, He GM, Wang T, et al. Losartan attenuates chronic cigarette smoke exposure‐induced pulmonary arterial hypertension in rats: possible involvement of angiotensin‐converting enzyme‐2. Toxicol Appl Pharmacol 2010; 245 : 100–107. [DOI] [PMC free article] [PubMed] [Google Scholar]
- 23. Aveyard P, Lindson N, Gao M, et al. Associations between COVID‐19 infection, tobacco smoking and nicotine use, common respiratory conditions and inhaled corticosteroids: a prospective QResearch‐Case Mix Programme data linkage study January–May 2020. medRxiv 2020; 10.1101/2020.06.05.20116624. Not peer reviewed. [DOI]
- 24. Zhang X, Zhang L, Lin B, et al. Phospholipid phosphatase 4 promotes proliferation and tumorigenesis, and activates Ca2+‐permeable cationic channel in lung carcinoma cells. Mol Cancer 2017; 16 : 147–160. [DOI] [PMC free article] [PubMed] [Google Scholar]
- 25. Chen J, Liu A, Lin Z, et al. Downregulation of the circadian rhythm regulator HLF promotes multiple‐organ distant metastases in non‐small cell lung cancer through PPAR/NF‐κB signaling. Cancer Lett 2020; 482 : 56–71. [DOI] [PubMed] [Google Scholar]
- 26. Chen N, Zhou M, Dong X, et al. Epidemiological and clinical characteristics of 99 cases of 2019 novel coronavirus pneumonia in Wuhan, China: a descriptive study. Lancet 2020; 395 : 507–513. [DOI] [PMC free article] [PubMed] [Google Scholar]
- 27. Arcavi L, Benowitz NL. Cigarette smoking and infection. Arch Intern Med 2004; 164 : 2206–2216. [DOI] [PubMed] [Google Scholar]
- 28. Yang J, Zheng Y, Gou X, et al. Prevalence of comorbidities and its effects in patients infected with SARS‐CoV‐2: a systematic review and meta‐analysis. Int J Infect Dis 2020; 94 : 91–95. [DOI] [PMC free article] [PubMed] [Google Scholar]
- 29. An J, Liao X, Xiao T, et al. Clinical characteristics of recovered COVID‐19 patients with re‐detectable positive RNA test. Ann Transl Med 2020; 8: 1084. [DOI] [PMC free article] [PubMed] [Google Scholar]
- 30. Rahman I. Oxidative stress in pathogenesis of chronic obstructive pulmonary disease: cellular and molecular mechanisms. Cell Biochem Biophys 2005; 43 : 167–188. [DOI] [PubMed] [Google Scholar]
- 31. Khan A, Fornes O, Stigliani A, et al. JASPAR 2018: update of the open‐access database of transcription factor binding profiles and its web framework. Nucleic Acids Res 2018; 46 : D260–D266. [DOI] [PMC free article] [PubMed] [Google Scholar]
- 32. Sungnak W, Huang N, Becavin C, et al. SARS‐CoV‐2 entry factors are highly expressed in nasal epithelial cells together with innate immune genes. Nat Med 2020; 26 : 681–687. [DOI] [PMC free article] [PubMed] [Google Scholar]
- 33. Smith JC, Sausville EL, Girish V, et al. Cigarette smoke exposure and inflammatory signaling increase the expression of the SARS‐CoV‐2 receptor ACE2 in the respiratory tract. Dev Cell 2020; 53 : 514–529.e3. [DOI] [PMC free article] [PubMed] [Google Scholar]
- 34. Joshi S, Wollenzien H, Leclerc E, et al. Hypoxic regulation of angiotensin‐converting enzyme 2 and Mas receptor in human CD34+ cells. J Cell Physiol 2019; 234 : 20420–20431. [DOI] [PMC free article] [PubMed] [Google Scholar]
- 35. Yilin Z, Yandong N, Faguang J. Role of angiotensin‐converting enzyme (ACE) and ACE2 in a rat model of smoke inhalation induced acute respiratory distress syndrome. Burns 2015; 41 : 1468–1477. [DOI] [PMC free article] [PubMed] [Google Scholar]
- 36. Olds JL, Kabbani N. Is nicotine exposure linked to cardiopulmonary vulnerability to COVID‐19 in the general population? FEBS J 2020; 287 : 3651–3655. [DOI] [PMC free article] [PubMed] [Google Scholar]
- 37. van Zyl‐Smit RN, Richards G, Leone FT. Tobacco smoking and COVID‐19 infection. Lancet Respir Med 2020; 8 : 664–665. [DOI] [PMC free article] [PubMed] [Google Scholar]
- 38. Hikmet F, Mear L, Edvinsson A, et al. The protein expression profile of ACE2 in human tissues. Mol Syst Biol 2020; 16 : e9610. [DOI] [PMC free article] [PubMed] [Google Scholar]
- 39. Nawijn MC, Timens W. Can ACE2 expression explain SARS‐CoV‐2 infection of the respiratory epithelia in COVID‐19? Mol Syst Biol 2020; 16 : e9841. [DOI] [PMC free article] [PubMed] [Google Scholar]
- 40. Guo L, Wei D, Zhang X, et al. Clinical features predicting mortality risk in patients with viral pneumonia: the MuLBSTA Score. Front Microbiol 2019; 10 : 2752. [DOI] [PMC free article] [PubMed] [Google Scholar]
- 41. Jiang C, Chen Q, Xie M. Smoking increases the risk of infectious diseases: a narrative review. Tob Induc Dis 2020; 18 : 60. [DOI] [PMC free article] [PubMed] [Google Scholar]
- 42. Dai M, Cui P, Yu M, et al. Melatonin modulates the expression of VEGF and HIF‐1α induced by CoCl2 in cultured cancer cells. J Pineal Res 2008; 44 : 121–126. [DOI] [PubMed] [Google Scholar]
- 43. Donnelly LE, Barnes PJ. Expression and regulation of inducible nitric oxide synthase from human primary airway epithelial cells. Am J Respir Cell Mol Biol 2002; 26 : 144–151. [DOI] [PubMed] [Google Scholar]
- 44. Choi SW, Choi SW, Jeon YK, et al. Suppression of hERG K+ current and cardiac action potential prolongation by 4‐hydroxynonenal via dual mechanisms. Redox Biol 2018; 19 : 190–199. [DOI] [PMC free article] [PubMed] [Google Scholar]
- 45. Milara J, Serrano A, Peiro T, et al. Aclidinium inhibits cigarette smoke‐induced lung fibroblast‐to‐myofibroblast transition. Eur Respir J 2013; 41 : 1264–1274. [DOI] [PubMed] [Google Scholar]
- 46. Chen J, Liu A, Wang Z, et al. LINC00173.v1 promotes angiogenesis and progression of lung squamous cell carcinoma by sponging miR‐511‐5p to regulate VEGFA expression. Mol Cancer 2020; 19 : 98. [DOI] [PMC free article] [PubMed] [Google Scholar]
- 47. Le Cao KA, Rohart F, McHugh L, et al. YuGene: a simple approach to scale gene expression data derived from different platforms for integrated analyses. Genomics 2014; 103 : 239–251. [DOI] [PubMed] [Google Scholar]
Associated Data
This section collects any data citations, data availability statements, or supplementary materials included in this article.
Supplementary Materials
Supplementary materials and methods
Supplementary figure legends
Figure S1. Levels of ACE2 and CS‐induced oxidative stress‐related markers HIF‐1α, iNOS, and 4‐HNE are increased by smoking
Figure S2. ACE2 expression differently correlates with the levels of CS‐induced oxidative stress‐related markers HIF‐1α, iNOS, and 4‐HNE in mouse alveoli
Figure S3. ACE2 expression has no correlation with age and gender
Figure S4. ACE2 is significantly overexpressed in human alveolar epithelial cells of non‐malignant lung tissues in smokers
Figure S5. ACE2 expression is upregulated by CSE treatment in primary human lung epithelial cells
Figure S6. ACE2 expression positively correlates with the expression of HIF‐1α in human alveolar epithelial cells of lung tissues