

Abstract
Severe acute respiratory syndrome coronavirus 2 (SARS‐CoV‐2) causes serious disease in humans. First identified in November/December 2019 in China, it has rapidly spread worldwide. We analyzed 2790 SARS‐CoV‐2 genome sequences from 56 countries that were available on April 2, 2020, to assess the evolution of the virus during this early phase of its expansion. We aimed to assess sequence variations that had evolved in virus genomes, giving the greatest attention to the S gene. We also aimed to identify haplotypes that the variations may define and consider their geographic and chronologic distribution. Variations at 1930 positions that together cause 1203 amino acid changes were identified. The frequencies of changes normalized to the lengths of genes and encoded proteins were relatively high in ORF3a and relatively low in M. A variation that causes an Asp614Gly near the receptor‐binding domain of S were found at a high frequency, and it was considered that this may contribute to the rapid spread of viruses with this variation. Our most important findings relate to haplotypes. Sixty‐six haplotypes that constitute thirteen haplotype groups (H1–H13) were identified, and 84.6% of the 2790 sequences analyzed were associated with these haplotypes. The majority of the sequences (75.1%) were associated with haplotype groups H1–H3. The distribution pattern of the haplotype groups differed in various geographic regions. A few were country/territory specific. The location and time of emergence of some haplotypes are discussed. Importantly, nucleotide variations that define the various haplotypes and Tag/signature variations for most of the haplotypes are reported. The practical applications of these variations are discussed.
Keywords: amino acid changes, haplotypes, nucleotide variations, SARS‐CoV‐2, Tag SNVs
Highlights
Variations at 1930 nucleotides and 1203 amino acids identified among 2790 SARS‐CoV‐2 sequences.
Frequencies of changes normalized to the lengths of genes and proteins were high in ORF3a and low in M.
Asp614Gly near RBD of S may have contributed to the rapid spread of viruses with this variation.
84.6% of the 2790 genome sequences defined by 66 haplotypes that constitute 13 haplotype groups.
75.1% of 2790 SARS‐CoV‐2 genome sequences were associated with three haplotype groups, H1–H3.
The distribution of haplotypes was country/territory/region specific.
Sequence variations that define the haplotypes and Tag variations for the haplotypes are reported.
The Tag variations can be used as tools for epidemiologic studies.
1. INTRODUCTION
In December 2019, a series of patients with severe viral pneumonia with unknown causality were reported in Wuhan, in the Hubei province of China. A virus whose genome shared about 80% nucleotide sequence identity with severe acute respiratory syndrome coronavirus (SARS‐CoV) was identified as the causative agent. 1 , 2 SARS‐CoV is one of six previously identified coronaviruses (CoVs) that can infect humans. 3 , 4 , 5 The novel virus was first designated novel coronavirus 2019 and later named severe acute respiratory syndrome coronavirus 2 (SARS‐CoV‐2). 6 The disease caused by the virus can lead to death, especially in health compromised individuals. 7 , 8 Rapid person to person transmission of the SARS‐CoV‐2 caused a notable increase in the number of infected individuals, and the designation of the spread of the disease was termed as the coronavirus disease 2019 (COVID‐19) pandemic by World Health Organization (WHO). 9 , 10
The SARS‐CoV‐2 single‐stranded RNA genome, based on the first sequence data of a patient from Wuhan (Wuhan‐Hu‐1; https://www.ncbi.nlm.nih.gov/nuccore/NC_045512.2), has at least 11 protein‐coding regions (open reading frames; ORFs) (Figure 1). 1 The S gene among these encodes the spike glycoprotein (S protein). S proteins are anchored onto the surface of the virion envelope, and mediate entry into host cells through recognition of and attachment to host cell receptors and subsequent fusion of viral and cell membranes. Spike proteins are considered the determinants of the host range of the viruses, and also the determinants of tissue tropism and stimulators of host immune responses. 11 , 12 Different human coronaviruses (hCoVs) recognize different cellular receptors; SARS‐CoV‐2 recognizes and binds to angiotensin‐converting enzyme 2 (ACE2). 11 , 12 , 13 , 14 , 15 Spike proteins appear on the surface of viruses as homotrimers and each monomer of the complex consists of two functional subunits, S1 and S2. 15 , 16 , 17 , 18 For SARS‐CoV‐2, it is the receptor‐binding domain (RBD) within the S1 subunit that directly binds to ACE2 on the host cell. Six amino acids are most important for binding and there are 12–16 amino acids at the next level of importance (Figure 1). 2 , 15 , 16 , 17 , 19 , 20 , 21 , 22 Due to its role in viral infection, the S protein/ACE2 interaction is a logical target for prevention and/or treatment protocols including development of vaccines, antibodies, and virus attachment inhibitors. 12 , 15
Figure 1.
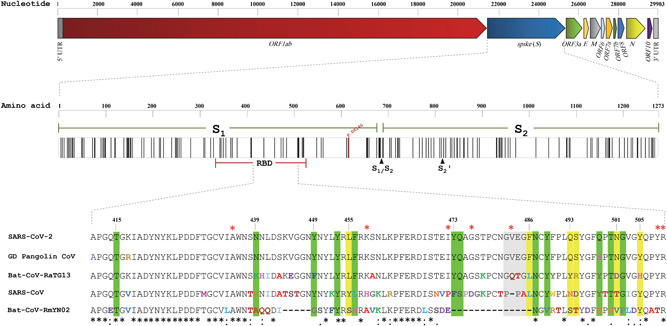
Schematic presentation of severe acute respiratory syndrome coronavirus 2 (SARS‐CoV‐2) genome and S encoded protein (spike). The upper panel shows the SARS‐CoV‐2 genomic regions. The middle panel depicts the S protein, and the lines therein represent positions of non‐synonymous amino acid changes in S found among the sequences analyzed. The region of the receptor‐binding domain (RBD) domain of the SARS‐CoV‐2 spike protein that includes amino acids thought to be most important for interaction with the human angiotensin‐converting enzyme 2 (ACE2) receptor is shown in the bottom panel, and is aligned with the RBD domain of four other coronaviruses. The six residues shaded in yellow are the most important SARS‐CoV‐2 interacting amino acids, and the 12 shaded in green and the four shaded in gray are at the next levels of importance. The stars in the lower panel show the positions of non‐synonymous amino acid changes within the RBD domain
Based on phylogenetical analysis, the genome sequence of the SARSr (SARS‐related) bat coronavirus (Bat‐CoV‐RaTG13), isolated from Rhinolophus affinis, is the closest to that of SARS‐CoV‐2 with an overall nucleotide sequence identity of 96.2%. This suggests that bats may be the original source of the SARS‐CoV‐2; an intermediate for transfer to humans has not been identified. 2 Recently, multiple lineages of CoVs with considerable sequence similarity (85.5%–92.4%) to SARS‐CoV‐2 were isolated from pangolins. 22 , 23 Notably, there was particularly high sequence similarity (97.4%) within the RBD domain of the S protein of a pangolin CoV and SARS‐CoV‐2, and the amino acids at five critical residues were identical. It has been suggested that these organisms may be natural reservoirs of SARS‐CoV‐2‐like viruses, and possibly a host for the SARS‐CoV‐2 human virus.
After the sequences of the genome of SARS‐CoV‐2 viruses that were obtained from a few individuals in China who had been infected towards the end of 2019 were reported, many more genomes from China and other countries have been sequenced and are available at Global Initiative on Sharing All Influenza Data (GISAID; https://platform.gisaid.org/) and NCBI (https://www.ncbi.nlm.nih.gov/). Early studies on available genome sequences had identified sequence variations and had suggested the distribution of the genomes into haplotype groups. 24 , 25 , 26 Here, we expanded upon those studies and analyzed 2790 SARS‐CoV‐2 genome sequences from 56 countries that were available on April 2, 2020 to assess the evolution of the virus. Two items were emphasized in the analysis. The first was the assessment of nucleotide sequence variations that had evolved in the genome and the distribution of the variations among the virus genes. Effects on amino acid changes would also be determined. Given the importance of the S gene as described above, the changes in this gene were given the greatest consideration. The second item of focus was to critically identify and describe haplotypes that the sequence variations may define and to consider the geographic and chronologic distribution of the haplotypes. The implications of the findings are discussed.
2. MATERIALS AND METHODS
The 2790 SARS‐CoV‐2 genome sequences studied were from virus strains isolated from infected patients in 56 countries. The sequences were retrieved from GISAID on April 2, 2020, and they constituted all sequences that were designated by the public resource as complete (>29 000N) and with a high coverage on that date. The latest date of sample collection pertaining to these sequences was March 25, 2020. In the analyses performed, the genome sequence of the Wuhan‐Hu‐1 isolate (NC_045512.2) was used as the SARS‐CoV‐2 reference sequence. Other human and nonhuman coronavirus sequences were obtained from GISAID and NCBI (Table S1). The 2790 sequences and the SARS‐CoV‐2 reference sequence were aligned using the MAFFT (V7) sequence alignment software. 27 As the 5ʹ and 3ʹ termini of the 2790 sequences tended to have relatively high numbers of missing and ambiguous reads, trimming of the ends of these sequences was performed after alignment; sequences at positions 150 through 29 700 were included in subsequent analyses (numbering according to the reference sequence). The alignment was displayed in MEGA X (V.10.1.8) to identify nucleotide variations. 28 MEGA X was also used to identify predicted amino acid changes in the virus proteins that were caused by the nucleotide variations. For haplotype analysis, gaps in the 2790 sequences in the MEGA X file were replaced with N and the file was then submitted to DnaSP (V6). 29 The haplotype network analysis was performed using genome‐wide parsimony single‐nucleotide variations (SNVs). For visualization, SNV median‐joining network analysis was performed by PopART software (http://popart.otago.ac.nz.). The distribution of the haplotypes in countries/territories and larger geographic regions and with respect to dates of sample collection were assessed. Finally, a phylogenetic tree was constructed by the neighbor‐joining method in MEGA X. 28 The tree included a randomly chosen genome sequence associated with each of 87 identified haplotypes, and the SARS‐CoV‐2 reference sequence (NC_045512.2). Everywhere, U nucleotides in the virus genome are reported as T. SPSS (https://www.ibm.com/products/spss-statistics) was used for statistical analysis.
3. RESULTS
3.1. Nucleotide variations and amino acid changes
The number of complete retrieved SARS‐CoV‐2 genomes from each of 56 countries/territories ranged from 1 to 741 (Table S2). As compared to the SARS‐CoV‐2 reference genome sequence (nucleotides 150‐29700), 1969 nucleotide variations at 1930 positions (6.53% of the positions) were identified (Table S3). The number of times any single variation was reported ranged from 1 to 1256. There was a trend of decrease in percent of variations reported in higher numbers of sequences; six variations were each observed in more than 600 sequences (Figure S1). In addition to nucleotide substitutions, 29 indels were also found (Table S4). Most of these were observed in less than three genome sequences, but deletions 1605_1607 and 27848_28229 were present, respectively, in 82 and 10 sequences.
The number of different SNVs observed in each of various SARS‐CoV‐2 genes ranged from 13 to 368, and the number of non‐synonymous amino acid changes in the encoded proteins ranged from 7 to 240 (Table S5 and Figure 2A). Figure 2B is a visual presentation of the dispersion of the frequencies of SNVs among SARS‐CoV‐2 genes (7 ± 2.2/100 nucleotides) and of non‐synonymous amino acid changes (12.8 ± 5.3/100 amino acids) among the proteins after normalization for lengths of genes and proteins. ORF3a has the highest frequency of both nucleotide and amino acid changes; the frequencies were also relatively high in ORF7a, ORF7b, and N. By contrast, M had a low frequency of nucleotide changes and the lowest frequency of amino acid changes. The apparent relatively high and low tolerance to change of, respectively, ORF3a and M that are suggested by these data are also evidenced by the ratio of predicted non‐synonymous to synonymous amino acid changes observed in the proteins. ORF3a had the highest ratio (2.45) among the various encoded proteins, and M had the lowest ratio (0.57) (Table S5).
Figure 2.
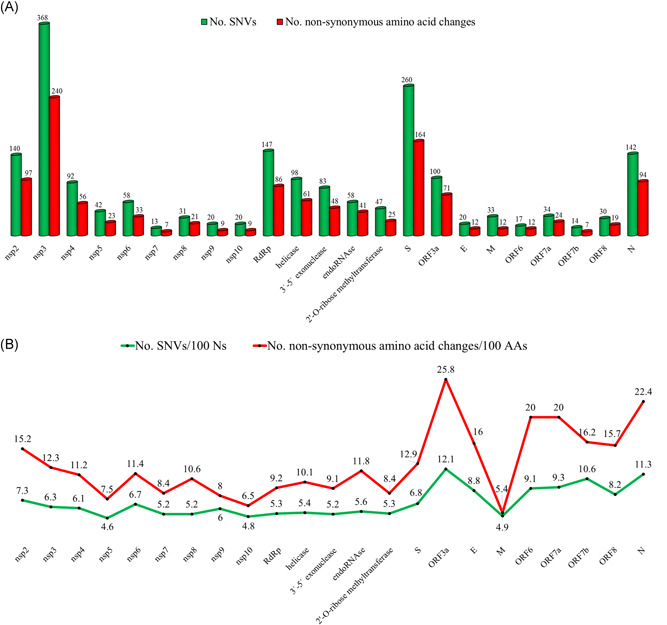
Numbers and distribution of different nucleotide sequence variations and non‐synonymous amino acid changes observed in 2790 severe acute respiratory syndrome coronavirus 2 (SARS‐CoV‐2) genome sequences in SARS‐CoV‐2 genes and proteins. A, Numbers of nucleotide variations (green bars) and nonsynonymous amino acid changes (red bars). B, The numbers normalized to number of changes per 100 nucleotides (green line) and 100 amino acids (red line). nsp1 and ORF10 that are positioned near 5ʹ and 3ʹ termini of SARC‐CoV‐2 genome are not included because of relatively high frequencies of nucleotides reported as N
The frequency of SNVs in S (6.8/100 nucleotides) and the frequency of amino acid changes in the encoded protein (12.9/100 amino acids) were close to the median of various SARS‐CoV‐2 genes and proteins (Figure 2B). The frequencies of nucleotide variations in S1 (0.064) and S2 (0.07) were similar to each other, as were the frequencies of missense mutations in the two regions (0.12 and 0.13, respectively). Twenty non‐synonymous changes in the RBD domain, which consists of 194 amino acids were observed, corresponding to a frequency of 0.10 (Table S3). Twelve of the changes affect amino acids that are completely conserved among SARS‐CoV‐2, GD Pangolin CoV, Bat‐CoV‐RaTG13, SARS‐CoV, and Bat‐CoV‐RmYN02 (Figure S2). Bat‐CoV‐RmYN02 is included in the comparison because its ORF1ab gene that comprises almost half the virus genome was recently reported to have the highest similarity (97%) to the ORF1ab of SARS‐CoV‐2. 30
3.2. Haplotype analysis
The observation of several SNVs that were each present in multiple genome sequences suggested possible co‐segregation of some variations. A straightforward two‐by‐two co‐segregation analysis of the sequence variations showed preferential co‐segregation of some variations (Figure S3). For example, of 1252 records of 241C > T and 1251 records of 3037C > T, both were present in 1248 sequences. The co‐segregation data also suggested the preferential co‐segregation of more than two sequence variations in some cases, for example, co‐segregation of variations 241C > T, 3037C > T, 14408C > T, and 23403A > G. Consistent with these signals, analysis of a MEGA X parsimony file by DnaSP identified 988 haplotypes. Results of network analysis on these are shown in Figure 3. The 66 most frequent haplotypes and their defining sequence variations are described in Figure 4. In this figure, the haplotypes are distributed in potential haplotype groups. Specifically, 27, 16, and 6 haplotypes, respectively, may be sub‐haplotypes of major ancestral haplotypes H1, H2, and H3. 44.4%, 23.7%, and 7.0% of the 2790 sequences analyzed, respectively, were associated with major haplotype groups H1, H2, and H3, and 9.6% of the sequences are associated with haplotype groups H4–H13. A phylogenetic tree of representative sequences of various haplotypes supports the existence of haplotype groups (Figure S4). All the haplotype groups except H11 and H13 are well delineated in the tree. The sequence representing H11 appears within the H5 haplotype group, probably because 11083G > T is a defining variation of both groups. Similarly, the sequence representing H13 appears within the H2 haplotype group probably because 8782C > T is a defining variation of both of these groups. Examples of expected groupings of sub‐haplotypes in the phylogenetic tree are sub‐haplotypes of H1a, H1b, H1f, H1h, H2a, H4, H5a, H6a, and H7.
Figure 3.
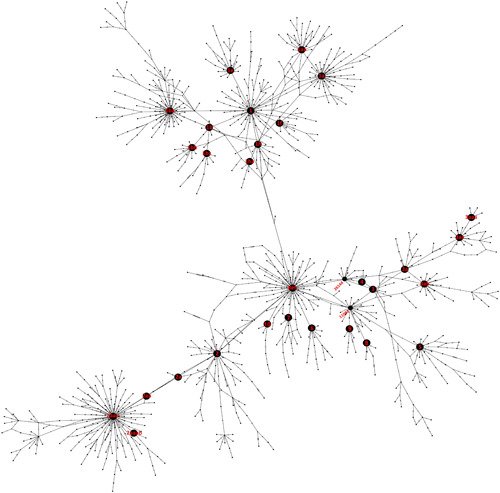
Haplotype network of severe acute respiratory syndrome coronavirus 2 (SARS‐CoV‐2) genome sequences. The nodes that represent the 28 most frequent haplotypes are labeled according to the haplotype designations of Figure 4. The node that represents the reference sequence and two nodes designated by single variations at positions 11 083 and 26 144 are also labeled
Figure 4.
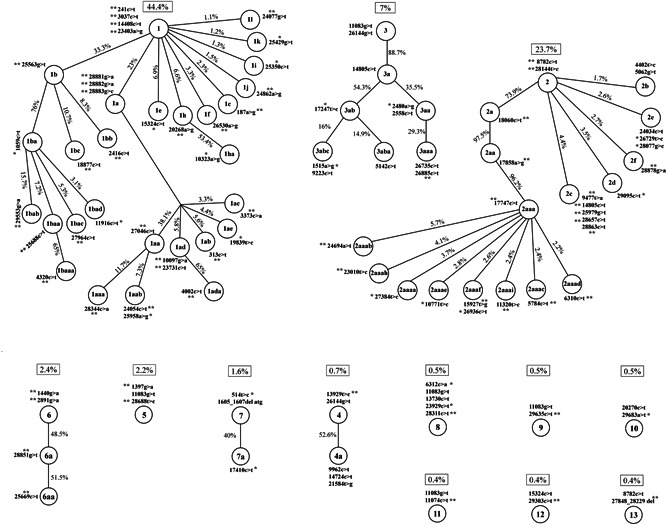
Sixty‐six most frequently observed haplotypes among 2790 severe acute respiratory syndrome coronavirus 2 (SARS‐CoV‐2) genome sequences. The 13 graphs represent 13 haplotype groups. A presumably ancestral haplotype is described at the apex of each graph, and all its sub‐haplotypes that were each identified in ≥10 sequences are described at lower levels. Haplotypes with lower frequencies are not shown. Each haplotype is defined by its own single‐nucleotide variations (SNVs) and all the SNVs of all its upper‐level haplotypes. The percent of each of the haplotype groups among the 2790 genome sequences is shown in adjacent boxes. The percent of each sub‐haplotype among its immediately upper‐level haplotype is shown on the respective edges. * ≥ 85% of genome sequences with the sequence variation had the predicted haplotype; ** ≥ 95% of genome sequences with the sequence variation had the predicted haplotype. The minor allele (T) at position 241 was assumed for 23 of 1248 sequences with this haplotype wherein the nucleotide was not read well (reported as N). Reference to the specific haplotypes in the text will be preceded by the letter H; H is not included in the nomenclature of the figure because of space limitations
Attention to the defining SNVs of various haplotypes reveals that at least one SNV can serve as a Tag or signature SNV (shown with ** or * in Figure 4, and hereafter referred to as Tag SNV) for identification of the majority of the haplotypes. Genotyping of Tag SNVs can identify 44 of the haplotypes with a confidence of ≥95%, and 17 with a confidence of ≥85%. Importantly, Tag SNVs are defined for the haplotype at the apex of all haplotype groups except H3. 26144G > T is one of the defining SNVs of both H3 and H4 haplotype groups and, therefore, is not a suitable Tag SNV for either of these. Variation 11083G > T which causes p.Leu37Phe in nsp6 and which is the second defining SNV of the H3 group, is also not a suitable Tag SNV because it is also included among defining SNVs of five disparate haplotypes (H3, H5, H8, H9, and H11). This variation was also sometimes observed outside the haplotypes described above. These findings suggest that 11083G > T may have occurred multiple times during the evolution of the SARS‐CoV‐2 genome, and that the position may be a mutation hot spot.
In further analysis, we grouped the 56 countries with reported sequences into eight geographic regions consisting of Far East, the Pacific, Latin America, North America, Africa, Europe, the Middle East, and West Asia (Tables S2 and 1, Figure 5). Ten countries in the Far East, including China, together reported 484 sequences; 45.4% of these could be defined by the various haplotypes described (Table 1). This is the lowest percent among the five geographic groupings with ≥10 sequences, and implicates that the reported sequences of this region may on the average be more similar to the reference sequence than the sequences of the other regions. 39.3% of the relatively large number of sequences from China (267) were defined by the haplotypes described, and haplotype H2 that was associated with 31.8% of the sequences was the most frequent. This haplotype was well represented among the sequences of most of the countries of East Asia. Specific haplotypes were particularly prevalent in some countries. H4 and its daughter haplotype 4a constituted 38% (19 of 50) of the sequences from Hong Kong; these haplotypes were unique to Hong Kong. Except for one sequence from Australia, haplotype 12 was observed only among sequences from the Far East. Except for two sequences from the United States, haplotype 9 was observed only among sequences from Japan (14.7% of the 95 sequences). Haplotype 13, which is defined by 8782C > T and the large deletion 27848_28229 del, constituted 42% of Singapore′s 24 sequences; it was not observed in any other country. Haplotype 2b constituted 53.8% (7 of 13) the sequences from South Korea.
Table 1.
Percent of haplotypes 1–13 and respective sub‐haplotypes in various geographic regions and countries/territories
| Geographic regions and countries/territories | No. sequences | H1–H13 and sub‐haplotypes | Haplotypes and respective sub‐haplotypes | ||||||||||||
|---|---|---|---|---|---|---|---|---|---|---|---|---|---|---|---|
| H1 | H2 | H3 | H4 | H5 | H6 | H7 | H8 | H9 | H10 | H11 | H12 | H13 | |||
| Far East | 484 | 45.5 | 5 | 22.7 | 2.3 | 3.9 | 3.5 | 0 | 0 | 0.4 | 2.9 | 0 | 0.6 | 2.1 | 2.1 |
| China: Mainland | 267 | 39.3 | 0 | 31.8 | 0.4 | 0 | 3.4 | 0 | 0 | 0 | 0 | 0 | 0.7 | 3 | 0 |
| China: Hong Kong | 50 | 64 | 2 | 6 | 18 | 38 | 0 | 0 | 0 | 0 | 0 | 0 | 0 | 0 | 0 |
| China: Taiwan | 17 | 82.4 | 11.8 | 11.8 | 5.9 | 0 | 47.1 | 0 | 0 | 0 | 0 | 0 | 5.9 | 0 | 0 |
| Japan | 95 | 40 | 19 | 4.2 | 0 | 0 | 0 | 0 | 0 | 0 | 14.7 | 0 | 0 | 2.1 | 0 |
| Malaysia | 7 | 57 | 0 | 28.5 | 0 | 0 | 0 | 0 | 0 | 28.5 | 0 | 0 | 0 | 0 | 0 |
| Singapore | 24 | 50 | 0 | 8.3 | 0 | 0 | 0 | 0 | 0 | 0 | 0 | 0 | 0 | 0 | 41.7 |
| South Korea | 13 | 69.2 | 0 | 69.2 | 0 | 0 | 0 | 0 | 0 | 0 | 0 | 0 | 0 | 0 | 0 |
| Vietnam | 8 | 75 | 37.5 | 37.5 | 0 | 0 | 0 | 0 | 0 | 0 | 0 | 0 | 0 | 0 | 0 |
| Othera | 3 | 0 | 0 | 0 | 0 | 0 | 0 | 0 | 0 | 0 | 0 | 0 | 0 | 0 | 0 |
| Pacific | 72 | 94.5 | 18.1 | 18.1 | 11.1 | 0 | 30.1 | 1.4 | 2.8 | 8.3 | 0 | 0 | 2.8 | 1.4 | 0 |
| Australia | 67 | 93.6 | 17.9 | 16.4 | 12 | 0 | 31 | 1.5 | 1.5 | 9 | 0 | 0 | 3 | 1.5 | 0 |
| New Zealand | 5 | 100 | 20 | 40 | 0 | 0 | 20 | 0 | 20 | 0 | 0 | 0 | 0 | 0 | 0 |
| Latin America | 30 | 96.7 | 60 | 26.7 | 6.7 | 0 | 0 | 3.3 | 0 | 0 | 0 | 0 | 0 | 0 | 0 |
| Brazil | 18 | 94.4 | 77.9 | 5.6 | 11.2 | 0 | 0 | 5.6 | 0 | 0 | 0 | 0 | 0 | 0 | 0 |
| Chile | 7 | 100 | 14.3 | 85.7 | 0 | 0 | 0 | 0 | 0 | 0 | 0 | 0 | 0 | 0 | 0 |
| Otherb | 5 | 100 | 80 | 20 | 0 | 0 | 0 | 0 | 0 | 0 | 0 | 0 | 0 | 0 | 0 |
| North America | 852 | 91.8 | 30.9 | 56.5 | 1.8 | 0 | 1.4 | 0.5 | 0 | 0.5 | 0.2 | 0 | 0.1 | 0 | 0 |
| Canada | 111 | 95.9 | 45.9 | 35.6 | 0.9 | 0 | 9 | 1.8 | 0 | 1.8 | 0 | 0 | 0.9 | 0 | 0 |
| USA | 741 | 91.1 | 28.9 | 59.3 | 1.8 | 0 | 0.3 | 0.2 | 0 | 0.3 | 0.3 | 0 | 0 | 0 | 0 |
| Africa | 33 | 97 | 90.1 | 3 | 3 | 0 | 0 | 0 | 0 | 0 | 0 | 0 | 0 | 0 | 0 |
| Congo | 19 | 94.7 | 89.5 | 0 | 5.3 | 0 | 0 | 0 | 0 | 0 | 0 | 0 | 0 | 0 | 0 |
| Senegal | 11 | 100 | 90.9 | 9.1 | 0 | 0 | 0 | 0 | 0 | 0 | 0 | 0 | 0 | 0 | 0 |
| Otherc | 3 | 100 | 100 | 0 | 0 | 0 | 0 | 0 | 0 | 0 | 0 | 0 | 0 | 0 | 0 |
| Europe | 1306 | 93.3 | 68 | 3.7 | 12.1 | 0 | 0.4 | 4.7 | 3.3 | 0 | 0 | 1.1 | 0.2 | 0 | 0 |
| Belgium | 103 | 98.1 | 88 | 1 | 3.9 | 0 | 0 | 4.8 | 1 | 0 | 0 | 0 | 0 | 0 | 0 |
| Denmark | 9 | 100 | 84.6 | 0 | 0 | 0 | 0 | 0 | 0 | 0 | 0 | 0 | 0 | 0 | 0 |
| Finland | 33 | 97 | 84.8 | 0 | 6 | 0 | 0 | 3 | 3 | 0 | 0 | 0 | 0 | 0 | 0 |
| France | 135 | 91.9 | 88.1 | 1.5 | 2.2 | 0 | 0 | 0 | 0 | 0 | 0 | 0 | 0 | 0 | 0 |
| Georgiad | 10 | 100 | 50 | 10 | 30 | 0 | 10 | 0 | 0 | 0 | 0 | 0 | 0 | 0 | 0 |
| Germany | 39 | 89.7 | 51.3 | 2.6 | 0 | 0 | 2.6 | 33.3 | 0 | 0 | 0 | 0 | 0 | 0 | 0 |
| Iceland | 295 | 94.2 | 76.5 | 3.7 | 12.7 | 0 | 0 | 0.6 | 0 | 0 | 0 | 0.7 | 0.3 | 0 | 0 |
| Ireland | 11 | 81.8 | 63.6 | 0 | 18.2 | 0 | 0 | 0 | 0 | 0 | 0 | 0 | 0 | 0 | 0 |
| Italy | 23 | 95.6 | 86.9 | 0 | 8.7 | 0 | 0 | 0 | 0 | 0 | 0 | 0 | 0 | 0 | 0 |
| Luxembourg | 46 | 100 | 93.4 | 0 | 6.5 | 0 | 0 | 0 | 0 | 0 | 0 | 0 | 0 | 0 | 0 |
| Netherlands | 164 | 95.7 | 59.4 | 2.4 | 9.1 | 0 | 0.6 | 2.4 | 21.9 | 0 | 0 | 0 | 0 | 0 | 0 |
| Norway | 6 | 100 | 16.7 | 0 | 66.7 | 0 | 16.7 | 0 | 0 | 0 | 0 | 0 | 0 | 0 | 0 |
| Portugal | 46 | 100 | 82.6 | 2.2 | 10.9 | 0 | 0 | 0 | 2.2 | 0 | 0 | 2.2 | 0 | 0 | 0 |
| Spain | 47 | 91.5 | 38.8 | 47 | 6.4 | 0 | 0 | 0 | 0 | 0 | 0 | 0 | 0 | 0 | 0 |
| Switzerland | 35 | 100 | 96.7 | 0 | 3 | 0 | 0 | 0 | 0 | 0 | 0 | 0 | 0 | 0 | 0 |
| UK: England | 201 | 85.1 | 43.3 | 1 | 33 | 0 | 0.5 | 0.5 | 1.5 | 0 | 4.5 | 0.5 | 0 | 0 | 0 |
| UK: Scotland | 6 | 100 | 66.7 | 0 | 33.3 | 0 | 0 | 0 | 0 | 0 | 0 | 0 | 0 | 0 | 0 |
| UK: Wales | 80 | 91.3 | 36.3 | 1.3 | 7.5 | 0 | 0 | 63.5 | 0 | 0 | 0 | 2.5 | 0 | 0 | 0 |
| Othere | 17 | 94.3 | 76.6 | 5.9 | 0 | 0 | 0 | 5.9 | 5.9 | 0 | 0 | 0 | 0 | 0 | 0 |
| Middle East f | 9 | 88.9 | 33.3 | 0 | 0 | 0 | 45.5 | 0 | 0 | 11.1 | 0 | 0 | 0 | 0 | 0 |
| West Asia g | 4 | 25 | 0 | 25 | 0 | 0 | 0 | 0 | 0 | 0 | 0 | 0 | 0 | 0 | 0 |
Cambodia and Thailand.
Colombia, Mexico, Panama and Peru.
Algeria and South Africa.
Georgia included in Europe because of proximity to countries of Eastern Europe.
Czech Republic, Greece, Hungary, Lithuania, Poland, Russia, Slovakia, and Sweden.
Israel, Kuwait, and Saudi Arabia.
India, Nepal, and Pakistan.
Figure 5.
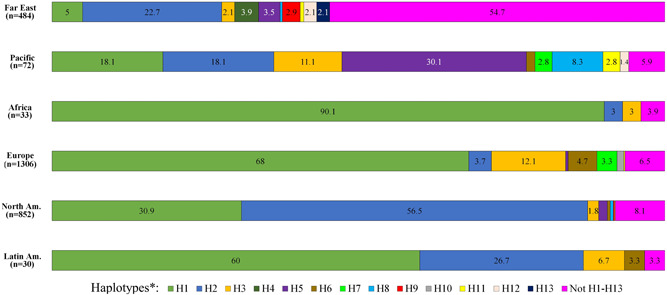
Frequency of haplotypes H1–H13 and their subhaplotypes among severe acute respiratory syndrome coronavirus 2 (SARS‐CoV‐2) genome sequences of various geographic regions. The number (n) of sequences from each region is indicated, and the percent of the haplotypes in each region is written within the colored bars that represent the various haplotype groups. The haplotypes of the few samples from the Middle East and West Asia are not shown
H1 (18.1%), H2 (18.1%), H5 (30.1%), and their sub‐haplotypes are the most frequent haplotypes observed among the 72 sequences from the two countries of the Pacific region, Australia and New Zealand. Most (86.7%) of the 30 sequences from Latin American countries were associated with H1 and H2 and their sub‐haplotypes, and 90.1% of the 33 sequences from Africa were associated with H1 and its sub‐haplotypes. There were only a small number of sequences from countries of the Middle East (9) and West Asia (4).
The largest number of sequences, 1306, were from 26 countries in Europe. 93.3% of the sequences were defined by the recognized haplotypes. H1 and its daughter haplotypes were well represented and constituted the largest fraction (68.0%) of the European sequences. The relatively low representation (3.7%) of H2‐related haplotypes was notable. Spain in this regard was an exception, as haplotypes 2 and 2c together constituted 47% of the 47 sequences of this country. Compared to other countries/territories in Europe, a relatively high fractions of sequences from England (14.9% of 201) were not defined by the described haplotypes, consistent with the possibility that they are more similar to the reference sequence. H7 and its sub‐haplotypes constituted 22% of the sequences from the Netherlands. One of the defining variations of H7 is a deletion. Haplotype 6 was associated with sequences from several European countries, but most frequently with sequences from Germany (33.3% of its 39 sequences). Haplotypes H6a and H6aa were observed only in sequences from Wales and constituted 41% of its sequences.
North America was represented by sequences from Canada and the United States of America. 95.9% of the 111 sequences from Canada and 91.8% of the 741 US sequences were defined by the various described haplotypes. In contrast to the European region, H1 and its daughter haplotypes had a relatively low representation (30.9%) in this region, and H2 and its daughter haplotypes were more frequent (56.5%). Only one haplotypes defined 10% or more of reported sequences from Canada (H2aa: 13.5%) (Table S2). The H2aaa haplotype was by far the most frequent (43.2%) among the 741 reported sequences from the United States.
Figure S5 shows dates of collection of samples from which viruses with designated haplotypes were isolated (reported by GISAID). These dates are shown for samples of various countries/territories or geographic regions. The earliest samples collected (before mid‐February 2020) were mostly from the Far East, and most of these were associated with the H2 haplotype group. H2 group haplotypes became relatively prevalent among North American and European samples collected after mid‐February. Samples associated with haplotype groups H3‐H5, H9, and H11–H13 were also identified among samples collected before mid‐February from the Far East, albeit at lower frequencies than H2 haplotype samples. The earliest H1 group haplotypes were associated with samples collected in the second half of February in Europe. In fact, the first report among our samples was in a sequence associated with sample hCoV‐19/Italy/CDG1/2020|EPI_ISL_412973 collected in the Lombardy region of Italy on February 20, 2020 (GISAID). The first appearance of H1 in North America was about a week later. H1 group haplotypes in samples from the Far East were found only in samples collected from early March onwards and not before. Samples associated with H6, H7, and H10 group haplotypes first appeared in European samples collected in late February/early March onwards.
4. DISCUSSION
4.1. Nucleotide sequence variations and amino acid changes
The distribution and frequency of mutations at various nucleotides and amino acids in various genes and encoded proteins of the SARS‐CoV‐2 genome may be important for the design of appropriate vaccines, drugs, and diagnostic tools. 31 Additionally, they may explain the basis of differences in virulence of various strains if such differences become evident. And, of course, they may be of interest in the framework of basic science. A possible consequence of mutations may be escape from the host immune responses. The lowest and highest frequencies of amino acid changes were predicted, respectively, in M and ORF3a. The M protein is a very abundant structural protein of CoVs and defines the shape of the viral envelope. 32 It is considered the central organizer of CoV assembly, interacting with all other major structural proteins. 33 These interactions may place high restrictions on its sequence and structural flexibility. ORF3a of SARS‐CoV has been proposed to induce cell apoptosis. 34 , 35
With regard to S and its sub‐regions, the frequencies of nucleotide and amino acid changes in S, S1, RBD, and S2 were all close to the median of various SARS‐CoV‐2 genes and encoded proteins. Sequence variations in the S gene of SARS‐CoV‐2 that preclude the use of the ACE2 receptor would be selected against and, therefore, would not be expected to be identified in the present study. Consistent with this, variations that affect the most important amino acids for interaction with the receptor were not found. However, identification of the 23403A > G variation at high frequencies (in 1256 sequences) in S1 is notable. This variation causes Asp614Gly, which is positioned close to the RBD domain and may affect receptor binding (Figure 1). 23403A > G is one of four SNVs that define haplotype group H1 that was first identified in samples from Europe and subsequently became prevalent among samples collected during the rapid spread of COVID‐19 in that continent during March. 26 The potential contribution of this variation to effective transmission of the disease can be considered (see the postscript). The other variations that define H1 are 241C > T (in 5ʹ‐UTR region), 3037C > T (that causes synonymous change in nsp3), and 14408C > T (that causes Pro312Leu in RdRp). 241C > T and 3037C > T are not obvious candidates for promoting rapid transmission, but the role of the 14408C > T variation should also be considered. It has been reported that the difference between the median number of point mutations in genomes with this RdRp variation (3) is higher than the median number (1) in genomes without the variation. 26 But it may be that this difference is not caused by an effect of the variation on RNA polymerase activity, and instead reflects its almost complete co‐segregation with three other variations that together describe haplotype H1. Finally, two by two comparisons of S1 amino acid sequences and S2 amino acid sequences of various CoVs show that S1 sequences consistently have less sequence identity (Table S6). This may be explained by S1‐mediated species‐specific interactions with host cell receptors and S2‐mediated attachments of the S protein to virus surfaces that may be a function that is less species‐specific. With this consideration, the observation that the frequencies of the S1 and S2 sequence variations among the 2790 SARS‐CoV‐2 sequences are very similar may reflect comparable pressure on each portion of the S protein of this virus to adequately perform its respective function.
4.2. Haplotype analysis
The most important findings of the present study pertain to haplotypes defined by the SNVs identified. Recently, co‐segregation data suggestive of haplotypes and results of some haplotype analyses were published. 24 , 25 , 26 The results that are presented here expand upon the earlier reports in that more haplotypes (some of which are prominent), specific nucleotide sequence variations that define the haplotypes, Tag SNVs for most haplotypes, geographic distribution of the haplotypes, and chronologic emergence of the haplotypes are reported. These findings have practical significance.
Already in an early study on only 95 SARS‐CoV‐2 genome sequences that were available in mid‐February, the relative prevalence of variations at positions 8782 and 28144 was found, but co‐segregation of the two variations was not noted. These variations define the H2 group of haplotypes described here (Figure 4). 31 In another important publication, 103 SARS‐CoV‐2 genome sequences were grouped into two major groups labeled S and L. 24 The groupings were based on the presence or absence of both variations 8782C > T and 28144T > C in any particular genome sequence; the variations showed complete linkage. The L/S designation was because 28144T > C causes a Leu > Ser change in the encoded protein. It is evident that the S group corresponds to the H2 group of haplotypes described here, and the L group corresponds to the composite of non‐H2 associated sequences. In a network presentation of haplotypes (Figure 4 of the publication), it is apparent that the L group contains more sub‐haplotypes than the S group. In that network, various sequences of the L‐associated or S‐associated haplotypes are designated by source ID. 24 Here, the defining SNVs are presented and the haplotypes, specially the non‐H2 haplotypes, are more specifically delineated (Figures 3 and 4).
The first five SARS‐Cov‐2 genome sequences from the very early stages of the COVID‐19 outbreak had 99.9% sequence identity. 2 Among 2790 genome sequences of viruses collected during the following three months, 2360 (84.6%) were associated with 13 haplotype groups that constituted the most frequent haplotypes (Figure 4). The majority of the sequences included in this study (75.1%) were associated with the three haplotype groups H1–H3. The sequences (~15% of the 2790 sequences) that were not included in the described haplotypes can be classified into three groups. Some were associated with rare haplotypes (present in <10 sequences) that are not described here. Some did not define a haplotype because they differed from the reference sequence at only one nucleotide position. For example, 58 sequences carried only the 11083G > T variation and 20 only had the 26144G > T variation. Finally, some sequences (96; 3.4% of the 2790 sequences) were identical to the reference sequence.
The country/territory and region distribution and the time of first emergence of various haplotypes are of interest. The pattern of distribution of haplotype groups in the Far East, Europe, and North America are distinct. Most of the sequences from the Far East were either not associated with any of the haplotypes or were associated with H2, most from Europe were associated with the H1 group, and most from North America were in the H1 or H2 groups. These findings are consistent with earlier reports of differences in frequencies of common sequence variations among various geographic regions. 24 , 25 , 26 The presence of some country/territory‐specific haplotypes is notable. These include haplotypes of group H4 in Hong Kong, the H9 haplotype in Japan, and H13 in Singapore. These haplotypes presumably emerged and/or rapidly expanded in the respective localities. The H7 group constituted a notable fraction of sequences from Netherlands, and the H6 group constituted a notable fraction from Germany and Wales. These findings deserve particular attention by the responsible health agencies of the respective countries/territories.
The results summarized in Figure S5 are consistent with the proposal that the H2 haplotype evolved from sequences of SARS‐CoV‐2 viruses that first infected humans in the Far East. The first report of an H2 haplotype among our samples was in sample hCoV‐19/Wuhan/WHO4/2020|EPI_ISL_406801 collected in Wuhan on January 5, 2020 (GISAID). Sequences of haplotype groups H4 and H13 may also have emerged in countries/territories of the Far East as they were not found elsewhere. H3 and H5 group haplotypes also emerged relatively early, but the data does not clearly distinguish between the possibility of first emergence in the Far East and introduction into the Far East after emergence in another region. The data suggest that H1 haplotypes emerged relatively late (late February) in Europe and then spread to the outside of Europe. It was suggested that the variation 23,403 in the S gene may have contributed to the rapid spread of this haplotype. H6, H7, and H10 group haplotypes may have also evolved in Europe.
Issues pertaining to Tag SNVs for the various haplotypes have significant practical importance, especially for countries/territories wherein sequencing is impractical because of cost and technical limitations. Everywhere, Tag SNVs may be useful for large scale screening programs, including screening of asymptomatic individuals. Data that reflect the efficacy of use of Tag SNVs is available. 26 In a recent study, 13 relatively common SNVs were genotyped in samples from four geographic regions and in samples collected during five‐time intervals spanning late January to late March 2020. The SNVs included two that define H2 as described here (8782, 28144), three that are among the defining SNVs of H1 (3037 (reported as 3036), 14408, 26403), one that defines H1a (28 881), one for each of the haplotypes 2a (18 060), 2aa (11 758 reported as 11 757), and 2aaa (17 747 reported as 17 746), one that defines H5 (1397), and one for H6 (2891). The reported geographic distribution and time of emergence of these SNVs very well mirror our findings regarding the described haplotypes (Figure 5 and S5). As expected, the patterns for the two H2 defining SNVs are similar to each other in the figures of the earlier publication, as are the patterns of the three defining SNVs of H1. Genotyping of 26 144 (reported as 26 143) and 11 083 were also performed in the earlier study. The geographic and chronologic distributions of these variations do not precisely reflect the distributions of specific haplotypes described by us. This is because 26 144 and 11 083 are associated, respectively, with two and five different haplotype groups as described above. It is again emphasized that this and other comparisons of the data in the earlier publication and the data reported here confirm that genotyping of a limited number of SNVs can be an important tool for SARS‐CoV‐2 related objectives.
An important caveat of the present study is possible changes in the profiles of the sequences of various countries/territories and regions over the period spanning late March to the present. Genotyping of Tag SNVs may be used to partially resolve this issue. Of course, it is essential that whole‐genome sequences continue to be monitored for detection of novel variations that may affect efficiency of transmission and/or severity of disease. Novel variations in S are suitable candidates that may affect these parameters. Increase in the frequency of haplotypes that are not defined by the described haplotypes may signal the emergence of important variations. Another important issue is the need to obtain more sequence data or at least SNV data from countries/territories of Africa, South America, the Middle East, and West Asia. Countries/territories of these regions comprise a significant fraction of the world population, and many have limited resources for diagnosis and treatment.
Postscript: A very important article (Korber B et al., 2020, Cell 182: 812‐827; https://doi.org/10.1016/j.cell.2020.06.043) that was published after submission of our manuscript definitively showed an increase in the frequency of the Asp614Gly variation in many geographic regions of the world to the extent that it has become the dominant form in the COVID19 (https://cov.lanl.gov). The authors showed that the variant is associated with higher viral loads, but probably not with increased severity of disease.
CONFLICT OF INTERESTS
The authors declare that there are no conflict of interests.
Supporting information
Supporting information.
Supporting information.
Supporting information.
Supporting information.
Supporting information.
Supporting information.
Supporting information.
Supporting information.
Supporting information.
Supporting information.
Supporting information.
Supporting information.
ACKNOWLEDGMENT
This study was supported by a grant from the National Institute for Genetic Engineering and Biotechnology, Tehran, Iran.
Safari I, InanlooRahatloo K, Elahi E. Evolution of SARS‐CoV‐2 genome from December 2019 to late March 2020: Emerged haplotypes and informative Tag nucleotide variations. J Med Virol. 2021;93:2010–2020. 10.1002/jmv.26553
DATA AVAILABILITY STATEMENT
The data that support the findings of this study are available from the corresponding author upon reasonable request.
REFERENCES
- 1. Wu F, Zhao S, Yu B, et al. A new coronavirus associated with human respiratory disease in China. Nature. 2020;579(7798):265–269. [DOI] [PMC free article] [PubMed] [Google Scholar]
- 2. Zhou P, Yang X‐L, Wang X‐G, et al. A pneumonia outbreak associated with a new coronavirus of probable bat origin. Nature. 2020;579(7798):270–273. [DOI] [PMC free article] [PubMed] [Google Scholar]
- 3. Cui J, Li F, Shi Z‐L. Origin and evolution of pathogenic coronaviruses. Nat Rev Microbiol. 2019;17(3):181–192. [DOI] [PMC free article] [PubMed] [Google Scholar]
- 4. Fung TS, Liu DX. Human Coronavirus: Host‐Pathogen Interaction. Annu Rev Microbiol. 2019;73:529–557. [DOI] [PubMed] [Google Scholar]
- 5. de Wit E, van Doremalen N, Falzarano D, Munster VJ. SARS and MERS: recent insights into emerging coronaviruses. Nat Rev Microbiol. 2016;14(8):523–534. [DOI] [PMC free article] [PubMed] [Google Scholar]
- 6. Coronaviridae Study Group of the International Committee on Taxonomy of Viruses . The species Severe acute respiratory syndrome‐related coronavirus: classifying 2019‐nCoV and naming it SARS‐CoV‐2. Nat Microbiol. 2020:1. [DOI] [PMC free article] [PubMed] [Google Scholar]
- 7. Huang C, Wang Y, Li X, et al. Clinical features of patients infected with 2019 novel coronavirus in Wuhan, China. Lancet. 2020;395(10223):497–506. [DOI] [PMC free article] [PubMed] [Google Scholar]
- 8. Guan W, Ni Z, Hu Y, et al. Clinical characteristics of coronavirus disease 2019 in China. N Engl J Med. 2020. 2020;382:1708–1720. [DOI] [PMC free article] [PubMed] [Google Scholar]
- 9. Coronavirus disease (COVID‐19) outbreak (World Health Organization 2020). https://www.who.int/emergencies/diseases/novel-coronavirus-2019
- 10. Cucinotta D, Vanelli M. WHO declares COVID‐19 a pandemic. Acta bio‐med Atenei Parm. 2020;91(1):157–160. [DOI] [PMC free article] [PubMed] [Google Scholar]
- 11. Li F. Structure, function, and evolution of coronavirus spike proteins. Annu Rev Virol. 2016;3:237–261. [DOI] [PMC free article] [PubMed] [Google Scholar]
- 12. Du L, He Y, Zhou Y, Liu S, Zheng B‐J, Jiang S The spike protein of SARS‐CoV—a target for vaccine and therapeutic development. Nat Rev Microbiol. 2009;7(3):226–236. [DOI] [PMC free article] [PubMed] [Google Scholar]
- 13. Li W, Moore MJ, Vasilieva N, et al. Angiotensin‐converting enzyme 2 is a functional receptor for the SARS coronavirus. Nature. 2003;426(6965):450–454. [DOI] [PMC free article] [PubMed] [Google Scholar]
- 14. Li F, Li W, Farzan M, Harrison SC. Structure of SARS coronavirus spike receptor‐binding domain complexed with receptor. Science. 2005;80‐(5742):1864–1868. 309. [DOI] [PubMed] [Google Scholar]
- 15. Walls AC, Park Y‐J, Tortorici MA, Wall A, McGuire AT, Veesler D. Structure, function, and antigenicity of the SARS‐CoV‐2 spike glycoprotein. Cell. 2020;181(2):281–292. [DOI] [PMC free article] [PubMed] [Google Scholar]
- 16. Yan R, Zhang Y, Li Y, Xia L, Guo Y, Zhou Q. Structural basis for the recognition of SARS‐CoV‐2 by full‐length human ACE2. Science. 2020;80‐(6485):1444–1448. 367. [DOI] [PMC free article] [PubMed] [Google Scholar]
- 17. Hoffmann M, Kleine‐Weber H, Schroeder S, et al. SARS‐CoV‐2 cell entry depends on ACE2 and TMPRSS2 and is blocked by a clinically proven protease inhibitor. Cell. 2020;181(2):271–280. [DOI] [PMC free article] [PubMed] [Google Scholar]
- 18. Walls AC, Tortorici MA, Bosch B‐J, et al. Cryo‐electron microscopy structure of a coronavirus spike glycoprotein trimer. Nature. 2016;531(7592):114–117. [DOI] [PMC free article] [PubMed] [Google Scholar]
- 19. Wan Y, Shang J, Graham R, Baric RS, Li F. Receptor recognition by the novel coronavirus from Wuhan: an analysis based on decade‐long structural studies of SARS coronavirus. J Virol. 2020;94:7. [DOI] [PMC free article] [PubMed] [Google Scholar]
- 20. Ou X, Liu Y, Lei X, et al. Characterization of spike glycoprotein of SARS‐CoV‐2 on virus entry and its immune cross‐reactivity with SARS‐CoV. Nat Commun. 2020;11(1):1–12. [DOI] [PMC free article] [PubMed] [Google Scholar]
- 21. Shang J, Ye G, Shi K, et al. Structural basis of receptor recognition by SARS‐CoV‐2. Nature. 2020;581:1–8. [DOI] [PMC free article] [PubMed] [Google Scholar]
- 22. Lam TT‐Y, Jia N, Zhang YW, et al. Identifying SARS‐CoV‐2 related coronaviruses in Malayan pangolins. Nature. 2020;583:1–6. [DOI] [PubMed] [Google Scholar]
- 23. Zhang T, Wu Q, Zhang Z. Probable pangolin origin of SARS‐CoV‐2 associated with the COVID‐19 outbreak. Curr Biol. 2020;30:1346‐1351.e2. [DOI] [PMC free article] [PubMed] [Google Scholar]
- 24. Tang X, Wu C, Li X. On the origin and continuing evolution of SARS‐CoV‐2. Natl Sci Rev. 2020;7(6):1012–1023. [DOI] [PMC free article] [PubMed] [Google Scholar]
- 25. Forster P, Forster L, Renfrew C, Forster M. Phylogenetic network analysis of SARS‐CoV‐2 genomes. Proc Natl Acad Sci. 2020;117(17):9241–9243. [DOI] [PMC free article] [PubMed] [Google Scholar]
- 26. Pachetti M, Marini B, Benedetti F, et al. Emerging SARS‐CoV‐2 mutation hot spots include a novel RNA‐dependent‐RNA polymerase variant. J Transl Med. 2020;18:1–9. [DOI] [PMC free article] [PubMed] [Google Scholar]
- 27. Katoh K, Standley DM MAFFT multiple sequence alignment software version 7: improvements in performance and usability. Mol Biol Evol. 2013;30(4):772–780. [DOI] [PMC free article] [PubMed] [Google Scholar]
- 28. Kumar S, Stecher G, Li M, Knyaz C, Tamura K. MEGA X: molecular evolutionary genetics analysis across computing platforms. Mol Biol Evol. 2018;35(6):1547–1549. [DOI] [PMC free article] [PubMed] [Google Scholar]
- 29. Rozas J, Ferrer‐Mata A, Sánchez‐DelBarrio JC, et al. DnaSP 6: DNA sequence polymorphism analysis of large data sets. Mol Biol Evol. 2017;34(12):3299–3302. [DOI] [PubMed] [Google Scholar]
- 30. Zhang Y‐Z, Holmes EC. A genomic perspective on the origin and emergence of SARS‐CoV‐2. Cell. 2020;181(2):223–227. [DOI] [PMC free article] [PubMed] [Google Scholar]
- 31. Wang C, Liu Z, Chen Z, et al. The establishment of reference sequence for SARS‐CoV‐2 and variation analysis. J Med Virol. 2020;92(6):667–674. [DOI] [PMC free article] [PubMed] [Google Scholar]
- 32. Neuman BW, Kiss G, Kunding AH, et al. A structural analysis of M protein in coronavirus assembly and morphology. J Struct Biol. 2011;174(1):11–22. [DOI] [PMC free article] [PubMed] [Google Scholar]
- 33. Masters PS. The molecular biology of coronaviruses. Adv Virus Res. 2006;66:193–292. [DOI] [PMC free article] [PubMed] [Google Scholar]
- 34. Freundt EC, Yu L, Goldsmith CS, et al. The open reading frame 3a protein of severe acute respiratory syndrome‐associated coronavirus promotes membrane rearrangement and cell death. J Virol. 2010;84(2):1097–1109. [DOI] [PMC free article] [PubMed] [Google Scholar]
- 35. Law PTW, Wong C‐H, Au TCC, et al. The 3a protein of severe acute respiratory syndrome‐associated coronavirus induces apoptosis in Vero E6 cells. J Gen Virol. 2005;86(7):1921–1930. [DOI] [PubMed] [Google Scholar]
Associated Data
This section collects any data citations, data availability statements, or supplementary materials included in this article.
Supplementary Materials
Supporting information.
Supporting information.
Supporting information.
Supporting information.
Supporting information.
Supporting information.
Supporting information.
Supporting information.
Supporting information.
Supporting information.
Supporting information.
Supporting information.
Data Availability Statement
The data that support the findings of this study are available from the corresponding author upon reasonable request.