

Abstract
Objectives
To evaluate the feasibility of a digital and continuous collection and reporting of patient-reported outcome measures (PROMs) and patient-reported experience measures (PREMs) for chronic heart failure (CHF).
Design
A single-site pilot study was settled for evaluating the feasibility of the intervention, both using qualitative and quantitative data (ie, workshop, surveys).
Setting
The pilot has been implemented in a Tuscan specialised hospital (Italy).
Participants
162 patients were involved. Inclusion criteria were: a previous diagnosis of HF, age ≥18 years, absence of cognitive impairment or active tumours, ability to provide informed consent to study participation.
Intervention
The continuous collection and reporting of PROMs and PREMs has been designed and implemented in 2018. PREMs questionnaires for patients were developed, while Kansas City Cardiomyopathy Questionnaire-12 was used for assessing PROMs. Questionnaires are administered at specific time points: discharge; 30 days, 7 and 12 months after the discharge. Enrolment of patients, administration and real-time reporting of questionnaires are carried on through a digital platform.
Outcome measures
Enrolment, response and drop-out rates were considered to assess the feasibility of the intervention. Qualitative data were collected during meetings and workshops with health workers. The representativeness of the recruited sample with respect to the population characteristics was also evaluated.
Results
The system has been successfully implemented during 2018. Response rates have been consistently above 50%, demonstrating patients’ transversal willingness to participate. All the involved stakeholders acknowledged the feasibility of the design. The recruited sample is significantly different in terms of age and educational level compared with the overall population characteristics.
Conclusion
It is possible to run a web-based systematic collection and reporting system for CHF patient-reported data. Systematic collection and reporting of PROMs and PREMs data allows professionals to increasingly assume CHF patient perspective in their daily work. Limitations will be used to improve the system.
Keywords: patient-reported measures, chronic heart failure, healthcare management, value-based, performance evaluation
Strengths and limitations of this study.
This is the first pilot study of a continuous and systematic data collection of patient-reported measures related to chronic or long-term care field.
The study design can be applied for testing the feasibility of a similar system developed for other chronic diseases and in other geographical and cultural contexts.
Digital platform to manage data collection and reporting, professionals’ engagement, longitudinal assessment of both patient-reported outcome measures and patient-reported experience measures emerged as facilitating factors to implementing the intervention.
Professionals’ role in enrolling patients is demanding and can produce selection biases in the sample.
The use of digital tools can produce self-selection biases due to digital divide.
Introduction
In the healthcare sector, public organisations (POs) are in charge of providing high quality healthcare services, guaranteeing equity and sustainability of the system itself. Healthcare organisations should produce value for their users (personal value), as well as for citizens in general (social value). In order to monitor value creation processes, administrative and clinical data can be complemented by patient-reported measures. There is no evidence on successful experiences of continuous and systematic data collection of patient-reported measures related to chronic or long-term care field. This study presents a pilot experience of implementing a specific design for assessing chronic heart failure (CHF) patients’ pathway, which can be easily replicated in other geographical and cultural contexts.
Theory
Over the last 20 years, the definition of value in healthcare has changed.1 2 Analysing the input–output balance is not anymore considered sufficient to measure value, which is now intended as broader results/benefits to be obtained at the individual level.3 4 The focus has moved to outcomes produced for the individual patient,3 and to the whole population.5 For healthcare systems with universal coverage, where policy-makers and healthcare managers are responsible for the health of an entire population, it is imperative to follow this model. The value-based healthcare framework has been encompassed by the Triple Value one, which includes patient perspective together with population and system perspectives.6 In this model, value is measured also considering whether resources are used for individuals who would benefit most from their investment. When trying to measure the value, it is necessary to consider the broader impact of a specific care decision or a healthcare policy. In addition, value is measured also as outcomes that matter to the individual patient compared with the cost of achieving the same outcomes. In the Triple Value framework, value produced for the patient is meant as both the technical value, given by the cost–benefit ratio, and the personal value, given by the patient evaluation. Consequently, POs in healthcare have increasingly realised the importance of implementing a patient-centred approach also in measuring healthcare activities, by adopting the patient point of view and following his/her cross-setting care pathway.7–9
Therefore, measuring value in healthcare requires a multidimensional and multiperspective approach, which considers the complexity of healthcare systems in terms of involved actors and competing interests and values.1 3 6 10 Several measurement tools are in place to monitor private and POs’ activities in terms of efficiency and effectiveness.3 11 12 Analysing quantitative and qualitative indicators is fundamental to ensure that inputs generate adequate outputs and outcomes.4 For POs, as stated, this is especially true given that they manage collective resources and should produce both individual and collective benefits guaranteeing financial sustainability and equity.1
Traditional measurement tools, when integrated into a performance evaluation system (PES) and used with proper managerial levers, allowed healthcare POs to improve their performance.13 Nonetheless, indicators from administrative data are still the main sources of information for monitoring and assessing healthcare. Despite the value for patients is often revealed over time and across settings,3 10 measurement systems are still not equipped to longitudinally analyse care pathways and outcomes in terms of quality or integration.1 8 9 The focus is still on specific settings and the organisation perspective.3 14 15 In fact, traditional indicators have been focused on measuring adverse outcomes, such as mortality, infections or readmission rates while many other relevant outcomes (eg, quality of life, social limitations, psychological health, etc) cannot be measured without asking patients’ direct feedback.9 14 15 Over the last decades, researchers have worked to stimulate the inclusion of the patients’ voice inside traditional measurement systems.16 17 Still, what matters to patients and families from their actual point of view is often underestimated and not measured.3 15 18
In this perspective, many countries have started to survey patients in order to add patient-reported experience measures (PREMs) and patient-reported outcome measures (PROMs) to their PES as complementary sources of information besides indicators from administrative data.19–22 In particular, PREMs have been first developed to collect patients’ feedback on experience with healthcare services and used as a powerful tool for improving quality of care.16 PROMs, on the other side, are longitudinally collected to measure effectiveness within clinical trials or for improving individual patients’ health status by means of his or her reported functional, psychological and social outcomes.23
These surveys are generally oriented to measure surgical pathways or punctual experiences of patients, like as the hospitalisation, while longitudinal or outcome measurement for chronic diseases is still not well developed.15 A longitudinal assessment of the care that patients receive and the outcome it produces can be crucial to measure value produced in chronic care pathways, although their complexity and diverse characteristics.3 15 Chronic diseases need a daily management that patients and families mostly do. Thus, gathering their point of view over time is crucial, as well as giving them a central role and responsibility in their care pathways.10 24
There are some examples of establishing measurement of outcomes for long term and chronic patients,11 25 mostly as pilot, experimental and one-time projects.26 Evidence is available on successful experiences of continuous and systematic data collection of patient-reported measures, but they are not related to chronic or long-term care field and still present some issues and barriers yet to be addressed and overcome.19 26 In this respect, the administration method is one of the aspects to be considered when designing data collection systems since, for example, chronic and long-term patients can potentially participate in surveys along their whole life.27 Data reporting tools and methods are also fundamental since collecting measurement of outcomes and experiences helps to generate value if patient-reported data are actually used.23 28
In this paper, the authors will present a pilot experience that was conducted to test the feasibility of implementing a digital, systematic and continuous initiative of patient-reported data collection and reporting for patients with chronic heart failure (CHF). This experience is part of the Tuscan PROMs and PREMs Observatory that will be briefly described in the next paragraphs (further information can be find in refs. 29 30). Specific characteristics of the pilot, its preliminary results and managerial implications will be described and discussed. Future perspectives for improving the model are presented in the end.
Method
Data collection system
In 2018, the Fondazione Toscana Gabriele Monasterio (FTGM), a tertiary referral centre for CHF based in Pisa, Italy, started to collect PROMs and PREMs data from patients hospitalised for CHF. All the patients were invited to participate according to the following inclusion criteria: a previous diagnosis of CHF based on guideline criteria,31 32 age ≥18 years, absence of cognitive impairment or active tumours, and ability to provide informed consent to study participation.
All the eligible patients were enrolled consecutively before discharge from the index episode (hospitalisation), when contact information of study participants and their caregivers was collected (figure 1).
Figure 1.
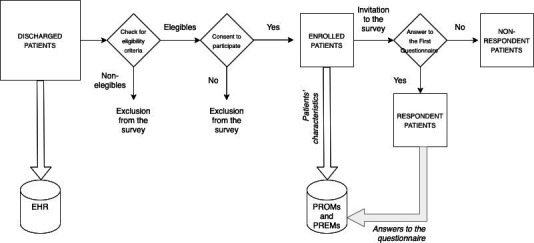
Scheme of enrolment and data collection processes. PREMs, patient-reported experience measures; PROMs, patient-reported outcome measures.
The day after enrolment, a personal link was automatically sent to patients or caregivers by phone or email, according to patient’s preference. The link gave access to the first online questionnaire. Follow-up questionnaires were sent after 1 month, then 7 and 12 months after index hospitalisation. At each time point, patients or caregivers received three reminders to fill the questionnaire (figure 2).
Figure 2.
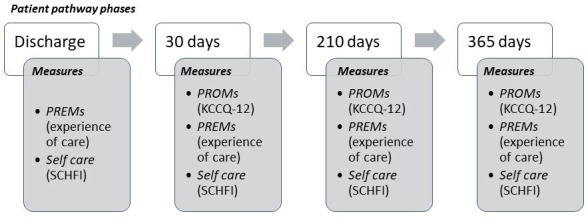
Timeline for administering the questionnaires with a synthetic list of measures. PREMs, patient-reported experience measures; PROMs, patient-reported outcome measures; KCCQ-12, Kansas City Cardiomyopathy Questionnaire-12; SCHFI, Self-Care Heart Failure Index.
Professionals and researchers worked together in selecting or designing questionnaires that include measures of outcomes, experience of care and patient self-care.
Patient-reported outcome measures
The Italian short version of the Kansas City Cardiomyopathy Questionnaire-12 (KCCQ-12) was selected to measure disease-specific outcomes.33 The KCCQ-12 scale explores different dimensions related to CHF: physical limitation (three items), symptoms frequency (four items), social limitation (three items) and quality of life (two items). The total score goes from 0 (worst possible condition) to 100 (best possible condition). The KCCQ-12 was not included in the baseline questionnaire since the recent hospitalisation event would deeply influence patient report of his/her health status, in agreement with International Consortium for Health Outcomes Measurement guidelines.27 By contrast, the KCCQ-12 questionnaire was administered at each follow-up time point, regardless of the occurrence and timing of further HF hospitalisations. At each follow-up time point, a specific question is posed to detect if further hospitalisations actually occurred.
A question on perceived health status in the previous week was included at each time point, including baseline evaluation. Again at each time point, the Italian translation of the Self-Care Heart Failure Index (SCHFI) was included,34 assessing: self-care maintenance (ten items considering all those behaviours that monitor signs and symptoms and maintain HF stable), self-care management (in the subset of patients with dyspnoea or oedema during the previous month: six items measuring symptoms recognition and responses to signs and symptoms of an exacerbation) and self-care confidence (six items assessing patient self-efficacy in performing the entire self-care process). One item of the self-care maintenance domain was modified with the consent of SCHFI authors. This item specifically monitors adherence rate to influenza vaccination, which should be done once a year. This change does not influence the number of items or the algorithm to compute scores.
Patient-reported experience measures
At baseline, patients were asked questions exploring the quality of care before the index hospitalisation and during the hospital stay, distributed into nine items with Likert, single or multiple choice responses (the baseline questionnaire is included in online supplemental appendix A): health professionals caring for them (one item), access to the hospital (one item), previous admissions for HF (three items), coordination between general practitioners (GPs) and cardiologists before the hospitalisation (one item), pharmaceutical dimension (three items).
bmjopen-2020-037754supp001.pdf (98.1KB, pdf)
After 1 month, the questions were related to the experience of care during the index hospitalisation (GP’s role, two items; length of stay, one item; patient and family involvement, two items; emotional support, two items; teamwork of staff, one item; comfort, four items; overall satisfaction, one item), discharge management and organisation of home care (communication efficacy and clarity, six items; follow-up visits, two items; home care, one item; medical aids, one item; out-of-pocket expenditure, one item).
Seven and 12 months after the baseline hospitalisation, questions explored monitoring by clinicians (one item), coordination of care during follow-up (one item), home care (two items), out-of-pocket expenditure (one item), occurrence of acute events (five items), pharmaceutical dimension (four items), follow-up visits (two items).
Data reporting
Data from PROMs and PREMs were collected on a dedicated online platform. Data were managed in an aggregated and anonymised fashion. FTGM specialists involved in the project could access the online platform at any time to check enrolment and aggregated results. The aim of this daily updated platform is to allow managers and professionals having ready-to-use information in order to monitor their activities in terms of patients' experience and outcomes. A thorough data analysis was planned once a year. The present study reports data from the first yearly analysis.
Statistical analysis
Statistical analysis was performed using the STATA software (V.15). The Coarsened Exact Matching procedure was applied35 to match the observations from the PROMs and PREMs survey to the observations from the electronic health records (EHRs), thus identifying the more similar records between the two datasets. Diagnosis of CHF has been used to select patients inside the EHRs. Afterward, age, sex and educational level were considered as variables for matching the records between the two datasets. The matched dataset has been used to verifying if the characteristics of all the discharged FTGM patients recorded in the EHRs and the ones who replied to the first PROMs and PREMs questionnaire are significantly different. The same analysis was performed only considering the records of the PROMs and PREMs dataset, through the comparison of respondents and non-respondents’ characteristics.
Statistical tests on mean values (t-test) or on bivariate distributions (χ2 test) were performed. More in details (figure 3):
Figure 3.
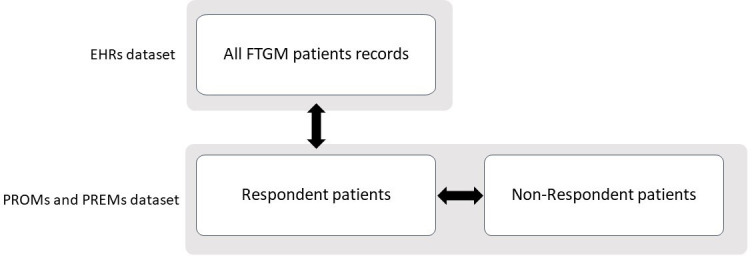
Datasets and population for the comparison of characteristics. EHR, electronic health records; FTGM, Fondazione Toscana Gabriele Monasterio; PREMs, patient-reported experience measures; PROMs, patient-reported outcome measures.
Patients recorded in the EHRs and patients who replied to the PROMs and PREMs survey were compared on age, sex and education level.
Respondents and non-respondents to the PROMs and PREMs survey were compared on age, time since diagnosis, ejection fraction, NYHA class, aetiology, number of comorbidities.
Patient and public involvement
Patients were involved in data collection and in giving feedbacks about the functioning of the platform. The intervention has been designed keeping in mind their specific care pathway, which services they experience during it, which are the non-clinical domains impacted by the pathway.
Results
From February 2018 to February 2019, 162 patients were enrolled for the PROMs and PREMs survey, corresponding to 27% of patients admitted for worsening HF during the same period. Among them, 104 (64%) completed the questionnaire at baseline, 95 (61%) at 1 month, 41 (49%) at 7 months and 9 (31%) at 12 months.
Around 30% of the patients gave only a caregiver contact while the majority of participants gave a personal contact (70%). Among these latter, 39% gave both their telephone number and their email address while only 14 of them gave only the email address.
Patients giving their email contact tend to reply more often than other patients do (t0 response rate 67% vs 64.2%; p=0.09). Response rate was significantly higher when patients gave only a caregiver contact (80% vs 64.2%; p=0.02), and became even higher if this contact information was an email address (84% vs 80%; p=0.005).
Patients and caregivers demonstrated their engagement filling in the questionnaires and contacting research staff regularly in order to pose questions about the survey and signal platform bugs or relevant details regarding their specific care pathway.
Table 1 reports descriptive statistics comparing patients who replied to the first PROMs and PREMs questionnaire versus CHF patients discharged during the same year and registered in the EHRs dataset. PROMs and PREMs sample presents a greater percentage of males compared with CHF FTGM patients in EHRs (p<0.04). There is also a statistically significant difference on education: PROMs and PREMs respondents are more educated (p<0.02).
Table 1.
Descriptive statistics for respondents CHF patients to PROMs and PREMs survey and CHF patients discharged during the same year in FTGM
| Electronic health records | PROMs and PREMs (respondents) | P value | |
| Age (average and %) | 72.97±11.46 (min 32–max 94) |
70.69±11.17 (min 29–max 93) |
0.06 |
| Under 65 | 20.58 | 27.36 | |
| 65–85 | 69.75 | 67.92 | |
| Over 85 | 9.67 | 4.72 | |
| Gender (%) | 0.05 | ||
| Male | 70.44 | 77.36 | |
| Female | 29.56 | 22.64 | |
| Education | 0.01 | ||
| No title/primary school | 40.00 | 24.27 | |
| Secondary school diploma | 28.87 | 32.04 | |
| High school diploma | 22.89 | 33.01 | |
| Degree or more | 8.25 | 10.68 |
CHF, chronic heart failure; FTGM, Fondazione Toscana Gabriele Monasterio; PREMs, patient-reported experience measures; PROMs, patient-reported outcome measures.
A second comparison to check for self-selection bias was made between respondent and non-respondents to the first PROMs and PREMs questionnaire. No statistically significant differences emerged (table 2).
Table 2.
Descriptive statistics for respondents and non-respondents to PROMs and PREMs survey
| PROMs and PREMs (non-respondents) |
PROMs and PREMs (respondents) | P value | |
| Age (average) | 71.34±10.01 (min 43–max 91) |
70.69±11.17 (min 29–max 93) |
0.73 |
| Age classes (% of patients) | |||
| Under 65 | 24.49 | 27.36 | |
| 65–85 | 69.39 | 67.92 | |
| Over 85 | 6.12 | 4.72 | |
| Time since diagnosis (years) | 5.73±6.76 (min 0–max 26) |
5.98±7.3 (min 0–max 36) |
0.84 |
| Ejection fraction (%) | 37.31±11.24 (min 10–max 60) |
34.13±12.53 (min 14–max 70) |
0.13 |
| Ejection fraction classes (% of patients) | |||
| Reduced | 57.14 | 69.81 | |
| Midrange | 30.61 | 20.75 | |
| Preserved | 12.24 | 9.43 | |
| NYHA class (average) | 2.06±0.63 (min 1–max 3) |
2.19±0.57 (min 1–max 3) |
0.21 |
| NYHA classes (% of patients) | |||
| 1 | 16.33 | 8.49 | |
| 2 | 61.22 | 64.15 | |
| 3 | 22.45 | 27.36 | |
| 4 | – | – | |
| Aetiology (% of patients) | 0.45 | ||
| Ischaemic | 46.94 | 40.57 | |
| Non-ischaemic | 53.06 | 59.43 | |
| No of comorbidities (average) | 2.46±1.31 (min 0–max 5) |
2.15±1.36 (min 0−max 6) |
0.17 |
NYHA, New York Heart Association functional classification; PREMs, patient-reported experience measures; PROMs, patient-reported outcome measures.
Some other characteristics of PROMs and PREMs respondents are presented in table 3. The majority of them were retired (67%), while the 12% had a stable job. Around 10% of PROMs respondents lived alone and around 67% of them declared to be married.
Table 3.
Descriptive statistics for actual participants into PROMs surveys
| PROM and PREMs (respondents) | |
| Living alone (%) | 9.71 |
| Married (%) | 66.34 |
| Occupational status (%) | |
| Housewife | 5.83 |
| Not occupied | 0.97 |
| Stable employee | 11.65 |
| Freelancer | 5.83 |
| Artisan | 2.91 |
| Retired | 66.99 |
| Other | 5.83 |
| General health status (%) | |
| Excellent | 1.94 |
| Very good | 8.74 |
| Good | 20.39 |
| Not bad | 45.63 |
| Bad | 23.30 |
PREMs, patient-reported experience measures; PROMs, patient-reported outcome measures.
Table 4 reports the average scores of PROMs for the cohort of patients who answered to the baseline, 1 and 7 months questionnaires. On average, all the measures show an incremental improvement during time.
Table 4.
PROMs scores (patients who replied to the 7 months questionnaire, non-adjusted)
| 7 months cohort (T2) | |
| KCCQ-12 (average total score) | |
| 30 days (T1) | 58.80±26.28 (min 6.25–max 100) |
| 7 months (T2) | 60.09±27.07 (min 6.77–max 100) |
| SCHFI maintenance (average score) | |
| Discharge (T0) | 57.10±20.47 (min 1.44–max 96.66) |
| 30 days (T1) | 60.39±21.37 (min 3.24–max 86.66) |
| 7 months (T2) | 63.87±21.41 (min 2.25–max 93.32) |
| SCHFI Management (average score) | |
| Discharge (T0) | 47.10±21.12 (min 0.16–max 80) |
| 30 days (T1) | 57.5±17.36 (min 25–max 85) |
| 7 months (T2) | 60.42±20.39 (min 20–max 90) |
| SCHFI confidence (average score) | |
| Discharge (T0) | 61.98±21.93 (min 0.25–max 100) |
| 30 days (T1) | 64.38±21.17 (min 1–max 100) |
| 7 months (T2) | 67.69±24.18 (min 0.81–max 100) |
KCCQ-12, Kansas City Cardiomyopathy Questionnaire-12; PROMs, patient-reported outcome measures; SCHFI, Self-Care Heart Failure Index.
Researchers with all the involved staff have conducted regular meetings to analyse implementation difficulties. Based on the collected feedback, the regular process of enrolment, which was thought as completely managed by professionals, has been reshaped involving also nurses to illustrate the project and collect the information needed to register patients into the online platform.
Two formal workshops have been organised to present and discuss the collected data.
The first workshop was aimed at critically analysing the feasibility of implementing and managing PROMs and PREMs data collection after the first year of activity. Looking at the preliminary analyses of data and sharing which were the facilitating factors and the barriers, healthcare workers involved in the project could reflect on what could be valued or adjusted in the following year of activity.
In the second workshop, data were presented and discussed with cardiologists working in the same Local Health Authority (LHA) of FTGM thus serving the same population. The aim of this meeting was to explore the possibility of expanding the data collection to the whole geographic area so to have patient-reported measures from the other hospitals to be compared. They demonstrated to be interested and willing to experimenting the implementation of the system tested in FTGM. Some of these discussants have started to enrol patients in their hospitals since January 2019.
Currently, collaborative efforts are in place both to improve the digital platform and to valuing the information patients are giving back. In fact, thanks to health professionals’ feedback a new ameliorated version of the platform is currently available.
A report has been produced to describe the design and implementation processes together with preliminary results of the pilot phase36 and researchers are working to expand data collection also in other Tuscan LHAs and in other Italian and foreign regions, like they have already done with PREMs survey.29 37
Discussion
A strong interest is emerging about testing tools to collect information on outcomes and experience reported by chronic patients. Both UK and Canada healthcare systems are hypothesising to design similar tools and the Organisation for Economic Co-operation and Development (OECD) Patient-reported Indicator Surveys (PaRIS) initiative is currently in its design phase.11 15 25
The presented Tuscan experience shows that it is possible to implement a systematic and continuous collection and real-time reporting of PROMs and PREMs data for CHF patients within a public funded health system by means of a digital platform.
In particular, the Tuscan experience has some unique characteristics compared with other PROMs and PREMs collection experiences in respect of:
Survey administration: It is structured to collect longitudinal data administering four questionnaires per each enrolled patient.
Data use: Patients’ answers are collected and real time reported right after the experience. Data are longitudinally reported on an online platform allowing for daily, weekly, monthly use both for improving organisational processes and for monitoring hospital staff work and interprofessional coordination. In Tuscany, the permanent PROMs and PREMs observatory is included into the already active PES and the collected data will be used also in benchmarking LHAs on their performance.
Included measures: The presented experience includes questionnaires that measure generic and specific PROMs together with experience of care and self-care dimensions.
Regarding this last point, it was found that patients’ perception of outcomes could affect the experience rating and vice versa.38 This suggests that PROMs and PREMs should be collected in an integrated way, to understand the relationship between them along the patient care pathway. To the best of our knowledge, there are not ongoing continuous, systematic, experiences of integrated collection of PROMs and PREMs.
FTGM experience has been demonstrated to be easily usable and scalable. Working with professionals and managers, it is possible to match the implementation and routine adoption of PROMs and PREMs survey with their current practice of works. Having real-time available data improves physicians’ usage of them.39 Furthermore, the digital platform requires a limited effort from physicians with data collection, analysis and reporting that are completely managed externally. New enrollers can be included whenever it becomes necessary and this characteristic allowed to engaging new hospitals and patients in a relative short period. This easiness ensures usability for both patients and professionals.14
The longitudinal approach is fundamental to reveal if and how much value is created for patients.3 10 The items measuring integration of care and quality of life can give indications on how to manage processes and practices to improve outcomes.
All the interested actors should be involved to overcome the existing barriers to the extension and use of the tool. In particular, scholars are stressing that health professional should be properly informed that a little effort from their side could produce deep advantages in terms of care quality, patient satisfaction and outcomes.19 40 All the meetings and workshops conducted during FTGM pilot experience have been fundamental moments to consolidate healthcare workers’ involvement and to build their trust in patient reporting and data usefulness. Showing administrative and patient-reported data together made them reflect on possible implications on both processes and outcomes of care.
In the beginning, health professionals were sceptic about the feasibility of involving old and sick patients to participate in a web-based and longitudinal collection design. Adhesion and response rates have proved that patients are willing to actively and consistently participate over time, in accordance with Wagle observation on their capacity of using digital tools.41
Some significant differences emerge in terms of sample selection comparing the FTGM CHF records in EHRs and the characteristics of patients enrolled in the PROMs and PREMs survey. Considering the current model of patient enrolment, it is possible to identify at least two sources of bias: first, patients’ self-selection in terms of who consent to participate; second, clinicians’ enrolment activity that is based on personal evaluation of patients’ capacity in participating to the survey. The first source of bias is always present when dealing with surveys, but a possible solution to clinicians’ discretion in inviting patients is to include directly into the EHR system an algorithm to automatically enrol patients. Professionals would have a lower burden and the enrolment would not depend directly on their choices. However, there could be a side effect in terms of professionals’ involvement inside the project and therefore a risk of lowering patient participation and data usage.
A difference on educational level also emerged. One possible explanation is that highly educated patients are facilitated in accomplishing the task of accessing and filling in the questionnaires considered their knowledge and greater amount of cognitive and material resources.
On the other side, no statistically significant difference emerged when comparing between respondent and non-respondent CHF patients to the PROMs and PREMs survey. This evidence can be a first indication that once a patient consent to participate, then she/he will fill in at least the baseline questionnaire. A further check should be done on the phenomenon called attrition, which refers to selection biases occurring from time to time in association to answers to the following questionnaires during the year of participation.42
The vast majority of PROMs and PREMs participants do not live alone and a great part of them are married. This element can be considered as a proxy of available support when needed, thus the high participation into the survey could be linked to this aspect. The Italian context is changing, but it still characterised from family and social support networks that are strongly involved into disease management, especially when this latter is chronically present.43
Finally, measuring broader outcomes can enhance accountability of health systems increasing the level of responsibility for each involved actor in care delivery activities.40 The inclusion of PROMs and PREMs data inside the Tuscan PES will improve the evaluation of CHF management practices. In fact, a coordinated and multiperspective vision of care in CHF patients’ pathway can give information on both processes and outcomes dimensions.
Practice implications
A pilot experience of implementing a digital, automatic and continuous platform to collect and report PROMs and PREMs data for patients with CHF has been presented in this paper. The implementation succeeded and the digital data collection is currently ongoing and involves other two hospitals in Tuscany.
The study design here presented can be replicated in other geographical and cultural settings, as well as in other chronic pathways. The presented results can be useful to support other healthcare organisations in implementing a PROMs and PREMs collection in chronic care pathways.
Professionals are involved in collecting, viewing and using patient-reported data in order to discuss and act with quality improvement actions. PROMs and PREMs data are also pushing them in increasingly assuming patient perspective in their daily work.
These data can enrich measurement systems and management approaches, fostering the orientation of healthcare systems towards a pathway perspective, with a particular consideration for patients and families’ needs and preferences. Adopting this different approach, healthcare services can be innovated leading to an improvement of LHAs performance in terms of both individual and population-based value creation.
Further developments will be oriented at augmenting the tool capacity in capturing the whole patient pathway and extending the methodology to measure other chronic care pathways. Furthermore, both the collection of data and their use should gradually improve, allowing, for example, professionals to access individual data and to have a linkage between PROMs and PREMs data and patients’ EHRs.
Supplementary Material
Acknowledgments
The authors wish to thank the Fondazione Toscana Gabriele Monasterio’s health workers and the patients who participated in the survey. The authors thank also PREMs and PROMs research teams at the Laboratorio Management e Sanità. The authors are particularly grateful to Sabina Nuti and Michele Emdin for their vision, supervision and support.
Footnotes
Twitter: @SabinaDeRosis
Contributors: FP and SDR designed the paper and collected data. FP performed the analyses and drafted the manuscript. All the authors contributed to the interpretation of results. CP critically revised the whole work. All the authors gave the final approval of the version tobe published.
Funding: The authors have not declared a specific grant for this research from any funding agency in the public, commercial or not-for-profit sectors.
Competing interests: None declared.
Patient consent for publication: Not required.
Ethics approval: The study conformed with the 1975 Declaration of Helsinki and was approved by the institutional ethics committee.
Provenance and peer review: Not commissioned; externally peer reviewed.
Data availability statement: No additional data are available.
References
- 1.Gray M. Population healthcare: designing population-based systems. J R Soc Med 2017;110:183–7. 10.1177/0141076817703028 [DOI] [PMC free article] [PubMed] [Google Scholar]
- 2.Weeks WB, Wadsworth EB, Rauh SS, et al. The urgent need to create healthcare value. Healthc Financ Manage 2013;67:136–8. [PubMed] [Google Scholar]
- 3.Porter ME. What is value in health care? N Engl J Med 2010;363:2477–81. 10.1056/NEJMp1011024 [DOI] [PubMed] [Google Scholar]
- 4.Studnicki J, Murphy FV, Malvey D, et al. Toward a population health delivery system: first steps in performance measurement. Health Care Manage Rev 2002;27:76–95. 10.1097/00004010-200201000-00007 [DOI] [PubMed] [Google Scholar]
- 5.Gray JAM. The shift to personalised and population medicine. Lancet 2013;382:200–1. 10.1016/S0140-6736(13)61590-1 [DOI] [PubMed] [Google Scholar]
- 6.Gray M, Jani A. Promoting triple value healthcare in countries with universal healthcare. Healthc Pap 2016;15:42–8. [PubMed] [Google Scholar]
- 7.Goodwin N. Taking integrated care forward: the need for shared values. Int J Integr Care 2013;13:e026. 10.5334/ijic.1180 [DOI] [PMC free article] [PubMed] [Google Scholar]
- 8.Kodner DL, Spreeuwenberg C. Integrated care: meaning, logic, applications, and implications-a discussion paper. Int J Integr Care 2002;2:e12. 10.5334/ijic.67 [DOI] [PMC free article] [PubMed] [Google Scholar]
- 9.Nuti S, De Rosis S, Bonciani M, et al. Rethinking healthcare performance evaluation systems towards the People-Centredness approach: their pathways, their experience, their evaluation. Healthc Pap 2017;17:56–64. 10.12927/hcpap.2017.25408 [DOI] [PubMed] [Google Scholar]
- 10.Donabedian A. The quality of care. How can it be assessed? JAMA 1988;260:1743–8. 10.1001/jama.260.12.1743 [DOI] [PubMed] [Google Scholar]
- 11.Canadian Institute for Health Information Health outcomes of care: an idea whose time has come. Ottawa, Ontario, 2012. Available: https://secure.cihi.ca/estore/productFamily.htm?pf=PFC1888&lang=en&media=0 [Accessed 9 May 2019].
- 12.Nuti S, Vola F, Bonini A, et al. Making governance work in the health care sector: evidence from a 'natural experiment' in Italy. Health Econ Policy Law 2016;11:17–38. 10.1017/S1744133115000067 [DOI] [PMC free article] [PubMed] [Google Scholar]
- 13.Nuti S, Bini B, Ruggieri TG, et al. Bridging the gap between theory and practice in integrated care: the case of the diabetic foot pathway in Tuscany. Int J Integr Care 2016;16:9. 10.5334/ijic.1991 [DOI] [PMC free article] [PubMed] [Google Scholar]
- 14.Appleby J, Devlin N. Getting the most out of PROMs. The King’s Fund, 2010. Available: https://www.kingsfund.org.uk/publications/getting-most-out-proms [Accessed 9 May 2019].
- 15.Slawomirski L, van den Berg M, Karmakar-Hore S, et al. Patient-Reported indicator survey (Paris): aligning practice and policy for better health outcomes. World Medical Journal 2018;64:8–13. [Google Scholar]
- 16.Coulter A. Can patients assess the quality of health care? BMJ 2006;333:1–2. 10.1136/bmj.333.7557.1 [DOI] [PMC free article] [PubMed] [Google Scholar]
- 17.Richards T, Montori VM, Godlee F, et al. Let the patient revolution begin. BMJ 2013;346:f2614. 10.1136/bmj.f2614 [DOI] [PubMed] [Google Scholar]
- 18.Nuti S, Noto G, Vola F, et al. Let’s play the patients music: a new generation of performance measurement systems in healthcare. Management Decision 2018;56:2252–72. [Google Scholar]
- 19.Bradley DCG, Gibbons C, Ricci‐Cabello I, et al. Routine provision of information on patient‐reported outcome measures to healthcare providers and patients in clinical practice. Cochrane Database Syst Rev 2015:CD011589. [DOI] [PMC free article] [PubMed] [Google Scholar]
- 20.Greenhalgh J. The applications of pros in clinical practice: what are they, do they work, and why? Qual Life Res 2009;18:115–23. 10.1007/s11136-008-9430-6 [DOI] [PubMed] [Google Scholar]
- 21.OECD/EU Recommendations to OECD Ministers of health from the high level reflection group on the future of health, 2017. Available: https://www.oecd.org/els/health-systems/Recommendations-from-high-level-reflection-group-on-the-future-of-health-statistics.pdf
- 22.Van Der Wees PJ, Nijhuis-Van Der Sanden MWG, Ayanian JZ, et al. Integrating the use of patient-reported outcomes for both clinical practice and performance measurement: views of experts from 3 countries. Milbank Q 2014;92:754–75. 10.1111/1468-0009.12091 [DOI] [PMC free article] [PubMed] [Google Scholar]
- 23.Black N. Patient reported outcome measures could help transform healthcare. BMJ 2013;346:f167. 10.1136/bmj.f167 [DOI] [PubMed] [Google Scholar]
- 24.Chang S, Gholizadeh L, Salamonson Y, et al. Health span or life span: the role of patient-reported outcomes in informing health policy. Health Policy 2011;100:96–104. 10.1016/j.healthpol.2010.07.001 [DOI] [PubMed] [Google Scholar]
- 25.OECD Patient-Reported indicators survey (Paris). Available: https://www.oecd.org/health/paris.htm [Accessed 9 May 2019].
- 26.Peters M, Crocker H, Jenkinson C, et al. The routine collection of patient-reported outcome measures (PROMs) for long-term conditions in primary care: a cohort survey. BMJ Open 2014;4:e003968. 10.1136/bmjopen-2013-003968 [DOI] [PMC free article] [PubMed] [Google Scholar]
- 27.ICHOM – InternationalConsortium for Health Outcomes Measurement ICHOM heart failure standard set measuring outcomes. Available: https://www.ichom.org/portfolio/heart-failure/ [Accessed 12 Apr 2019].
- 28.Coulter A, Locock L, Ziebland S, et al. Collecting data on patient experience is not enough: they must be used to improve care. BMJ 2014;348:g2225. 10.1136/bmj.g2225 [DOI] [PubMed] [Google Scholar]
- 29.De Rosis S, Cerasuolo D, Nuti S. Using patient-reported measures to drive change in healthcare: the experience of the digital, continuous and systematic PREMs observatory in Italy. BMC Health Serv Res 2020;20:315. 10.1186/s12913-020-05099-4 [DOI] [PMC free article] [PubMed] [Google Scholar]
- 30.De Rosis S, Pennucci F, Nuti S. From the experience and outcome measurement to the engagement in healthcare. 1 Micro & Macro Marketing, 2019: 493–520. [Google Scholar]
- 31.European Society of Cardiology Chronic coronary syndromes - ESC guidelines. Available: https://www.escardio.org/Guidelines/Clinical-Practice-Guidelines/Chronic-Coronary-Syndromes [Accessed 28 Oct 2019].
- 32.www.heart.org Heart failure guidelines toolkit. Available: https://www.heart.org/en/health-topics/heart-failure/heart-failure-tools-resources/heart-failure-guidelines-toolkit [Accessed 28 Oct 2019].
- 33.Spertus JA, Jones PG. Development and validation of a short version of the Kansas city cardiomyopathy questionnaire. Circ Cardiovasc Qual Outcomes 2015;8:469–76. 10.1161/CIRCOUTCOMES.115.001958 [DOI] [PMC free article] [PubMed] [Google Scholar]
- 34.Vellone E, Riegel B, Cocchieri A, et al. Psychometric testing of the self-care of heart failure index version 6.2. Res Nurs Health 2013;36:500–11. 10.1002/nur.21554 [DOI] [PubMed] [Google Scholar]
- 35.Blackwell M, Lacus S, King G, et al. Cem: coarsened exact matching in Stata. Stata J 2009;9:524–46. 10.1177/1536867X0900900402 [DOI] [Google Scholar]
- 36.De Rosis S, Ferré F, Lungu DA. Indagine PROMs patient-reported outcome measures. Rilevazione sistematica dell’esperienza e degli esiti riportati dai pazienti nella sanit toscana. Pisa, 2019. [Google Scholar]
- 37.Noto G, Corazza I, Kļaviņa K, et al. Health system performance assessment in small countries: the case study of Latvia. Int J Health Plann Manage 2019;34:1408–22. 10.1002/hpm.2803 [DOI] [PMC free article] [PubMed] [Google Scholar]
- 38.Kingsley C, Patel S. Patient-Reported outcome measures and patient-reported experience measures. BJA Educ 2017;17:137–44. 10.1093/bjaed/mkw060 [DOI] [Google Scholar]
- 39.Gleeson H, Calderon A, Swami V, et al. Systematic review of approaches to using patient experience data for quality improvement in healthcare settings. BMJ Open 2016;6:e011907. 10.1136/bmjopen-2016-011907 [DOI] [PMC free article] [PubMed] [Google Scholar]
- 40.Luxford K, Safran DG, Delbanco T. Promoting patient-centered care: a qualitative study of facilitators and barriers in healthcare organizations with a reputation for improving the patient experience. Int J Qual Health Care 2011;23:510–5. 10.1093/intqhc/mzr024 [DOI] [PubMed] [Google Scholar]
- 41.Wagle NW. Nejm Catalyst.Implementing patient-reported outcome measures (PROMs), 2017. Available: https://catalyst.nejm.org/implementing-proms-patient-reported-outcome-measures/ [Accessed 30 Apr 2019].
- 42.Verbeek M, Nijman T. Testing for selectivity bias in panel data models. Int Econ Rev 1992;33:681–703. 10.2307/2527133 [DOI] [Google Scholar]
- 43.de Belvis AG, Avolio M, Sicuro L, et al. Social relationships and HRQL: a cross-sectional survey among older Italian adults. BMC Public Health 2008;8:348. 10.1186/1471-2458-8-348 [DOI] [PMC free article] [PubMed] [Google Scholar]
Associated Data
This section collects any data citations, data availability statements, or supplementary materials included in this article.
Supplementary Materials
bmjopen-2020-037754supp001.pdf (98.1KB, pdf)