Abstract
Impacts from the coronavirus pandemic have depressed market returns to corn and soybean farmers in the Midwest, extending pressures that have existed since 2013 and worsened by trade disputes with China. Without large ad hoc federal aid, income on Midwestern grain farms would have been quite low and the ongoing cash flow crunch much worse. Farmland prices have not adjusted downward, in part due to continuing ad hoc federal aid, but also because interest rates have been historically very low. The financial (solvency) position of Midwestern grain farms is surprisingly strong because of the strength in land values. However, the financial condition of Midwestern row‐crop agriculture could deteriorate markedly if recent and large infusions of ad hoc federal aid dissipates or if interest rates rise sharply.
Keywords: Corn, Coronavirus, Farmland, Financial, Prices, Rent, Soybeans
JEL codes: Q12, Q14, Q18
At the very least, the coronavirus pandemic and the control measures put in place as a response have further depressed market demand for corn and soybeans, particularly in the short‐term. This impact on demand comes on the heels of prices that have already fallen from record highs in 2012 as supplies outpaced demand, and then were driven down further as trade conflicts became evident in 2018. Combined, the tariff‐trade conflict and the coronavirus control measures have significantly reduced demand for grains.
While there is a legislatively mandated federal farm safety net that consists of commodity title and crop insurance programs, the Trump administration has responded to the trade conflict and coronavirus with additional ad hoc payments in the form of Market Facilitation Program (MFP) and Coronavirus Food Assistance Program (CFAP) payments. The additional federal aid from the MFP payments in 2018 and 2019 improved farm returns in those years. In 2020, and perhaps into 2021, federal aid will provide a backstop for farm incomes. Moreover, low interest rates have aided in sustaining farm asset values, including farmland prices. The combination of ad hoc federal aid and low interest rates provides support for the financial positions of Midwestern row‐crop farmers.
We place coronavirus impacts on Midwestern row‐crop agriculture into context by providing relevant background on US corn and soybean demand. In particular, growth has slowed for the two demand factors that were the driving forces behind the boom in prices from 2006 to 2013: (i) corn used in producing ethanol, and (ii) soybean exports primarily to China. Simply put, the pandemic has worsened an already stagnant corn and soybean demand situation, perhaps for a long duration. This weakening will lower returns unless federal aid continues. We then show how additional aid has provided financial relief to Midwestern farmers. This aid has switched from traditional safety net programs—commodity title programs and crop insurance—to programs designed by the Trump administration that are more ad hoc and uncertain going into the future. This uncertainty creates concern because of the important role that the aid has undoubtedly played in offsetting short‐term income losses, lessening farm financial deterioration, and supporting farmland prices and rents. The situation remains highly uncertain and fluid.
Historic Corn and Soybean Demand
Corn and soybeans are the predominant crops in the Corn Belt. Three states in the heart of the Corn Belt—Illinois, Indiana, and Iowa—each averaged 94% of total crop area in corn and soybeans from 2017 to 2019. The demand for these crops fundamentally affects price levels and incomes of Midwestern grain farms.
The major demands for corn are feed, ethanol, and exports, with ethanol growing very rapidly in the mid‐2000s. Figure 1 shows the typical breakdown of corn demand in three categories: (i) livestock feed and residual, (ii) food, alcohol and industrial (FAI) use, and (iii) exports. Powered by growth in ethanol, FAI grew from 2,335 million bushels in 2003 to 6,566 million bushels in 2013, an increase of 4,166 million bushels, or 181%. Since 2013, ethanol demand has been relatively stable, as have feed and export demands. Feed and residual demand declined during the ethanol build, in part due to increased use of distillers' grains (an ethanol byproduct) as a feed substitute for corn.
Figure 1.
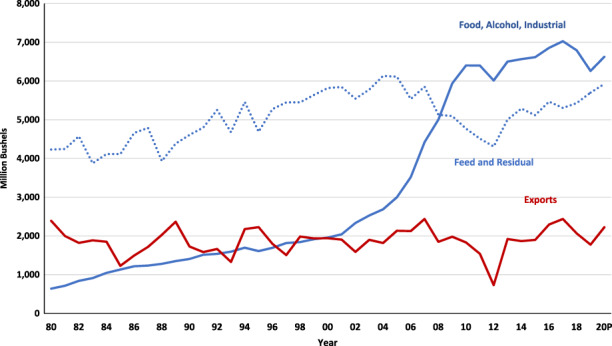
Corn use in the United States, 1980‐2020P [Color figure can be viewed at wileyonlinelibrary.com]
The increase in ethanol production that started in 2005 caused corn prices to rise sharply. From 1975 to 2006, monthly US corn prices varied around a plateau of $2.36 per bushel (Irwin and Good 2016). From 2007 through 2013, monthly corn prices averaged $4.94 per bushel. Growth in ethanol production, along with short crops in the US and other major corn producing areas of the world, played a key role in this price increase. When ethanol production stopped growing, corn prices fell, averaging about $3.65 per bushel since 2013.
US soybeans primarily have two demands: domestic crush and exports. While domestic crush has been growing over time, as figure 2 shows, exports have grown even faster. From 1990 to 2016, exports grew from 557 million bushels in 1990 to 2,134 million bushels in 2017, an average yearly increase of 4.5%. Much of this increase came from China, which is now the major consumer of soybeans in the world. China's demand for soybeans increased as its disposable per capita income increased, leading to higher levels of meat consumption.
Figure 2.
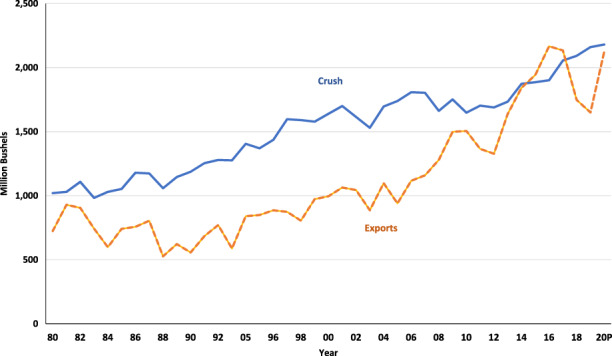
Soybean use in the United States, 1980‐2020P [Color figure can be viewed at wileyonlinelibrary.com]
Growth in US soybean exports ended abruptly in 2018, with soybean exports falling from 2,135 million bushels in 2017 to 1,748 million bushels. Two factors played a role in this decline. African Swine Fever (ASF) dramatically reduced the size of the Chinese swine herd, causing reductions in need for soybeans. Moreover, trade disputes began to impact prices in early 2018, with China imposing a 25% tariff on US soybeans coming into China (See Carriquiry et al. (2019) for a discussion of ASF and tariff impacts).
Coronavirus, Corn and Soybean Demand, and Commodity Prices
Concerns about the coronavirus and resulting control measures began to take shape in March 2020. Both futures and cash prices of corn and soybeans fell. Central Illinois cash corn prices fell from a $3.69 per bushel daily average price in January–February to a $3.06 average in April–June 2020, a decline of 20%. Soybean prices fell from an $8.89 per bushel daily average price in January–February 2020 to an $8.39 per bushel daily average in April–June, a decline of 6%. Corn prices declined more because control measures for coronavirus transmission were expected to have a larger impact on corn usage through reduction in demand for ethanol blended into motor vehicle fuels (Irwin and Hubbs 2020). As the extent of the crisis became clearer, coronavirus control measures also had a major impact on corn and soybeans fed to livestock, and on corn and soybeans exported. Moreover, the impacts of the control measures could be long lasting, with persistent effects that could extend well beyond the effective end of the pandemic crisis.
Ethanol demand now is largely limited to the “blend wall” level of 10% of gasoline demand. Figure 3 shows that as gasoline demand fell during the lockdown phase of the coronavirus pandemic, ethanol production decreased proportionately. Some estimates of the reduction in ethanol production are close to a billion barrels (Voegele 2020). Less ethanol production directly impacts corn used for making ethanol, which leads to higher corn stocks and lower corn prices. At this point, it is unknown how long gasoline and ethanol demand will be down. There is some hope that a V‐shaped recovery will occur, and that ethanol demand will rebound quickly. However, the latest data indicate the recovery is more “swoosh‐shaped” than V‐shaped (Irwin 2020). Conversely, fuel demand could be permanently and negatively impacted if some of the remote work practices become permanent.
Figure 3.
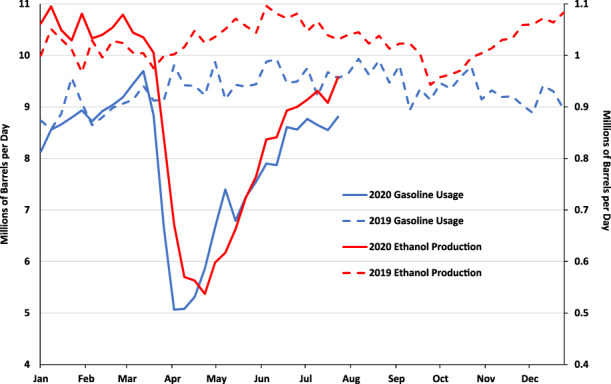
Weekly U.S. gasoline usage and ethanol production in 2019 and 2020 [Color figure can be viewed at wileyonlinelibrary.com]
Livestock and dairy production faced severe disruptions as supply chains switched to distributing more food through grocery stores than through retail restaurants and institutional outlets. Moreover, COVID‐19 infections closed and slowed meat and dairy processing plants (Crowley 2020). The Agricultural Market Service (AMS) estimated that pork processing capacity was used at only 53.9% of full capacity at its lowest in April, but has been increasing and is close to pre‐COVID levels as of June 2020 (Haley 2020). Given the time lags in production and breeding decisions, hog producers had to slow growth of finishing pigs, abort sows, reduce the breeding herd, and finally, euthanize overweight feeder pigs. All of which is to say that lower feed demand was an immediate consequence of coronavirus control measures. Similar dynamics occurred in the beef, poultry, and dairy sectors.
The coronavirus pandemic could have longer‐run impacts on meat demand. If coronavirus control measures result in a lingering recession, then meat demand will decline, livestock production will decline, and corn and soybean demand for livestock feed will decline. A lingering recession will lower corn and soybean prices.
The coronavirus generally would not be viewed as a positive for export demand, although the linkages of the pandemic to exports are less direct than to domestic livestock feed and ethanol demand. In recent months, China agreed to purchase US agricultural products as part of a first phase of an effort to settle the trade war between the two nations (Good 2020). Even if China meets its commitments, which has been widely questioned, the impact on total longer‐term demand for agricultural products is uncertain. China still is dealing with the after‐effects of ASF and may be facing a recession, which could slow growth in meat consumption and thus farm imports by China, which would have lingering negative impacts on corn and soybean prices.
In total, it is clear that the coronavirus control measures have had a negative impact on corn and soybean demand, leading to lower prices, but the extent is still not fully determined. At its Agricultural Outlook conference in February 2020, the US Department of Agriculture (USDA) projected a 2020/21 Market Year Average (MYA) price of $3.85 (Schnitkey et al. 2020a). The USDA has been steadily revising its price projection for 2020/21 downward, and as of August 2020, it was only $3.10 per bushel (OCE/USDA 2020). The majority of this decline is attributed to the coronavirus control measures.
Farm Returns
Lower commodity prices directly affect farm returns. Figure 4 shows corn and soybean returns from cash rented farmland in central Illinois (Schnitkey et al. 2020b). Historical data up to 2019 are drawn from the Illinois Farm Business Farm Management Association (FBFM) records. FBFM currently has almost 25% of Illinois row‐crop acres enrolled. Its historical returns provide an excellent barometer for returns in the Midwest. Returns for 2020 and 2021 are projections. Returns were relatively high from 2006 to 2013 during the period corresponding to ethanol‐driven growth. Since ethanol growth ended, returns have been marginal from 2014 through 2018.
Figure 4.
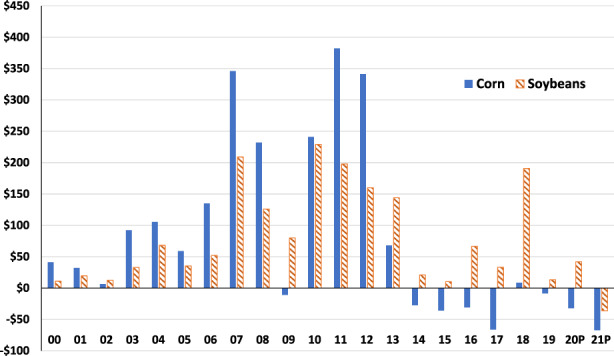
Returns to cash rent farmland in central Illinois on high‐productivity farmland, 2000 to 2021P [Color figure can be viewed at wileyonlinelibrary.com]
While returns in 2018 and 2019 are roughly similar to returns in 2014 through 2017, they would have been much lower without the Market Facilitation Program (MFP) payments (Coppess et al. 2019). MFP payments were created to compensate farmers for trade disruptions. In 2018, the per bushel rate payments resulted in total payments equal to $1 per acre on corn and $121 per acre for soybeans in central Illinois, resulting in large, positive soybean returns, particularly when paired with high yields. MFP payments totaled $82 per acre in 2019. Without the 2019 MFP payments, returns would have been the lowest in any year since 2000.
The 2020 projections are for a ‐$32 per acre return for corn and a $42 per acre return for soybeans. This projected return, however, assumes Congress and the USDA continue Federal aid for corn and soybeans at the rate of $80 per acre. Again, 2020 returns would be negative without this Federal aid.
Returns for both corn and soybeans are projected to be negative in 2021 at ‐$67 per acre for corn and ‐$36 per acre for soybeans. These returns are based on trend yields, and price projections of $3.45 per bushel for corn and $8.35 per bushel for soybeans, both of which depend on a recovery in prices following a return to more normal economic activities, and without any Federal aid. Widespread negative financial returns to agricultural producers would result in continued pressures for ad hoc federal aid, however.
Federal Agricultural Policy
Much debate has gone into a federally legislated farm safety net program that includes commodity title programs and crop insurance. These programs provide counter‐cyclical payments compared to farm returns in the market (Zulauf, Schnitkey, and Langemeier 2020). Both the trade dispute and coronavirus response resulted in instituting ad hoc or supplemental programs. Notably, as shown in figure 5, these ad hoc programs now provide more aid than commodity title programs. Besides the MFP program, a 10% top‐off payment was made on 2019 prevent plant payments and the Wildfires and Hurricane Indemnity Program Plus (WHIP+) provided protection to farmers in disaster areas (Swanson et al. 2020a). These two programs were authorized before coronavirus control measures were implemented and provided assistance in addition to traditional safety net programs.
Figure 5.
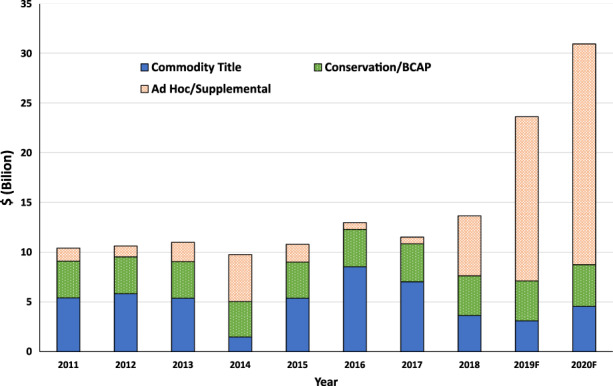
Federal aid by captegory, 2011 to 2020F [Color figure can be viewed at wileyonlinelibrary.com]
So far, coronavirus control measures have resulted in three programs offering aid to Midwestern farmers. CFAP (Coronavirus Farm Assistance Program) is designed to provide partial payments on price losses from the coronavirus pandemic (Paulson et al. 2020). For grains, this largely compensates farmers for losses on grain held in inventory from 2019 production. Farmer were also eligible for loans through the Paycheck Protection Program (Lattz et al. 2020) and the Economic Injury Disaster Loan (EIDL) program (Swanson et al. 2020b), both of which provide low interest rate loans and potential for portions of the loans to be forgiven. Most observers believe that additional Federal aid to the agricultural sector likely is coming.
Federal aid has cushioned the financial blow to Midwestern farmers related to both trade disputes and coronavirus control measures. This federal aid also likely has created a level of dependency and expectations for continued support. While those expectations exist, there are no current legislative or administrative commitments for continued additional federal aid to farmers into 2021 and beyond. All else equal, unless corn and soybean prices rebound, expiration of this additional federal aid would result in deteriorating farm financial positions.
Farmland Rental and Land Markets
Cash rents in most Midwestern states have remained relatively stable since 2013. In Illinois, for example, cash rents nearly doubled from $132 per acre in 2006 at the beginning of the ethanol boom period to $234 per acre in 2014. Since 2014, cash rents have declined slightly to $218 per acre in 2017, before increasing in 2018 to $223 per acre, $224 in 2019, and back slightly to $222 per acre for 2020 according to USDA. Given the marginal returns to farmland, farmers and landowners have largely paused cash rent changes. Cash rental markets are frequently described as “sticky” and slow to change due to the long‐run nature of landlord‐tenant relationships, and the need to negotiate rental arrangements in advance of production. Farmland markets are further supported by lower interest rates, thin and slow turnover of ownership, and the optimism of land market participants given the long‐term view of world food demand. In the interim, federal aid provides the cash flow needed to make cash rent payments and retain control of farmland. Basically, MFP payments in 2018 and 2019 kept farmland returns high enough that cash rents did not decline.
Under the current situation, cash rents appear to be linked directly to the additional federal aid because the payments have kept returns high enough to allow farmers to continue to pay rent at current levels. If federal aid continues, expectations are that cash rents will not decline in 2020 or 2021, but if the additional aid does not continue, a decline in cash rents would be likely. Negative returns in central Illinois would average about ‐$52 per acre without continuation of the ad hoc aid. Given notoriously sticky cash rent prices, it would be surprising if 50% or more of these losses were placed into cash rents. If half of the losses moved into cash rents, cash rents in central Illinois would decline by 9.41%.
Farmland prices are not likely to decrease until cash rents decline and may not decrease even with substantial declines in cash rents. Fundamentally, farmland prices are driven by returns to farmland and interest rates (Schnitkey and Sherrick 2011). Interest rates have been very low in recent years and have declined even further since coronavirus control measures were introduced. Hence, while these control measures have reduced crop prices, they have also resulted in support to farmland prices via lower interest rates. Some feel for this situation can be seen in figure 6, which shows cash rent as a percent of land value in Illinois and the ten‐year Constant Maturity Treasury (CMT) interest rate. In general, one is concerned about over‐capitalized land values when cash rent as a percent of land value is significantly below the ten‐year CMT rate, as occurred in the 1980s during the financial crisis and led to a fall in farmland prices. In 2020, cash rent as a percent of land value is still well above the ten‐year rate, partially because of recent declines in the ten‐year CMT rate (0.87% during the first half of 2020). In fact, if we assume land prices remain at current levels, cash rents could decline by 68% and the cash rental rate percentage would still be above the current ten‐year CMT rate. Therefore, farmland price declines do not seem imminent even if cash rents fall as a result of any reductions in ad hoc federal aid. Low interest rates are supporting all asset values including farmland. A critical issue with respect to land prices going forward is how long the current extremely low interest rates will last.
Figure 6.
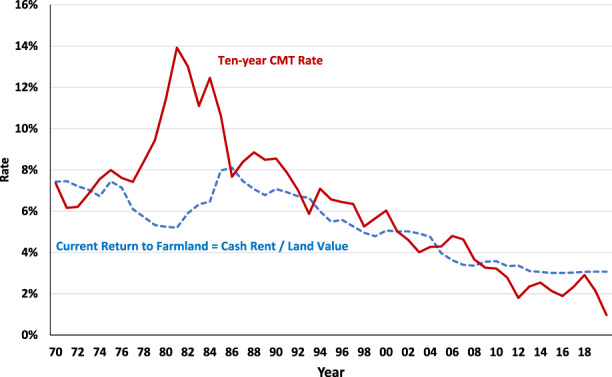
Current return to Illinois farmland compared to ten‐year Constant Maturity Treasury (CMT) Rates. [Color figure can be viewed at wileyonlinelibrary.com]
Financial Position of Farms
Concern exists about the potential for further financial deterioration on farms as a result of lower prices. Some deterioration has occurred since price declines that started in 2013, mostly in the form of reductions in working capital as farmers used cash reserves to make up short falls in cash flow (Schnitkey and S
wanson 2018). Average debt‐to‐asset ratios have also increased, but they remain well below pre‐2006 levels. During the period of high returns from 2006–2013, most Illinois farms significantly reduced debt‐to‐asset ratios, but averages mask variability. While the incidence of farmers with debt‐to‐asset ratios over 0.5 have increased, those percentages are no larger than in the pre‐2006 period (Schnitkey 2018).
Without large ad hoc federal aid, income on Midwestern grain farms would have been quite low and the ongoing cash flow crunch much worse. However, the financial (solvency) position of Midwestern grain farms is surprisingly strong because of the strength in land values. More specifically, debt‐to‐asset ratios have remained low because asset values, primarily farmland, have not declined. The stability in the overall financial position of Midwestern grain farms can be directly traced to the infusions of ad hoc federal aid and low interest rates.
Summary and Conclusions
The coronavirus pandemic has exacerbated a situation of low corn and soybean market returns that began in 2013 and was made worse by trade disputes with China. Without large ad hoc federal aid, income on Midwestern grain farms would have been quite low and the ongoing cash flow crunch much worse. Farmland prices have not adjusted downward, in part due to continuing ad hoc federal aid, but also because interest rates and associated costs of capital supporting farmland have been historically very low. The financial (solvency) position of Midwestern grain farms is surprisingly strong because of the strength in land values. The bottom‐line is that a 1980s‐style farm financial crisis is not imminent so long as ad hoc federal aid does not disappear entirely or interest rates do not rise sharply.
The existence of ad hoc federal aid, as well as the design and size of the payments, present a policy dilemma and raise concerns for agricultural participants: Can the large amounts of federal aid be permitted to expire without causing a major cash flow crisis in the food production sector? An increase in corn and soybean prices would provide the easiest and most obvious reason for eliminating additional federal aid, but the conditions that would lead to commodity price increases are not apparent at the present time. The continued challenge posed by the coronavirus pandemic and resulting control measures drastically reduces the likelihood for demand‐driven price increases. Land market participants likely anticipate continued support for the agricultural sector. If federal aid ends or declines precipitously, land adjustments could be large, depending on the level of interest rates. The potential for large and negative adjustments suggest that political pressures from agricultural groups to continue federal aid will be intense, but this could also prolong necessary adjustments.
Critical issues that will fundamentally shape future federal agricultural policy, and which will determine longer‐term incomes, include the duration and severity of the coronavirus episode, and the confidence of consumers and markets regarding the strength and pace of economic recovery. Long‐term trade conditions and the restoration of world flows of commodities based on comparative advantages rather than on relative trade barriers is also critical to stability of corn and soybean markets. The growth in the demand for food and feed as economies emerge from the pandemic and incomes recover is likewise critical, but the channels of demand may be forever altered from the experiences during the pandemic. Interest rate markets and the cost of capital supporting agricultural assets have been supportive of land prices for over a decade, and the impact of interest rate shocks in agricultural markets could have a pronounced effect at the current low market income levels. In addition, continued political prioritization in the policy making process could also impact the complicated decision‐making for continued support to agriculture, and current events have highlighted several critical linkages in the food system that could affect where and how federal support might be infused into the sector in the future.
Acknowledgements
The authors thank the Illinois Farm Business Farm Management (FBFM) Association for access to the Illinois farm financial data used in the analysis.
Gary D. Schnitkey is the Soybean Industry Chair in Agricultural Strategy at the Department of Agricultural & Consumer Economics at the University of Illinois at Urbana‐Champaign. Nicholas D. Paulson is an associate professor at the Department of Agricultural & Consumer Economics at the University of Illinois at Urbana‐Champaign. Scott H. Irwin is the Lawrence J. Norton Chair of Agricultural Marketing at the Department of Agricultural and Consumer Economics at the University of Illinois at Urbana‐Champaign. Jonathan Coppess is an assistant professor at the Department of Agricultural and Consumer Economics at the University of Illinois at Urbana‐Champaign. Bruce J. Sherrick is the Marjorie and Jerry Fruin professor of Farmland Economics at the Department of Agricultural & Consumer Economics at the University of Illinois at Urbana‐Champaign. Krista J. Swanson, Visiting Research Specialist Department of Agricultural and Consumer Economics at the University of Illinois at Urbana‐Champaign. Carl R. Zulauf is a professor emeritus at the Department of Agricultural, Environmental, and Development Economics at the Ohio State University. Todd Hubbs is an assistant professor at the Department of Agricultural and Consumer Economics at the University of Illinois at Urbana‐Champaign.
Editor in charge: Craig Gundersen
[Correction added on November 18, 2020 after first online publication: The name of the Editor in Charge was misspelled as “Gunderson.” This has been corrected to “Gundersen.”]
References
- Carriquiry, Miguel , Elobeid Amani, Hayes Dermot, and Zhang Wendong. 2019. Impact of African Swine Fever on US and World Commodity Markets. Agricultural Policy Review 2019(3): article 4. https://lib.dr.iastate.edu/agpolicyreview/vol2019/iss3/4
- Coppess, Jonathan , Schnitkey Gary, Zulauf Carl, and Swanson Krista. 2019. The Market Facilitation Program: A New Direction in Public Agricultural Policy? farmdoc daily, November 21, 2019, https://farmdocdaily.illinois.edu/2019/11/the-market-facilitation-program-a-new-direction-in-public-agricultural-policy.html (accessed September 25, 2020).
- Crowley, Cortney . 2020. COVID‐19 Disruptions in the U.S. Meat Supply Chain. Main Street Views: Policy Insights from the Kansas City Fed, July 31, 2020. https://www.kansascityfed.org/research/regionaleconomy/articles/covid-19-us-meat-supply-chain (accessed September 25, 2020).
- Good, Keith . 2020. U.S., China Sign Phase One Trade Deal‐Agricultural Purchases Included. Farm Policy News, January 15, 2020, https://farmpolicynews.illinois.edu/2020/01/u‐s‐china‐sign‐phase‐one‐trade‐deal‐agricultural‐purchases‐included/ (accessed September 25, 2020).
- Haley, M . 2020. U.S. Pork Processing Capacity Utilization Increasing as COVID‐19‐Related Disruptions Recede. Washington DC: U.S. Department of Agriculture, Livestock, Dairy, and Poultry Outlook LDP‐M‐312.
- Irwin, Scott 2020. Ethanol Production Profits during the COVID Pandemic. farmdoc daily, August 13, 2020, https://farmdocdaily.illinois.edu/2020/08/ethanol-production-profits-during-the-covid-pandemic.html (accessed September 25, 2020).
- Irwin, Scott , and Good Darrel L.. 2016. The New Era of Corn and Soybean Prices Is Still Alive and Kicking. farmdoc daily, April 22, 2020, https://farmdocdaily.illinois.edu/2016/04/new-era-of-corn-and-soybean-prices.html (accessed September 25, 2020).
- Irwin, Scott and Hubbs Todd. 2020. The Coronavirus and Ethanol Demand Destruction. farmdoc daily, March 26, 2020, https://farmdocdaily.illinois.edu/2020/03/the-coronavirus-and-ethanol-demand-destruction.html (accessed September 25, 2020).
- Lattz, Dale , Rhea Bob, Schnitkey Gary, Swanson Krista, Paulson Nick and Coppess Jonathan. 2020. The Paycheck Protection Program (PPP) of the CARES Act. farmdoc daily, April 14, 2020, https://farmdocdaily.illinois.edu/2020/04/the-paycheck-protection-program-ppp-of-the-cares-act.html (accessed September 25, 2020).
- Office of Chief Economist, U.S. Department of Agriculture (OCE/USDA) . 2020. World Agricultural Supply and Demand Estimates. Washington DC. https://www.usda.gov/oce/commodity/wasde/wasde0820.pdf
- Paulson, Nick , Schnitkey Gary, Coppess Jonathan, Zulauf Carl, and Swanson Krista. 2020. Coronavirus Food Assistance Program (CFAP) Rules Announced. farmdoc daily May 22, 2020, https://farmdocdaily.illinois.edu/2020/05/coronavirus-food-assistance-program-cfap-rules-announced.html (accessed September 25, 2020).
- Schnitkey, Gary . 2018. Incidence of High Debt‐to‐Asset Ratios Grow over Time. farmdoc daily, December 18, 2020, https://farmdocdaily.illinois.edu/2018/12/incidence-of-high-debt-to-asset-ratios-grow-over-time.html (accessed September 25, 2020).
- Schnitkey, Gary D. , and Sherrick Bruce J.. 2011. Income and Capitalization Rate Risk in Agricultural Real Estate Markets. Choices 26(2). http://choicesmagazine.org/choices‐magazine/theme‐articles/farmland‐values/income‐and‐capitalization‐rate‐risk‐in‐agricultural‐real‐estate‐markets (accessed September 25, 2020).
- Schnitkey, Gary and Swanson Krista. 2018. Incidence of Financial Stress on Illinois Grain Farms. farmdoc daily, October 23, 2018, https://farmdocdaily.illinois.edu/2018/10/incidence‐of‐financial‐stress‐on‐illinois‐grain‐farms.html (accessed September 25, 2020).
- Schnitkey, Gary , Swanson Krista, Hubbs Todd, Zulauf Carl, Paulson Nick, and Coppess Jonathan 2020a. Estimates of MYA Prices for 2019 Thorough 2021, Pre‐ and Post‐COVID‐19, Corn and Soybeans. farmdoc daily, April 28, 2020, https://farmdocdaily.illinois.edu/2020/04/estimates‐of‐mya‐prices‐for‐2019‐thorough‐2021‐pre‐and‐post‐COVID‐19‐corn‐and‐soybeans.html
- Schnitkey, Gary , Swanson Krista, Coppess Jonathan, Paulson Nick and Zulauf Carl. 2020b. MFP and CFAP Payments, Corn and Soybean Uses, and Future Farm Profitability. farmdoc daily, June 10, 2020, https://farmdocdaily.illinois.edu/2020/06/mfp-and-cfap-payments-corn-and-soybean-uses-and-future-farm-profitability.html (accessed September 25, 2020).
- Swanson, Krista , Schnitkey Gary, Paulson Nick, Coppess Jonathan, Brown Ben and Zulauf Carl. 2020a. WHIP+: Farm Aid for Losses Due to Natural Disasters. farmdoc daily, April 21, 2020, https://farmdocdaily.illinois.edu/2020/04/whip-farm-aid-for-losses-due-to-natural-disasters.html (accessed September 25, 2020).
- Swanson, Krista , Schnitkey Gary, Paulson Nick, Coppess Jonathan and Zulauf Carl. 2020b. Pandemic Relief Update: Economic Injury Disaster Loan Program. farmdoc daily, May 12, 2020, https://farmdocdaily.illinois.edu/2020/05/pandemic-relief-update-economic-injury-disaster-loan-program.html
- Voegele, E. 2020. EIA Increases 2020 Ethanol Production Forecast. Ethanol Producer Magazine, May 12, 2020, http://www.ethanolproducer.com/articles/17165/eia-increases-2020-ethanol-production-forecast (accessed September 25, 2020).
- Zulauf, Carl , Schnitkey Gary, and Langemeier Michael. 2020. The US Safety Net, Crop Profitability, and a Floor on Cost of Production. farmdoc daily, July 22, 2020, https://farmdocdaily.illinois.edu/2020/07/the-us-safety-net-crop-profitability-and-a-floor-on-cost-of-production.html


