

Abstract
Introduction
The objective of this study was to identify factors associated with early and long-term pulmonary function (PF) changes after definitive radiotherapy for NSCLC patients. PF was measured by spirometry i.e. forced expiratory volume in 1 second (FEV1), and forced vital capacity (FVC).
Material
Early (within the first year) PF change was analyzed in 211 patients with 986 pair of PF-tests (PFTs). Long-term PF change was analyzed relative to the PF at 12 months after radiotherapy in 106 patients (1286 PFTs). To investigate the impact of patient and treatment related factors on PF, they were tested as covariates in multivariable analysis.
Results
Early PF change was quantified at six months after start of radiotherapy. Smoking status and increasing V60 was associated with significant decrease in PF, whereas smoking was protective. In addition, neoadjuvant chemotherapy had a negative impact on FVC. Long-term FEV1 and FVC were analyzed using linear regression. Treatment year and V60 had significant impact on loss of FEV1. V60 had a significant impact on FVC changes.
Conclusion
In this study, early PF change reached a plateau at 6 months after the start of radiotherapy for NSCLC. Large volume of lung receiving high dose was associated with long-term FEV1 change.
Introduction
Definitive radiotherapy for lung cancer is associated with a range of side effects with radiation pneumonitis (RP) and esophagitis among the main early side effects, and pulmonary fibrosis as one of the late toxicities. Little is known about how the PF is affected by the treatment of lung cancer, although a compromised PF is relevant for the patient’s physical functioning (1). PF can be evaluated by different methods i.e. by spirometry, body plethysmography, and diffusing capacity for carbon monoxide (DLCO). None of these methods has been proven to be superior to another to quantify radiation induced lung damage. Spirometry is a relatively simple, non-invasive method for measuring flow and volume of air from full lung inflation (2). The literature on PF changes, especially long-term changes, after radiotherapy for lung cancer is scarce (3–6) consisting predominantly of reports on studies including relatively few patients treated with varying techniques. Most reports on PF changes after thoracic radiotherapy are in patients with early stage breast cancer (7–10), and malignant lymphoma (11). These reports may be of less relevance to the lung cancer population who presents with smoking- and age-related co-morbidities, often with compromised PF at baseline, and with the malignant disease in the lung.
In the current study, a large data set of PFTs, recorded by spirometry was analyzed. The data were analyzed in two different time windows: 1) early PFT changes within the first year, and 2) long-term PFT changes relative to a baseline at 12 months after commencement of radiotherapy. The two time windows were selected to represent the early and a late phase of pulmonary side effects. Initially, patients may experience improvement of PF due to tumor regression and consequential resolution of atelectasis; subsequently, some patients will experience a transient loss in pulmonary function due to RP. In a proportion of cases, the PF may also be influenced by progression of thoracic disease. The late phase of pulmonary side effects results from the gradual onset of pulmonary fibrosis.
Methods and material
A total of 556 consecutive NSCLC patients with 3,063 pairs of PFTs were screened for eligibility for inclusion in the analysis of PF changes. All patients were treated with definitive radiotherapy in a single institution between 1995 and 2010. The treatment for NSCLC has evolved over time with regard of radiotherapy planning and delivery, and the use of chemotherapy. Details on treatment as well as follow up schedule has been described recently (12). Different radiation fractionation schedules were used: 60 Gy/30-33 fractions (F), 66 Gy/33 F, and 80 Gy/35-40 F, 5 F a week. The lung volume was normalized to unity and the equi-effective dose in 2-Gy fractions was calculated for each dose bin using the linear-quadratic model with α/β=4 Gy (13;14). For each patient complete volume and dosimetric data were available: GTV, PTV, mean lung dose (MLD), Vx for total lung volume (the GTV was excluded from the definition of the total lung volume).
Patients were prospectively registered. Additional data were obtained from patient files. No patients were lost to follow-up. Prior to radiotherapy and at every follow up visit, PF was assessed by spirometry by trained staff according to published guidelines (14). Some variation in the exact time of the follow-up visit occurred in practice. Pragmatically, the ‘three-month assessment’ was defined as a spirometry within 90 days +/−45 days. The same principle was applied to the data related to six, nine, and twelve months. In the analysis on long term PF changes the exact date for follow-up visit was used.
Patient related factors (age, gender, performance status (0-1 vs. 2), stage, smoking history, prior heart disease (yes vs. no), laterality of the cancer (left vs. right), and FEV1 before radiotherapy (<1 liter vs. ≥ 1 liter)); treatment related factors (prescribed dose, neoadjuvant chemotherapy (yes vs. no), concomitant chemotherapy (yes vs. no), and treatment year); and dose volumetric variables (MLD, GTV, volume of total lung receiving more than x Gy (V5 etc.)) were tested as covariates in separate multivariate regression analyses for FEV1 and FVC. Due to the evolution of the departmental treatment guidelines during the study period, treatment year was introduced as a covariate in the analyses. Use of IMRT vs. 3D conformal planning generally leads to a change in dose distribution. To analyze if the change in dose distribution had a significant impact on PF the ratio V50/V5 was calculated for each patient and introduced in the regression analyses as a crude indicator of conformality of the dose distribution.
PFT
Traditionally, PF has been expressed as a percentage of the expected value (14). PF at baseline showed large patient-to-patient variability, and we decided to let the patient act as his/her own control. Thus all PFT values were normalized to a reference value chosen.
Early PF changes
Pulmonary function before the commencement of radiotherapy was the reference value for assessing early PF changes.
Patients were included in the analysis if they were alive for 12 months after radiotherapy with no evidence of thoracic recurrence. This resulted in a study population of 211 patients with 986 PFT’s obtained during the first year of follow up.
To determine whether three, six, nine, or twelve months after the start of radiotherapy would be the most informative time point for assessment of early PF change in this population, mean values for each time point were calculated. The mean value for both the changes in the relative FEV1 and FVC compared to the baseline reached a nadir at six months (Fig. 1 Suppl). Consequently, the relative change in PF at six months after the commencement of radiotherapy was selected as the endpoint for early PF.
Long-term PF changes
To minimize a potential influence of early PF changes (i.e. improvement in PF due to tumor shrinkage and transient PF loss due to RP), the PF at 12 months after start of radiotherapy was the reference value for assessing changes in long-term PF. To be eligible for analysis, a patient should have at least 3 PFTs after reference value. PFT conducted within 6 months of a subsequent manifest intra-thoracic recurrence were retroactive excluded from the analysis. Of the 556 patients screened, 450 patients were excluded for various reasons (Fig. 1) leading to the final study group of 106 patients with 1286 FEV1/FVC pairs of PFTs.
Figure 1:
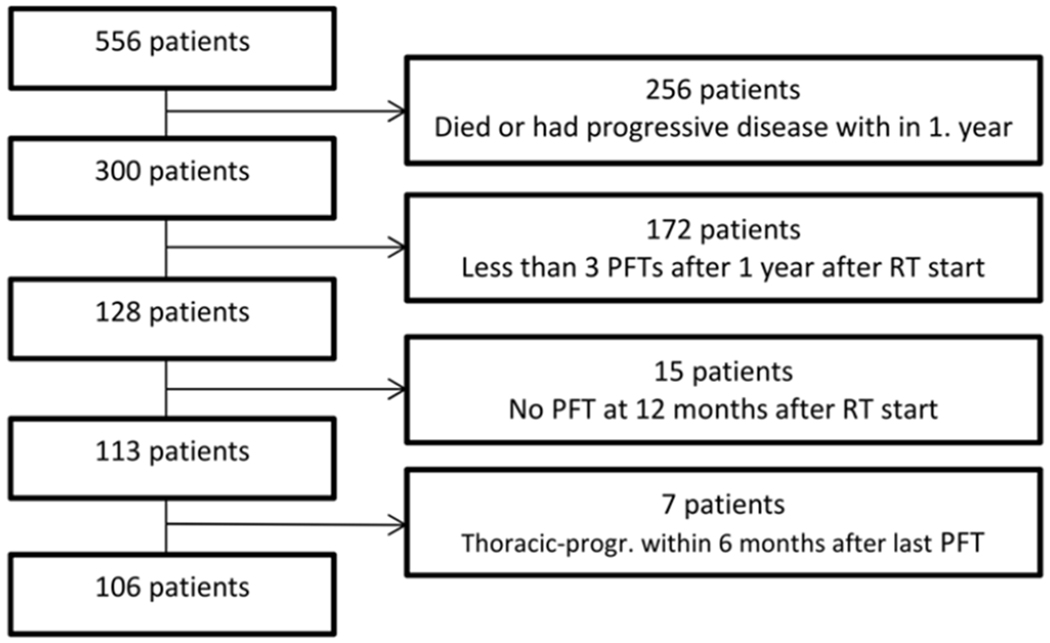
Profile on how patient population for final analysis was established.
Statistics
Early PF changes
Separate multivariable analyses were performed for FEV1 and FVC to assess the impact of various patient related, dosimetric, and volumetric factors on the relative PF at six months compared to baseline. The relative PF at six months was log transformed to stabilize the variance of the dependent variable and analyzed using multiple linear regression analysis:
where n is the number of parameters in the model, zi denotes the numerically coded patient and treatment characteristics, and the βi’s are the coefficients estimated from the regression analysis.
Long-term changes in PFT
PF data in patients with a large number of PFTs were visually inspected as a function of follow-up time and found, within the resolution of the data points, to show a roughly linear change with time (Fig. 2a and 2b). Separate analyses where performed for FEV1 and FVC and the data analysis consisted of two steps.
Figure 2.


a. Data on long-term pulmonary function expressed in FEV1 from 2 patients. The straight lines are the estimated loss, λ in the model. Zero denotes baseline, i.e. 12 months after start of radiotherapy.
b: Data on long-term pulmonary function expressed in FVC from 2 patients. The straight lines are the estimated loss, λ in the model. Zero denotes baseline, i.e. 12 months after start of radiotherapy.
First step:
a linear regression analysis of PF values as a function of time, t, was conducted within each case, index i:
where t was the time of the PFT measured in years after the one-year time point, and c0,i and λi are patient-specific parameters estimated from the regression analysis. The constant c0,i should be close to 1 due to the normalization, but was entered as a free parameter to accommodate uncertainty in the reference PF. λi is the rate of change per year, with negative values corresponding to a loss of function relative to the one-year value with increasing observation time. The two regression parameters and their standard errors of the estimate (s.e.e.) were stored in the data file for the second step of the analysis.
Second step:
Having established the annual rate of PF change in each individual patient, λi, a weighted multiple linear regression analysis of λi as a function of clinical and treatment related covariates was conducted. Each case was weighted by the inverse variance of the estimate of λi, i.e. the weight for patient i was calculated as
Model selection in the analyses of both early and long-term PF changes were based in part on stepwise regression using backward elimination, but was supplemented by tests of alternative models (prioritized regression analysis) whenever relevant.
Analyses were performed using the Statistical Package for Social Sciences (SPSS) version 20.
Results
Patient and treatment characteristics for both study groups are summarized in Table 1.
Table 1.
Baseline characteristics for study group on early PF changes (N=211) and long-term PF changes (N=106).
| Early PF changes (N=211) |
Long-term PF changes (N=106) | ||||
|---|---|---|---|---|---|
| Number | % | Number | % | ||
| Age (years) | Median (range) | 65 | (42-85) | 67.0 | (42-84) |
| Sex | Male | 116 | 55 | 51 | 48 |
| Female | 95 | 45 | 55 | 52 | |
| Performance status | 0-1 | 183 | 87 | 96 | 91 |
| >1 | 28 | 13 | 10 | 9 | |
| Smoking | Never/ former ≥ 10 years | 136 | 65 | 14 | 13 |
| Former < 10 years | 37 | 17 | 24 | 23 | |
| Current | 38 | 18 | 68 | 64 | |
| Histology | Squamouscell carc. | 102 | 48 | 45 | 42 |
| Adenocarcinoma | 78 | 37 | 42 | 40 | |
| Other | 31 | 15 | 19 | 18 | |
| Stage | I-II | 50 | 24 | 32 | 30 |
| III | 146 | 69 | 67 | 63 | |
| IV | 3 | 1 | 1 | 1 | |
| Recurrent | 12 | 6 | 6 | 6 | |
| Dose | 60 Gy | 139 | 66 | 77 | 73 |
| 66 Gy | 63 | 30 | 21 | 20 | |
| 80 Gy | 9 | 4 | 8 | 7 | |
| Treatment year | 1995-2000 | 42 | 20 | 22 | 21 |
| 2001-2005 | 87 | 41 | 46 | 44 | |
| 2006-2009 | 82 | 39 | 38 | 36 | |
| Neoadjuvant chemotherapy | 122 | 58 | 60 | 57 | |
| Concomitant chemotherapy | 38 | 18 | 16 | 15 | |
| Median | Range | Median | Range | ||
| PFT (number/patients) | 5 | 3-8 | 12 | 6-27 | |
| Follow up (months) | - | - | 67 | 21-159 | |
| GTV (cm3) | 42 | 0-674 | 37.9 | 0-233.6 | |
| MLD (Gy) | 15 | 0.5-26 | 14.4 | 3.7-23.9 | |
| V5 total lung (%) | 56 | 1-94 | 50.9 | 16.2-93.9 | |
| V10 total lung (%) | 37 | 1-72 | 35.4 | 8.3-71.8 | |
| V20 total lung (%) | 26 | 0-44 | 25.5 | 3.2-40.6 | |
| V30 total lung (%) | 20 | 0-39 | 18.9 | 0.2-37.3 | |
| V40 total lung (%) | 15 | 0-33 | 13.7 | 0.1-32.1 | |
| V50 total lung (%) | 11 | 0-28 | 9.9 | 0-27.8 | |
| V60 total lung (%) | 4 | 0-25 | 4.5 | 0-24.9 | |
This NSCLC population had impaired PF compared to healthy controls before radiotherapy, with a median FEV1 of 69% of expected in a normal healthy population (range 21-116%) and a median FVC of 87% (range 45-131%) of the expected value.
Results for early PF changes
PFT were conducted at zero, three, six, nine, twelve months after start of radiotherapy. At 3 months 11% and 13% experienced a ≥ 10% improvement in FEV1 and FVC, respectively.
The patterns of PF development during the first 12 months varied considerable between patients.
The only statistically significant patient related factor in the multivariable analysis affecting the relative change in FEV1 at six months was smoking within ten years prior to radiotherapy (p=0.003), which reduced the risk of FEV1 deterioration (Table 2a).
Table 2a:
Final model for early FEV1 change at 6 months relative to baseline. Only covariates associated with significant change in FEV1 are represented in this figure.
| β | s.e.(β) | P | |
|---|---|---|---|
| Constant | −0.112 | 0.034 | 0.001 |
| V60 (total lung) | −1.089 | 0.298 | <0.001 |
| Smoking | 0.094 | 0.032 | 0.003 |
The same results was observed for FVC at six months, where current or smoking within ten years protected against a loss of PF (p=0.02) (Table 2b).
Table 2b:
Final model for early FVC change at 6 months relative to baseline. Only covariates associated with significant change in FVC are represented in this figure.
| β | s.e. (β) | P | |
|---|---|---|---|
| Constant | −0.059 | 0.037 | 0.12 |
| V60 (total lung) | −1.236 | 0.310 | <0.001 |
| Smoking | 0.077 | 0.033 | 0.02 |
| Neoadj. chemotherapy | −0.050 | 0.026 | 0.05 |
None of the treatment related factors had a significant impact on relative FEV1 at six months, while neoadjuvant chemotherapy was significantly associated (p=0.05) with FVC loss (Table 2b).
In the multivariable analysis the only significant factor for FEV1 and FVC loss wasV60 (p<0.001 for both) (Table 2a and 2b).
In summary, current or recent smoking protected against FEV1 loss, whereas increasing V60 of the total lung was associated with an increasing loss. The same held up for FVC but in addition administration of neoadjuvant chemotherapy was associated with a larger loss. The model for loss in FVC is illustrated in Fig 3.
Figure 3.

Model based on early FVC changes at 6 months relative to baseline.
The curves illustrate the model for 4 different groups, and the marks are patient groups.
Group number 1, no neoadjuvant chemotherapy plus smokers* (□ patients were divided into 33 percentiles). The same is true for group 2, neoadjuvant chemotherapy and smokers* (□). Group 3, no chemotherapy and non-smokerso (○) and group 4, chemotherapy and non-smokerso (◊) are each divided into 2 tiles.
The model for FEV1 changes is not illustrated, since it is the same model despite there is only two covariates having a significant effect on FEV1 changes at 6 months.
*smokers were defined as people having smoked within the last 10 years.o Non-smokers were defined as never smoker or former- smokers ≥10 years.
Results on long-term PF changes
At one year, FEV1 and FVC were still impaired compared to a healthy population: The median FEV1 is 63% (range 15-112%) and the median FVC is 83% (range 33-129%).
The long-term change in PF relative to the 1-year baseline was estimated by linear regression. Relative to the 1-year-FEV1 most patients experienced a decrease in FEV1 over time. The change in FEV1 per year, varied considerably among patients (Fig. 2a). Change in FVC over time was also estimated by linear regression, again with large inter-patient variation (Fig. 2b).
Treatment year was the only risk factor for significant change in FEV1 in the multivariable analyses (p=0.007) (table 3a), meaning that the earlier the patient was treated in this time period, the larger the loss in FEV1. None of the tested patient related factors were significantly associated with the rate of FVC loss.
The only significant risk factor in this regression analysis for FEV1 was V60 (Table 2c).
Table 2c:
Final model for yearly (long-term) FEV1 loss relative to 12 months value. Only covariates associated with significant change in FEV1 are represented in this figure. Treatment year is measured in years.
| β | s.e.(β) | P | |
|---|---|---|---|
| Constant | −5.249 | 0.918 | <0.001 |
| Treatment year | 0.292 | 0.107 | 0.008 |
| V60 (total lung) | −23.497 | 11.711 | 0.48 |
In the regression analysis of FVC; V60 was also the only significant factor in the multivariable analyses associated with change in FVC (p=0.002) (Table 2d). It was, however, a protective factor; hence the higher V60 the smaller FVC loss.
Table 2d:
Final model for yearly (long-term) FVC loss relative to 12 months value. V60 was counter-intuitive a “protective” factor against significant FVC loss.
| β | s.e.(β) | P | |
|---|---|---|---|
| Constant | −2.012 | 0.592 | 0.001 |
| V60 (total lung) | 29.110 | 9.258 | 0.002 |
MLD was tested separately in the model, but did not have a significant impact on changes in either of the PFT measurements.
Discussion
To our knowledge this is the largest study on early and long-term PF changes in NSCLC patients after definitive radiotherapy measured by changes in FEV1 and FVC. Early PF loss was timed to six months after start of radiotherapy. In the analysis on long-term PF changes a, roughly linear, decline were seen in FEV1 and FVC over time relative to the 12 months baseline. The decline was especially pronounced in FEV1. However, large inter-patient variations in the actual measured PF were seen, such that some patients did not have any reduction in PF at all. Even though a large number of patient-, treatment-, and dose volumetric covariates were available in this study few of these were found to be statistically significant associated with the yearly rate of FEV1 decline, except V60 and treatment calendar year. The result on treatment year as a risk factor could be interpreted as a general shift towards less pulmonary toxicity over time due to a continually refinement of therapy: use of more advanced radiotherapy with more conformal dose distribution and 4D planning with smaller margin as a consequence of the latter. However, it was not possible in the modeling to pin down exactly which factor(s) may have contributed to this decrease in late functional loss. The FVC result from the regression analyses on long-term changes is much more challenging to interpret since V60 was a protective factor. A possible explanation of this counter-intuitive result might be that the FVC maneuver can be quite challenging for patients with impaired PF, and therefore difficult to reproduce.
Interpreting the results in clinical practice is challenging. Besides it remains unclear to what extent a decline in either of the different PF parameters affects the patient’s quality of life, which depends on the patient’s ability to cope with a loss in PF (15). The majority of NSCLC patients are elderly (and often have comorbidity), and they do not have the same level of activity as a young person. Besides, a deterioration in PF may not be noticed, as long as the onset is slow, i.e. the patients adapt to pulmonary function deterioration. On the other hand, patient factors such as poor performance status, poor pre-treatment PF (FEV1< 1 liter), and older age, which usually would be of concern from a clinically point of view, did not turn out to be significant factors for PF deterioration. The number of fragile patients in the current study were, however, small, and the study might not have the statistical power to identify all significant factors for loss in PF.
The literature on pulmonary function after definitive radiotherapy for NSCLC is sparse and not quite consistent, with some of the earliest literature dealing with patients treated with more traditional radiotherapy techniques (two opposing beams), with significant less number of patients (3;16), and in some studies with a mixed population with different primary cancers (17). A large study on PF changes after stereotactic body irradiation therapy (SBRT) did not find a dose-effect relationship (18). The irradiated volumes in SBRT are often smaller and the fractionation different from conventional fractionation schedules. PF, FEV1/VC ratio and DLCO, after various types of modern radiotherapy for NSCLC were studied by Lopez et al (19). They found a negative effect on DLCO in nearly all patients within the first year regardless of radiotherapy techniques. The decrease was associated with several factors: GTV, pretreatment DLCO (low), and dose-volume metrics (MLD, V5 and V20 for lungs, mean heart dose and V40 for the heart). The same was not seen for the FEV1/VC ratio, which was more variable, and a decrease was not associated with any of the tested covariates except for low pretreatment DLCO. They concluded that DLCO was more affected than other PF parameters after radiotherapy. This conclusion is in line with pathological studies on the radiation pneumopathy which show predominantly alveolar changes and fibrosis. These parameters are measured with diffusion capacity, whereas spirometric variables such a FEV1 and FVC measure airway resistance, and may not be the optimal tests to assess radiation induced damage. However, there is no current consensus on the best way to evaluate radiation induced pulmonary damage. Our study of PF assessed by FEV1 and FVC is strengthened by the large number of patient included in the study and the long follow up compared with other studies on NSCLC patients after definitive radiotherapy. Furthermore, this series included only patients treated with more advanced planning. The patients in the study were consecutively treated in contrast to the more selected cases included in clinical trials, where patients with poor performance status, low pretreatment PFT, or old of age are most often excluded. Nevertheless, the patients in our study on long-term PF changes also constitute a selected group of patients since they had to be alive for at least 21 months without intrathoracic progression to be eligible for the study. Compared with the group of patients (N=556) from which this group is extracted they differed in size of GVT (37 cm3 in the study population vs. 86 cm3 in baseline population), and gender (52% women in the study population vs. 42% in baseline population), but otherwise the study population and baseline population were similar.
In the current study, the large number of covariates tested increases the risk of false positive findings. However, due to the sparse information changes in PF after radiotherapy, especially on long term PF, the current study was performed as a hypothesis-generating analysis of retrospective data, and our findings will require validation in independent datasets in the future.
Conclusion
We succeeded in assessing and analyzing changes in PF after definitive radiotherapy in NSCLC patients and derived statistical models of early and late PF changes in a large dataset. Although significant deterioration of pulmonary function is seen, the changes are in most cases relatively modest compared to the patient-to-patient variability in PF. Even though several risk factors for early and late changes in PF were identified in this study, an alternatively conclusion might be: Pulmonary function assessed by spirometry is not an optimal tool for evaluating lung damage after radiotherapy.
Supplementary Material
Acknowledgements:
This work was supported by CIRRO- The Lundbeck Foundation Centre for Interventional Research in Radiation Oncology and The Danish Council for Strategic Research. It was also supported in part by grant no. P30 CA 134274-04 from the NCI.
Reference List
- (1).Xie G, Li Y, Shi P, Zhou B, Zhang P, Wu Y. Baseline pulmonary function and quality of life 9 years later in a middle-aged Chinese population. Chest 2005. October;128(4):2448–57. [DOI] [PubMed] [Google Scholar]
- (2).Liang BM, Lam DC, Feng YL. Clinical applications of lung function tests: a revisit. Respirology 2012. May;17(4):611–9. [DOI] [PubMed] [Google Scholar]
- (3).Borst GR, De Jaeger K, Belderbos JS, Burgers SA, Lebesque JV. Pulmonary function changes after radiotherapy in non-small-cell lung cancer patients with long-term disease-free survival. Int J Radiat Oncol Biol Phys 2005. July 1;62(3):639–44. [DOI] [PubMed] [Google Scholar]
- (4).De Jaeger K, Seppenwoolde Y, Boersma LJ, et al. Pulmonary function following high-dose radiotherapy of non-small-cell lung cancer. Int J Radiat Oncol Biol Phys 2003. April 1;55(5):1331–40. [DOI] [PubMed] [Google Scholar]
- (5).Gopal R, Starkschall G, Tucker SL, et al. Effects of radiotherapy and chemotherapy on lung function in patients with non-small-cell lung cancer. Int J Radiat Oncol Biol Phys 2003. May 1;56(1):114–20. [DOI] [PubMed] [Google Scholar]
- (6).Enache I, Noel G, Jeung MY, et al. Impact of 3D Conformal Radiotherapy on Lung Function of Patients with Lung Cancer: A Prospective Study. Respiration 2012. November 13. [DOI] [PubMed] [Google Scholar]
- (7).Jaen J, Vazquez G, Alonso E, Leon A, Guerrero R, Almansa JF. Changes in pulmonary function after incidental lung irradiation for breast cancer: A prospective study. Int J Radiat Oncol Biol Phys 2006. August 1;65(5):1381–8. [DOI] [PubMed] [Google Scholar]
- (8).Krengli M, Sacco M, Loi G, Masini L, et al. Pulmonary changes after radiotherapy for conservative treatment of breast cancer: a prospective study.1. Int J Radiat Oncol Biol Phys 2008. April 1;70(5):1460–7. [DOI] [PubMed] [Google Scholar]
- (9).Erven K, Weltens C, Nackaerts K, Fieuws S, Decramer M, Lievens Y. Changes in pulmonary function up to 10 years after locoregional breast irradiation. Int J Radiat Oncol Biol Phys 2012. February 1;82(2):701–7. [DOI] [PubMed] [Google Scholar]
- (10).Jaen J, Vazquez G, Alonso E, et al. Long-term Changes in Pulmonary Function After Incidental Lung Irradiation for Breast Cancer: A Prospective Study With 7-Year Follow-up. Int J Radiat Oncol Biol Phys 2012. December 1;84(5):e565–e570. [DOI] [PubMed] [Google Scholar]
- (11).Theuws JC, Muller SH, Seppenwoolde Y, et al. Effect of radiotherapy and chemotherapy on pulmonary function after treatment for breast cancer and lymphoma: A follow-up study. J Clin Oncol 1999. October;17(10):3091–100. [DOI] [PubMed] [Google Scholar]
- (12).Hansen O, Schytte T, Nielsen M, Brink C. Age dependent prognosis in concurrent chemo-radiation of locally advanced NSCLC. Acta Oncol 2014. October 7;1–7. [DOI] [PubMed] [Google Scholar]
- (13).Bentzen SM, Skoczylas JZ, Bernier J. Quantitative clinical radiobiology of early and late lung reactions. Int J Radiat Biol 2000. April;76(4):453–62. [DOI] [PubMed] [Google Scholar]
- (14).Quanjer PH, Tammeling GJ, Cotes JE, Pedersen OF, Peslin R, Yernault JC. Lung volumes and forced ventilatory flows. Report Working Party Standardization of Lung Function Tests, European Community for Steel and Coal. Official Statement of the European Respiratory Society. Eur Respir J Suppl 1993. March;16:5–40. [PubMed] [Google Scholar]
- (15).Bentzen SM, Dorr W, Anscher MS, et al. Normal tissue effects: reporting and analysis. Semin Radiat Oncol 2003. July;13(3):189–202. [DOI] [PubMed] [Google Scholar]
- (16).Miller KL, Zhou SM, Barrier RC Jr, et al. Long-term changes in pulmonary function tests after definitive radiotherapy for lung cancer. Int J Radiat Oncol Biol Phys 2003. July 1;56(3):611–5. [DOI] [PubMed] [Google Scholar]
- (17).Marks LB, Fan M, Clough R, et al. Radiation-induced pulmonary injury: symptomatic versus subclinical endpoints. Int J Radiat Biol 2000. April;76(4):469–75. [DOI] [PubMed] [Google Scholar]
- (18).Guckenberger M, Klement RJ, Kestin LL, et al. Lack of a dose-effect relationship for pulmonary function changes after stereotactic body radiation therapy for early-stage non-small cell lung cancer. Int J Radiat Oncol Biol Phys 2013. March 15;85(4):1074–81. [DOI] [PubMed] [Google Scholar]
- (19).Lopez Guerra JL, Gomez DR, Zhuang Y, et al. Changes in pulmonary function after three-dimensional conformal radiotherapy, intensity-modulated radiotherapy, or proton beam therapy for non-small-cell lung cancer. Int J Radiat Oncol Biol Phys 2012. July 15;83(4):e537–e543. [DOI] [PMC free article] [PubMed] [Google Scholar]
Associated Data
This section collects any data citations, data availability statements, or supplementary materials included in this article.