Abstract
Purpose
Predictive analytics (PA) is a new trending approach in the field of healthcare that uses machine learning to build a prediction model using supervised learning algorithms. Isolated coronary artery bypass grafting (iCABG), an open-heart surgery, is commonly performed in the treatment of coronary heart disease.
Aim
The aim of this study was to develop and evaluate a model to predict postoperative length of stay (PLoS) for iCABG patients using supervised machine learning techniques, and to identify the features with the highest contribution to the model.
Methods
This is a retrospective study that uses historic data of adult patients who underwent isolated CABG (iCABG). After initial data pre-processing, data imputation using the kNN method was applied. The study used five prediction models using Naïve Bayes, Decision Tree, Random Forest, Logistic Regression and k Nearest Neighbor algorithms. Data imbalance was managed using the following widely used methods: oversampling, undersampling, “Both”, and random over-sampling examples (ROSE). The features selection process was conducted using the Boruta method. Two techniques were applied to examine the performance of the models, (70%, 30%) split and cross-validation, respectively. Models were evaluated by comparing their performance using AUC and other metrics.
Results
In the final dataset, six distinct features and 621 instances were used to develop the models. A total of 20 models were developed using R statistical software. The model generated using Random Forest with “Both” resampling method and cross-validation technique was deemed the best fit (AUC=0.81; F1 score=0.82; and recall=0.82). Attributes found to be highly predictive of PLoS were pulmonary artery systolic, age, height, EuroScore II, intra-aortic balloon pump used, and complications during operation.
Conclusion
This study demonstrates the significance and effectiveness of building a model that predicts PLoS for iCABG patients using patient specifications and pre-/intra-operative measures.
Keywords: predictive analytics, classifiers, CABG, LoS
Introduction
Heart-related disorders are the leading cause of death worldwide. Ischemic heart disease has been the top cause of death for the last decade, both worldwide,1 and in Saudi Arabia.2 Coronary artery bypass grafting (CABG) is a common procedure proven to be an effective treatment for coronary heart disease.3,4 CABG is a type of open-heart surgery, which in general are invasive procedures that require an extended postoperative length of stay (PLoS, the time between surgery and discharge) in the hospital. When patients stays at the hospital, they are exposed to significant health risks, such as nosocomial infections, psychological disorders, and mortality.4 Thus, predicting the PLoS of heart-related operations is critical for understanding the overall risks of a given procedure, including those associated with extended hospital stays. In addition, PLoS is a common measure used in studies assessing the quality and outcomes of heart-related operations, as it reflects factors such as quality of care and hospital reimbursement.5 Furthermore, UK national health systems reported that better communication of expected PLoS and recovery timespan would be a relief to patients and their families, prepare them psychosocially, and reduce the distress related to late discharge.6
Predictive analytics techniques use machine learning algorithms to analyse large volumes of historical data to reveal hidden patterns and/or distinctive relationships7 based on a classification mechanism.8 With today’s unprecedented volume of patient data (amassed through the increased use of electronic medical records, among other resources), predictive analytics offers a promising new approach to advance clinical applications –predicting patient risk for heart attack, risk of post-surgery readmission, and even predicting which cancer treatment will result in the best outcome for a given patient.9 Of particular relevance to this discussion, predictive analytics can be used to identify patients at high risk of postoperative complications, which in turn can improve patient management and efficient resource allocation.10
At the study setting, Saud Albabtain Cardiac Centre, Dammam, Saudi, CABG is the most frequently performed surgical procedure. Thus, we focused our efforts on using predictive analytics to reveal patterns among patients recovering from isolated CABG (iCABG; ie, when the CABG procedure is performed in the absence of any other simultaneous procedure). We set out with the objective of developing and testing a best fit model to predict PLoS among iCABG patients at the study institution.
Materials and Methods
This is a retrospective study of historic data from adult patients who underwent isolated CABG, focusing on the metric of postoperative length of stay. Data were gathered from a single site institution, Saud Al Babtain Cardiac Centre in Dammam, Saudi Arabia. In this study setting, postoperative length of stay (PLoS) is measured as the time elapsed between the day of surgery and the day of the patient’s discharge. Some hospitals report a patient’s “hospital stay”, where they measure the total length of stay from patient admission for the operation until discharge,11 but the PLoS in this study begins on the reported date of surgery.
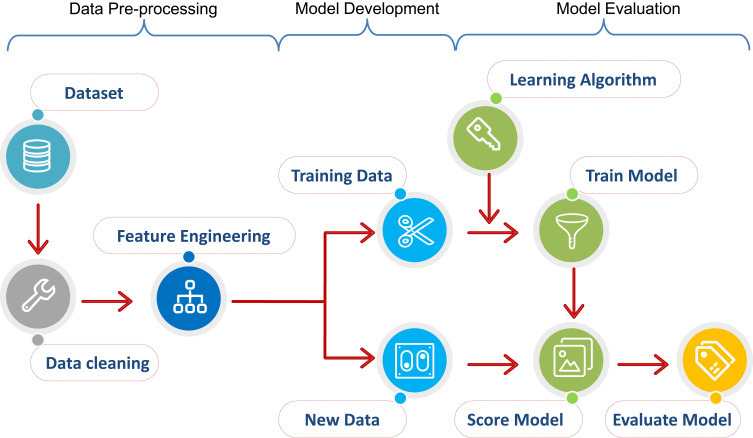
A classification approach is a supervised learning method used in machine learning that builds a model trained on a sample dataset. This sample dataset can then be leveraged to predict the class label of a new observation. Our predictive models were developed using three major steps: data pre-processing, model development, and model evaluation (Figure 1).12
Figure 1.
Model development cycle for prediction of postoperative length of stay for isolated coronary artery bypass grafting (iCABG). Notes: Reproduced from Free machine learning diagram - free powerpoint templates; 2017. Available from: https://yourfreetemplates.com/free-machine-learning-diagram/.12
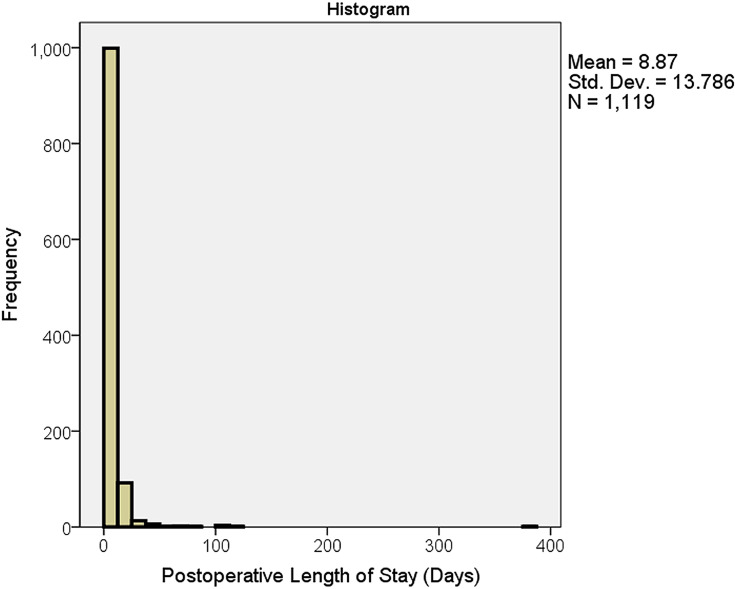
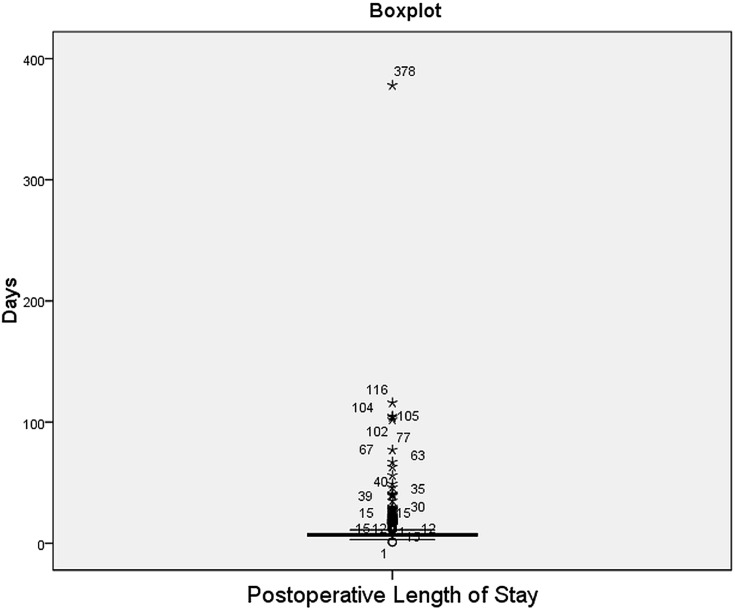
This study used a classification method to develop the predictive models. The target variable (PLoS) was converted to a categorical binary class: Average or Below (AB) and Above Average (AA). According to the literature, the average PLoS for a CABG patient is 7 days.11,13-18 In our data, the mean, median, and mode were (8.87), (7), and (6) days, respectively. As shown in Figure 2, the PLoS histogram is highly skewed to the right with a long, flattened tail. This distribution is largely due to the presence of outliers, as evident in the boxplot (Figure 3). The maximum length of stay was 378 days. Because of this skewness in the dataset, we used the median PLoS (7 days) as our cut-off point between the AA and AB groups. This value aligned with the average PLoS of CABG patients (7 days) as reported in the literature. Thus, those in the Above Average (AA) group had a PLoS of more than 7 days, and those in the Average and Below (AB) group had a PLoS of 7 days or fewer.
Figure 2.
Histogram of postoperative length of stay including outliers.
Figure 3.
Boxplot of postoperative length of stay with the outliers.
We used the classifiers that work best for a categorical dichotomous target class: Naïve Bayes (NB), Decision Tree (DT), K Nearest Neighbour (kNN), Logistic Regression (LR), and Random Forest (RF).19 In addition, the output of these classifiers is easier to interpret and used in clinical settings in comparison with other classifiers.20
Data Collection and Description
Saud Al-Babtain Cardiac Center, Dammam, Saudi Arabia is a 68-bed cardiac center that provides various services for patients with heart disease, including pharmacological, surgical, interventional, and electrical treatments. It serves the pediatric and adult population of the eastern region in Saudi Arabia, and also accepts referees from other Gulf regions.21 The study was conducted in accordance with institutional (Saud Al-Babtain Cardiac Center) guidelines and approved by the institutional review board (SBCC-IRB-MC-2019-01). The study was conducted in accordance with institutional guidelines (Saud Al-Babtain Cardiac Center) and the Declaration of Helsinki, and was approved by our institutional review board (SBCC-IRB-MC-2019-01). A waiver for informed consent was obtained due to the retrospective nature of the study. Every effort was taken to ensure that the privacy and confidentiality of patients was maintained.
Study investigators developed a case report form for specifying attributes related to risk factors associated with the PLoS of iCABG patients. Clinical attributes were chosen based on a literature review. The form also includes fields for demographic data, patient history, comorbidities, preoperative measures, type of CABG procedure, intra- and post-operative measures, and the dates of admission, operation, and discharge. Data included in this study were from adult patients (>18 years) who underwent iCABG surgery. Patients below 18 years old and patients who underwent multiple grafting were excluded from the study.
The dataset retrieved from the study setting was an Excel sheet that comprised of 50 fields (attributes) and 721 de-identified records (patients), which represent patients who underwent iCABG from the period of November 2014 till the time of study at January 2019. Data description of the complete dataset are presented in Supplementary Appendix.
Data Pre-Processing
Features Cleaning
Data pre-processing started with feature cleaning, by removing the duplicate fields along with the variables with more than 80% missing data. Certain features (fields) from the complete dataset represented variables deemed irrelevant to this study, because our model focused only on data collected on the day of surgery. Therefore, we omitted attributes such as discharge medication and total blood loss after 48 hours. In the case of patients admitted to the study setting whose iCABG procedure was delayed for some number of days (due to clinical and/or administrative reasons), the total delay was included as an additional feature “duration from admission until operation” (DAO). Once PLoS and DAO (if applicable) were calculated, the fields used in the calculations were date of admission, date of surgery, date of discharge, and after the calculation these fields were removed from the dataset. As a result, the final list of attributes included in this study reduced to 35, as shown in Table 1.
Table 1.
iCABG Attributes Extracted to Build the Models
| Categories | # | Attributes |
|---|---|---|
| Demographic data | 1 | Age |
| 2 | Gender | |
| 3 | Ethnicity | |
| 4 | Marital status | |
| 5 | BMI | |
| 6 | Height | |
| 7 | Smoking history | |
| Comorbidities | 8 | Hypertension |
| 9 | Hypercholesterolemia | |
| 10 | Renal disease | |
| 11 | Renal failure | |
| 12 | Diabetic | |
| 13 | Diabetes treatment | |
| 14 | Cerebrovascular disease | |
| 15 | Chronic lung disease | |
| Patient history | 16 | Premedication |
| 17 | Family history of ischemic heart disease | |
| 18 | Heart failure | |
| 19 | Previous cardiac, vascular, or thoracic surgery | |
| 20 | Number of previous heart operations | |
| Pre-Op measures | 21 | Angina |
| 22 | Pulmonary artery systolic | |
| 23 | Dyspnoea | |
| 24 | Poor mobility | |
| 25 | Poor mobility due to any non-cardiac reason | |
| 26 | Operative urgency | |
| 27 | EuroScore II | |
| 28 | DAO | |
| 29 | Pre-op intra-aortic balloon pump used | |
| Intra-Op measures | 30 | CABG procedure |
| 31 | Number of arterial grafts | |
| 32 | Intra-aortic balloon pump used | |
| 33 | Complications during operation | |
| Post-Op measures | 34 | Infective complication |
| 35 | Blood loss at 24 hours |
Data Pruning
The data pruning process includes anomaly detection and handling of missing data. In scouring the dataset for anomalies, we identified and removed 31 instances of patients found to be deceased (the analysis of mortality outcomes is out of scope of the current study). Another seven records were removed because discharge dates were not recorded. After this step, the total number of usable records was 683.
A missing value analysis using SPSS was conducted on the remaining 683 records and 2% missing values was found. A Little’s MCAR test was conducted on these records where a t-test was calculated for numerical values and chi-square test for categorical variables. In all cases we found non-significant P-values (P>0.05), indicating that these data were missing completely at random and can be imputed.
K-nearest neighbors (kNN) is a classification algorithm used to impute the missing values. Since the kNN imputation method is susceptible to data extreme values, outliers data points must be treated first in order to reduce the variability.22 Treatment of outliers is an important step in model generation, as the presence of outliers in numerical variables tends to distort the accuracy of the prediction model.23 To detect outliers, all numerical variables were explored using a SPSS Boxplot chart, using the definitions of legitimate and extreme outliers as described by Hoaglin and Iglewicz.24 In our study, we found the variables of age and height to have legitimate outliers; however, BMI, DAO, pulmonary artery systolic, EuroScore II, and blood loss at 24 hours exhibited extreme outliers. In order to manage the extreme outliers, these attributes were converted to categorical variables. Categorical variables reduce the time necessary to build the model compared to continuous variables and produce better prediction results.25 In addition, categorical variables make it possible to overcome the problem of outliers without risking the reduction of number of values/instances. Body Mass Index (BMI) is a variable comprising numeric values and was divided into categorical BMI, in which less than 17 is underweight, 18–24 is healthy weight, 25–29 is overweight, 30–39 is obese, and more than 40 is extreme obesity.26 For pulmonary artery systolic, the normal range is between 8–20 for a patient at rest, and considered high if it exceeds 25 at rest and 30 at activity. The pulmonary artery systolic at the study setting was measured at rest, so the variable was transformed into three categories: Normal (<25), Moderate (26–30), and High (>30).27 After DAO was calculated, it was transformed into three categories: short (<3 days), medium (3–7 days), and long (>7 days) after reviewing the entries with the study setting. We removed records containing outliers in EuroScore II (7 outliers) and blood loss at 24 hours (55 outliers) because there was no clear-cut point to transform them into categorical counterparts. As a result, the entire records that contain these outliers were removed and the total sample size remaining after outlier processing was 621 instances which were used to build our models.
Finally, the missing values were filled using the K Nearest Neighbor (kNN) imputation method using RStudio. kNN is applicable to all data types, which makes it a valid imputation method in our case.28 It is an effective method28 that produces highly accurate results.29 Imputation of missing values using a machine learning algorithm proved its superiority over statistical methods, where it is more suitable to apply in medical domains due to the nature of data.30 To fill a missing datum, kNN searches for similar records according to other variables, thereby identifying a specified number of this record’s “neighbors”. Next, the algorithm fills the missing cell by approximating a value based on this variable’s values in its neighbors. We used the default kNN imputation in RStudio with one change: rather than the default k=5, we used k=11 (odd numbers tend to provide better results and avoid tie situations).31 The final dataset used in model development contained 621 instances and 35 attributes in addition to the target variable (PLoS) which includes AA and AB classes.
Feature Selection
Reducing the number of attributes tends to produce higher accuracy models.32 Furthermore, it is faster to apply the prediction when there are fewer attributes to consider. Using less attributes without compromising model accuracy is the current gold standard.33
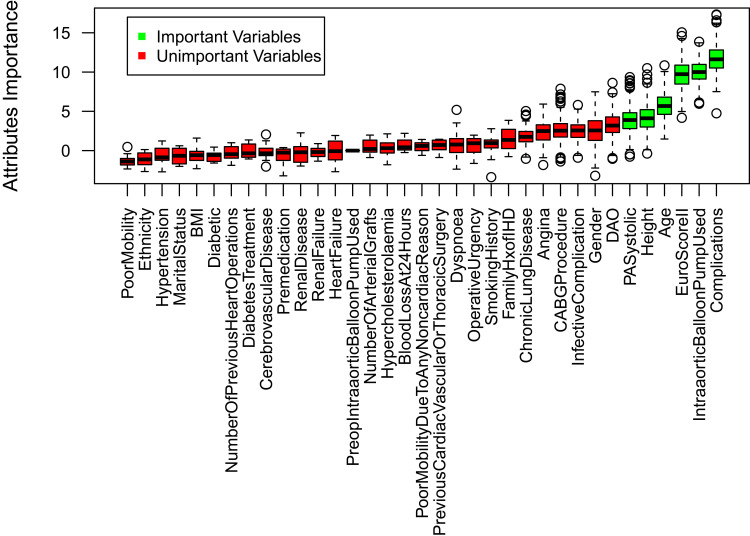
As a first step, we used RStudio to apply a feature selection process to eliminate variables that had no effect on the model’s predictions. The Boruta algorithm uses a random forest approach to evaluate attributes was used. It first creates a duplicate shuffled version of the dataset’s attribute values, then compares Z-scores (“Importance”) of the shuffled dataset’s attributes between the original and shuffled set. Attributes which exhibit a higher Z-score in the original dataset are deemed important.34 The Boruta algorithm is considered unbiased, relatively more stable in evaluating important and unimportant attributes, and it conducts several Random Forest iterations rather than a single one, as in other feature selection methods. It also takes into consideration the interaction between the attributes themselves.35 Using this algorithm, with 600 iterations, we found the following attributes to be most important (Figure 4): pulmonary artery systolic, age, height, EuroScore II, intra-aortic balloon pump used, and complications during operation. Figure 4 shows the important (highly predictive) attributes with the green color shading, while the unimportant ones had red shading. The boxplot represents the Z-scores of the important and unimportant variables.35
Figure 4.
Result of Boruta feature selection method.
Model Development and Evaluation
Data Sampling and Balancing the Dataset
Data imbalance or skew distribution is one of the challenges in machine learning. Imbalanced datasets, ie, those in which the number of events in the target class exceeds the number of non-events, or vice versa, are a common issue when using real-life data. In our data the target class is binary; 216 (35%) positive events (Above Average) PLoS and 405 (65%) negative events (Average or Below). This is considered imbalanced. Four data processing methods were used to manage the imbalanced target class data: oversampling, undersampling, both (over and under), and random over-sampling examples (ROSE).
In an oversampling method, the software adds several random records to the minority class, which is in our case the Above Average (AA), to yield target classes with equal numbers of instances. Undersampling, on the other hand, randomly reduces the number of instances in the majority class to be equal with the number of the instances in the minority class.36 The Both method combines oversampling and undersampling by randomly adding to the minority class and removing some instances from the majority class until the two classes are more in balance. Finally, the ROSE method develops synthetic (artificial) records based on certain algorithms and adds them to the minority class. ROSE uses a bootstrapping method to create artificial instances from the neighboring data points in the minority class. This technique is favored compared to oversampling and tends to reduce the overfitting that could result from oversampling with replacement.36,37 Table 2 shows the results of resampling methods to balance the target class.
Table 2.
Results of Resampling Methods to Balance the Target Class
| Method | Results | Total Records |
|---|---|---|
| Oversampling method | Records of target class AA randomly increased | 810 |
| Undersampling method | Records of target class AB randomly decreased to match the size of the AA target class | 432 |
| Both method | Records of AA increased, records of AB decreased, and the result of this method was 209 AB records and 232 AA records | 441 |
| ROSE | Records of AA was increased using synthetic records. The result of this method was 338 AB and 362 AA class. | 700 |
To evaluate the model accuracy, several techniques can be used such as standard (70% training set, 30% testing set), K-Fold cross-validation, leave one out, holdout, and bootstrap. To evaluate the models developed in this study, we performed data sampling for training and testing. Seventy percent of the datapoints were reserved for training and the remaining 30% were used to test the model. We also ran the K-fold cross-validation to check the consistency of our proposed model results. The significance of the K-fold cross-validation mechanism has been validated through other studies.38–41 The K-fold cross-validation mechanism reduces the problem of bias and variance. In our study, the K-fold cross-validation has been used to divide the data into training and testing sets and we used a K value equal to 10. In order to perform equal validation for each sub-group, data resampling techniques were applied before splitting the data (70%:30%) or running the K-fold cross-validation.
Developing the Learning Models
To develop the predictive models, five classifiers were used: Naïve Bayes, Decision Tree, Logistic Regression, K Nearest Neighbor, and Random Forest. For each classifier, we used four different datasets, ie, the resulting dataset from each of the four resampling methods described above. Therefore, a total of 20 models were developed.
Model Evaluation
Model evaluation is an essential step in model development, during which it demonstrates how well a given model is performing. Through model evaluation we compared performance and accuracy across all models. Performance metrics included AUC (Area Under the ROC (Receiver Operating Characteristics) Curve) which plots the true positive rate against the false positive rate.42 Also, recall (sensitivity) which is the probability of correctly identifying patients with Above Average (AA) PLoS. In addition, precision measures the ratio of correctly identified patients within the pool of who were predicted to have Above Average (AA) PLoS. Finally, F1 is the weighted average between recall and precision. Accuracy is another model evaluation measure that used the number of correct predictions amongst all predictions.19,43
Results
A total of 20 models were developed, and we evaluated the performance of each model using the following metrics: the AUC, recall, precision, F1 score, and accuracy. In terms of AUC, the Naïve Bayes and Random Forest models outperformed the other classifiers (kNN, Decision Tree, Logistic Regression). When evaluation AUC metrics, an AUC close to 1 indicates the model is a good fit for prediction.44
Table 3 summarizes the different measurements used to compare the performances between Naïve Bayes and Random Forest classifiers using all resampling methods and using data splitting for training and testing (70–30%). Our results demonstrate that the best fit model is the Random Forest classifier as it produces the highest AUC using oversampling and Both resampling methods.
Table 3.
Summary Results of Naïve Bayes and Random Forest Classifiers with All Resampling Methods Using 70–30% Split
| Resampling | Naïve Bayes | Random Forest | ||||||
|---|---|---|---|---|---|---|---|---|
| Over | Under | Both | ROSE | Over | Under | Both | ROSE | |
| AUC | 0.64 | 0.69 | 0.71 | 0.66 | 0.89* | 0.68 | 0.80* | 0.70 |
| Accuracy | 0.64 | 0.63 | 0.65 | 0.61 | 0.78 | 0.60 | 0.75 | 0.60 |
| Recall | 0.53 | 0.57 | 0.59 | 0.54 | 0.82 | 0.58 | 0.74 | 0.63 |
| Precision | 0.66 | 0.66 | 0.73 | 0.60 | 0.75 | 0.63 | 0.78 | 0.58 |
| F1 Score | 0.59 | 0.61 | 0.65 | 0.57 | 0.78 | 0.60 | 0.77 | 0.60 |
Note: *AUC values closest to 1 (80% and above).
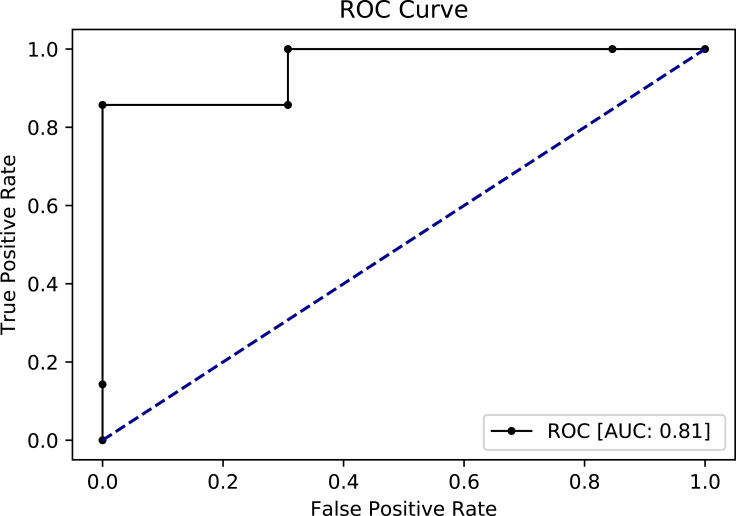
In order to have more confidence with these results, we used 10-K cross-validation for the Random Forest classifier since it has produced the highest AUC with all the resampling methods. The results as presented in Table 4 show similar results to the 70–30% splitting. However, undersampling AUC in cross-validation showed noteworthy improvement, from 0.68 to 0.81.
Table 4.
Summary Results of Random Forest Classifier with All Resampling Methods Using 10-K Cross- Validation
| Random Forest | ||||
|---|---|---|---|---|
| Resampling | Over | Under | Both | ROSE |
| AUC | 0.80 | 0.81 | 0.81 | 0.80 |
| Accuracy | 0.80 | 0.82 | 0.81 | 0.77 |
| Recall | 0.80 | 0.82 | 0.82 | 0.80 |
| Precision | 0.80 | 0.82 | 0.82 | 0.79 |
| F1 Score | 0.79 | 0.80 | 0.82 | 0.78 |
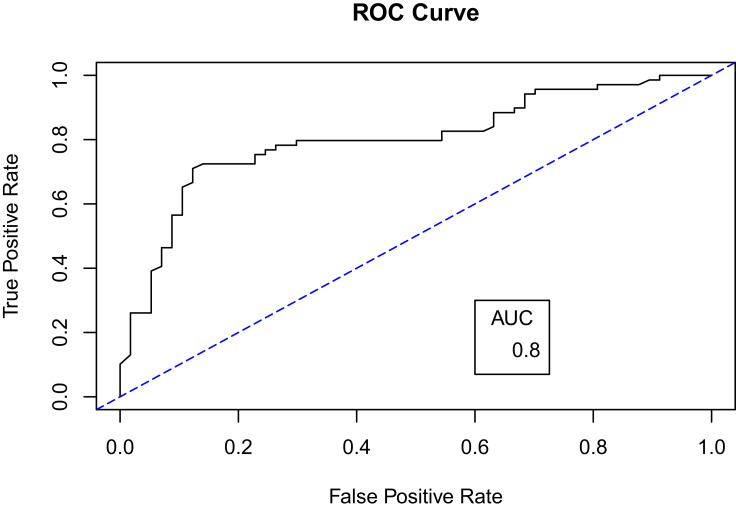
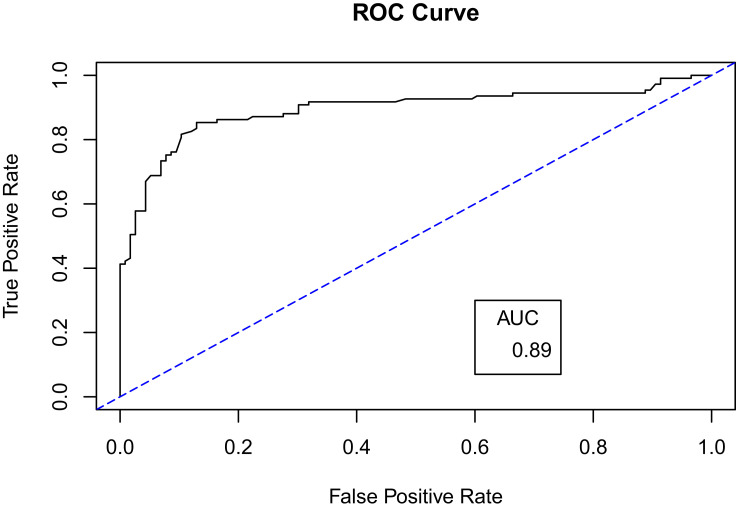
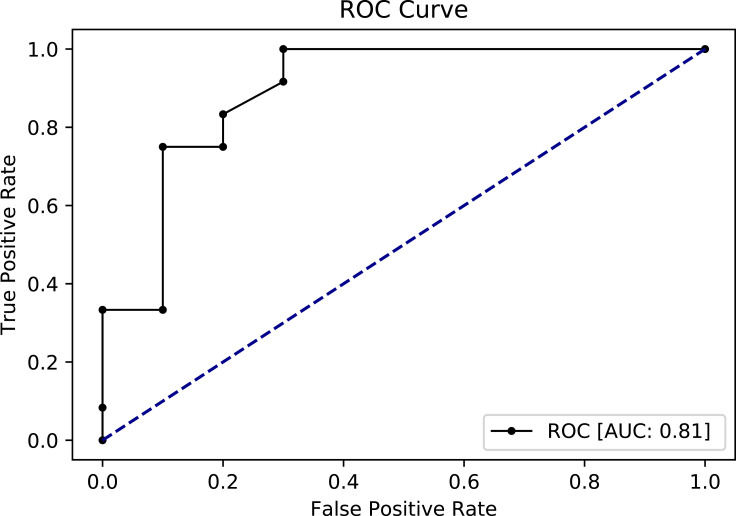
For further evaluation, we used the ROC curve to compare between the different resampling methods using Random Forest classifier. First, with a 70–30% split (Figures 5 and 6) and second, with 10-k cross-validation (Figures 7 and 8). It can be seen that the Random Forest model using Both resampling method with 10-K cross-validation outperformed the other models (Figure 7).
Figure 5.
Receiver operating characteristics (ROC) curve for random forest model using both resampling method and 70–30% split.
Figure 6.
Receiver operating characteristics (ROC) curve for random forest model using oversampling method and 70–30% split.
Figure 7.
Receiver operating characteristics (ROC) curve for random forest model using both resampling method and 10-K cross-validation.
Figure 8.
Receiver operating characteristics (ROC) curve for random forest model using undersampling method and 10-K cross-validation.
Discussion
The objective of this study was to build a model that predicts whether a patient’s postoperative length of stay (PLoS) following iCABG will be longer or shorter than average. We used area under the ROC curve (AUC) as the main metric of model performance as it has the ability to present the optimal performing classifier.45 Moreover, each model was also evaluated in terms of accuracy, recall, precision, and F1 score.
Random forest classifier using different resampling methods produced models with the highest AUC (Table 5). Random Forest classifier with Both resampling method using 10-K cross-validation technique was selected as the best fit model based on several factors. First, it produced an acceptable AUC score (0.81). Second, the Both resampling method introduces less bias as compared to the oversampling method. In the Both method, the minority class AA that presents the positive events was increased by replacement with only a very limited number of instances – only 16 records were replicated, whereas the oversampling method increased the AA class by 189 records. Third, this model is highly sensitive with a recall score of 0.82, meaning that the model has 82% probability of predicting AA events correctly. Finally, it has an F1 score of 0.82, indicating that this model has a good balance between precision and recall.
Table 5.
Random Forest Models with Highest AUC, F1 and Recall
| 70–30% Split | 10-K Cross-Validation | ||||||
|---|---|---|---|---|---|---|---|
| Both | Over | ROSE | Under | Both | Over | ROSE | |
| AUC | 0.80 | 0.89 | 0.70 | 0.81 | 0.81 | 0.80 | 0.80 |
| F1 | 0.77 | 0.79 | 0.60 | 0.80 | 0.82 | 0.79 | 0.78 |
| Recall | 0.74 | 0.82 | 0.63 | 0.82 | 0.82 | 0.80 | 0.80 |
Even though Random Forest with oversampling (70–30%) split produced the highest AUC (0.89), it was not selected as the best fit model. The reason for this high AUC is due to overfitting where we used oversampling with random replacement before the data splitting. Indeed, tree-based classification type models are particularly susceptible to overfitting. As explained by Chawla et al,37 the tree splits will be highly concentrated in the replicated minority class and limiting the splits boundary in the majority class, which increases bias. In addition, because we used a technique for random oversampling with replacement before splitting the data, that could lead to the presence of the same data point in both the training set and the testing set. This leads to a highly fitted model with high prediction power but with reduced generalizability.46 This effect could also underlie the high recall (sensitivity) in the oversampled model compared to its F1 measure which indicates the high ability of the model to predict replicated Above Average (AA) points compared to the balanced ability perdition measured by F1 score.47 Thus, the high AUC for oversampling method in Random Forest classifier with (70–30%) split could be overoptimistic, especially when it is compared with the AUC of oversampling model using cross-validation which resulted in AUC dropping to 0.80 from 0.89. Moreover, a study by Khalilia, Chakraborty and Popescu51 developed a model to predict disease risk using random forest with oversampling. To overcome the oversampling effect, they used Repeated Random Sub-Sampling, which is similar to cross-validation in mechanism. As a result, the classifier produced an AUC of 0.89, which was the highest when compared with other classifiers in the same study.
Other related studies have also found that models developed using Random Forest with cross-validation tends to perform best. Daghistani et al39 found that a model developed with Random Forest with cross-validation produced the highest AUC (0.94) as compared to other classifiers in order to predict in-hospital stay for patients with cardiac problems. Similarly, Alghamdi et al48 and Sakr et al49 built models to predict diabetes mellitus and hypertension, respectively, and both studies found that Random Forest provided the highest AUC (0.92 and 0.93, respectively) when compared to other classifiers.
Likewise there were several studies in which the use of synthetic records in resampling method tend to produce more confident models.37 In our study, ROSE sampling with Random Forest using cross-validation produced an AUC of 0.8. This agrees with the findings of Navaz et al50 showing that the SMOTE method (another method similar to ROSE resampling) improved their model’s ability to predict length of stay for all types of ICU admissions.51
In summary, our research found that the best fit model produced an AUC of 0.81, which is comparable to other similar studies (Table 6).
Table 6.
Matrix of Studies with Relative Medical Conditions to Compare with The Study Results
| Article | Authors | Year | Country | Setting | Medical Condition | Data Balance | Model Evaluation | Classifier | AUC |
|---|---|---|---|---|---|---|---|---|---|
| Predictors of in-hospital length of stay among cardiac patients: A machine learning approach | Daghistani et al39 | 2019 | Saudi Arabia | King Abdulaziz Medical City Complex in Riyadh | Predict LoS for cardiac patients | Smote | Cross-validation | Random Forest | 0.94 |
| Neural Network Prediction of ICU Length of Stay Following Cardiac Surgery Based on Pre- Incision Variables |
LaFaro et al41 | 2015 | USA | New York Medical College | Predict ICU LoS after cardiac surgery | – | Cross-validation | Ensemble of Neural Network | 0.90 |
| Using machine learning for predicting severe postoperative complications after cardiac surgery | Lapp et al57 | 2018 | UK | Golden Jubilee National Hospital | Predict complications after cardiac surgery | – | – | Random Forest | 0.71 |
| Prediction of In-Hospital Mortality And Length of Stay in Acute Coronary Syndrome Patients Using Machine-Learning Methods | Yakovlev et al40 | 2018 | Russia | – | Predict mortality and LoS for acute coronary syndrome patients | – | Cross-validation | Naïve Bayes | 0.90 |
| This study | 2019 | Saudi Arabia | Saud Albabtain Cardiac Center | Predict LoS for iCABG patients | Both method | Cross-validation | Random Forest | 0.81 | |
We found that six attributes had considerable influence in predicting which post-operative length of stay (PLOS) category (Above Average (AA), Average or Below (AB)) any given iCABG patient would fall into. These attributes are: EuroScore II, complications during operation, balloon pump used, pulmonary artery systolic pressure, height, and age. They are similar to risk factors for extended PLoS found in several other studies. Biancari et al52 found EuroScore II is not only highly predictive for in-hospital mortality for isolated CABG, but also predicted PLoS for similar kinds of surgeries.52 A patient experiencing complications during operation related to surgery was a powerful predictor in our model, which is similar to the findings of Lazar et al53 reporting that patients with preoperative risk factors and patients who develop complications postoperatively have the longest PLoS.53 Other studies found that a history of previous heart surgery,54 age, and systolic pressure39 predicted longer PLoS, consistent with our results. However, in our study we found a lower predictive power (minimal) associated with diabetes, which contradicts with the findings of Ali et al.54
Finally, the model selected as a best performer can be deployed and used in the study setting after the surgery to provide additional insight into the factors contributing to prolonged length of stay for patients undergoing iCABG. Thus, it could be useful to optimize bed management, resource utilization, and even infection control.55 Being able to predict when a patient is likely to experience a longer than average PLoS also presents the opportunity for psychosocial preparation, both for the patients and their families.6 It also can be a great addition clinically where it can improve the decision-making process and provide the proper care needed for patient predicted to stay longer after surgery.56
Limitations and Future Work
The sample size used in this study is relatively small, particularly as compared to the modern standards of “big data”. However, two studies in the literature demonstrate that smaller datasets can result in better model performance compared to larger sets. Amarasingham et al58 developed a model to identify risk of readmission for 30 days or death for patients with heart failure using electronic medical record data. They used 1372 records to build a model that produced results with c statistics (equivalent to AUC) of 0.86 for mortality and 0.72 for readmission. This model outperformed the model created by the Center for Medicaid and Medicare Services, which used larger datasets (c statistics were 0.73 and 0.66 for mortality and readmission, respectively). Another study found good performing models can be obtained from reduced datasets.59
One of the challenges we faced in conducting this study was removal of several attributes that were missing more than 80% of the data (ICU stay, anesthesia timings, and duration of the procedures). Though unlikely given the relatively good performance of our final model, removing these attributes may have impacted overall performance.
Focusing this study only on patients undergoing isolated CABG surgery was advantageous to our proximal objective of specifically predicting outcomes for this patient population. However, doing so, limits the generalizability of the final model to other types of open-heart surgeries. To deal with this limitation, future work should consider the PLoS associated with other open-heart procedures. In addition, future studies might add several other factors that have been hypothesized to be important, such as those related to physicians’ profiles (qualification, experience, etc.). Another promising feature to examine would be procedure volume conducted by the hospital –Shinjo & Fushimi60 found that hospitals with a high volume of iCABG procedure have a shorter length of stay for patients with open-heart surgery.
Finally, we designed this model to predict PLoS in binary terms, ie, Above Average/Average or Below. Arguably, the ability to predict PLoS on a finer scale in the form of continuous data might enhance efforts to mitigate the impact of prolonged PLoS on these patients.
Conclusion
In this research, our main objective was to develop the best fit model that would predict the level of postoperative length of stay of patients undergoing isolated coronary artery bypass grafting using supervised machine learning classifiers. The result of this study showed that Random Forest classifier with Both resampling using 10-K cross-validation outperformed other classifiers.
Acknowledgment
The authors would like to thank Ms. Josephine Chue for her data collection efforts.
Disclosure
The authors report no conflicts of interest in this work. The authors received no financial funding or support for this research work.
References
- 1.Mathers C, Stevens GA, Retno Mahanani W, et al. Global health estimates 2015: deaths by cause, age, sex, by country and by region, 2000–2015; 2000. Available from: http://www.who.int/gho/mortality_burden_disease/en/index.html.
- 2.Fullman N, Yearwood J, Abay SM, et al. Measuring performance on the healthcare access and quality index for 195 countries and territories and selected subnational locations: a systematic analysis from the global burden of disease study 2016. Lancet. 2018;391(10136):2236–2271. doi: 10.1016/S0140-6736(18)30994-2 [DOI] [PMC free article] [PubMed] [Google Scholar]
- 3.Go YY, Li Y, Chen Z, et al. Equine arteritis virus does not induce interferon production in equine endothelial cells: identification of nonstructural protein 1 as a main interferon antagonist. Biomed Res Int. 2014;2014:11–13. doi: 10.1155/2014/420658 [DOI] [PMC free article] [PubMed] [Google Scholar]
- 4.Auer CJ, Laferton JAC, Shedden-Mora MC, Salzmann S, Moosdorf R, Rief W. Optimizing preoperative expectations leads to a shorter length of hospital stay in CABG patients: further results of the randomized controlled PSY-HEART trial. J Psychosom Res. 2017;97(April):82–89. doi: 10.1016/j.jpsychores.2017.04.008 [DOI] [PubMed] [Google Scholar]
- 5.Burrough MG. Can Postoperative Length of Stay or Discharge Within Five Days of First Time Isolated Coronary Artery Bypass Graft Surgery Be Predicted from Preoperative Patient Variables? 2010. [Google Scholar]
- 6.Health ND. Achieving timely ‘ simple ’ a toolkit for the multi-disciplinary team. Consultant. 2004. [Google Scholar]
- 7.Nassif AB, Azzeh M, Banitaan S, Neagu D. Guest editorial: special issue on predictive analytics using machine learning. Neural Comput Appl. 2016;27(8):2153–2155. doi: 10.1007/s00521-016-2327-3 [DOI] [Google Scholar]
- 8.Witten IH, Frank E. Data mining: practical machine learning tools and techniques with java implementations (the morgan kaufmann series in data management systems). ACM Sigmod Rec. 2002;31:371. [Google Scholar]
- 9.Gensinger R. Analytics in Healthcare: An Introduction, Health Information and Management System Society. HIMSS; 2014. [Google Scholar]
- 10.Kirks R, Passeri M, Lyman W, et al. Machine learning and predictive analytics aid in individualizing risk profiles for patients undergoing minimally invasive left pancreatectomy. Hpb. 2018;20:S620–S621. doi: 10.1016/j.hpb.2018.06.2186 [DOI] [Google Scholar]
- 11.Peterson ED, Coombs LP, Ferguson TB, et al. Hospital variability in length of stay after coronary artery bypass surgery: results from the society of thoracic surgeon’s national cardiac database. Ann Thorac Surg. 2002;74(2):464–473. doi: 10.1016/S0003-4975(02)03694-9 [DOI] [PubMed] [Google Scholar]
- 12.Your Free Templates. Free machine learning diagram - free powerpoint templates; 2017. Available from: https://yourfreetemplates.com/free-machine-learning-diagram/. Accessed September 29,2020.
- 13.Halpin LS, Barnett SD. Preoperative state of mind among patients undergoing CABG: effect on length of stay and postoperative complications. J Nurs Care Qual. 2005;20(1):73–80. doi: 10.1097/00001786-200501000-00012 [DOI] [PubMed] [Google Scholar]
- 14.Jones KW, Cain AS, Mitchell JH, et al. Hyperglycemia predicts mortality after CABG: postoperative hyperglycemia predicts dramatic increases in mortality after coronary artery bypass graft surgery. J Diabetes Complications. 2008;22(6):365–370. doi: 10.1016/j.jdiacomp.2007.05.006 [DOI] [PubMed] [Google Scholar]
- 15.Li Y, Cai X, Mukamel DB, Cram P. Impact of length of stay after coronary bypass surgery on short-term readmission rate: an instrumental variable analysis. Med Care. 2013;51(1):45–51. doi: 10.1097/MLR.0b013e318270bc13 [DOI] [PMC free article] [PubMed] [Google Scholar]
- 16.Osnabrugge RL, Speir AM, Head SJ, et al. Prediction of costs and length of stay in coronary artery bypass grafting. Ann Thorac Surg. 2014;98(4):1286–1293. doi: 10.1016/j.athoracsur.2014.05.073 [DOI] [PubMed] [Google Scholar]
- 17.Poole L, Kidd T, Leigh E, Ronaldson A, Jahangiri M, Steptoe A. Depression, C-reactive protein and length of post-operative hospital stay in coronary artery bypass graft surgery patients. Brain Behav Immun. 2014;37:115–121. doi: 10.1016/j.bbi.2013.11.008 [DOI] [PMC free article] [PubMed] [Google Scholar]
- 18.Wilson CM, Kostsuca SR, McPherson SM, Warren MC, Seidell JW, Colombo R. Preoperative 5-meter walk test as a predictor of length of stay after open heart surgery. Cardiopulm Phys Ther J. 2015;26(1):2–7. doi: 10.1097/cpt.0000000000000005 [DOI] [Google Scholar]
- 19.Abbott D. Applied Predictive Analytics: Principles and Techniques for the Professional Data Analyst Published. Vol. 53 John Wiley & Sons, Inc.;2014. doi: 10.1017/CBO9781107415324.004 [DOI] [Google Scholar]
- 20.Alimohammadisagvand B. Use of Predictive Analytics to Identify Risk of Postoperative Complications Among the Women Undergoing the Hysterectomy Surgery for Endometrial Cance. 2018. [Google Scholar]
- 21.Saud Al-Babtain Cardiac Centre - ABOUT SBCC. 2019. Available from: http://www.sbccmed.com/En-Us/Page/ABOUT-SBCC.
- 22.Bhattacharya G, Ghosh K, Chowdhury AS. kNN classification with an outlier informative distance measure. Springer. 2017;3:21–27. doi: 10.1007/978-3-319-69900-4 [DOI] [Google Scholar]
- 23.Jabbar H, Khan D. Methods to avoid over-fitting and under-fitting in supervised machine learning (comparative study). Comput Sci Commun Instrum Device. 2015. [Google Scholar]
- 24.Hoaglin DC, Iglewicz B. Fine-tuning some resistant rules for outlier labeling. J Am Stat Assoc. 1987;82(400):1147–1149. doi: 10.1080/01621459.1987.10478551 [DOI] [Google Scholar]
- 25.Fayyad UM, Irani KB. Multi-interval discretization of continuous-valued attributes for classification learning. Proc Int Conf Artif Intell. 1993;1022–1027. [Google Scholar]
- 26.El-Gilany AH, Hammad S. Body mass index and obstetric outcomes in pregnant in Saudi Arabia: a prospective cohort study. Ann Saudi Med. 2010;30(5):376–380. doi: 10.4103/0256-4947.67075 [DOI] [PMC free article] [PubMed] [Google Scholar]
- 27.Lam CSP, Borlaug BA, Kane GC, Enders FT, Rodeheffer RJ, Redfield MM. Age-associated increases in pulmonary artery systolic pressure in the general population. Circulation. 2009;119(20):2663–2670. doi: 10.1161/CIRCULATIONAHA.108.838698 [DOI] [PMC free article] [PubMed] [Google Scholar]
- 28.Zhang S. Nearest neighbor selection for iteratively kNN imputation. J Syst Softw. 2012;85(11):2541–2552. doi: 10.1016/j.jss.2012.05.073 [DOI] [Google Scholar]
- 29.Chen J, Shao J. Nearest neighbor imputation for survey data. J off Stat. 2000;16(2):113–132. [Google Scholar]
- 30.Jerez JM, Molina I, García-Laencina PJ, et al. Missing data imputation using statistical and machine learning methods in a real breast cancer problem. Artif Intell Med. 2010;50(2):105–115. doi: 10.1016/j.artmed.2010.05.002 [DOI] [PubMed] [Google Scholar]
- 31.Kowarik A, Templ M. Imputation with the R package VIM. J Stat Softw. 2016;74(7). doi: 10.18637/jss.v074.i07 [DOI] [Google Scholar]
- 32.Shahrokni A, Rokni SA, Ghasemzadeh H. Machine learning algorithm for predicting longer postoperative length of stay among older cancer patients. J Clin Oncol. 2017;35(15_suppl):e21536. doi: 10.1200/JCO.2017.35.15_suppl.e21536 [DOI] [Google Scholar]
- 33.Dai J, Xu Q. Attribute selection based on information gain ratio in fuzzy rough set theory with application to tumor classification. Appl Soft Comput J. 2013;13(1):211–221. doi: 10.1016/j.asoc.2012.07.029 [DOI] [Google Scholar]
- 34.Kursa MB, Jankowski A, Rudnicki WR. Boruta - a system for feature selection. Fundam Inform. 2010;101(4):271–285. doi: 10.3233/FI-2010-288 [DOI] [Google Scholar]
- 35.Kursa MB, Rudnicki WR. Feature selection with the boruta package. J Stat Softw. 2010;36(11):1–13. doi: 10.18637/jss.v036.i11 [DOI] [Google Scholar]
- 36.Nunes C, Silva D, Guerreiro M, De Mendonça A, Carvalho AM, Madeira SC. Class imbalance in the prediction of dementia from neuropsychological data. Lect Notes Comput Sci. 2013;8154 LNAI(1):138–151. doi: 10.1007/978-3-642-40669-0_13 [DOI] [Google Scholar]
- 37.Chawla NV, Bowyer KW, Hall LO, Kegelmeyer WP. SMOTE: synthetic minority over-sampling technique. J Artif Intell Res. 2002;16:321–357. doi: 10.1613/jair.953 [DOI] [Google Scholar]
- 38.Wong TT. Performance evaluation of classification algorithms by k-fold and leave-one-out cross validation. Pattern Recognit. 2015;48(9):2839–2846. doi: 10.1016/j.patcog.2015.03.009 [DOI] [Google Scholar]
- 39.Daghistani TA, Elshawi R, Sakr S, Ahmed AM, Al-Thwayee A, Al-Mallah MH. Predictors of in-hospital length of stay among cardiac patients: a machine learning approach. Int J Cardiol. 2019;288:140–147. doi: 10.1016/j.ijcard.2019.01.046 [DOI] [PubMed] [Google Scholar]
- 40.Yakovlev A, Metsker O, Kovalchuk S, Bologova E. Prediction of in-hospital mortality and length of stay in acute coronary syndrome patients using machine-learning methods. J Am Coll Cardiol. 2018;71(11):A242. doi: 10.1016/s0735-1097(18)30783-6 [DOI] [Google Scholar]
- 41.LaFaro RJ, Pothula S, Kubal KP, et al. Neural network prediction of ICU length of stay following cardiac surgery based on pre-incision variables. PLoS One. 2015;10(12):1–19. doi: 10.1371/journal.pone.0145395 [DOI] [PMC free article] [PubMed] [Google Scholar]
- 42.Baechle C, Agarwal A. A framework for the estimation and reduction of hospital readmission penalties using predictive analytics. J Big Data. 2017;4(1):1–15. doi: 10.1186/s40537-017-0098-z [DOI] [Google Scholar]
- 43.McNeill D, Davenport T. Analytics in Healthcare and the Life Sciences: Strategies, Implementation Methods, and Best Practices. Pearson Education; 2014. [Google Scholar]
- 44.Fawcett T. An introduction to ROC analysis. Pattern Recognit Lett. 2006;27(8):861–874. doi: 10.1016/j.patrec.2005.10.010 [DOI] [Google Scholar]
- 45.Provost F, Fawcett T. Robust classification for imprecise environments. Mach Learn. 2001;42(3):203–231. doi: 10.1023/A:1007601015854 [DOI] [Google Scholar]
- 46.Santos MS, Soares JP, Abreu PH, Araujo H, Santos J. Cross-validation for imbalanced datasets: avoiding overoptimistic and overfitting approaches [research frontier]. IEEE Comput Intell Mag. 2018;13(4):59–76. doi: 10.1109/MCI.2018.2866730 [DOI] [Google Scholar]
- 47.Weber LM, Robinson MD. Comparison of clustering methods for high-dimensional single-cell flow and mass cytometry data. Cytom A. 2016;89(12):1084–1096. doi: 10.1002/cyto.a.23030 [DOI] [PubMed] [Google Scholar]
- 48.Alghamdi M, Al-Mallah M, Keteyian S, Brawner C, Ehrman J, Sakr S. Predicting diabetes mellitus using SMOTE and ensemble machine learning approach: the Henry Ford exercise testing (FIT) project. PLoS One. 2017;12(7):1–16. doi: 10.1371/journal.pone.0179805 [DOI] [PMC free article] [PubMed] [Google Scholar]
- 49.Sakr S, Elshawi R, Ahmed A, et al. Using machine learning on cardiorespiratory fitness data for predicting hypertension: the Henry Ford exercise testing (FIT) project. PLoS One. 2018;13(4):1–19. doi: 10.1371/journal.pone.0195344 [DOI] [PMC free article] [PubMed] [Google Scholar]
- 50.Navaz AN, Mohammed E, Serhani MA, Zaki N. The use of data mining techniques to predict mortality and length of stay in an ICU. Proc Int Conf Innov Inf Technol. 2017;164–168. doi: 10.1109/INNOVATIONS.2016.7880045 [DOI] [Google Scholar]
- 51.Khalilia M, Chakraborty S, Popescu M. Predicting disease risks from highly imbalanced data using random forest. BMC Med Inform Decis Mak. 2011;11(1). doi: 10.1186/1472-6947-11-51 [DOI] [PMC free article] [PubMed] [Google Scholar]
- 52.Biancari F, Vasques F, Mikkola R, Martin M, Lahtinen J, Heikkinen J. Validation of EuroSCORE II in patients undergoing coronary artery bypass surgery. Ann Thorac Surg. 2012;93(6):1930–1935. doi: 10.1016/j.athoracsur.2012.02.064 [DOI] [PubMed] [Google Scholar]
- 53.Lazar HL, Fitzgerald C, Gross S, Heeren T, Aldea GS, Shemin RJ. Determinants of length of stay after coronary artery bypass graft surgery. Circulation. 1995;92(9):20–24. doi: 10.1161/01.CIR.92.9.20 [DOI] [PubMed] [Google Scholar]
- 54.Ali Z, Arfeen M, Repository LI, et al. The role of machine learning in predicting CABG surgery duration. Mach Learn. 2013;10(September):10587. doi: 10.1111/etap.12031 [DOI] [Google Scholar]
- 55.Mehta N, Pandit A. Concurrence of big data analytics and healthcare: a systematic review. Int J Med Inform. 2018;114(March):57–65. doi: 10.1016/j.ijmedinf.2018.03.013 [DOI] [PubMed] [Google Scholar]
- 56.Barili F, Barzaghi N, Cheema FH, et al. An original model to predict intensive care unit length-of stay after cardiac surgery in a competing risk framework. Int J Cardiol. 2013;168(1):219–225. doi: 10.1016/j.ijcard.2012.09.091 [DOI] [PubMed] [Google Scholar]
- 57.Lapp L, Young D, Kavanagh K, Bouamrane -M-M, Schraag S. Using machine learning for predicting severe postoperative complications after cardiac surgery. J Cardiothorac Vasc Anesth. 2018;32:S84–S85. doi: 10.1053/j.jvca.2018.08.156 [DOI] [Google Scholar]
- 58.Amarasingham R, Moore BJ, Tabak YP, et al. An automated model to identify heart failure patients at risk for 30-day readmission or death using electronic medical record data. Med Care. 2010;48(11):981–988. doi: 10.1097/MLR.0b013e3181ef60d9 [DOI] [PubMed] [Google Scholar]
- 59.Zolbanin HM, Delen D. Processing electronic medical records to improve predictive analytics outcomes for hospital readmissions. Decis Support Syst. 2018;112(June):98–110. doi: 10.1016/j.dss.2018.06.010 [DOI] [Google Scholar]
- 60.Shinjo D, Fushimi K. Preoperative factors affecting cost and length of stay for isolated off-pump coronary artery bypass grafting: hierarchical linear model analysis. BMJ Open. 2015;5(11):1–9. doi: 10.1136/bmjopen-2015-008750 [DOI] [PMC free article] [PubMed] [Google Scholar]


