CONVENTIONAL 3-DIMENSIONAL (3D) ECHOCARDIOGRAPHIC RENDERING DOES NOT CONSISTENTLY provide images with adequate detail definition and depth perception. Transillumination (TI) is a new 3D rendering tool that uses a freely movable virtual light to enhance image details and depth (Figure 1). This study enrolled 30 patients whose study results contained suboptimal image features on conventional 3D rendering (Supplemental Table 1). The study sought to determine whether TI could improve visualization of orifices and borders, cavities, masses, and structural abnormalities (Figures 2 to 5, Supplemental Figures 1 and 2). The apparent added value of TI, compared to conventional rendering, was scored independently by 5 cardiologists in a survey using a Likert scale from 1 to 5, where 1 = strongly disagree; 2 = disagree; 3 = neutral; 4 = agree; and 5 = strongly agree (Table 1). All readers perceived an added value for TI (median score summary of 4.0 [3.0 to 5.0]) with fair interagreement (kappa = 0.26 [range 0.14 to 0.37]; p < 0.001) (Supplemental Table 2). TI appears to increase the diagnostic confidence of the readers when it is used to enhance specific image features that are not optimally displayed by conventional rendering, including delineation of orifices, borders, cavities, cardiac masses and their attachments, and structural abnormalities.
FIGURE 1. Principles of Transillumination Rendering.
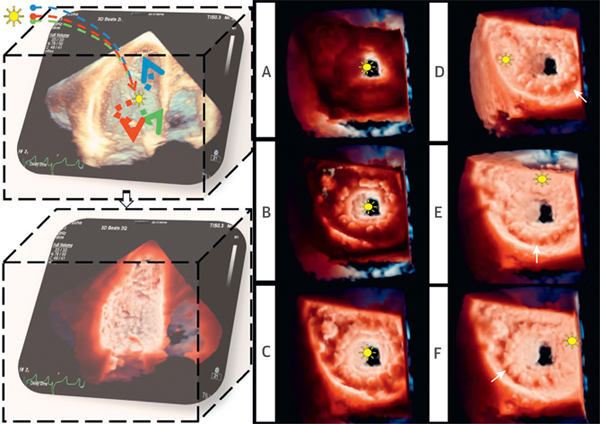
(Left) TI post-processing. The light, modeled with multiple wavelengths, is positioned in the data set. Tissue absorption creates shadows, highlights structures, and enhances depth perception. (Right) Effect of changes in the light position. (A to C) The light was moved along the z plane (depth) from the left ventricular to the left atrial cavity. (D to F) The light was moved along the x and y planes within the LA. Different light positions determine different bioprosthesis shadows (white arrows) (Video 1). LA = left atrium; TI = transillumination.
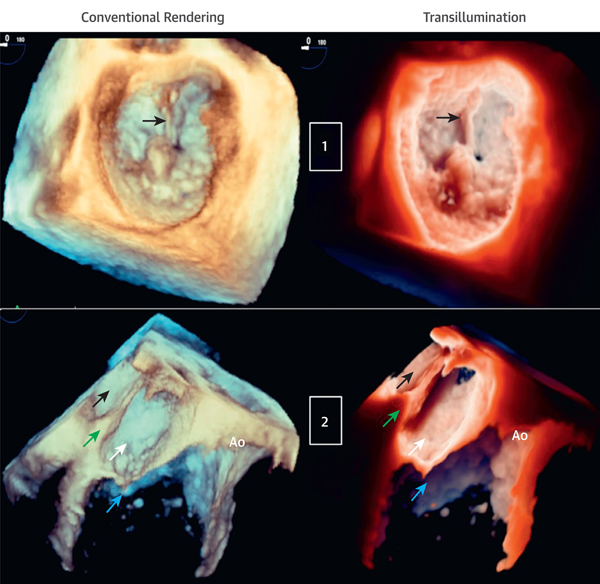
FIGURE 2. Transillumination Versus Conventional Rendering in Patients With Mitral Valve P2 Flail and Cor Triatriatum.
(Case 1) Mitral valve P2 flail due to ruptured chordae (arrows) viewed from the LA (aortic valve 12 o’clock position). The light is in the LA near the ruptured chord to enhance the structural abnormality (Videos 2 and 3). (Case 2) Cor triatriatum. From top to bottom, LA, divided into upper chambers (black arrows) and lower chambers (white arrows) by the membrane (green arrows), mitral valve (blue arrows), and Ao. The light is at the lower left atrial cavity, close to the congenital membrane to improve cavity depth perception (Videos 4 and 5). Ao = aortic valve; other abbreviations as in Figure 1.
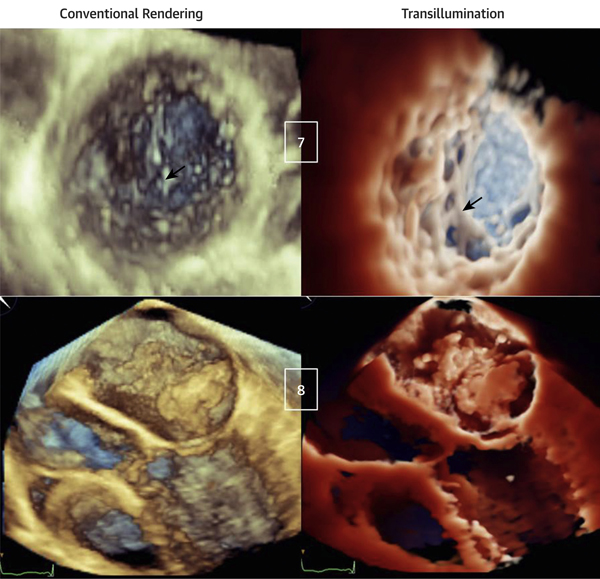
FIGURE 5. Transillumination Versus Conventional Rendering in Patients With Noncompaction Cardiomyopathy (Top) and Left Atrial Myxoma (Bottom).
(Case 7) Apical region of left ventricular noncompaction. The light is in the LV, close to the trabecular inferolateral region, resulting in a clear visualization of the extensive trabeculations in comparison with conventional rendering (arrows) (Videos 14 and 15). (Case 8) Left atrial myxoma with diastolic prolapsing across the mitral valve. The light is in the LA, above the tumor. Although the mass is obvious with conventional rendering, it appears poorly defined, whereas TI rendering underlines mass contours, attachments, dynamic motion, and interaction with the mitral valve (Videos 16 and 17). Abbreviations as in Figures 1 and 3.
TABLE 1.
Survey Results
| All Readers |
|||||
|---|---|---|---|---|---|
| 4.0 (3.0-5.0) |
|||||
| Reader 1 |
Reader 2 |
Reader 3 |
Reader 4 |
Reader 5 |
|
| Score Summary (IQR) |
4.0 (3.0-4.0) |
5.0 (4.3-5.0) |
3.0 (3.0-4.8) |
4.0 (2.5-4.8) |
3.0 (3.0-4.0) |
| Reader 1 | Reader 2 | Reader 3 | Reader 4 | Reader 5 | |
| Number of cases scored ≥3/total | 26/30 (87) | 30/30 (100) | 24/30 (80) | 22/30 (73) | 23/30 (77) |
| Image features improved | |||||
| Delineation of borders and orifices/total | 24/26 (92) | 28/30 (93) | 12/24 (50) | 11/22 (50) | 20/23 (87) |
| Delineation of cavities/total | 15/26 (58) | 27/30 (90) | 12/24 (50) | 12/22 (55) | 7/23 (30) |
| Identification of structural abnormalities/total | 19/26 (73) | 23/30 (77) | 15/24 (62) | 9/22 (41) | 15/23 (65) |
| Delineation of masses and their attachment/total | 9/26 (35) | 10/30 (33) | 7/24 (29) | 4/22 (18) | 6/23 (26) |
This table shows survey results of 30 cases scored by 5 readers who had never been exposed to TI rendering. Scores of the perceived use of TI compared to that of conventional rendering were derived using a Likert scale from 1 to 5 (where 1 = strongly disagree; 2 = disagree; 3 = neutral; 4 = agree; and 5 = strongly agree), with median and interquartile ranges (IQR) (top). The number of cases that scored ≥3 and corresponding image features improved with TI for each reader are presented as absolute numbers and % (bottom).
Supplementary Material
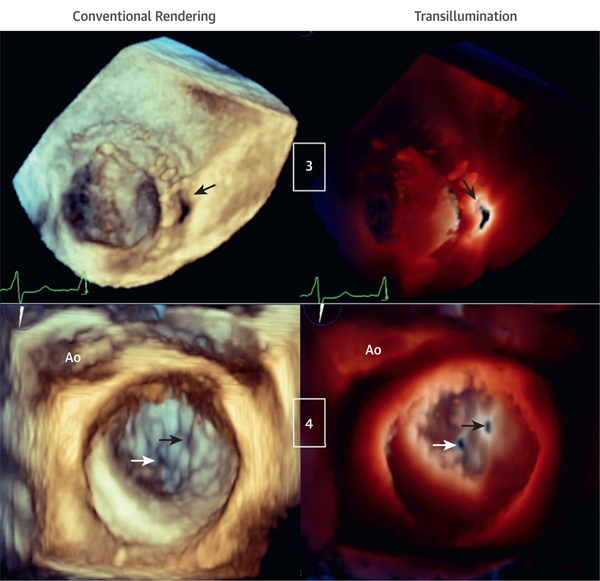
FIGURE 3. Transillumination and Conventional Rendering in Patients With Mechanical Mitral Valve Prosthesis and Perforation of Mitral Valve P3 Scallop.
(Case 3) Bi-leaflet mechanical mitral valve prosthesis with paravalvular leakage (arrows) viewed from the LA. The light is in the LV behind the paravalvular leakage, outlining the orifice edges (Videos 6 and 7). (Case 4) Mitral valve P3 scallop perforation (black arrows) and small, central mal-coaptation (white arrows) are shown. The light is on the valvular plane at the level of the P3 perforation orifice, helping to outline both orifices that otherwise cannot be visualized with conventional rendering (Videos 8 and 9). LV = left ventricle.
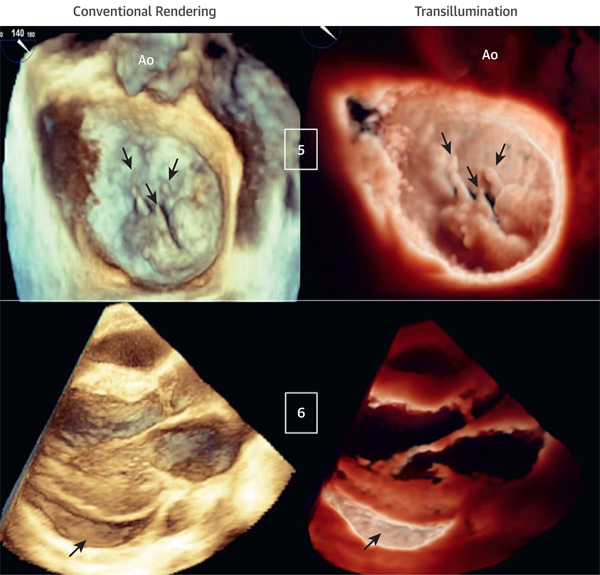
FIGURE 4. Transillumination Versus Conventional Rendering in Patients With Ruptured Mitral Valve Chordae and Pericardial Effusion.
(Case 5) Mitral valve P2 and P3 flail scallops due to multiple ruptured chords (arrows) viewed from the LA. The light is in the LA, close to the valvular plane, slightly anterior to P2. TI rendering enhances the visualization of the ruptured chords and flail scallops (Videos 10 and 11). (Case 6) Inferolateral pericardial effusion (arrows) viewed from a parasternal long-axis acquisition. The light is located deep inside the inferolateral pericardial sac, resulting in a clear definition of the pericardial effusion and cavity (Videos 12 and 13).
Video 1.
Video 2.
Video 3.
Video 4.
Video 5.
Video 6.
Video 7.
Video 8.
Video 9.
Video 10.
Video 11.
Video 12.
Video 13.
Video 14.
Video 15.
Video 16.
Video 17.
Acknowledgments
Dr. Patel has received research support from Philips Healthcare. Dr. Muraru consults for and has received research support from GE Healthcare. Dr. Gonçalves is an employee of Philips Healthcare. All other authors have reported that they have no relationships relevant to the contents of this paper to disclose.
Footnotes
APPENDIX For supplemental figures, tables, and videos, please see the online version of this paper.
Associated Data
This section collects any data citations, data availability statements, or supplementary materials included in this article.


