Abstract
The field of ambient ionization mass spectrometry has witnessed the development of many novel and capable methods for the analysis and imaging of surfaces, with desorption electrospray ionization being a prominent technique that has been commercialized. The adaptation of this technique to existing mass spectrometry platforms requires a laboratory-built solution manufactured with the capability of fine, stable adjustments of the electrospray emitter for liquid or solid sampling purposes. The development, fabrication, and machining require tens of hours of labor for many custom solutions. Herein described is a highly modifiable alternative approach for the fabrication of a desorption electrospray ionization source, using computer-aided design and fused deposition modeling to three-dimensionally print a source platform that utilizes standard accessories of a commercial Bruker Daltonics mass spectrometer. Three-dimensional printing allows for the inexpensive, rapid development of highly modifiable plastic parts, with the total printing time of the apparatus requiring a singular day and only a few dollars of material using a consumer grade printer. To demonstrate the utility of this printed desorption electrospray ionization source, it was fitted on an unmodified Fourier transform ion cyclotron resonance mass spectrometer for a lipid fingerprint analysis in serial sections of rat brain tissue, with the acquisition of line scans of dye-coated slides for the demonstration of serial acquisition.
I. INTRODUCTION
In the past decade, the field of ambient ionization has produced nearly 50 prominent techniques for direct and non-destructive analyses by mass spectrometry.1 Of the many sources described, desorption electrospray ionization (DESI) is amongst the most readily adopted and published ambient techniques—DESI has been reported in hundreds of peer-reviewed applications (a SciFinder search we conducted in 2020 revealed more than 900 unique publications in DESI between 2004 and 2019) from the spot profiling of liquid or solid samples at surfaces without separations2,3 to the mass spectrometry imaging (MSI) of surfaces, bacterial colonies, plant materials, and biological tissues.4–8 First developed in the lab of R. Graham Cooks at Purdue University in 2004, the technique uses an electrospray emitter to deposit primary charged droplets of a solvent in a thin film that extracts analytes from the solid or liquid substrate. The continuous action of primary droplet bombardment produces momentum-derived secondary droplets from the thin film, which then are ionized through electrospray mechanisms on the path into the mass spectrometer.9,10
DESI sources were originally built in individual laboratories and were quickly commercialized. However, DESI is currently only manufactured for Waters instruments, which has resulted in a recreation of the same barrier of entry that existed initially for researchers looking to perform DESI analysis on their existing mass spectrometer platforms. The development can include tens of hours of labor for the design and machining of adapters and parts, the assembly of electrospray emitters, and the coding and optimization for a source capable of MSI. The complexities of laboratory-built DESI sources have ranged from as simplistic as a spot profiling apparatus with an electrospray emitter positioned above a substrate near the commercial capillary inlet11 to as complex as an automated source controlled by modified commercial software with two motorized linear positioners to complete MSI.12 Presented herein is an alternative approach to the manufacturing of a DESI source by computer-aided design (CAD) and three-dimensional (3D) printing technologies, which allowed for the rapid development and modification of a DESI source with a two-dimensional (2D) array of motorized positioners that were printed and completely assembled in a few days.
Fused deposition modeling (FDM) is a readily available form of layered printing in which a thermoplastic filament is heated and then extruded through a nozzle into layers, building the model one layer at a time. These 3D printers range from consumer grade models, which can be purchased for less than two-hundred dollars, to commercial systems costing tens of thousands of dollars. Consumer grade printers readily print using polymers such as polylactic acid (PLA), polyethylene terephthalate (PETG), and acrylonitrile butadiene styrene (ABS); however, these consumer grade 3D printers do require calibration before optimal prints are achieved. The large variety of polymers that can be employed for fabrication offers various mechanical properties for different applications; PLA has been a choice of many due to both its high strength and stiffness. Besides printing structural components, FDM has utility in printing of microfluidic electrospray devices, novel ion mobility systems, and open air electrodes for ion focusing, and in creating printed supports for the increased efficiency of liquid and gel analyses by DESI.13–16 Users of Bruker Daltonics instrumentation can employ standard accessories provided with the mass spectrometer to perform DESI with the design described here. This includes spot profiling DESI or MSI with further time and monetary investment. These printed parts cost only a few dollars’ worth of plastic on a consumer grade printer and can be assembled after approximately one day’s worth of printing time.
II. DESIGN
The DESI–MSI source was designed for using standard accessories and minimal commercially purchased linear positioners. The source was fitted to a Bruker Daltonics 12T SolariX Fourier Transform Ion Cyclotron Resonance (FT-ICR) mass spectrometer (Bremen, Germany), an example of a specialized platform that does not have a commercially available DESI source currently. This mass spectrometer allows for high resolution, accurate mass measurements (permitting the annotation of molecular formulas) and the identification of chemical species utilizing various tandem mass spectrometry techniques. SolariX also shares accessories and sources over a broad range of Bruker mass analyzers, making it practical for the DESI source described here to be interchanged on a number of Bruker mass analyzers equipped with electrospray ionization.
A. 3D printed parts
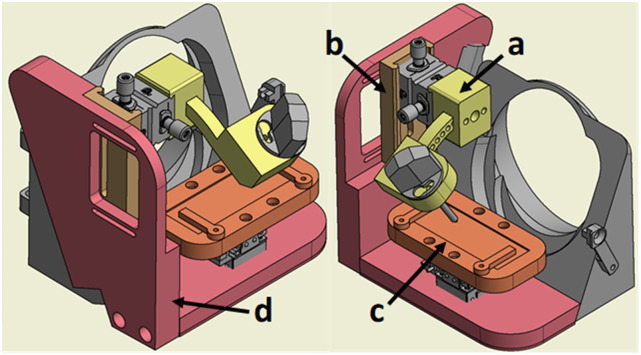
The major 3D printed components are highlighted in the color coded CAD assembly in Fig. 1. Brass threaded inserts were used to allow for repetitive fastening, whereas printed threads show fatigue after prolonged fastening with torque. The designs of these parts are specific to adaptation to Bruker instrumentation; however, they demonstrate the utility of 3D-printing for the creation of stable, customizable solutions alternative to machining and fabrication.
-
(i)
A modular body was designed onto the aforementioned commercial adapter utilizing existing attachment points. To further reduce the need for precision long-range manual stages, sliding dovetails were included in the body to hold a singular Newport Corporation M-MT XY manual stage (Irvine, CA). This addition adds 2D gross motion for rough alignment. The alignment of the electrospray emitter to the sample uses a cap socket bolt with a captive nut to lock the axis, and the alignment of the electrospray emitter to the capillary extension utilizes two cap socket bolts, able to slide into slots in the body secured and locked with brass threaded inserts in the sliding dovetail part. This design directly aligns the electrospray emitter to the axis of the ion transfer capillary, with no means for adjustment in a third axis for the electrospray emitter. Care must be taken to properly align the fused silica spray capillary within the electrospray emitter for optimal results, as discussed within the following design section describing adaption of standard accessories.
-
(ii)
An angular positioner was developed to have quick alignment positions from 85° to 40°, with brass threaded inserts set in the body at 5° increments for rapid adjustments. Two cap socket bolts provide locking points to secure the set angle on the positioner for increased stability of the electrospray emitters geometry even at 15 bars of nebulizing gas pressure, the geometries were stable. With minor changes, the printed angular positioner can accept a variety of electrospray emitters where the Bruker standard sprayer is currently placed.
-
(iii)
A slide adapter was designed to secure a standard glass slide to the motorized array of linear positioners. This adapter can be printed to accept any slide, or create well plates, or use the adapter as printed supports. Such an adapter previously demonstrated an increased efficiency in the DESI analysis of liquids and gels.16
-
(iv)
A capillary extension for broad spot profiling and high-spatial resolution sampling was produced from 304 stainless steel tubing from McMaster-Carr (Elmhurst, IL) with an adapter to provide for a slip-fit on the glass transfer capillary. For spot profiling, a capillary extension was fabricated from 0.058 in. OD, 0.085in. ID tubing. For precision profiling, 0.0625in. OD, 0.0325in. ID tubing was used with a Bruker nanospray gas diverter utilized to block the excess counter-current gas flow to the sampling surface.
FIG. 1.
Color coded CAD model highlighting the printed parts: (a) the angular positioner of the electrospray emitter in yellow, (b) the sliding dovetail for the gross adjustment of the electrospray emitter in brown, (c) the microscope slide adapter in orange, and (d) the structural source body in red, as well as the commercially purchased positioners and standard Bruker accessories in gray.
B. Adaptation of standard accessories
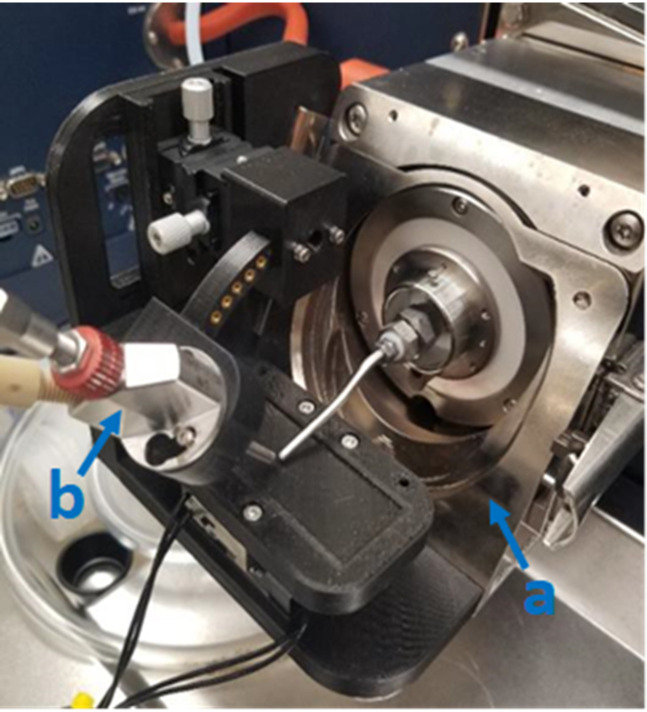
The standard Bruker accessories are shown in Fig. 2 installed on the instrument and include an online nanospray adapter used for the attachment of the DESI source to the instrument. This commercial adapter can be replaced by a printed solution, although careful consideration must be taken as to the polymer of choice, as some mechanical properties of printed polymers are not optimal for high heat environments. Annealing of FDM printing parts has been demonstrated to remedy this to a degree, increasing the crystallinity of FDM printed plastic, thereby increasing strength, temperature resistance, and other properties making the printed parts in certain cases stronger than commercially injection molded pieces.17,18
FIG. 2.
Photograph of the source mounted on the mass spectrometer highlighting standard Bruker accessories, (a) ESI standard sprayer and (b) online nanospray adapter.
The standard electrospray emitter on Bruker electrospray platforms accepts pulled or cut fused silica spray capillaries with various inner and outer diameters (ID/OD) and allows for the easy replacement of clogged or damaged spray capillaries. The additional benefit of the commercial emitter is having a stainless steel nebulizing gas channel, unlike in the traditional construction of an electrospray emitter for DESI using a Swagelok fitting and fused silica as described in the literature.19 The Swagelok design relies upon concentricity being maintained between flexible fused silica capillaries—an outer nebulizing gas channel and an inner solvent capillary. Alterations in the optimized alignment of the capillaries have been demonstrated to produce variable intensities in biological tissues.20 This is mitigated by using an electrospray emitter with stable geometries and when possible a rigid stainless steel nebulizing gas channel. Although care must still be taken to ensure the proper alignment of the solvent capillary, the increased stability of this emitter and other commercial and experimental emitter designs has been demonstrated to produce more reproducible results vs traditional methods.21
C. Motorized array of linear positioners
A 2D array of Agilis LG25-27 linear positioners with an Agilis UG-2 driver controller from Newport Corporation (Irvine, CA) to control the array was integrated into the apparatus for MSI applications. The array is capable of precision jogging of both positioners after calibration to align the electrospray emitter with regions-of-interest and can be recalled to an absolute position utilizing ASC II line commands. This allows for the acquisition of line scans, or a raster of pixels, independent to triggering acquisition, as demonstrated in the serial acquisition in Fig. S1 of the supplementary material. Following manual workflows that have been previously described in the literature, the creation of mass spectrometry images can be achieved.22 Further integration into the instrumental platform can be accomplished using commercial software or lab-written code with a trigger, which has been demonstrated in previous generations of Bruker FT-ICR mass spectrometers.12 The two positioners are also compact and light, with a weight of 125 g/axis. This enables placement close to the mass spectrometer inlet and makes an ideal choice for reducing stress on a FDM-printed body. For basic spot profiling operation, all positioners can be replaced by printed solutions; for a MSI capable source, precision motorized positioners are essential, and within further applications, MSI will be demonstrated utilizing this printed DESI source.
III. EXPERIMENTAL
A. 3D printing
The printed parts of the source were designed in AutoDesk Inventor Professional (San Rafael, CA), and CAD models were then exported as stereolithography files (.stl) into a 3D slicer program, Ultimaker Cura 4.1.0 (Utrecht, The Netherlands). Briefly, the slicer program generates a layered model with specified layer heights at set parameters that can be exported as g-code, which then controls the printer layer by layer. All parts were printed on upgraded Creality 3D Ender-3 (Shenzhen, China) with a 1.75 ± 0.03 mm diameter PLA filament with a 0.2 mm brass nozzle. The extruder temperature was set at 205 °C and printed at 0.12 mm layer heights onto a heated glass bed. The heated bed was initially set to 50 °C to improve first layer adhesion and then held at 40 °C for the duration of the prints. After the calibration of the printer, the produced parts were measured within ±0.050 mm across linear surfaces. The brass inserts were pressed with heat into printed holes once the plastic parts cooled to ambient temperatures for the assembly of structural components and the attachment of motorized linear positioners.
B. Preparation and sectioning of tissue
A control brain was harvested from a healthy Sprague–Dawley rat and flash frozen in liquid nitrogen. The brain was stored at −80 °C and sectioned unembedded and non-fixated at 12 µm at −20 °C on a cryostat. Serial sections were thaw mounted onto clean frosted glass slides (ThermoFisher Scientific, Waltham, MA) for DESI spot profiling and stored at −20 °C prior to experiments. All experiments were completed within 1 month of cryo-sectioning.
C. DESI geometries
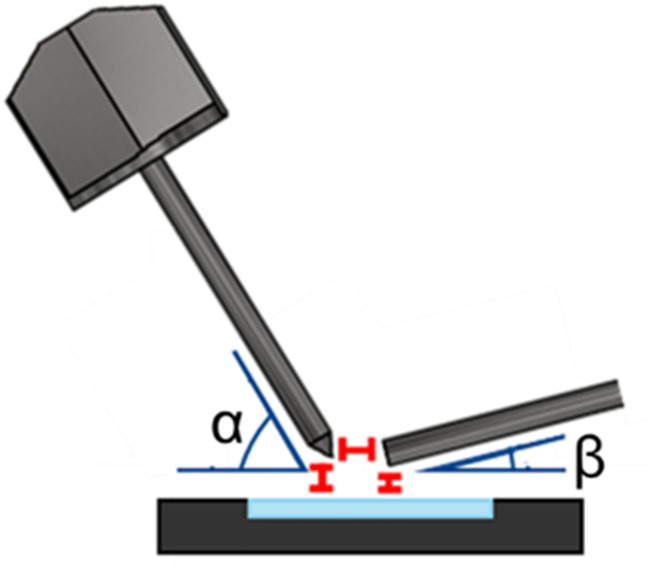
For these experiments, the endplate and attachment on the glass capillary were removed and replaced with a capillary extension, as described above. The Bruker ESI standard sprayer was used with a fused silica spray capillary of 195 µm OD, 100 µm ID, protruding from the emitter by 1.0 mm; a flat tip was ground prior to experiments using a precision beveller. DESI parameters were optimized, as shown in Table I and Fig. 3.
TABLE I.
Optimized DESI FT-ICR geometries for the spot profiling experiments.
| Charged | Grounded | |
|---|---|---|
| emitter | emitter | |
| Incidence angle (α) (deg) | 55 | 55 |
| Collection angle (β) (deg) | 7 | 7 |
| Emitter distance from capillary (mm) | 3.0 | 2.0 |
| Emitter distance from sample (mm) | 3.0 | 2.0 |
| Capillary distance from sample (mm) | >0.5 | >0.5 |
FIG. 3.
Diagram of the DESI geometries with the commercial electrospray emitter, slide adapter, and capillary extension pictured.
D. DESI spot profiling analysis
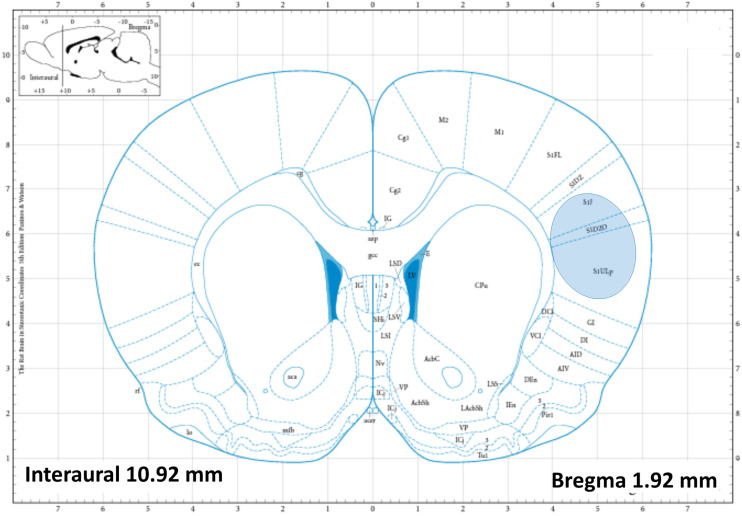
All datasets were collected on a Bruker Daltonics 12T SolariX Fourier Transform Ion Cyclotron Resonance (FT-ICR) mass spectrometer equipped with a dual electrospray and MALDI source (Bremen, Germany) using broadband detection from m/z 98.29 to 1000.00 at a 2 MW file size for a transient of 0.5592 s with ion accumulation up to 1.0 s. The solvent composition was 50:50 acetonitrile–water for positive ions and 50:50 acetonitrile–dimethylformamide for negative ions at a flow rate of 2 µl/min. A sufficient number of scans, up to 100, were acquired equivalently in each experiment to obtain a signal-to-noise ratio above 5 for analytes. Spots were analyzed in serial sections of coronal rat brain slices to ensure uniform analyte distributions over multiple experiments; the area profiled was within the same stereotaxic region within the somatosensory cortexes, as shown in the rat brain atlas23 in Fig. 4.
FIG. 4.
Rat brain atlas of the approximate depth of coronal slices; highlighted is the somatosensory cortexes where serial sections were profiled. From Paxinos and Watson, The Rat Brain in Stereotactic Coordinates, Copyright 2018 Elsevier Academic Press. Reproduced with permission from Elsevier Academic Press.
The following parameters were optimized individually for grounded and charged emitter experiments. The internal instrumental power supply was used to apply 6.0 kV to the capillary extension, while the emitter was grounded with a nebulizing pressure of 4 bars. Charged emitter experiments implemented external high voltage from an IonTech B50 power supply (Teddington, England) that was used to apply a potential of 4.5 kV to a stainless steel union prior to the emitter, with a nebulizing pressure of 8.0 bars and the capillary extension set to 0 V. The end plate voltage was set at 0 V for all experiments. The optimization of the signal for the charged emitter required external regulation of the nebulizing gas flow due to an instrumental limitation of 5.5 bars, as well as an increase in the distance away from the capillary for the mitigation of electrical discharge.
E. Acquisition of DESI serial scans
Rhodamine 6G from a red permanent marker (Sharpie, Oak Brooke, IL) was applied to a clean glass slide in parallel rows for these experiments. ASC II line commands were sent from the Agilis UG-2 driver to first calibrate the speed of the array of Agilis LS-25-27 positioners; during the acquisition of line scans, a calculated average speed of 295 µm/s was obtained. The same source conditions were used, as described in the grounded emitter experiments for the acquisition of line scans with a solvent mixture of 50:50 methanol–water.
IV. RESULTS
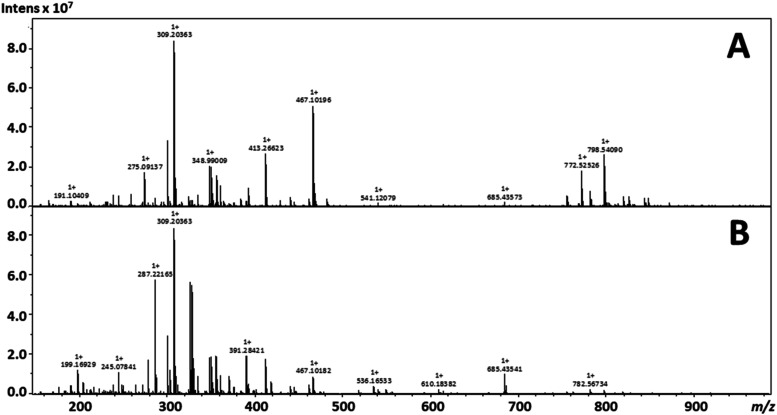
To demonstrate the utility of the 3D printed DESI source that was printed on a consumer grade FDM printer, the spot profiling of serial sections of the coronal rat brain was performed. Initial spot profiling focused primarily upon obtaining lipid fingerprints from the same stereotaxic region in the brain. A variety of lipid species were annotated and found consistent with the literature reports of known species around the area shown in Fig. 4.24 These experiments also varied the position of the high voltage potential and ground from the emitter to the capillary extension with annotated lipid species, and the fold change of the peak area is shown in Table II. The variation of the placement of high voltage resulted in a multitude of differential signals among a stable base peak highlighted in representative spectra from positive ion mode experiments with 50:50 acetonitrile–water in Fig. 5.
TABLE II.
Annotated species from the DESI spot profiling experiments with the observed experimental error of the adducts from each experimental setup. The fold change is also stated in a ratio of peak area of the observed species. SM—sphingomyelin, ND—not detected, and NA—not applicable.
| Annotation | Molecular formula | Adduct | Observed m/z | Grounded emitter (ppm) | Observed m/z | Charged emitter | Fold change |
|---|---|---|---|---|---|---|---|
| PC (34:1) | C42H82NO8P | [M + Na]+ | 782.567 15 | −0.16 | 782.568 02 | −1.27 ppm | 5.9 |
| PC (34:1) | C42H82NO8P | [M + K]+ | 798.540 90 | 0.08 | ND | ND | NA |
| PC (32:0) | C40H80NO8P | [M + Na]+ | 756.551 36 | 0.09 | 756.551 24 | 0.18 ppm | 4.4 |
| PC (32:0) | C40H80NO8P | [M + K]+ | 772.525 26 | 0.07 | ND | ND | NA |
| PC (36:4) | C44H80NO8P | [M + Na]+ | 804.551 32 | 0.07 | ND | ND | NA |
| PC (36:4) | C44H80NO8P | [M + K]+ | 820.524 93 | 0.47 | ND | ND | NA |
| PC (38:6) | C46H80NO8P | [M + Na]+ | 828.550 90 | 0.58 | ND | ND | NA |
| PC (38:6) | C46H80NO8P | [M + K]+ | 844.525 09 | 0.27 | ND | ND | NA |
| PC (36:1) | C44H86NO8P | [M + Na]+ | 810.598 78 | −0.56 | ND | ND | NA |
| PC (36:1) | C44H86NO8P | [M + K]+ | 826.572 30 | −0.04 | ND | ND | NA |
| PE (40:6) | C45H78NO8P | [M + Na]+ | 814.536 80 | −1.32 | ND | ND | NA |
| PE (40:6) | C45H78NO8P | [M + K]+ | 830.509 11 | 0.66 | ND | ND | NA |
| SM (36:1) | C41H83N2O6P | [M + K]+ | 769.562 55 | −0.67 | ND | ND | NA |
FIG. 5.
Representative spectra from DESI FT-ICR spot profiling experiments for (a) a grounded emitter with instrumental high voltage on the capillary extension and (b) a charged emitter with external power applied to the emitter.
When considering the geometries of the DESI setups, the optimized charged emitter geometry allowed for the analysis of a larger area of tissue than the grounded electrospray emitter; source parameters and geometries were independently optimized, and no such parameter could increase the phospholipid signal to that represented within the spectra of the grounded emitter. Alterations to the electrospray emitter geometry placing it closer to the surface or the capillary extension only initiated electrical discharge. It should be stated that the operation of this instrumental platform with an external power supply is unconventional, and the deviance in source parameters and geometries between setups has been previously documented between various mass spectrometry platforms and Bruker Daltonics instrumentation.25 The counter-current gas flow, which causes the strong desolvation of charged droplets, has been noted as one of a number of factors that account for such differentials in performance.25 However, this gas flow when contained and applied with high voltage to the capillary extension also introduces an effect of heat-treatment to the capillary, previously demonstrated in a ceramic insulated heated capillary design, which provided enhanced efficiency of ion transmission and aided in the desolvation and charging of larger biomolecules—such as peptides and proteins.26
Despite the general enhancement of phosphatidylcholines (PC) and phosphatidylethanolamines (PE) in the traditional setup of the instrument with a grounded emitter, the base peak of the mass spectra is consistent between setups with a calculated peak area ratio between the grounded and charged emitter experiments of 0.99. Accurate mass measurements of the peak at m/z 309.203 63 allowed for annotation as C16H30O4 in the METLIN database. When focusing on smaller molecules ionized within the experiments, the results are inverse of larger molecules—the traditional setup of a charged electrospray emitter experiment generally yields higher ion intensities and more signals in the lower m/z range. For the targeted lipid analysis within this work, the use of the internal power supply and grounded emitter was optimal; however, these observations tend to suggest another point for optimization for this design—with the potential for both charged and grounded emitters. Considerations must be given for the sample matrices, ionization mode, and target analytes. An example for negative ion mode spot profiling DESI using 50:50 acetonitrile–dimethylformamide is provided in Fig. S2 of the supplementary material. Both the positive and negative ion spot DESI mass spectra of coronal rat brain sections depict an excellent qualitative agreement with previous spot-profiling DESI of rat brain.27
SUPPLEMENTARY MATERIAL
See the supplementary material for Fig. S1—a time resolved acquisition and a digital photograph of the sample on the linear positioner array and Fig. S2—a negative ion mode DESI FT-ICR mass spectrum from a coronal section of rat brain.
ACKNOWLEDGMENTS
We gratefully acknowledge the financial support of the NIH through the National Center for Research Resources (Grant No. S10-RR029517-01) for providing funds used to obtain the FT-ICR instrument, the University at Buffalo Chemistry Instrument Center for housing the mass spectrometer, and the Mark Diamond Research Fund at the University at Buffalo (Grant No. SU-19-21) for providing funds for the manual stage and linear positioner array for the DESI source, and we also would like to acknowledge Professor Alexis C. Thompson of the University at Buffalo Psychology Department for the cryo-sectioned sample tissue.
DATA AVAILABILITY
The data that support this study, along with the .stl files for all FDM printed parts, are available from the corresponding author upon reasonable request.
REFERENCES
- 1.Feider C. L., Krieger A., DeHoog R. J., and Eberlin L. S., Anal. Chem. 91, 4266 (2019). 10.1021/acs.analchem.9b00807 [DOI] [PMC free article] [PubMed] [Google Scholar]
- 2.Leuthold L. A., Mandscheff J.-F., Fathi M., Giroud C., Augsburger M., Varesio E., and Hopfgartner G., Rapid Commun. Mass Spectrom. 20, 103 (2006). 10.1002/rcm.2280 [DOI] [PubMed] [Google Scholar]
- 3.Miao Z. and Chen H., J. Am. Soc. Mass Spectrom. 20, 10 (2009). 10.1016/j.jasms.2008.09.023 [DOI] [PubMed] [Google Scholar]
- 4.Jurisch M., Vendramini P. H., Eberlin M. N., and Augusti R., J. Am. Soc. Mass Spectrom. 31, 1000 (2020). 10.1021/jasms.0c00007 [DOI] [PubMed] [Google Scholar]
- 5.Dunham S. J. B., Ellis J. F., Li B., and Sweedler J. V., Acc. Chem. Res. 50, 96 (2017). 10.1021/acs.accounts.6b00503 [DOI] [PMC free article] [PubMed] [Google Scholar]
- 6.Cabral E. C., Mirabelli M. F., Perez C. J., and Ifa D. R., J. Am. Soc. Mass Spectrom. 24, 956 (2013). 10.1007/s13361-013-0616-y [DOI] [PubMed] [Google Scholar]
- 7.Garza K. Y., Feider C. L., Klein D. R., Rosenberg J. A., Brodbelt J. S., and Eberlin L. S., Anal. Chem. 90, 7785 (2018). 10.1021/acs.analchem.8b00967 [DOI] [PMC free article] [PubMed] [Google Scholar]
- 8.Wiseman J. M., Ifa D. R., Zhu Y., Kissinger C. B., Manicke N. E., Kissinger P. T., and Cooks R. G., Proc. Natl. Acad. Sci. U. S. A. 105, 18120 (2008). 10.1073/pnas.0801066105 [DOI] [PMC free article] [PubMed] [Google Scholar]
- 9.Venter A., Sojka P. E., and Cooks R. G., Anal. Chem. 78, 8549 (2006). 10.1021/ac0615807 [DOI] [PubMed] [Google Scholar]
- 10.Venter A. R., Douglass K. A., Shelley J. T., Hasman G., and Honarvar E., Anal. Chem. 86, 233 (2014). 10.1021/ac4038569 [DOI] [PubMed] [Google Scholar]
- 11.Nefliu M., Venter A., and Cooks R. G., Chem. Commun. 8, 888 (2006). 10.1039/b514057a [DOI] [PubMed] [Google Scholar]
- 12.Pól J., Vidová V., Kruppa G., Kobliha V., Novák P., Lemr K., Kotiaho T., Kostiainen R., Havlíček V., and Volný M., Anal. Chem. 81, 8479 (2009). 10.1021/acs.analchem.8b03026 [DOI] [PubMed] [Google Scholar]
- 13.Duarte L. C., Colletes de Carvalho T., Lobo-Júnior E. O., Abdelnur P. V., Vaz B. G., and Coltro W. K. T., Anal. Methods 8, 496 (2016). 10.1039/c5ay03074a [DOI] [Google Scholar]
- 14.Hollerbach A., Baird Z., and Cooks R. G., Anal. Chem. 89, 5058 (2017). 10.1021/acs.analchem.7b00469 [DOI] [PubMed] [Google Scholar]
- 15.Baird Z., Wei P., and Cooks R. G., Analyst 140, 696 (2015). 10.1039/c4an01929f [DOI] [PubMed] [Google Scholar]
- 16.Elviri L., Foresti R., Bianchera A., Silvestri M., and Bettini R., Talanta 155, 321 (2016). 10.1016/j.talanta.2016.05.010 [DOI] [PubMed] [Google Scholar]
- 17.Benwood C., Anstey A., Andrzejewski J., Misra M., and Mohanty A. K., ACS Omega 3, 4400 (2018). 10.1021/acsomega.8b00129 [DOI] [PMC free article] [PubMed] [Google Scholar]
- 18.Srithep Y., Nealey P., and Turng L.-S., Polym. Eng. Sci. 53, 580 (2013). 10.1002/pen.23304 [DOI] [Google Scholar]
- 19.Takáts Z., Wiseman J. M., Gologan B., and Cooks R. G., Anal. Chem. 76, 4050 (2004). 10.1021/ac049848m [DOI] [PubMed] [Google Scholar]
- 20.Tillner J., McKenzie J. S., Jones E. A., Speller A. V. M., Walsh J. L., Veselkov K. A., Bunch J., Takats Z., and Gilmore I. S., Anal. Chem. 88, 4808 (2016). 10.1021/acs.analchem.6b00345 [DOI] [PubMed] [Google Scholar]
- 21.Tillner J., Wu V., Jones E. A., Pringle S. D., Karancsi T., Dannhorn A., Veselkov K., McKenzie J. S., and Takats Z., J. Am. Soc. Mass Spectrom. 28, 2090 (2017). 10.1007/s13361-017-1714-z [DOI] [PMC free article] [PubMed] [Google Scholar]
- 22.Wu C., Dill A. L., Eberlin L. S., Cooks R. G., and Ifa D. R., Mass Spectrom. Rev. 32, 218 (2013). 10.1002/mas.21360 [DOI] [PMC free article] [PubMed] [Google Scholar]
- 23.Paxinos G. and Watson C., The Rat Brain in Stereotactic Coordinates (Elsevier Academic Press, Amsterdam, 2018). [Google Scholar]
- 24.Nielsen M. M. B., Lambertsen K. L., Clausen B. H., Meyer M., Bhandari D. R., Larsen S. T., Poulsen S. S., Spengler B., Janfelt C., and Hansen H. S., Sci. Rep. 6, 39571 (2016). 10.1038/srep39571 [DOI] [PMC free article] [PubMed] [Google Scholar]
- 25.Takats Z., Kobliha V., Sevcik K., Novak P., Kruppa G., Lemr K., and Havlicek V., J. Mass Spectrom. 43, 196 (2008). 10.1002/jms.1285 [DOI] [PubMed] [Google Scholar]
- 26.Towers M. W., Karancsi T., Jones E. A., Pringle S. D., and Claude E., J. Am. Soc. Mass Spectrom. 29, 2456 (2018). 10.1007/s13361-018-2049-0 [DOI] [PMC free article] [PubMed] [Google Scholar]
- 27.Eberlin L. S., Ferreira C. R., Dill A. L., Ifa D. R., Cheng L., and Cooks R. G., ChemBioChem 12, 2129 (2011). 10.1002/cbic.201100411 [DOI] [PMC free article] [PubMed] [Google Scholar]
Associated Data
This section collects any data citations, data availability statements, or supplementary materials included in this article.
Supplementary Materials
See the supplementary material for Fig. S1—a time resolved acquisition and a digital photograph of the sample on the linear positioner array and Fig. S2—a negative ion mode DESI FT-ICR mass spectrum from a coronal section of rat brain.
Data Availability Statement
The data that support this study, along with the .stl files for all FDM printed parts, are available from the corresponding author upon reasonable request.


