Abstract
Objective
To study the neuropathologic correlates of cholinergic basal forebrain (BF) atrophy as determined using antemortem MRI in the Alzheimer disease (AD) spectrum.
Methods
We determined associations between BF volume from antemortem MRI brain scans and postmortem assessment of neuropathologic features, including neuritic plaques, neurofibrillary tangles (NFTs), Lewy body (LB) pathology, and TDP-43, in 64 cases of the Alzheimer's Disease Neuroimaging Initiative cohort. For comparison, we assessed neuropathologic features associated with hippocampal and parahippocampal gyrus atrophy. In addition to region of interest–based analysis, we determined the association of neuropathologic features with whole brain gray matter volume using regionally unbiased voxel-based volumetry.
Results
BF atrophy was associated with Thal amyloid phases (95% confidence interval [CI] −0.49 to −0.01, p = 0.049) and presence of LB pathology (95% CI −0.54 to −0.06, p = 0.015), as well as with the degree of LB pathology within the nucleus basalis Meynert (95% CI −0.54 to −0.07, p = 0.025). These effects were no longer significant after false discovery rate (FDR) correction. Hippocampal atrophy was significantly associated with the presence of TDP-43 pathology (95% CI −0.61 to −0.17, p = 0.003; surviving FDR correction), in addition to dentate gyrus NFT load (95% CI −0.49 to −0.01, p = 0.044; uncorrected). Voxel-based analysis confirmed spatially restricted effects of Thal phases and presence of LB pathology on BF volume.
Conclusions
These findings indicate that neuropathologic correlates of regional atrophy differ substantially between different brain regions that are typically involved in AD-related neurodegeneration, including different susceptibilities to common comorbid pathologies.
MRI-based volumetry is recognized as a topographic marker for staging and monitoring the progression of Alzheimer disease (AD).1 To understand the pathologic substrate of MRI-based volumetric changes, previous studies have investigated associations of neuropathologic measures of primary AD pathology and common comorbid pathologies with antemortem MRI volumetry. A systematic review identified 27 studies until mid-2015 on antemortem MRI and neuropathology.2 The large majority of these and subsequent studies focused on the hippocampus and other medial temporal lobe (MTL) structures, such as the parahippocampal gyrus and entorhinal cortex.
Besides degeneration of the hippocampus and MTL, cholinergic system degeneration is a key event in AD pathogenesis.3 Over the last decade, advances in MRI data analysis have enabled in vivo volumetry of the cholinergic basal forebrain (BF),4,5 the central site of origin of cholinergic projections to the cerebral cortex and limbic system in the human brain.6 Studies using in vivo BF volumetry to study BF degeneration in the course of AD have shown that this brain region is severely atrophied in AD dementia and may even precede MTL degeneration in the prodromal phase of AD.5,7 Neuropathologic studies suggest altered expression of neurotrophic receptors on cholinergic neurons, as well as neurofibrillary tangle (NFT) accumulation and dystrophic cell shrinkage, but not frank loss of cholinergic BF neurons in MCI and early AD cases.8 Whereas the main pathologic correlate of cholinergic BF degeneration in AD is considered to be NFT pathology,9 this brain region also shows high susceptibility to other neurodegenerative pathologies, particularly Lewy body (LB) pathology,10 but also TDP-43 pathology.11 In addition to these local pathologic changes, distinct associations between cholinergic system degeneration and accumulation of cortical amyloid pathology have been described in postmortem data,12 and these associations could recently also be demonstrated in vivo using MRI-measured BF volume and amyloid-sensitive PET imaging.13,14 However, associations between in vivo BF volume on MRI and global and local neuropathologic lesions are unexplored.
We used available antemortem MRI and postmortem neuropathologic examination data from 64 individuals enrolled in the Alzheimer's Disease Neuroimaging Initiative (ADNI) to determine neuropathologic features associated with MRI-based BF volume and compared these to neuropathologic correlates of more widely studied MRI-based MTL volumes. In addition, we extended the currently limited evidence on the regional specificity of neuropathology associations with whole brain gray matter (GM) volume using unbiased voxel-based volumetry.
Methods
Data source
Data used in the preparation of this article were obtained from the ADNI database (adni.loni.usc.edu/). The ADNI was launched in 2003 by the National Institute on Aging, the National Institute of Biomedical Imaging and Bioengineering, the Food and Drug Administration, private pharmaceutical companies, and nonprofit organizations, with the primary goal of testing whether neuroimaging, neuropsychologic, and other biologic measurements can be used as reliable in vivo markers of AD pathogenesis. A fuller description of ADNI and up-to-date information is available at adni-info.org.
Standard protocol approvals, registrations, and patient consents
All procedures performed in the ADNI studies involving human participants were in accordance with the ethical standards of the institutional research committees and with the 1964 Helsinki declaration and its later amendments. Written informed consent was obtained from all participants and/or authorized representatives and the study partners before any protocol-specific procedures were carried out in the ADNI studies.
Study participants
We retrieved the last available MRI scans of 64 ADNI participants who had come to autopsy between 2007 and 2017. Detailed inclusion criteria for the antemortem diagnostic categories can be found at the ADNI web site (adni.loni.usc.edu/methods/). Briefly, cognitively normal (CN) participants had Mini-Mental State Examination (MMSE) scores between 24 and 30 (inclusive); had a Clinical Dementia Rating (CDR) score of 0; did not have depression, mild cognitive impairment (MCI), or dementia; and reported no subjective memory concerns (SMCs). One participant fulfilled identical criteria to the CN cases with the exception that he had a self-reported persistent memory complaint quantified by the Cognitive Change Index (with a total score from the first 12 items ≥16). As this participant lacked objective cognitive decline, he was integrated into the CN group. Participants with MCI had MMSE scores between 24 and 30 (inclusive); a SMC reported by the participant, informant, or clinician; objective memory loss measured by education-adjusted scores on delayed recall; CDR = 0.5; absence of significant levels of impairment in other cognitive domains; essentially preserved activities of daily living; and an absence of dementia. All MCI cases were classified as amnestic MCI according to the ADNI guidelines. At inclusion into the ADNI cohort, patients with AD dementia had initial MMSE scores between 20 and 26 (inclusive), had a CDR = 0.5 or 1.0 with impaired activities of daily living, and fulfilled National Institute of Neurological and Communicative Disorders and Stroke–Alzheimer’s Disease and Related Disorders Association criteria for clinically probable AD.15
Neuropathological assessments
All neuropathologic evaluations in the ADNI cohort are performed through the central laboratory of the ADNI neuropathology core (adni.loni.usc.edu/about/#core-container) and assess a wide range of AD and non-AD neuropathologic lesions, including both established neuropathologic criteria as well as detailed regional assessments within 22 cortical and subcortical brain regions.16 The neuropathologic procedures follow previously established guidelines17 that are captured in the format of the Neuropathology Data Form Version 10 of the National Alzheimer Coordinating Center (alz.washington.edu/NONMEMBER/NP/npform10.pdf).
We used established rating scales for AD neuropathologic change represented by Thal amyloid phases, Braak NFT staging, and the Consortium to Establish a Registry for Alzheimer’s Disease (CERAD) score for density of neuritic plaques, and further assessed whether comorbid LB pathology, TDP-43 pathology, or hippocampal sclerosis was present or not. In addition, we used regional neuropathologic rating scores for the nucleus basalis Meynert (NbM), dentate gyrus, entorhinal cortex, and parahippocampal gyrus, corresponding to our MRI-based regions of interest (ROIs) in the BF and the MTL. The ADNI autopsy data lack an assessment of CA1 neuron loss so that we did not include CA1 in our evaluation. NbM pathology was sampled on a coronal slice at the level of the crossing of the anterior commissure and was not selective for cholinergic neuron populations within this area. Therefore, we did not include NbM neuronal loss scores into our analysis. The dentate gyrus and parahippocampal gyrus were both sampled on a coronal section at the level of the lateral geniculate nucleus. The entorhinal cortex was sampled on a separate, more anterior section. Within the target regions, we focused on scores for neuronal loss, NFT, neuritic plaques, TDP-43 immunoreactive neuronal cytoplasmic inclusions, and LB pathology, assessed on semiquantitative scales (none, mild, moderate, and severe). Further details on the neuropathologic assessments can be found in the supplementary materials section (supplementary data available from Dryad, doi.org/10.5061/dryad.dfn2z34x6).
Neuropsychological assessment
The MMSE18 was available to assess degree of cognitive impairment, and established ADNI composite scores for episodic memory and executive function were used for the evaluation of domain-specific cognitive performance.19,20
Imaging data acquisition
MRI data were acquired on multiple 1.5T and 3T MRI scanners using scanner-specific T1-weighted sagittal 3D magnetization-prepared rapid gradient echo (MPRAGE) sequences. In order to increase signal uniformity across the multicenter scanner platforms, original MPRAGE acquisitions in ADNI undergo standardized image preprocessing correction steps. Detailed information on the different imaging protocols employed across ADNI sites and standardized image preprocessing steps can be found on the ADNI website (adni.loni.usc.edu/methods/).
Imaging data processing
Imaging data were processed by using statistical parametric mapping (SPM12, Wellcome Trust Center for Neuroimaging) and the CAT12.3 toolbox (dbm.neuro.uni-jena.de/cat) implemented in MATLAB R2018a (MathWorks, Natick, MA). First, MRI scans were automatically segmented into GM, white matter (WM), and CSF partitions of 1.5 mm isotropic voxel size using the Adaptive Maximum A Posterior (AMAP) segmentation routine of the CAT12 toolbox. The resulting GM and WM partitions of each participant in native space were then high-dimensionally registered to the Montreal Neurological Institute (MNI) reference template using the DARTEL algorithm.21 Individual flow fields resulting from the DARTEL registration to the reference template were used to warp the GM segments and voxel values were modulated for volumetric changes introduced by the high-dimensional normalization, such that the total amount of GM volume present before warping was preserved.
Extraction of imaging features from BF and hippocampal ROIs
The cholinergic nuclei are not directly visible on current structural MRI contrasts and no comprehensive set of external landmarks has been identified that could be used for indirect manual delineation of the cholinergic BF on MRI scans. In the current study, we localized the cholinergic space of the BF based on a cytoarchitectonic map of BF cholinergic nuclei in MNI space, derived from combined histology and MRI of a postmortem brain, as described previously.4
An ROI mask for the hippocampus was obtained by manual delineation of the hippocampus in the reference template following the harmonized protocol for hippocampus segmentation.22
The parahippocampal gyrus ROI was derived from the corresponding label in the “Hammers” maximum probability structural atlas,23 which includes both the parahippocampal gyrus proper and the entorhinal cortex.
Individual GM volumes of the ROIs were extracted automatically from the warped GM segments by summing up the modulated GM voxel values within the respective ROI masks in the reference space. For further analyses, the extracted regional GM volumes were scaled by the total intracranial volume (TIV), calculated as the sum of total volumes of the GM, WM, and CSF partitions.
Statistics
All variables used for analysis, except the volume measures, were directly retrieved from the ADNI database. Statistical analyses were conducted with R (The R Foundation for Statistical Computing) as implemented in R Studio, Version 1.1.453, unless otherwise specified.
Volume measurements were compared between clinical diagnostic groups using analysis of covariance models, controlling for age at MRI, sex, scanner field strength, and the temporal interval between MRI and death (considering a p value of < 0.05 as significant).
Associations between neuropathologic scores and volume measures were analyzed using partial correlations, controlling for age, sex, MRI scanner field strength, and the temporal interval between MRI and death. In addition, associations between neuropathologic scores and neuropsychological measures were analyzed using partial correlation, controlling for age, sex, and the temporal interval between the last cognitive testing and death. We report results at a p value < 0.05, uncorrected for multiple comparisons, as well as following false discovery rate (FDR) correction.24
In a complementary voxel-wise analysis in SPM12, we determined the effect of neuropathologic scores that showed significant associations with ROI volumes on whole brain GM changes. The analyses were controlled for age at MRI, sex, MRI scanner field strength, and the temporal interval between MRI and death, and results are reported using a voxel-wise threshold of p < 0.001, uncorrected.
Data availability
Neuropathologic data, demographic data, and MRI scans are available through the ADNI data repository, accessible free of cost after registration (adni.loni.usc.edu/data-samples/access-data). Volumetric measures of BF and hippocampus have been obtained from the MRI scans using established processing pipelines as described above. The anonymized volumetric measures containing ADNI cohort identifiers will be shared by request from any qualified investigator.
Results
Sample characteristics
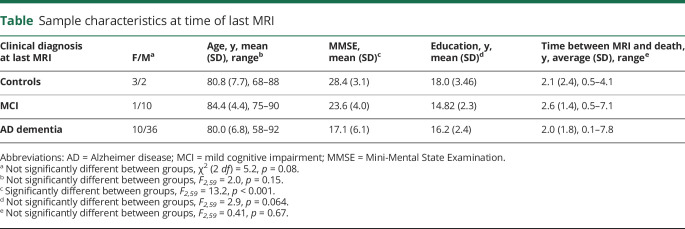
Two participants, one with a clinical diagnosis of AD dementia and one with a clinical diagnosis of MCI, were excluded from further analysis because the processing of their MRI scans yielded inaccurate segmentation, most likely due to the severe degree of atrophy. The remaining 62 participants had received the following clinical diagnoses at the time of their last MRI scan: 5 CN older participants (1 person reported SMCs), 11 participants with MCI, and 46 participants with AD dementia. Diagnostic groups did not differ significantly with respect to age, sex, education, or the temporal interval between MRI scan and death (on average 2.1 [SD 1.8] years; range 0.1–7.8 years). As expected, MMSE scores differed significantly between groups. The demographic details can be found in the table. Clinical diagnosis was significantly associated with BF and hippocampal (F2,59 > 3.1, p < 0.05) but not parahippocampal gyrus volumes. The significant effects were no longer preserved after controlling for age, sex, and MRI scanner field strength.
Table.
Sample characteristics at time of last MRI
Neuropathologic characteristics
With respect to neuropathologic scores in the selected brain regions, the NbM showed a high degree of NFT with a relatively low degree of neuritic plaques. Similarly, the parahippocampal gyrus had a high degree of NFT, but a low degree of neuronal loss and a moderate degree of neuritic plaques. The entorhinal cortex had a high degree of NFT, and a moderate to high degree of neuritic plaques and neuronal loss, whereas the dentate gyrus had a comparably low degree of NFT, neuritic plaques, and neuronal loss. Local α-synuclein and TDP-43 was detected only in a subgroup of cases, with TDP-43 being absent in the NbM (with the exception of a single case) and α-synuclein being absent in the dentate gyrus.
Associations between global neuropathologic scores and BF and MTL volumes
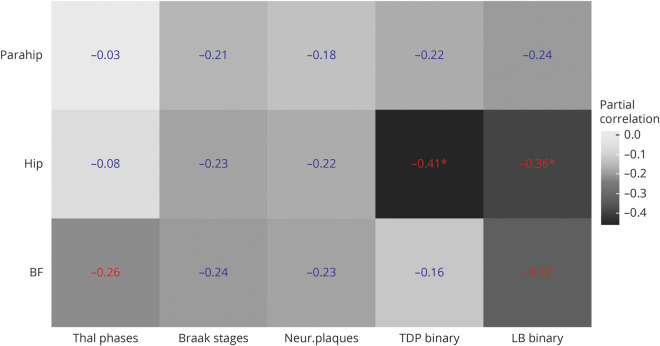
Detailed nuisance-controlled partial correlations between global neuropathologic scores and MRI volumes can be found in figure 1. Thal amyloid phases and presence of LB pathology were significantly associated with BF volume (r = −0.26 [95% confidence interval (CI) −0.49 to −0.01] and r = −0.32 [95% CI −0.54 to −0.06], respectively), but effects were not significant after FDR correction. Braak tangle stages and CERAD score for neuritic plaques were not significantly associated with BF or MTL volumes. Presence of TDP-43 and LB pathology were significantly associated with hippocampal volume (r = −0.41 [−0.61 to −0.17] and r = −0.36 [−0.57 to −0.11]), both surviving FDR correction at p < 0.05. Hippocampal sclerosis was only present in 5 cases (unilateral in 3 cases, laterality not assessed in 2 cases). The association between hippocampal volume and presence of TDP-43 pathology remained significant even after additionally controlling for the presence of hippocampal sclerosis (r = −0.35 [−0.56 to −0.10]).
Figure 1. Partial correlations between regional volumes and global neuropathologic scores.
Partial correlations between regional volumes and global neuropathologic scores, controlling for age, sex, and interval between MRI and death. Numbers in blue indicate nonsignificant effects, numbers in red indicate significant effects at a p value < 0.05, uncorrected for multiple comparisons, and numbers in red with an * indicate significant effects at a false discovery rate–corrected p value < 0.05. All volumes are normalized to the individual total intracranial volume. BF = basal forebrain volume according to ref. 4; Braak stages = Braak stages for neurofibrillary pathology; Hip = hippocampal volume according to ref. 22; LB binary = presence of Lewy body pathology (assessed according to dementia with Lewy bodies criteria as brainstem predominant, limbic, neocortical, amygdala predominant), yes/no; Neur. plaques = Consortium to Establish a Registry for Alzheimer’s Disease score for density of neocortical neuritic plaques; Parahip = parahippocampal gyrus from the Hammers atlas23; TDP binary = presence of TDP-43 pathology (assessed in the following regions: spinal cord, amygdala, hippocampus, entorhinal cortex, neocortical), yes/no; Thal phases = Thal phases for amyloid plaques.
Associations between regional neuropathologic scores and BF and MTL volumes
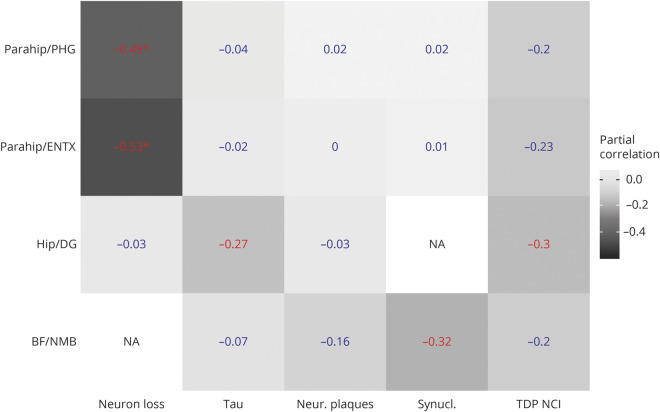
Detailed associations can be found in figure 2. BF volume was significantly associated with the degree of LB pathology in the NbM (r = −0.32 [95% CI −0.54 to −0.07]) and hippocampal volume was significantly correlated with dentate gyrus NFT (r = −0.27 [95% CI −0.49 to −0.01]) and TDP-43 scores (r = −0.30 [95% CI −0.52 to −0.04]). These effects were no longer significant after FDR correction. The parahippocampal gyrus volume (including the entorhinal cortex) was significantly associated with neuronal loss ratings in the entorhinal cortex (r = −0.53 [95% CI −0.69 to −0.31]) and parahippocampal gyrus (r = 0.49 [95% CI 0.67 to −0.26]), surviving FDR correction at p < 0.05.
Figure 2. Partial correlations between regional volumes and region-specific neuropathologic scores.
Partial correlations between regional volumes and neuropathologic scores within the brain ROIs, controlling for age, sex, scanner field strength, and temporal interval between MRI and death. Numbers in blue indicate nonsignificant effects, numbers in red indicate significant effects at a p value < 0.05, uncorrected for multiple comparisons, and numbers in red with an * indicate significant effects at a false discovery rate–corrected p value < 0.05. All volumes are normalized to the individual total intracranial volume. BF = basal forebrain volume according to ref. 4; Hip = hippocampal volume according to ref. 22; DG = dentate gyrus (autopsy region); ENTX = entorhinal cortex (autopsy region); NA = not assessed; NMB = nucleus basalis of Meynert (autopsy region); Neur. Plaques = neuritic plaques (0 [none] to 3 [≥20 per visual field]); Neuron loss = neuronal loss (0 [none] to 3 [severe]); Parahip = parahippocampal gyrus volume from the Hammers atlas23; PHG = parahippocampal gyrus (autopsy region); Synucl. = Lewy bodies (α-synuclein–positive inclusions) (0 [none] to 3 [>10 or numerous LB inclusions per ×10 field]); Tau = neurofibrillary tangles (0 [none] to 3 [≥20 per visual field]); TDP NCI = TDP-43 immunoreactive neuronal cytoplasmatic inclusions (0 [none] to 3 [>10 or numerous TDP-43 inclusions per ×10 field]).
Neuropathologic scores and whole brain GM analysis
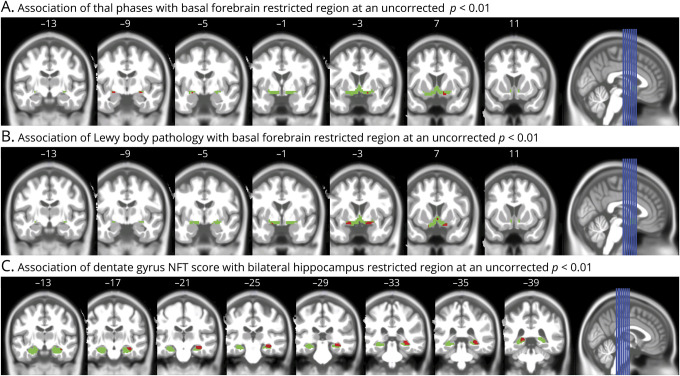
In voxel-based regression analyses across the whole brain, controlling for age, sex, TIV, and interval between MRI and death, presence of LB pathology was associated with reduced GM volume in anterior cingulate GM and lateral temporal and insular cortex at p < 0.001. Presence of TDP-43 pathology (vs no TDP-43 pathology) was associated with reduced GM volume in left and right hippocampus (figure 3). We found no significant voxel-wise effect of Thal phases on GM volumes at p < 0.001. However, in a spatially restricted analysis within the BF mask only and applying a more liberal threshold of p < 0.01, we found significant effects of both Thal phases and presence of LB pathology, but not of TDP-43, indicating consistent effects with the ROI analyses for this region (figure 4, A and B).
Figure 3. Presence of TDP-43 pathology and gray matter volume.
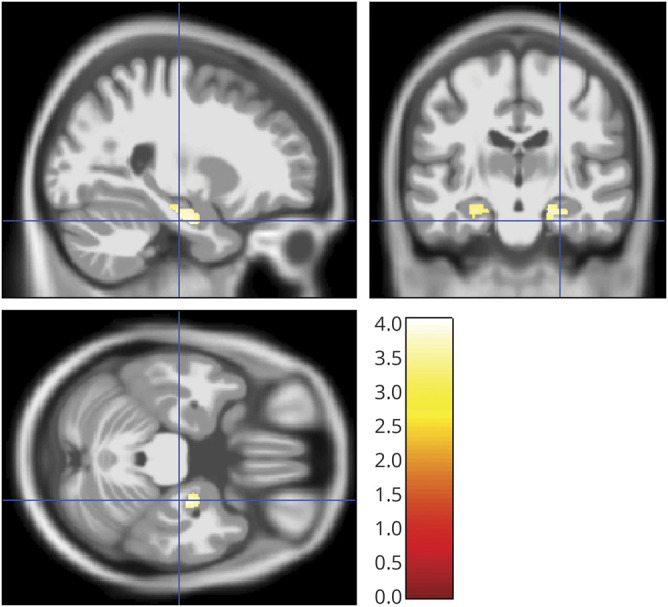
Sagittal, coronal, and axial view (right of image is right of brain) of clusters of at least 20 voxels surpassing a significance threshold of 0.001, uncorrected for multiple comparisons, for the effect of TDP-43 pathology (absent vs present) on gray matter volume, controlling for age, sex, total intracranial volume, and the temporal interval between MRI scan and death. The color bar in the right lower corner indicates the T values.
Figure 4. Association of neuropathologic scores with spatially restricted gray matter regions.
(A) Association of Thal phases with basal forebrain restricted region at an uncorrected p < 0.01. Coronal view (right of image is right of brain) of clusters of at least 5 voxels (red) surpassing a significance threshold of 0.01, uncorrected for multiple comparisons, for the effect of Thal phases within the basal forebrain search region (in green), controlling for age, sex, total intracranial volume (TIV), and the temporal interval between MRI scan and death. Numbers on the top indicate the y-coordinate in Montreal Neurological Institute (MNI) space (anterior posterior direction). (B) Association of Lewy body pathology with basal forebrain restricted region at an uncorrected p < 0.01. Coronal view (right of image is right of brain) of clusters of at least 5 voxels (red) surpassing a significance threshold of 0.01, uncorrected for multiple comparisons, for the effect of Lewy body pathology (absent vs present) within the basal forebrain search region (in green), controlling for age, sex, TIV, and the temporal interval between MRI scan and death. Numbers on the top indicate the y-coordinate in MNI space (anterior posterior direction). (C) Association of dentate gyrus neurofibrillary tangle (NFT) score with bilateral hippocampus restricted region at an uncorrected p < 0.01. Coronal view (right of image is right of brain) of clusters of at least 10 voxels (red) surpassing a significance threshold of 0.01, uncorrected for multiple comparisons, for the effect of dentate gyrus NFT score within the hippocampus search region (in green), controlling for age, sex, TIV, and the temporal interval between MRI scan and death. Numbers on the top indicate the y-coordinate in MNI space (anterior posterior direction).
In a complementary analysis,25 we did not find significant effects of Braak stages on GM volume at p < 0.001. Dentate gyrus NFT score showed no significant association with GM volumes at p < 0.001. Restricting the search region to the bilateral hippocampus and applying a more liberal threshold of p < 0.01, we found significant effects of dentate gyrus NFT score on bilateral posterior hippocampal volume, most pronounced in the right hippocampus (figure 4C). Entorhinal cortex neuron loss showed a significant association with reduced GM in extended MTL areas (figure 5), and very similar regional associations were observed for parahippocampal gyrus neuron loss (data not shown). Adding field strength of MRI scanner as additional covariate did not markedly alter the results.
Figure 5. Entorhinal cortex neuron loss and gray matter volume.
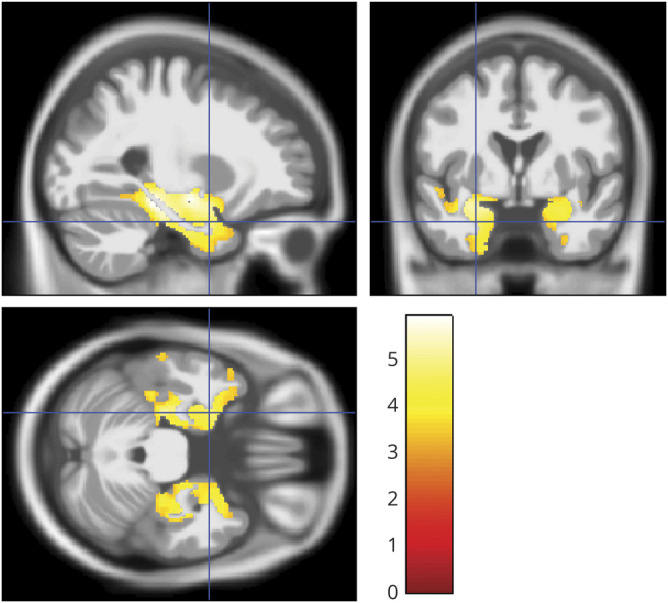
Sagittal, coronal, and axial view (right of image is right of brain) of clusters of at least 20 voxels surpassing a significance threshold of 0.001, uncorrected for multiple comparisons, for the effect of entorhinal cortex neuron loss on gray matter volume, controlling for age, sex, total intracranial volume, and the temporal interval between MRI scan and death. The color bar in the right lower corner indicates the T values.
Association of neuropathologic scores and neuropsychological measures
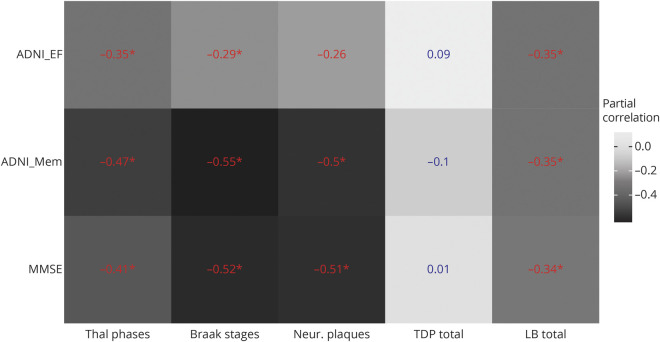
We found a significant association of the degree of LB pathology in the NbM with ADNI executive function score (r = −0.29 [95% CI −0.52 to −0.01]), but no effect on ADNI memory or MMSE score. NbM NFT scores were not correlated with any of the 3 cognitive measures. Thal amyloid phases, Braak stages, CERAD neuritic plaque scores, and presence of LB pathology were significantly associated with global cognition, memory, and executive function. Except for the association between CERAD neuritic plaque score and executive function, these effects were preserved after FDR correction. In contrast, presence of TDP-43 pathology was not significantly associated with any of the cognitive outcomes. Detailed results are shown in figure 6.
Figure 6. Partial correlations between cognitive measures and global neuropathologic scores.
Partial correlations between cognitive measures and global neuropathologic scores, controlling for age, sex, and the interval between cognitive testing and death. Numbers in blue indicate nonsignificant effects, numbers in red indicate significant effects at a p value < 0.05, uncorrected for multiple comparisons, and numbers in red with an * indicate significant effects at a false discovery rate–corrected p value < 0.05. ADNI_EF = ADNI composite executive function score; ADNI_Mem = ADNI composite memory score; Braak stages = Braak stages for neurofibrillary pathology; LB total = presence of Lewy body pathology (assessed according to dementia with Lewy bodies criteria as brainstem predominant, limbic, neocortical, amygdala predominant), yes/no; MMSE = Mini-Mental State Examination; Neur. plaques = Consortium to Establish a Registry for Alzheimer’s Disease score for density of neocortical neuritic plaques; TDP total = presence of TDP-43 pathology (assessed in the following regions: spinal cord, amygdala, hippocampus, entorhinal cortex, neocortical), yes/no; Thal phases = Thal phases for amyloid plaques.
Discussion
At an uncorrected level of significance, Thal amyloid phases were associated with BF volume. At the same time, the NbM itself exhibited very little neuritic plaques. Thus the degree of atrophy of the NbM was associated with amyloid pathology in cortical areas, but not with plaque load in the NbM itself. This agrees with postmortem studies that showed distinct associations between cholinergic system degeneration and accumulation of cortical amyloid pathology.12 Similarly, in vivo studies could also demonstrate a regionally focused association of cortical amyloid accumulation with BF volume using amyloid-sensitive PET imaging and MRI-measured BF volume.13,14 Together, these findings suggest that BF atrophy on MRI associates with remote cortical amyloid pathology rather than amyloid load within the BF itself, which could reflect neurotoxic effects of cortical amyloid pathology mediated by uptake of β-amyloid proteins into cholinergic nerve terminals or a disruption of nerve growth factor signaling.8,26 In another chain of events, findings from experimental animal studies suggest that cholinergic degeneration may contribute to increased accumulation of cortical amyloid pathology due to altered amyloid processing and clearance mechanisms subserved by cholinergic signaling.27 Future in vivo studies assessing the respective biomarkers longitudinally may help to gain more insight into the directionality of the interactions between cholinergic BF atrophy and cortical amyloid pathology in the human brain.
BF volume was also related to the general presence of LB pathology as well as to the degree of LB pathology in the NbM. One reason for the strong effect of LB pathology may be its high prevalence in the current cohort, where 31% of cases exhibited neocortical and 19% limbic predominant LB pathology, consistent with the reportedly high comorbidity of AD and LB pathology.28 In a combined analysis, the effect of NbM LB pathology on BF volume rendered the effect of Thal phases nonsignificant (supplementary data available from Dryad, doi.org/10.5061/dryad.dfn2z34x6), suggesting a stronger association of LB pathology than cortical amyloid pathology with BF volume decline.
Of note, none of the associations between neuropathologic lesions and BF volume survived FDR correction. This indicates only moderate effect sizes and some risk of false-positive findings. Therefore, in the absence of previous studies on neuropathologic correlates of BF atrophy, these findings require independent confirmation.
BF volume was not associated with NFT load in the NbM. NFTs have been found to occur already at Braak stage I in the BF cholinergic neurons,29 and NFT pathology in the NbM was found already in persons without dementia in their third decade of life, followed by increasing morphologic alterations of axons and cellular tangles preceding neuronal loss.30 In agreement with the early build-up of NFT pathology in the NbM in previous studies, 70% of our cases had semiquantitative ratings indicating moderate to severe NFT pathology in the NbM. Thus, the limited variation in NFT levels may have obscured possible associations between NbM NFT load and BF volume. BF neuron loss is consistently being found in advanced stages of AD, but evidence points to dystrophic shrinkage and dysfunction of cholinergic neurons rather than to a significant reduction of cholinergic neuron numbers in the BF in prodromal and early AD stages.31 In the current study, we could not specifically analyze associations between BF volume and cholinergic cell loss as the available neuropathologic sampling of the NbM did not differentiate between cholinergic and noncholinergic neurons.
Presence of LB pathology was associated with worse cognitive performance, and the degree of LB pathology in the NbM was specifically associated with executive dysfunction. This agrees with the role of cholinergic BF integrity for executive function found in clinical studies.
In contrast to the BF, hippocampal and parahippocampal gyrus atrophy was not associated with Thal amyloid phases. Thal phases include both diffuse and dense neuritic plaques, and previous studies found no association of diffuse plaques with total brain32 or hippocampal33 volumes. Thal phases were also not found to correlate with antemortem cognition.34 However, even CERAD score for density of neuritic plaques was not associated with hippocampal or parahippocampal gyrus volumes in our study, different from previous studies that reported associations of neuritic plaques with whole brain and MTL volumes.2 Our current findings, however, agree with findings from in vivo neuroimaging studies reporting a lack of association between PET-measured cortical amyloid load and hippocampal atrophy.13,14
Consistent with one previous study using antemortem MRI35 and several studies using postmortem MRI,36,37 we found a significant association between neuronal loss ratings in MTL regions and MTL volumes, both using ROI and voxel-based analyses. In addition, NFT score in the dentate gyrus was significantly associated with hippocampal volume. Significant associations of NFTs with hippocampal volume agree with previous studies.25,38 However, both presence of TDP-43 pathology in any location and the degree of TDP-43 pathology in the dentate gyrus were associated with MTL volumes as well, in agreement with earlier reports.39 Interestingly, the association with TDP-43 pathology even remained when controlling for hippocampal sclerosis and Braak tau stages, and additional voxel-based analysis revealed that the effect of TDP-43 was regionally specific for the bilateral hippocampus. The effect of TDP-43 was only reduced when accounting for local NFT load in the dentate gyrus. This finding agrees with a central role of comorbid TDP-43 pathology for hippocampal atrophy within the AD spectrum.40,41 In contrast, we did not find an association of TDP-43 pathology with BF atrophy in our study. In fact, there was only a single patient in our cohort who exhibited TDP-43 pathology in the NbM, and interestingly this patient also had hippocampal sclerosis. TDP-43 pathology in the BF has recently been reported to accompany hippocampal sclerosis, but not AD or other neurodegenerative diseases.11 In the current cohort, TDP-43 pathology was present at least to a mild extent in 37% of cases, which agrees with the prevalence of TDP-43 in previous studies, ranging between 33% and 52% in cases with AD pathology.40,42–44 Also consistent with these previous studies, the regional distribution of TDP-43 inclusions in the current sample was almost exclusively focused on MTL regions, including hippocampus, entorhinal cortex, and amygdala, and only 6 patients had neocortical TDP-43 inclusions in addition to MTL involvement. These data underscore the strong association of regional distribution of TDP-43 inclusions with the regional pattern of brain atrophy, consistent with previous reports on amygdala and hippocampal involvement with TDP-43 pathology45 and the current discussion on limbic predominant TDP-43 pathology in older individuals that has recently been termed limbic-predominant age-related TDP-43 encephalopathy (LATE).46
Braak stages had no significant effects in the ROI- or voxel-based analyses. A previous voxel-based analysis found a significant difference in the degree of atrophy between Braak V/VI stages and Braak 0–II stages, but not between Braak III/IV stages and Braak 0–II stages.25 Different from this previous study, we could not find a significant difference in degree of atrophy between Braak V/VI vs Braak 0–II stages. We cannot explain this discrepancy. The number of participants within the different stages was comparable between the previous (n = 20 Braak 0–II and n = 59 Braak V–VI) and our study (n = 16 Braak 0–II and n = 43 Braak V–VI). Different from the previous study, we also controlled for the temporal interval between MRI and death. However, even when we removed this covariate we still did not find robust effects.
Our study has strengths and limitations. One major limitation is the lack of assessment of CA1 neuron loss in the ADNI autopsy data that hindered a comprehensive evaluation of the role of CA1 degeneration, which was found to be a key driver of hippocampal atrophy in previous studies.35 However, according to neuropathologic Braak staging, neurofibrillary degeneration of CA1 and the entorhinal cortex should be highly collinear. Another limitation is that the pathologic assessment of the NbM was only sampled from a single coronal section at the level of the crossing of the anterior commissure and did not selectively assess cholinergic neurons, preventing any inference on specific subsections of the NbM. A further limitation was the quality of the MRI scans. Due to the advanced stage of disease in this autopsy cohort, some of the cases exhibited severe brain atrophy, which can affect the quality of brain segmentation. This led to the exclusion of 2 of the 64 cases from the analysis due to insufficient scan quality for brain segmentation. Finally, the overrepresentation of men in the current cohort limits its translational value to aged cohorts where women are known to predominate.
A strength of our study is the regional assessment of neuropathology–brain volume associations, including standardized global neuropathologic rating scales and detailed local assessments of neuropathology within our target regions as well as ROI-based and complementary voxel-wise analyses of GM volume. Particularly, specific regional assessments of NbM pathology had not been examined yet in neuropathology–imaging correlation studies. Voxel-based analysis has only been used in a few previous studies on associations between MRI volumes and quantitative neuropathologic features25,39,47,48 or pathologically confirmed diagnoses.49,50 Here, we complemented our primary analyses focused on BF and MTL ROIs with a comprehensive voxel-wise search for associations of AD and non-AD neuropathologic features with brain-wide GM volume reductions.
The current findings confirm previous evidence for an association of BF volume with deposition of amyloid in cortical association areas,13,14 representing input areas of cholinergic projections. At the same time, LB pathology, but not NFT pathology, was associated with BF atrophy, pointing to the high relevance of pathologic comorbidity for the expression of regional atrophy in the AD spectrum. The validity of these findings is supported by the robust replication of previous reports on the association of TDP-43 pathology with hippocampal atrophy in AD cases.43 The question of traceability of a biomarker linking the in vivo measured marker with the neuropathologic reference standard is of high relevance for the AD field to enhance our ability to identify treatment targets and measure target engagement with valid biomarkers.
Acknowledgment
M.J.G. is supported by the “Miguel Servet” program [CP19/00031] of the Spanish Instituto de Salud Carlos III (ISCIII-FEDER). The authors thank Manuela Neumann, Department of Neuropathology of the University Medicine Tübingen, Germany, for discussions.
Glossary
- AD
Alzheimer disease
- ADNI
Alzheimer's Disease Neuroimaging Initiative
- BF
basal forebrain
- CDR
Clinical Dementia Rating
- CERAD
Consortium to Establish a Registry for Alzheimer's Disease
- CI
confidence interval
- CN
cognitively normal
- FDR
false discovery rate
- GM
gray matter
- LB
Lewy body
- MCI
mild cognitive impairment
- MMSE
Mini-Mental State Examination
- MNI
Montreal Neurological Institute
- MPRAGE
magnetization-prepared rapid gradient echo
- MTL
medial temporal lobe
- NFT
neurofibrillary tangle
- NbM
nucleus basalis Meynert
- ROI
region of interest
- SMC
subjective memory concern
- TIV
total intracranial volume
- WM
white matter
Appendix 1. Authors
Appendix 2. Coinvestigators

Study funding
Data collection and sharing for this project was funded by the Alzheimer's Disease Neuroimaging Initiative (ADNI) (NIH grant U01 AG024904) and DOD ADNI (Department of Defense award number W81XWH-12-2-0012). ADNI is funded by the National Institute on Aging, the National Institute of Biomedical Imaging and Bioengineering, and through contributions from the following: Alzheimer's Association; Alzheimer's Drug Discovery Foundation; Araclon Biotech; BioClinica, Inc.; Biogen Idec Inc.; Bristol-Myers Squibb Company; Eisai Inc.; Elan Pharmaceuticals, Inc.; Eli Lilly and Company; EuroImmun; F. Hoffmann-La Roche Ltd. and its affiliated company Genentech, Inc.; Fujirebio; GE Healthcare; IXICO Ltd.; Janssen Alzheimer Immunotherapy Research & Development, LLC; Johnson & Johnson Pharmaceutical Research & Development LLC; Medpace, Inc.; Merck & Co., Inc.; Meso Scale Diagnostics, LLC; NeuroRx Research; Neurotrack Technologies; Novartis Pharmaceuticals Corporation; Pfizer Inc.; Piramal Imaging; Servier; Synarc Inc.; and Takeda Pharmaceutical Company. The Canadian Institutes of Health Research is providing funds to support ADNI clinical sites in Canada. Private sector contributions are facilitated by the Foundation for the National Institutes of Health (fnih.org). The grantee organization is the Northern California Institute for Research and Education, and the study is coordinated by the Alzheimer's Disease Cooperative Study at the University of California, San Diego. ADNI data are disseminated by the Laboratory for Neuro Imaging at the University of Southern California.
Disclosure
The authors report no disclosures relevant to the manuscript. Go to Neurology.org/N for full disclosures.
References
- 1.Dubois B, Feldman HH, Jacova C, et al. Advancing research diagnostic criteria for Alzheimer's disease: the IWG-2 criteria. Lancet Neurol 2014;13:614–629. [DOI] [PubMed] [Google Scholar]
- 2.Dallaire-Theroux C, Callahan BL, Potvin O, Saikali S, Duchesne S. Radiological-pathological correlation in Alzheimer's disease: systematic review of antemortem magnetic resonance imaging findings. J Alzheimers Dis 2017;57:575–601. [DOI] [PubMed] [Google Scholar]
- 3.Bohnen NI, Grothe MJ, Ray NJ, Muller M, Teipel SJ. Recent advances in cholinergic imaging and cognitive decline: revisiting the cholinergic hypothesis of dementia. Curr Geriatr Rep 2018;7:1–11. [DOI] [PMC free article] [PubMed] [Google Scholar]
- 4.Kilimann I, Grothe M, Heinsen H, et al. Subregional basal forebrain atrophy in Alzheimer's disease: a multicenter study. J Alzheimers Dis 2014;40:687–700. [DOI] [PMC free article] [PubMed] [Google Scholar]
- 5.Grothe M, Heinsen H, Teipel SJ. Atrophy of the cholinergic basal forebrain over the adult age range and in early stages of Alzheimer's disease. Biol Psychiatry 2012;71:805–813. [DOI] [PMC free article] [PubMed] [Google Scholar]
- 6.Mesulam MM. The systems-level organization of cholinergic innervation in the human cerebral cortex and its alterations in Alzheimer's disease. Prog Brain Res 1996;109:285–297. [DOI] [PubMed] [Google Scholar]
- 7.Schmitz TW, Nathan Spreng R; Alzheimer's Disease Neuroimaging Initiative. Basal forebrain degeneration precedes and predicts the cortical spread of Alzheimer's pathology. Nat Commun 2016;7:13249. [DOI] [PMC free article] [PubMed] [Google Scholar]
- 8.Mufson EJ, Ginsberg SD, Ikonomovic MD, DeKosky ST. Human cholinergic basal forebrain: chemoanatomy and neurologic dysfunction. J Chem Neuroanat 2003;26:233–242. [DOI] [PubMed] [Google Scholar]
- 9.Mesulam M. Cholinergic aspects of aging and Alzheimer's disease. Biol Psychiatry 2012;71:760–761. [DOI] [PMC free article] [PubMed] [Google Scholar]
- 10.Liu AK, Chang RC, Pearce RK, Gentleman SM. Nucleus basalis of Meynert revisited: anatomy, history and differential involvement in Alzheimer's and Parkinson's disease. Acta Neuropathol 2015;129:527–540. [DOI] [PMC free article] [PubMed] [Google Scholar]
- 11.Cykowski MD, Takei H, Van Eldik LJ, et al. Hippocampal sclerosis but not normal aging or Alzheimer disease is associated with TDP-43 pathology in the basal forebrain of aged persons. J Neuropathol Exp Neurol 2016;75:397–407. [DOI] [PMC free article] [PubMed] [Google Scholar]
- 12.Potter PE, Rauschkolb PK, Pandya Y, et al. Pre- and post-synaptic cortical cholinergic deficits are proportional to amyloid plaque presence and density at preclinical stages of Alzheimer's disease. Acta Neuropathol 2011;122:49–60. [DOI] [PMC free article] [PubMed] [Google Scholar]
- 13.Grothe MJ, Ewers M, Krause B, Heinsen H, Teipel SJ; Alzheimer's Disease Neuroimaging Initiative. Basal forebrain atrophy and cortical amyloid deposition in nondemented elderly subjects. Alzheimers Dement 2014;10:S344–S353. [DOI] [PMC free article] [PubMed] [Google Scholar]
- 14.Kerbler GM, Fripp J, Rowe CC, et al. Basal forebrain atrophy correlates with amyloid beta burden in Alzheimer's disease. Neuroimage Clin 2015;7:105–113. [DOI] [PMC free article] [PubMed] [Google Scholar]
- 15.McKhann G, Drachman D, Folstein M, Katzman R, Price D, Stadlan EM. Clinical diagnosis of Alzheimer's disease: report of the NINCDS-ADRDA Work Group under the auspices of the Department of Health and Human Services Task Force on Alzheimer's disease. Neurology 1984;34:939–944. [DOI] [PubMed] [Google Scholar]
- 16.Franklin EE, Perrin RJ, Vincent B, et al. Brain collection, standardized neuropathologic assessment, and comorbidity in Alzheimer's Disease Neuroimaging Initiative 2 participants. Alzheimers Dement 2015;11:815–822. [DOI] [PMC free article] [PubMed] [Google Scholar]
- 17.Montine TJ, Phelps CH, Beach TG, et al. National Institute on Aging-Alzheimer's Association guidelines for the neuropathologic assessment of Alzheimer's disease: a practical approach. Acta Neuropathol 2012;123:1–11. [DOI] [PMC free article] [PubMed] [Google Scholar]
- 18.Folstein MF, Folstein SE, McHugh PR. Mini-mental-state: a practical method for grading the cognitive state of patients for the clinician. J Psychiatr Res 1975;12:189–198. [DOI] [PubMed] [Google Scholar]
- 19.Crane PK, Carle A, Gibbons LE, et al. Development and assessment of a composite score for memory in the Alzheimer's Disease Neuroimaging Initiative (ADNI). Brain Imaging Behav 2012;6:502–516. [DOI] [PMC free article] [PubMed] [Google Scholar]
- 20.Gibbons LE, Carle AC, Mackin RS, et al. A composite score for executive functioning, validated in Alzheimer's Disease Neuroimaging Initiative (ADNI) participants with baseline mild cognitive impairment. Brain Imaging Behav 2012;6:517–527. [DOI] [PMC free article] [PubMed] [Google Scholar]
- 21.Ashburner J. A fast diffeomorphic image registration algorithm. NeuroImage 2007;38:95–113. [DOI] [PubMed] [Google Scholar]
- 22.Wolf D, Bocchetta M, Preboske GM, Boccardi M, Grothe MJ; Alzheimer's Disease Neuroimaging Initiative. Reference standard space hippocampus labels according to the EADC-ADNI harmonized protocol: utility in automated volumetry. Alzheimers Dement 2017;13:893–902. [DOI] [PubMed] [Google Scholar]
- 23.Hammers A, Allom R, Koepp MJ, et al. Three-dimensional maximum probability atlas of the human brain, with particular reference to the temporal lobe. Hum Brain Mapp 2003;19:224–247. [DOI] [PMC free article] [PubMed] [Google Scholar]
- 24.Benjamini Y, Hochberg Y. Controlling the false discovery rate: a practical and powerful approach to multiple testing. J Roy Stat Soc B Met 1995;57:289–300. [Google Scholar]
- 25.Whitwell JL, Josephs KA, Murray ME, et al. MRI correlates of neurofibrillary tangle pathology at autopsy: a voxel-based morphometry study. Neurology 2008;71:743–749. [DOI] [PMC free article] [PubMed] [Google Scholar]
- 26.Baker-Nigh A, Vahedi S, Davis EG, et al. Neuronal amyloid-beta accumulation within cholinergic basal forebrain in ageing and Alzheimer's disease. Brain 2015;138:1722–1737. [DOI] [PMC free article] [PubMed] [Google Scholar]
- 27.Kolisnyk B, Al-Onaizi M, Soreq L, et al. Cholinergic surveillance over hippocampal RNA metabolism and Alzheimer's-like pathology. Cereb Cortex 2017;27:3553–3567. [DOI] [PubMed] [Google Scholar]
- 28.Brenowitz WD, Keene CD, Hawes SE, et al. Alzheimer's disease neuropathologic change, Lewy body disease, and vascular brain injury in clinic- and community-based samples. Neurobiol Aging 2017;53:83–92. [DOI] [PMC free article] [PubMed] [Google Scholar]
- 29.Mesulam M, Shaw P, Mash D, Weintraub S. Cholinergic nucleus basalis tauopathy emerges early in the aging-MCI-AD continuum. Ann Neurol 2004;55:815–828. [DOI] [PubMed] [Google Scholar]
- 30.Geula C, Nagykery N, Nicholas A, Wu CK. Cholinergic neuronal and axonal abnormalities are present early in aging and in Alzheimer disease. J Neuropathol Exp Neurol 2008;67:309–318. [DOI] [PMC free article] [PubMed] [Google Scholar]
- 31.Mufson EJ, Ikonomovic MD, Counts SE, et al. Molecular and cellular pathophysiology of preclinical Alzheimer's disease. Behav Brain Res 2016;311:54–69. [DOI] [PMC free article] [PubMed] [Google Scholar]
- 32.Silbert LC, Quinn JF, Moore MM, et al. Changes in premorbid brain volume predict Alzheimer's disease pathology. Neurology 2003;61:487–492. [DOI] [PubMed] [Google Scholar]
- 33.Csernansky JG, Hamstra J, Wang L, et al. Correlations between antemortem hippocampal volume and postmortem neuropathology in AD subjects. Alzheimer Dis Assoc Disord 2004;18:190–195. [PubMed] [Google Scholar]
- 34.Serrano-Pozo A, Qian J, Muzikansky A, et al. Thal amyloid stages do not significantly impact the correlation between neuropathological change and cognition in the Alzheimer disease continuum. J Neuropathol Exp Neurol 2016;75:516–526. [DOI] [PMC free article] [PubMed] [Google Scholar]
- 35.Zarow C, Vinters HV, Ellis WG, et al. Correlates of hippocampal neuron number in Alzheimer's disease and ischemic vascular dementia. Ann Neurol 2005;57:896–903. [DOI] [PMC free article] [PubMed] [Google Scholar]
- 36.Apostolova LG, Zarow C, Biado K, et al. Relationship between hippocampal atrophy and neuropathology markers: a 7T MRI validation study of the EADC-ADNI Harmonized Hippocampal Segmentation Protocol. Alzheimers Dement 2015;11:139–150. [DOI] [PMC free article] [PubMed] [Google Scholar]
- 37.Bobinski M, de Leon MJ, Wegiel J, et al. The histological validation of post mortem magnetic resonance imaging-determined hippocampal volume in Alzheimer's disease. Neuroscience 2000;95:721–725. [DOI] [PubMed] [Google Scholar]
- 38.Thaker AA, Weinberg BD, Dillon WP, et al. Entorhinal cortex: antemortem cortical thickness and postmortem neurofibrillary tangles and amyloid pathology. AJNR Am J Neuroradiol 2017;38:961–965. [DOI] [PMC free article] [PubMed] [Google Scholar]
- 39.Josephs KA, Whitwell JL, Weigand SD, et al. TDP-43 is a key player in the clinical features associated with Alzheimer's disease. Acta Neuropathol 2014;127:811–824. [DOI] [PMC free article] [PubMed] [Google Scholar]
- 40.Robinson AC, Davidson YS, Horan MA, Pendleton N, Mann DMA. Pathological correlates of cognitive impairment in the University of Manchester Longitudinal Study of cognition in normal healthy old age. J Alzheimers Dis 2018;64:483–496. [DOI] [PubMed] [Google Scholar]
- 41.Josephs KA, Whitwell JL, Tosakulwong N, et al. TAR DNA-binding protein 43 and pathological subtype of Alzheimer's disease impact clinical features. Ann Neurol 2015;78:697–709. [DOI] [PMC free article] [PubMed] [Google Scholar]
- 42.James BD, Wilson RS, Boyle PA, Trojanowski JQ, Bennett DA, Schneider JA. TDP-43 stage, mixed pathologies, and clinical Alzheimer's-type dementia. Brain 2016;139:2983–2993. [DOI] [PMC free article] [PubMed] [Google Scholar]
- 43.Josephs KA, Dickson DW, Tosakulwong N, et al. Rates of hippocampal atrophy and presence of post-mortem TDP-43 in patients with Alzheimer's disease: a longitudinal retrospective study. Lancet Neurol 2017;16:917–924. [DOI] [PMC free article] [PubMed] [Google Scholar]
- 44.Ihara R, Vincent BD, Baxter MR, et al. Relative neuron loss in hippocampal sclerosis of aging and Alzheimer's disease. Ann Neurol 2018;84:741–753. [DOI] [PMC free article] [PubMed] [Google Scholar]
- 45.Makkinejad N, Schneider JA, Yu J, et al. Associations of amygdala volume and shape with transactive response DNA-binding protein 43 (TDP-43) pathology in a community cohort of older adults. Neurobiol Aging 2019;77:104–111. [DOI] [PMC free article] [PubMed] [Google Scholar]
- 46.Nelson PT, Dickson DW, Trojanowski JQ, et al. Limbic-predominant age-related TDP-43 encephalopathy (LATE): consensus working group report. Brain 2019;142:1503–1527. [DOI] [PMC free article] [PubMed] [Google Scholar]
- 47.Kantarci K, Murray ME, Schwarz CG, et al. White-matter integrity on DTI and the pathologic staging of Alzheimer's disease. Neurobiol Aging 2017;56:172–179. [DOI] [PMC free article] [PubMed] [Google Scholar]
- 48.Josephs KA, Whitwell JL, Knopman DS, et al. Abnormal TDP-43 immunoreactivity in AD modifies clinicopathologic and radiologic phenotype. Neurology 2008;70:1850–1857. [DOI] [PMC free article] [PubMed] [Google Scholar]
- 49.Hornberger M, Wong S, Tan R, et al. In vivo and post-mortem memory circuit integrity in frontotemporal dementia and Alzheimer's disease. Brain 2012;135:3015–3025. [DOI] [PubMed] [Google Scholar]
- 50.Harper L, Bouwman F, Burton EJ, et al. Patterns of atrophy in pathologically confirmed dementias: a voxelwise analysis. J Neurol Neurosurg Psychiatry 2017;88:908–916. [DOI] [PMC free article] [PubMed] [Google Scholar]
Associated Data
This section collects any data citations, data availability statements, or supplementary materials included in this article.
Data Availability Statement
Neuropathologic data, demographic data, and MRI scans are available through the ADNI data repository, accessible free of cost after registration (adni.loni.usc.edu/data-samples/access-data). Volumetric measures of BF and hippocampus have been obtained from the MRI scans using established processing pipelines as described above. The anonymized volumetric measures containing ADNI cohort identifiers will be shared by request from any qualified investigator.


