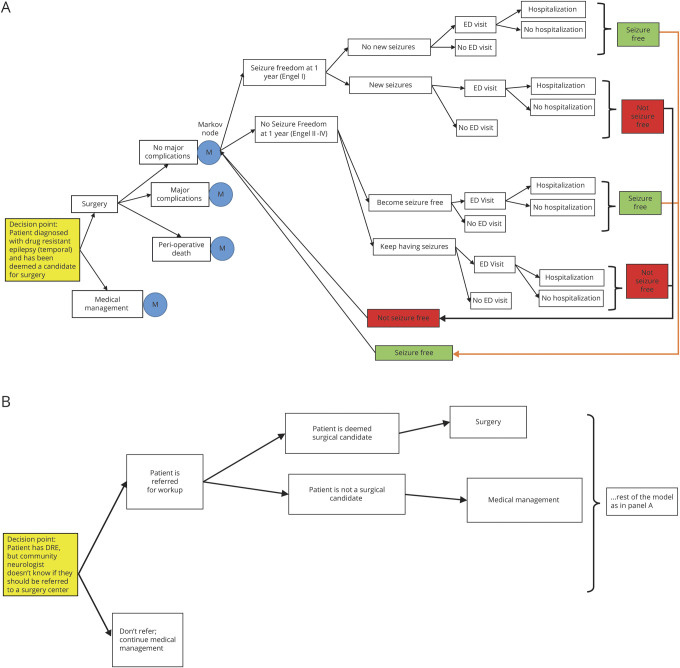
Figure 1. Diagram of Markov decision-analytic model used for primary analysis (model 1).
Illustration of the primary and secondary models developed to study cost-effectiveness. (A) Diagram shows the structure of the decision-analytic model used for cost-effectiveness analysis in patients with DR-TLE deemed to be surgical candidates. The M nodes represent Markov nodes that are built into the decision tree, allowing the creation of iterative loops (1-year cycles) during which patients can transition between health states. The 3 health states are seizure-free, having seizures, and dead (not shown). Each branch of the tree is annotated with an average estimate and a probability distribution, allowing probabilistic sensitivity analysis (Monte Carlo simulations). (B) Diagram of the decision-analytic model used for secondary analysis (model 2). The decision-analytic model was restructured as shown in this diagram in order to conduct the secondary analysis (evaluating whether referral for surgical evaluation is a cost-effective strategy). DRE = drug-resistant epilepsy; ED = emergency department.

