

Abstract
Purpose
COVID-19 raises D-dimer (DD) levels even in the absence of pulmonary embolism (PE), resulting in an increase in computed tomography pulmonary angiogram (CTPA) requests. Our purpose is to determine whether there are differences between DD values in PE-positive and PE-negative COVID-19 patients and, if so, to establish a new cutoff value which accurately determines when a CTPA is needed.
Methods
This study retrospectively analyzed all COVID-19 patients who underwent a CTPA due to suspected PE between March 1 and April 30, 2020, at Ramón y Cajal University Hospital, Madrid (Spain). DD level comparisons between PE-positive and PE-negative groups were made using Student’s t test. The optimal DD cutoff value to predict PE risk in COVID-19 patients was calculated in the ROC curve.
Results
Two hundred forty-two patients were included in the study. One hundred fifty-one (62%) were men and the median age was 68 years (IQR 55–78). An increase of DD (median 3260; IQR 1203–9625 ng/mL) was detected in 205/242 (96%) patients. 73/242 (30%) of the patients were diagnosed with PE on CTPA. The DD median value was significantly higher (p < .001) in the PE-positive group (7872, IQR 3150–22,494 ng/mL) compared with the PE-negative group (2009, IQR 5675–15,705 ng/mL). The optimal cutoff value for DD to predict PE was 2903 ng/mL (AUC was 0.76 [CI 95% 0.69–0.83], sensitivity 81%). The overall mortality rate was 16% (39/242).
Conclusion
A higher threshold (2903 ng/mL) for D-dimer could predict the risk of PE in COVID-19 patients with a sensitivity of 81%.
Keywords: COVID-19, Pulmonary embolism, Computed tomography pulmonary angiogram, D-dimer, Retrospective study
Introduction
A viral disease caused by the novel coronavirus SARS-CoV-2 (severe acute respiratory syndrome coronavirus 2) emerged in December 2019 in Wuhan, China, and spread globally in the initial months of 2020. Spain has been one of the most affected countries during the initial phases of the pandemic, with more than 230,000 cases (5.1% of worldwide number) and 27,000 deaths (9%) [1].
The main clinical manifestations of COVID-19 are not only pneumonia but also coagulation disorders [2, 3]. A prothrombotic state can occur due to endothelial damage and coagulation cascade activation and is possibly related to thromboembolic phenomena [4–8].
In this regard, COVID-19 has been shown to raise blood markers such as D-dimer (DD), which has been found to be significantly higher than in bacterial lung infection [9]. Likewise, a high risk of pulmonary embolism (PE) has been described in COVID-19 patients [10–17].
As a result, the DD role in PE risk estimation in COVID-19 patients has left both clinicians and radiologists facing a dilemma: on the one hand, dyspnea can be present in uncomplicated COVID-19 pneumonia as well as in PE; on the other hand, elevated DD values could be a normal finding in COVID-19 patients but they could also be a reflection of PE. This issue has led to a significant increase in computed tomography pulmonary angiogram (CTPA) requests in radiology departments.
Thus, the purpose of this study is to determine whether there are any differences between DD values in PE-positive and PE-negative COVID-19 patients and, if so, to establish a new cutoff value to help radiologists and clinicians more accurately determine when a CTPA is needed.
Materials and methods
This study was approved by the Research Ethics Committee of our hospital. The need for patient informed consent was waived because of its retrospective nature. Data was anonymized to avoid any identification risk.
Study design and participants
The study retrospectively included data from consecutive patients with COVID-19 diagnostic criteria (see the “Definitions” section) that underwent a CTPA due to PE clinical suspicion from March 1 to April 30, 2020, at our institution (Ramón y Cajal University Hospital, Madrid, Spain).
A total of 402 CTPA exams were performed during the study period. One hundred forty-seven CTPAs belonging to patients who did not meet COVID-19 diagnostic criteria were excluded. Thirteen patients with COVID-19 criteria underwent two CTPAs during the study period. For these 13 cases, only the second CTPA was included. A total of 242 patients were included in the final analysis. The selection algorithm is summarized in Fig. 1.
Fig. 1.
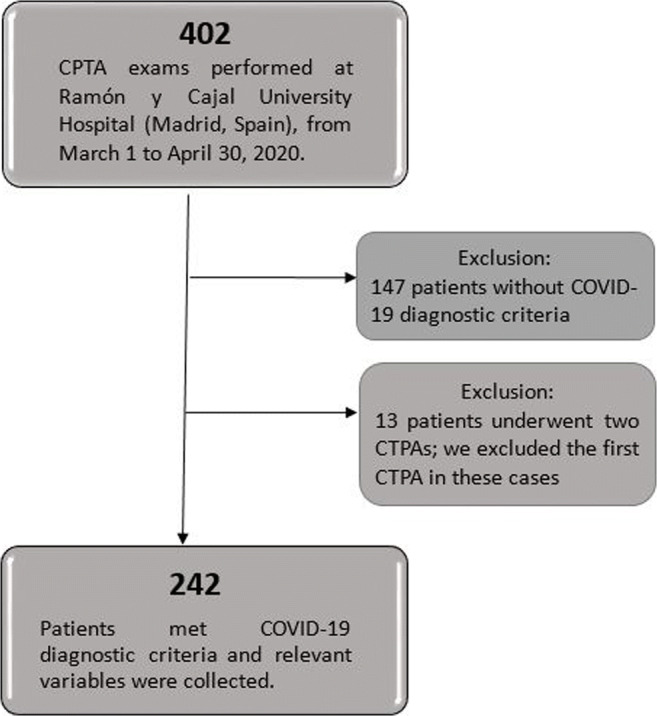
Flow diagram of the study participants. COVID-19, coronavirus disease 2019; CTPA, computed tomography pulmonary angiogram
Definitions
The main COVID-19 criterion was a positive result in RT-PCR (real-time reverse transcriptase-polymerase chain reaction) testing. However, since the reported sensitivity of RT-PCR is somewhat low [18–20], the combination of typical clinical, laboratory, and imaging (chest x-ray or CT) findings was also considered as COVID-19 criteria, provided that common bacterial and viral pathogens that cause pneumonia were excluded based on microbiological analysis [21].
Conditions which could cause a negative outcome such as chronic pulmonary diseases, high blood pressure, diabetes, dyslipidemia, immunosuppression by any cause, obesity, smoking habit, cancer, hepatic, cardiac, or renal chronic failure were included as comorbidities.
Several timepoints were defined, namely, the symptoms onset date, the emergency department arrival date, the CTPA date, and the death or discharge date.
Data collection
Epidemiological, demographic, laboratory, and outcome data was extracted from electronic medical records. The interval between CTPA exams and processing of laboratory data was less than 2 days in all cases. All data was evaluated by three physicians (AG, JQ, and MH) using a standardized collection form, and a fourth physician (SV) checked for any differences among the data collected by the three primary reviewers.
CTPA image acquisition
CTPA exams were performed on a 320-detector CT scanner (Aquilion One, Canon Medical Systems LTD, Otawara, Japan). The whole chest was craniocaudally scanned from the lung apex to the lowest hemidiaphragm in the supine position. All patients were instructed to hold their breath to minimize motion artifacts. To reach optimal intraluminal contrast enhancement, an automatic bolus-tracking technique using the pulmonary trunk as region of interest and a threshold of 100 HU was performed, with a fix time delay of 5 s to image acquisition. CTPA images were acquired during a single breath-hold. Two different protocols were used, depending on the hemodynamic conditions of the patient:
Helical CTPA: 40 mL of non-ionic iodinated contrast with a flow rate of 5 mL/s, use of central detectors and movement of the table, approximately 3 s duration and low radiation dose (2–3 mSv). This protocol was chosen in normal hemodynamic conditions.
Volumetric CTPA: 15–20 mL of non-ionic iodinated contrast with a flow rate of 5 mL/s, use of all (320) detectors allowing for 16 cm of body surface coverage, 350 ms duration and minimum radiation dose (< 1 mSv). This protocol was chosen if a rapid blood flow was presumed (young patients, tachycardia…).
The slice thickness was 0.5 mm. The image data was post-processed and transferred to the Picture Archiving and Communication System (PACS).
Image interpretation
PE radiological diagnosis was established as per recent guidelines [22, 23]. PE was classified according to laterality (unilateral or bilateral), most proximal affected artery (trunk, main, lobar, segmental, or subsegmental arteries), and location (right upper lobe, middle lobe, right lower lobe, left upper lobe, or left lower lobe). CT signs of right ventricle overload (right ventricular enlargement, flattening of the interventricular septum, and/or inferior vena caval contrast reflux) were also recorded.
A descriptive analysis of COVID-19 pulmonary radiological findings on CTPA was made (using both mediastinal and lung window settings). The presence and distribution of ground-glass opacities, consolidation, crazy-paving, reticular pattern, fibrotic-appearing changes (subpleural bands, bronchiectasis, bronchial and arterial architectural distortion, and honeycombing), and barotrauma signs were described. Pleural findings (thickening, retraction, or effusion) and lymphadenopathy were also recorded. Several findings could be described at the same time.
Statistical analysis
Continuous variables were presented as a median with an interquartile range (IQR). Categorical variables were described as a number and percentage (%).
Patient characteristics in the PE-positive or PE-negative groups along with the survivor and non-survivor groups were compared using Student’s t test, χ2 test, or Fisher’s exact test where appropriate, providing the 95% confidence interval (95% CI) and p value.
The optimal D-dimer cutoff point for PE was evaluated using ROC and AUC and expressed as sensitivity and specificity.
A two-sided α of less than 0.05 was considered statistically significant. Statistical analyses were done using IBM® SPSS® Statistics 25.0 (2020) software.
Results
Baseline characteristics of COVID-19 patients (Table 1)
Table 1.
Baseline characteristics of COVID-19 patients
| Variable | Value | |
|---|---|---|
| Patients: | 242 | |
| Basic demographics: | ||
| Age | 68 (IQR 55–78, range 29–96) years | |
| Sex | Male = 151 (62%) | |
| Female = 91 (38%) | ||
| Comorbidities: | 176 (73%) or 1.75 (0–3) | |
| Hypertension | 102 (42%) | |
| Dyslipidemia | 59 (24%) | |
| Diabetes | 44 (18%) | |
| Cancer | 24 (10%) | |
| Clinical timepoints: | ||
| Days of symptoms before admission | 7 (4–13) days | |
| Time from hospital admission to CTPA | 7 (1–16.5) days | |
| Length of stay | 18 (8–28) days | |
| Laboratory results: | Normal limits (SI) | |
| D-dimer (ng/mL) | 3260 (1203–9625) ng/mL | 0–500 ng/mL |
| White blood cell count (103/μL) | 10.2 (6.4–12.2) 103/μL | 4–11 103/μL |
| Lymphocytes (103/μL) | 2.11 (0.8–1.1) 103/μL | 1–4.5 103/μL |
| Neutrophils (103/μL) | 7.36 (4.2–10) 103/μL | 1.5–7.7 103/μL |
| Hemoglobin (g/dL) | 12.9 (11.5–14.5) g/dL | 13–17.5 g/dL |
| Platelet count (103/μL) | 255.6 (165.3–312) (103/μL) | 140–400 (103/μL) |
| Fibrinogen (mg/dL) | 514.8 (336–740) mg/dL | 150–400 mg/dL |
| CRP (mg/L) | 64.2 (4.7–96.5) mg/L | 0–5 mg/L |
| PE incidence: | PE-positive: 73 (30%) | |
| PE-negative: 169 (70%) | ||
| Main outcomes: | ||
| Discharged | 150 (62%) | |
| Hospitalized | 53 (22%) | |
| Non-survivors | 39 (16%) | |
Data are median (IQR) or n (%). In laboratory results, those parameters in italics were above normal limits. COVID-19, coronavirus disease 2019; CRP, C-reactive protein; CTPA, computed tomography pulmonary angiogram; PE, pulmonary embolism; SI, International System of Units
Two hundred forty-two patients were included in the final analysis. The median age was 68 years (IQR 55–78, range 29–96) and most patients were men 151/242 (62%).
Comorbidities
Comorbidities were present in nearly 73% (176/242) of the patients. The median of comorbidities per patient was 1.75 (0–3). The most common were hypertension (42%, 102/242), dyslipidemia (24%, 59/242), diabetes (18%, 44/242), and cancer (10%, 24/242). Chronic pulmonary diseases, immunosuppression by any cause, obesity, smoking habit, and hepatic, cardiac, or renal chronic failure were less commonly described in the electronic medical records.
Clinical timepoints
The median time from onset of COVID-19 symptoms to hospital admission was 7 days (IQR 4–13). The median time from admission to CTPA was 7 days (IQR 1–16.5). The median length of stay was 18 days (IQR 8–28).
Laboratory results
An elevated DD level (median 3260 ng/mL, IQR 1203–9625 ng/mL, normal laboratory ranges of < 500 ng/mL) was detected in 205/242 (96%) patients. It was also found that fibrinogen and CRP were above normal limits in most patients. White blood cell count, lymphocytes, neutrophils, hemoglobin, and platelet count were within normal limits.
PE incidence
73/242 (30%) patients were PE-positive and 169/242 (70%) were PE-negative. Of note, only in 5 PE-positive patients deep vein thrombosis (DVT) was documented.
Outcomes
150/242 patients (62%) were discharged, 39/242 patients (16%) died during hospitalization, and 53/242 patients (22%) remained hospitalized by the end of April.
Radiological findings (Table 2)
Table 2.
Radiological findings
| Variable | Value |
|---|---|
| COVID-19 (242) | |
| Opacities: | |
| GGO | 152 (62.8%) |
| Consolidation | 64 (26.4%) |
| Crazy paving | 57 (23.6%) |
| Reticular pattern | 57 (23.6%) |
| Distribution: | |
| Peripheral | 208 (86%) |
| Central | 34 (14%) |
| Laterality: | |
| Bilateral | 207 (85.5%) |
| Right/left lung | 10 (4.1%)/3 (1.2%) |
| Location: | |
| Diffuse | 162 (67%) |
| Upper/middle/lower lung field predominance | 15 (6.2%)/25 (10.3%)/48 (20%) |
| Other findings: | |
| Fibrotic appearance | 52 (21.5%) |
| Pleural effusion | 40 (16.5%) |
| Lymphadenopathy | 22 (9%) |
| Barotrauma signs | 10 (4.1%) |
| Pulmonary embolism (73) | |
| Laterality: | |
| Unilateral | 38 (52.1%) |
| Bilateral | 35 (47.9%) |
| Most proximal affected artery: | |
| Pulmonary artery trunk | 2 (2.7%) |
| Main pulmonary arteries | 8 (11%) |
| Lobar pulmonary arteries | 17 (23.3%) |
| Segmental pulmonary arteries | 36 (49.3%) |
| Subsegmental pulmonary arteries | 10 (13.7%) |
| Location: | |
| Right upper lobe | 27 (37%) |
| Middle lobe | 29 (39.7%) |
| Right lower lobe | 48 (67.1%) |
| Left upper lobe | 25 (34.3%) |
| Left lower lobe | 30 (41.1%) |
| Signs of right ventricle overload: | 15 (20.5%) |
Data is expressed in n (%). Findings could coexist. COVID-19, coronavirus disease 2019; GGO, ground-glass opacities; PE, pulmonary embolism
COVID-19 findings
Opacities
The main findings were ground-glass opacities (152/242, 62.8%), consolidation (64/242, 26.4%), crazy-paving pattern (57/242, 23.6%), and reticular pattern (57/242, 23.6%).
Distribution
The opacities were predominantly peripheral in 208/242 patients (86%) and predominantly central in 34/242 patients (14%).
Laterality
The opacities were bilateral in 207/242 patients (94%), and only 13/242 patients (5.9%) had unilateral involvement (right lung in 10/242 patients [4.5%] and left lung in 3/242 patients [1.4%]).
Location
The opacities were diffuse in most patients (162/242, 67%), whereas 48/242 patients (20%) had a lower lung field predominance, 25/242 patients (10.3%) had a middle-lung field predominance, and 15/242 patients (6.2%) had an upper-lung field predominance.
Other findings included fibrotic-appearing changes (52/242, 21.5%), pleural effusion (40/242, 16.5%), lymphadenopathy (22/242, 9%), and barotrauma signs (10/242, 4.1%).
Figure 2 shows examples of CTPAs from two PE-negative patients with typical COVID-19 radiological findings.
Fig. 2.

COVID-19 patients without PE. CTPA. a, b Coronal and c, d axial reformatting (lung window). a, c A 76-year-old diabetic and dyslipidemic man who presented to our hospital complaining of fever and dyspnea of 9 days of duration. RT-PCR confirmed COVID-19 and DD value was 2541 ng/mL. CTPA ruled out PE but showed extensive bilateral ground-glass opacities (asterisks). b, d A 60-year-old man without significant past medical history who presented to our hospital with fever and dyspnea of 11 days duration. RT-PCR confirmed COVID-19 and DD value was 7309 ng/mL. CTPA ruled out PE but demonstrated extensive bilateral ground-glass opacities (asterisks) and areas of consolidation (arrowheads), in which air bronchograms (arrows) could be appreciated. A crazy-paving pattern is visible in both lungs, although more noticeable on the periphery of the middle-lung right field (star). COVID-19, coronavirus disease 2019; CTPA, computed tomography pulmonary angiogram; DD, D-dimer; GGO, ground-glass opacities; PE, pulmonary embolism; RT-PCR, real-time reverse transcriptase-polymerase chain reaction
PE imaging findings
Among the 73 patients with PE, 35 patients (48%) had bilateral involvement.
In 46/73 patients (63%), filling defects involved the segmental and subsegmental arteries. Lobar arteries were involved in 17/73 patients (23.3%), main pulmonary arteries in 8/73 (11%), and pulmonary artery trunk in 2/73 patients (2.7%).
The most commonly involved sites were the right lower lobe (48/242, 67%), the left lower lobe (30/242, 41%), and the middle lobe (29/242, 40%), followed by the right upper lobe (27/242, 37%) and left upper lobe (25/242, 34.3%).
Signs of right ventricle overload were recorded in 15/73 patients (20.5%).
Figure 3 corresponds to a CTPA from a COVID-19 patient with PE findings.
Fig. 3.

COVID-19 patient with PE. CTPA. a Axial and b coronal reformatting (mediastinal window). CTPA corresponding to a 37-year-old woman with a positive RT-PCR test for SARS-CoV-2. The patient presented to the Emergency Department several days after symptoms onset because of worsening dyspnea. DD was 3128 ng/mL. The patient died 3 days after CTPA was made. Filling defects affected the pulmonary trunk bifurcation and both main pulmonary arteries, with practically complete occlusion of the distal main arteries (white arrows). These findings were in keeping with a saddle PE. A peripheral, wedge-shaped consolidation in the right lung was concerning for a pulmonary infarction or an infectious opacity (white asterisk). COVID-19, coronavirus disease 2019; CTPA, computed tomography pulmonary angiogram; DD, D-dimer; PE, pulmonary embolism; RT-PCR, real-time reverse transcriptase-polymerase chain reaction; SARS-CoV-2, severe acute respiratory syndrome coronavirus 2
PE-positive and PE-negative group comparison (Table 3)
Table 3.
PE comparison
| Variable | PE-positive (73) | PE-negative (169) | p value |
|---|---|---|---|
| Age | 67 (55–82) | 66 (55–77.5) | p = .7 |
| Sex (men) | 50 (68.5%) | 101 (59.8%) | p = .2 |
| Comorbidities | 49 (67%) | 127 (75%) | p = .2 |
| Clinical timepoints: | |||
| Days of symptoms before admission | 7 (3–12) days | 7 (4–13) days | p = .7 |
| Time from hospital admission to CTPA | 5 (0–13) days | 8 (1–18) days | p = .2 |
| Length of stay | 18 (10–28) days | 17(7–28) days | p = .6 |
| Laboratory results: | |||
| D-dimer (ng/mL) | 7872 (3150–22,494) ng/mL | 2009 (5675–15,705) ng/mL | p < .001 |
| White blood cell count (103/μL) | 10 (7.4–13.2) 103/μL | 7.7 (6.1–11.6) 103/μL | p = .05 |
| Lymphocytes (103/μL) | 4 (0.8–1.7) 103/μL | 1.1 (0.8–1.6) 103/μL | p = .14 |
| Neutrophils (103/μL) | 8.3 (5.4–11) 103/μL | 5.7 (4–9.5) 103/μL | p = .02 |
| Hemoglobin (g/dL) | 13.2 (12.2–14.7) g/dL | 13 (11.2–14.4) g/dL | p = .1 |
| Platelet count (103/μL) | 220 (163.8–279.3) (103/μL) | 242 (165.3–324) (103/μL) | p=.4 |
| Fibrinogen (mg/dL) | 503.3 (286.7–693.2) mg/dL | 574 (350.3–740) mg/dL | p = .1 |
| CRP (mg/L) | 36 (8.5–105.9) mg/L | 22 (3.2–90.5) mg/L | p = .2 |
| Outcome: | |||
| Discharged | 41 (56.2%) | 110 (65.1%) | p = .1 |
| Hospitalized | 15 (20.5%) | 37 (21.9%) | |
| Non-survivors | 17 (23.3%) | 22 (13%) | |
Data are median (IQR) or n (%). Those results in italics show statistical differences between groups. CRP, C-reactive protein; PE, pulmonary embolism
Statistically significant differences were found between the PE-positive and PE-negative groups for neutrophils and DD levels. Age, sex, comorbidities, outcome, clinical timepoints, and laboratory results (white blood cell count, lymphocytes, hemoglobin, platelet count, fibrinogen, and CRP) did not show statistical differences.
Neutrophil median value was higher in the PE-positive group (8.3 [IQR 5.4–11] 103/μL) compared to the PE-negative group (5.7 [IQR 4–9.5] 103/μL), p = .02.
The DD median value was 7872 ng/mL (IQR 3150–22,494) in the PE-positive group and 2009 ng/mL (IQR 5675–15,705) in the PE-negative group. There was a significant difference in DD levels between the two groups with p < .001.
The optimal cutoff value for DD in the ROC curve to predict PE was 2903 ng/mL, which yielded a sensitivity of 81% and a specificity of 59%. AUC for PE was 0.76 (CI 95% 0.69–0.83, p < .001) (Fig. 4).
Fig. 4.
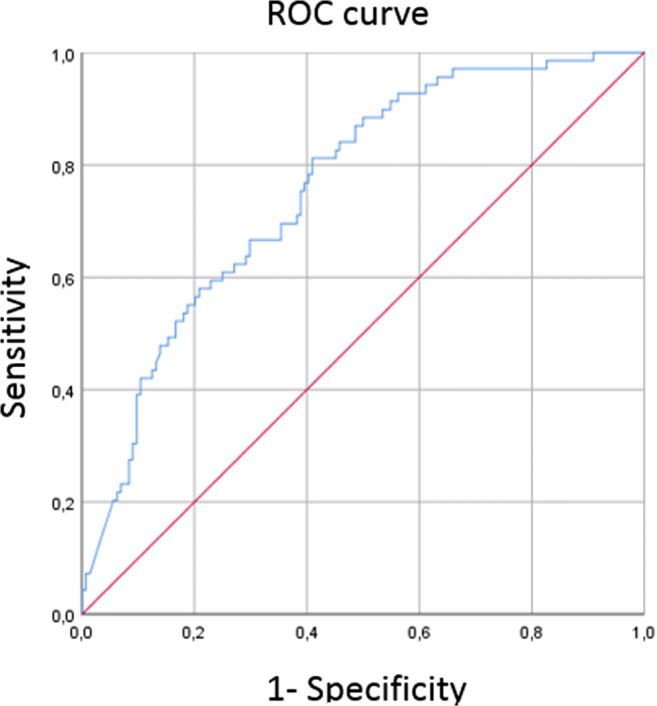
Graph shows receiver operating characteristic curve calculated for D-dimer to predict pulmonary embolism in COVID-19 patients. The optimal cutoff for D-dimer was 2903 ng/mL, AUC of 0.79 (CI 95% 0.69–0.83), with a sensitivity of 81% and a specificity of 59%
Table 4 illustrates different ranges of DD along with their sensitivity and specificity based on the ROC curve. With the optimal cutoff value of 2903 ng/mL, 98 CTPAs would have been saved but 13 PE would have been missed. A cutoff value of 1733 ng/mL would provide a sensitivity of 90% (7 out of 73 cases would have been missed in our sample) and a specificity of 51.4%, saving 72 CTPAs. A cutoff value of 1219 ng/mL would provide a sensitivity of 95.7% (3 out of 73 cases would have been missed) and a specificity of 37%, saving 56 CTPAs.
Table 4.
Sensitivity and specificity ranges of D-dimer extracted from ROC curve
| D-dimer (ng/mL) | Sensitivity (%) | Specificity (%) |
|---|---|---|
| 139–1219 | 100–96% | 0–37% |
| 1221–1721 | 94–91% | 37–45% |
| 1733–2082 | 90–86% | 45–51% |
| 2114–2903 | 84–81% | 51–59% |
No PE was missed between ranges
Survivor and non-survivor group comparison
A total of 39/242 deaths (16%) occurred during hospitalization. A comparison between non-survivors (deceased patients) and survivors (discharged patients [150/242, 62%]) was made. Patients that remained hospitalized by the end of this study were excluded of this analysis (53/242, 22%).
Statistically significant differences were found for age (75 [IQR 71–80] vs. 65 [IQR 62–67] years, p < .001), DD (7863 [2710–28,664] vs. 2433 [1093–6088] ng/mL, p = .01), neutrophils (9.04 [7. 6–10.5] vs. 6.5 [5.9–7.1] 103/μL, p < .001), platelet count (203.6 [167–240.3] vs. 283.3 [260.6–306] 103/μL, p = 0.002), and CRP (122.7 [84.6–160.8] vs. 45.7 [36.1–55.3] mg/L, p < .001).
Sex, comorbidities, PE incidence, median length of stay until death or discharge, and other laboratory parameters (white blood cell count, lymphocytes, hemoglobin, and fibrinogen) showed no statistically significant differences between groups.
Discussion
This retrospective study included 242 patients with coronavirus disease 2019 (COVID-19) that underwent a computed tomography pulmonary angiogram (CTPA) due to clinical suspicion of pulmonary embolism (PE). Since COVID-19 has shown to raise D-dimer (DD) levels even in the absence of PE, we tried to demonstrate statistically significant differences in DD values between PE-positive and PE-negative COVID-19 patients and to establish a more adequate DD cutoff value to assess CTPA indication in these patients. The PE-positive group showed higher DD values than the PE-negative group (7872 vs. 2009 ng/mL, respectively, p < .001). The optimal DD cutoff according to receiver operating characteristic (ROC) curve was 2903 ng/mL (81% sensitivity and 59% specificity).
As hypothesized in other studies, COVID-19 patients requiring hospital assistance were more frequently older men with metabolic risk factors, such as hypertension, dyslipidemia, or diabetes [24–27]. The median time from symptoms onset to hospital admission (7 days) was in accordance with previous research [27].
The incidence of PE was 30% (73/242), similar to that reported by other recent studies [10, 12, 28–30]. Three recent studies showed disparity results [31–33]. Of note, only 5/73 patients with PE had a confirmed diagnosis of deep vein thrombosis (DVT). It has been proposed that in situ microvascular thrombosis could be responsible for the strikingly high incidence of pulmonary thromboembolic events in the absence of DVT [6, 34]. However, an underestimation of the actual DVT incidence may have occurred, since many institutions restricted the use of Doppler ultrasound to rule out DVTs in COVID-19 patients [8, 35]. Other studies with smaller samples were insufficient to successfully clarify the actual DVT incidence [36], although recently published studies have stated that DVT events were frequently reported, suggesting that lower limb deep vein ultrasonography is necessary to detect DVT in COVID-19 patients [37–39]. Additional research is necessary to provide a deeper insight on this matter.
Along with previous studies, we found that a high DD is common in COVID-19 patients. In our sample, 96% (205/242) of the patients showed a DD value above normal limits (median 3260 ng/mL, [IQR 1203–9625]). Despite elevated DD levels in most patients, the PE-positive group showed higher values than the PE-negative group (7872 vs. 2009 ng/mL, respectively, p < .001), similarly to other studies [28, 30–33]. Thus, DD along with other clinical and laboratory data can be used as a tool to effectively assess pre-CTPA PE risk in COVID-19 patients. However, the cutoff point should be reasonably higher than in non-COVID-19 patients.
The optimal cutoff point for DD in the ROC curve for our sample was 2903 ng/mL, which is slightly higher than the previously reported by Leonard-Lorant et al. (2660 ng/mL) and Alonso-Fernández et al. (2500 ng/mL); compared to theirs, our study has a larger sample size (242 vs. 106 [Leonard-Lorent et al.] and 30 [Alonso-Fernández et al.]) and a longer follow-up period (2 months vs. 1 month [Leonard-Lorant et al.] and 11 days [Alonso-Fernández et al.]).
This threshold of 2903 ng/mL yields a sensitivity of 81% and a specificity of 59%, and an area under the curve (AUC) of 0.76 (CI 95% 0.69–0.83, p < .001). Leonard-Lorant et al. results showed a higher sensitivity (100%) and specificity (67%), although AUC data was not reported. Alonso-Fernández et al. showed similar sensitivity and specificity like in our study (80% and 51%, respectively). However, guidelines usually demand a higher sensitivity [22]; a cutoff value between 1221 and 1721 ng/mL (sensitivity 91–94%, specificity 37–45%) could be more appropriate in this case.
The overall mortality rate in our sample (16%) was slightly higher than that reported in previous research [26, 27]. This may be due to the fact that our study had a longer follow-up period. Older age (75, IQR 71–80 years) and higher DD levels (7863 ng/mL, IQR 2710–28,664), among other laboratory parameters, were found in the non-surviving group, similarly to available published data [26].
We acknowledge some limitations to our study. First, this was a retrospective analysis conducted at a single center; therefore, information and management strategies could be different compared to other hospitals, and patient baseline characteristics and mortality rates may not be representative. Second, patients included in this study were diagnosed at one of the “red zones” in Europe; this could have led to overestimation of negative outcomes in patients due to health system overwhelming. Third, factors such as variable administered treatments, need of mechanical ventilation, admission to intensive care units, and dynamic changes in laboratory parameters were not examined but could have been helpful to better define the DD role in estimating the PE risk and in establishing a model predicting mortality.
In conclusion, COVID-19 has shown to raise D-dimer (DD) levels even in the absence of pulmonary embolism (PE). Despite high DD levels in most patients, the PE-positive group showed higher DD values than the PE-negative group. Our results suggest that a higher DD threshold (2903 ng/mL) instead of the standard DD cutoff value could more accurately predict the risk of PE in COVID-19 patients with a sensitivity of 81%.
Acknowledgments
The authors would like to thank all the components in the Radiology Department of Ramón y Cajal University Hospital for their hard work during this pandemic, especially to the Chest Radiology Section. We would like to thank as well José Javier ALARCÓN RODRÍGUEZ, MD, Miguel Ángel GÓMEZ BERMEJO, MD, Esther GARCÍA CASADO, MD, and Alfonso MURIEL GARCÍA, MD, for their precious help.
Code availability
Not applicable.
Abbreviations
- AUC
Area under the curve
- COVID-19
Coronavirus disease 2019
- CRP
C-reactive protein
- CTPA
Computed tomography pulmonary angiogram
- DD
D-dimer
- IQR
Interquartile range
- PE
Pulmonary embolism
- ROC
Receiver operating characteristic
- SARS-CoV-2
Severe acute respiratory syndrome coronavirus 2
Authors’ contributions
All authors contributed to the study conception and design. Material preparation, data collection, and analysis were performed by Sofía Ventura-Díaz, Juan V Quintana-Pérez, Almudena Gil-Boronat, and Marina Herrero-Huertas. The first draft of the manuscript was written by Sofía Ventura-Díaz and all authors commented on previous versions of the manuscript. Review and editing was performed by Sofía Ventura-Díaz and Juan V Quintana-Pérez. All authors read and approved the final manuscript.
Data availability
All data and statistic software accomplish field standards.
Compliance with ethical standards
Conflict of interest
The authors declare that they have no conflict of interest.
Ethics approval
This study was approved by the Research Ethics Committee of our hospital.
Consent to participate and publish
The need for patient informed consent was waived because of its retrospective nature. Data was anonymized to avoid any identification risk.
Footnotes
Key points
• Pneumonia and coagulation disorders are some of the clinical manifestations of COVID-19. In this regard, coagulation markers such as D-dimer can be increased even in the absence of pulmonary embolism.
• D-dimer role in pulmonary embolism (PE) risk estimation in COVID-19 patients is limited. Dyspnea can be present in uncomplicated COVID-19 pneumonia as well as in PE. Elevated D-dimer values could be a normal finding in COVID-19 patients but they could also be a reflection of PE.
• A higher D-dimer threshold for pulmonary embolism risk prediction in COVID-19 patients could lead to a reduction in computed tomography pulmonary angiogram requests, avoiding health system overwhelming.
Publisher’s note
Springer Nature remains neutral with regard to jurisdictional claims in published maps and institutional affiliations.
References
- 1.World Health Organization (2020)COVID-19 situation. World Health Organization. Available via https://www.who.int/emergencies/diseases/novel-coronavirus-2019/situation-reports
- 2.Connors J, Levy J (2020) Thromboinflammation and the hypercoagulability of COVID-19 (2020). J Thromb Haemost. 10.1111/jth.14849 [DOI] [PMC free article] [PubMed]
- 3.Yang X, Yu Y, Xu J, Shu H, Xia J', Liu H, Wu Y, Zhang L, Yu Z, Fang M, Yu T, Wang Y, Pan S, Zou X, Yuan S, Shang Y. Clinical course and outcomes of critically ill patients with SARS-CoV-2 pneumonia in Wuhan, China: a single-centered, retrospective, observational study. Lancet Reed. 2020;8:475–481. doi: 10.1016/S2213-2600(20)30079-5. [DOI] [PMC free article] [PubMed] [Google Scholar]
- 4.Zhou F, Yu T, Du R, et al. Clinical course and risk factors for mortality of adult inpatients with COVID-19 in Wuhan, China: a retrospective cohort study. Lancet. 2020;395:1054–1062. doi: 10.1016/S0140-6736(20)30566-3. [DOI] [PMC free article] [PubMed] [Google Scholar]
- 5.Han H, Yang L, Liu R, Liu F, Wu KL, Li J, Liu XH, Zhu CL. Prominent changes in blood coagulation of patients with SARS-CoV-2 infection. Clin Chem Lab Med. 2020;58:1116–1120. doi: 10.1515/cclm-2020-0188. [DOI] [PubMed] [Google Scholar]
- 6.Tang N, Bai H, Chen X, Gong J, Li D, Sun Z. Anticoagulant treatment is associated with decreased mortality in severe coronavirus disease 2019 patients with coagulopathy. J Thromb Haemost. 2020;18:1094–1099. doi: 10.1111/jth.14817. [DOI] [PMC free article] [PubMed] [Google Scholar]
- 7.Varga Z, Flammer AJ, Steiger P, Haberecker M, Andermatt R, Zinkernagel AS, Mehra MR, Schuepbach RA, Ruschitzka F, Moch H. Endothelial cell infection and endotheliitis in COVID-19. Lancet. 2020;395:1417–1418. doi: 10.1016/S0140-6736(20)30937-5. [DOI] [PMC free article] [PubMed] [Google Scholar]
- 8.Visseren FLJ, Bouwman JJM, Bouter KP, Diepersloot RJA, De Groot G, Erkelens DW. Procoagulant activity of endothelial cells after infection with respiratory viruses. Thromb Haemost. 2000;84:319–324. doi: 10.1055/s-0037-1614014. [DOI] [PubMed] [Google Scholar]
- 9.Yu B, Li X, Chen J et al (2020) Evaluation of variation in D-dimer levels among COVID-19 and bacterial pneumonia: a retrospective analysis. J Thromb Thrombolysis. 10.21203/rs.3.rs-20056/v1 [DOI] [PMC free article] [PubMed]
- 10.Casey K, Iteen A, Nicolini R, Auten J. COVID-19 pneumonia with hemoptysis: acute segmental pulmonary emboli associated with novel coronavirus infection. Am J Emerg Med. 2020;38:1544.e1–1544.e3. doi: 10.1016/j.ajem.2020.04.011. [DOI] [PMC free article] [PubMed] [Google Scholar]
- 11.Ng KH, Wu AK, Cheng VC, Tang BS, Chan CY, Yung CY, Luk SH, Lee TW, Chow L, Yuen KY. Pulmonary artery thrombosis in a patient with severe acute respiratory syndrome. Postgrad Med J. 2005;81:e3. doi: 10.1136/pgmj.2004.030049. [DOI] [PMC free article] [PubMed] [Google Scholar]
- 12.Avnon LS, Munteanu D, Smoliakov A, Jotkowitz A, Barski L. Thromboembolic events in patients with severe pandemic influenza A/H1N1. Eur J Intern Med. 2015;26:596–598. doi: 10.1016/j.ejim.2015.08.017. [DOI] [PubMed] [Google Scholar]
- 13.Lodigiani C, Lapichino G, Carenzo L, et al. Venous and arterial thromboembolic complications in COVID-19 patients admitted to an academic hospital in Milan, Italy. Thromb Res. 2020;191:9–14. doi: 10.1016/j.thromres.2020.04.024. [DOI] [PMC free article] [PubMed] [Google Scholar]
- 14.Xie Y, Wang X, Yang P, Zhang S (2020) COVID-19 complicated by acute pulmonary embolism. Radiology 2. 10.1148/ryct.2020200067 [DOI] [PMC free article] [PubMed]
- 15.Danzi GB, Loffi M, Galeazzi G, Gherbesi E. Acute pulmonary embolism and COVID-19 pneumonia: a random association? Eur Heart J. 2020;41:1858. doi: 10.1093/eurheartj/ehaa254. [DOI] [PMC free article] [PubMed] [Google Scholar]
- 16.Poyiadji N, Cormier P, Patel P et al (2020) Acute pulmonary embolism and COVID-19. Radiology.:201955. 10.1148/radiol.2020201955 [DOI] [PMC free article] [PubMed]
- 17.Grillet F, Behr J, Calame P, Aubry S, Delabrousse E. Acute pulmonary embolism associated with COVID-19 pneumonia detected by pulmonary CT angiography. Radiology. 2020;296:E186–E188. doi: 10.1148/radiol.2020201544. [DOI] [PMC free article] [PubMed] [Google Scholar]
- 18.Ai T, Yang Z, Hou H, Zhan C, Chen C, Lv W, Tao Q, Sun Z, Xia L. Correlation of chest CT and RT-PCR testing in coronavirus disease 2019 (COVID-19) in China: a report of 1014 cases. Radiology. 2020;296:E32–E40. doi: 10.1148/radiol.2020200642. [DOI] [PMC free article] [PubMed] [Google Scholar]
- 19.Xie X, Zhong Z, Zhao W, Zheng C, Wang F, Liu J. Chest CT for typical 2019-nCoV pneumonia: relationship to negative RT-PCR testing. Radiology. 2020;296:E41–E45. doi: 10.1148/radiol.2020200343. [DOI] [PMC free article] [PubMed] [Google Scholar]
- 20.Fang Y, Zhang H, Xie J, Lin M, Ying L, Pang P, Ji W. Sensitivity of chest CT for COVID-19: comparison to RT-PCR. Radiology. 2020;296:E115–E117. doi: 10.1148/radiol.2020200432. [DOI] [PMC free article] [PubMed] [Google Scholar]
- 21.Wang Y, Hou H, Wang W, Wang W (2020) Combination of CT and RT-PCR in the screening or diagnosis of COVID-19. J Glob Health 10. 10.7189/jogh.10.010347 [DOI] [PMC free article] [PubMed]
- 22.Konstantinides SV, Meyer G, Becattini C, Bueno H, Geersing GJ, Harjola VP, Huisman MV, Humbert M, Jennings CS, Jiménez D, Kucher N, Lang IM, Lankeit M, Lorusso R, Mazzolai L, Meneveau N, Ní Áinle F, Prandoni P, Pruszczyk P, Righini M, Torbicki A, van Belle E, Zamorano JL, ESC Scientific Document Group. Galié N, Gibbs JSR, Aboyans V, Ageno W, Agewall S, Almeida AG, Andreotti F, Barbato E, Bauersachs J, Baumbach A, Beygui F, Carlsen J, de Carlo M, Delcroix M, Delgado V, Subias PE, Fitzsimons D, Gaine S, Goldhaber SZ, Gopalan D, Habib G, Halvorsen S, Jenkins D, Katus HA, Kjellström B, Lainscak M, Lancellotti P, Lee G, le Gal G, Messas E, Morais J, Petersen SE, Petronio AS, Piepoli MF, Price S, Roffi M, Salvi A, Sanchez O, Shlyakhto E, Simpson IA, Stortecky S, Thielmann M, Noordegraaf AV, Becattini C, Bueno H, Geersing GJ, Harjola VP, Huisman MV, Humbert M, Jennings CS, Jiménez D, Kucher N, Lang IM, Lankeit M, Lorusso R, Mazzolai L, Meneveau N, Ní Áinle F, Prandoni P, Pruszczyk P, Righini M, Torbicki A, VanBelle E, LuisZamorano J, Windecker S, Aboyans V, Baigent C, Collet JP, Dean V, Delgado V, Fitzsimons D, Gale CP, Grobbee D, Halvorsen S, Hindricks G, Iung B, Jüni P, Katus HA, Landmesser U, Leclercq C, Lettino M, Lewis BS, Merkely B, Mueller C, Petersen SE, Sonia Petronio A, Richter DJ, Roffi M, Shlyakhto E, Simpson IA, Sousa-Uva M, Touyz RM, Hammoudi N, Hayrapetyan H, Mascherbauer J, Ibrahimov F, Polonetsky O, Lancellotti P, Tokmakova M, Skoric B, Michaloliakos I, Hutyra M, Mellemkjaer S, Mostafa M, Reinmets J, Jääskeläinen P, Angoulvant D, Bauersachs J, Giannakoulas G, Zima E, Vizza CD, Sugraliyev A, Bytyçi I, Maca A, Ereminiene E, Huijnen S, Xuereb R, Diaconu N, Bulatovic N, Asfalou I, Bosevski M, Halvorsen S, Sobkowicz B, Ferreira D, Petris AO, Moiseeva O, Zavatta M, Obradovic S, Šimkova I, Radsel P, Ibanez B, Wikström G, Aujesky D, Kaymaz C, Parkhomenko A, Pepke-Zaba J. 2019 ESC Guidelines for the diagnosis and management of acute pulmonary embolism developed in collaboration with the European Respiratory Society (ERS) Eur Heart J. 2020;41:543–603. doi: 10.1093/eurheartj/ehz405. [DOI] [PubMed] [Google Scholar]
- 23.Frigini LA, Hoxhaj S, Wintermark M, Gibby C, De Rosen VL, Willis MH. R-SCAN: CT. angiographic imaging for pulmonary embolism. J Am Coll Radiol. 2017;14:637–640. doi: 10.1016/j.jacr.2017.01.013. [DOI] [PubMed] [Google Scholar]
- 24.Huang C, Wang Y, Li X, Ren L, Zhao J, Hu Y, Zhang L, Fan G, Xu J, Gu X, Cheng Z, Yu T, Xia J, Wei Y, Wu W, Xie X, Yin W, Li H, Liu M, Xiao Y, Gao H, Guo L, Xie J, Wang G, Jiang R, Gao Z, Jin Q, Wang J, Cao B. Clinical features of patients infected with 2019 novel coronavirus iin Wuhan, China. Lancet. 2020;395:497–506. doi: 10.1016/S0140-6736(20)30183-5. [DOI] [PMC free article] [PubMed] [Google Scholar]
- 25.Chen G, Wu D, Guo W, Cao Y, Huang D, Wang H, Wang T, Zhang X, Chen H, Yu H, Zhang X, Zhang M, Wu S, Song J, Chen T, Han M, Li S, Luo X, Zhao J, Ning Q. Clinical and immunological features of severe and moderate coronavirus disease 2019. J Clin Invest. 2020;130:2620–2629. doi: 10.1172/JCI137244. [DOI] [PMC free article] [PubMed] [Google Scholar]
- 26.Chen N, Zhou M, Dong X, Qu J, Gong F, Han Y, Qiu Y, Wang J, Liu Y, Wei Y, Xia J', Yu T, Zhang X, Zhang L. Epidemiological and clinical characteristics of 99 cases of 2019 novel coronavirus pneumonia in Wuhan, China: a descriptive study. Lancet. 2020;395:507–513. doi: 10.1016/S0140-6736(20)30211-7. [DOI] [PMC free article] [PubMed] [Google Scholar]
- 27.Tang N, Li D, Wang X, Sun Z. Abnormal coagulation parameters are associated with poor prognosis in patients with novel coronavirus pneumonia. J Thromb Haemost. 2020;18:844–847. doi: 10.1111/jth.14768. [DOI] [PMC free article] [PubMed] [Google Scholar]
- 28.Leonard-Lorant, Delabranche X, Severac F, et al. Acute pulmonary embolism in COVID-19 patients on CT angiography and relationship to D-dimer levels. Radiology. 2020;296:E189–E191. doi: 10.1148/radiol.2020201561. [DOI] [PMC free article] [PubMed] [Google Scholar]
- 29.Chen J, Wang X, Zhang S, Liu B, Wu X, Wang Y, Wang X, Yang M, Sun J, Xie Y (2020) Findings of acute pulmonary embolism in COVID-19 patients. 10.2139/ssrn.3548771
- 30.Bompard F, Monnier H, Saab I. Pulmonary embolism in patients with COVID-19 pneumonia. Eur Respir J. 2020;56:2001365. doi: 10.1183/13993003.01365-2020. [DOI] [PMC free article] [PubMed] [Google Scholar]
- 31.Jalaber C, Revel MP, Chassagnon G, Bajeux E, Lapotre T, Croisille P, Lederlin M. Role of upfront CT pulmonary angiography at admission in COVID-19 patients. Thromb Res. 2020;196:138–140. doi: 10.1016/j.thromres.2020.08.037. [DOI] [PMC free article] [PubMed] [Google Scholar]
- 32.Alonso-Fernández A, Toledo-Pons N, Cosío BG, Millán A, Calvo N, Ramón L, de Mendoza SH, Morell-García D, Bauça-Rossello JM, Núñez B, Pons J, Palmer JA, Martín L, Peñaranda M, Pou JA, Sauleda J, Sala-Llinas E. Prevalence of pulmonary embolism in patients with COVID-19 pneumonia and high D-dimer values: a prospective study. PLoS One. 2020;15:e0238216. doi: 10.1371/journal.pone.0238216. [DOI] [PMC free article] [PubMed] [Google Scholar]
- 33.Chen J, Wang X, Zhang S, Lin B, Wu X, Wang Y, Wang X, Yang M, Sun J, Xie Y. Characteristics of acute pulmonary embolism in patients with COVID-19 associated pneumonia from the city of Wuhan. Clin Appl Thromb Hemost. 2020;26:107602962093677. doi: 10.1177/1076029620936772. [DOI] [PMC free article] [PubMed] [Google Scholar]
- 34.Deshpande C. Thromboembolic findings in COVID-19 autopsies: pulmonary thrombosis or embolism? Ann Intern Med. 2020;173:394–395. doi: 10.7326/M20-3255. [DOI] [PMC free article] [PubMed] [Google Scholar]
- 35.Bikdeli B, Madhavan MV, Jimenez D et al (2020) COVID-19 and thrombotic or thromboembolic disease: implications for prevention, antithrombotic therapy, and follow-up. J Am Coll Cardiol [DOI] [PMC free article] [PubMed]
- 36.Cui S, Chen S, Li X, Liu S, Wang F. Prevalence of venous thromboembolism in patients with severe novel coronavirus pneumonia. J Thromb Haemost. 2020;18:1421–1424. doi: 10.1111/jth.14830. [DOI] [PMC free article] [PubMed] [Google Scholar]
- 37.Wichmann D, Sperhake JP, Lütgehetmann M, Steurer S, Edler C, Heinemann A, Heinrich F, Mushumba H, Kniep I, Schröder AS, Burdelski C, de Heer G, Nierhaus A, Frings D, Pfefferle S, Becker H, Bredereke-Wiedling H, de Weerth A, Paschen HR, Sheikhzadeh-Eggers S, Stang A, Schmiedel S, Bokemeyer C, Addo MM, Aepfelbacher M, Püschel K, Kluge S. Autopsy findings and venous thromboembolism in patients with COVID-19: a prospective cohort study. Ann Intern Med. 2020;173:268–277. doi: 10.7326/M20-2003. [DOI] [PMC free article] [PubMed] [Google Scholar]
- 38.Klok FA, Kruip MJHA, van der Meer NJM, Arbous MS, Gommers DAMPJ, Kant KM, Kaptein FHJ, van Paassen J, Stals MAM, Huisman MV, Endeman H. Incidence of thrombotic complications in critically ill ICU patients with COVID-19. Thromb Res. 2020;191:145–147. doi: 10.1016/j.thromres.2020.04.013. [DOI] [PMC free article] [PubMed] [Google Scholar]
- 39.Demelo-Rodríguez P, Cervilla-Muñoz E, Ordieres-Ortega L, Parra-Virto A, Toledano-Macías M, Toledo-Samaniego N, García-García A, García-Fernández-Bravo I, Ji Z, de-Miguel-Diez J, Álvarez-Sala-Walther LA, del-Toro-Cervera J, Galeano-Valle F. Incidence of asymptomatic deep vein thrombosis in patients with COVID-19 pneumonia and elevated D-dimer levels. Thromb Res. 2020;192:23–26. doi: 10.1016/j.thromres.2020.05.018. [DOI] [PMC free article] [PubMed] [Google Scholar]
Associated Data
This section collects any data citations, data availability statements, or supplementary materials included in this article.
Data Availability Statement
All data and statistic software accomplish field standards.