

Abstract
Breast cancer is a disease of genomic alterations, of which the panorama of somatic mutations and how these relate to subtypes and therapy response is incompletely understood. Within SCAN‐B (ClinicalTrials.gov: NCT02306096), a prospective study elucidating the transcriptomic profiles for thousands of breast cancers, we developed a RNA‐seq pipeline for detection of SNVs/indels and profiled a real‐world cohort of 3,217 breast tumors. We describe the mutational landscape of primary breast cancer viewed through the transcriptome of a large population‐based cohort and relate it to patient survival. We demonstrate that RNA‐seq can be used to call mutations in genes such as PIK3CA,TP53, and ERBB2, as well as the status of molecular pathways and mutational burden, and identify potentially druggable mutations in 86.8% of tumors. To make this rich dataset available for the research community, we developed an open source web application, the SCAN‐B MutationExplorer (http://oncogenomics.bmc.lu.se/MutationExplorer). These results add another dimension to the use of RNA‐seq as a clinical tool, where both gene expression‐ and mutation‐based biomarkers can be interrogated in real‐time within 1 week of tumor sampling.
Keywords: breast cancer, mutation, RNA‐seq, survival, transcriptome
Subject Categories: Cancer; Chromatin, Epigenetics, Genomics & Functional Genomics
A bioinformatics pipeline was developed for detection of single nucleotide variants and small insertions/deletions from RNA sequencing (RNA‐seq) data. The mutational landscape of 3,217 primary breast cancer transcriptomes in relation to patient survival was made available through a public web portal.
The paper explained.
Problem
Breast cancer is a disease of genomic alterations, of which the complete panorama of somatic mutations and how these relate to molecular subtypes, therapy response, and clinical outcomes is incompletely understood. RNA sequencing is a powerful technique for profiling tumor transcriptomes; however, using it for reliable detection of single nucleotide variants and small insertions and deletions is challenging.
Results
Within the Sweden Cancerome Analysis Network‐Breast project (SCAN‐B; ClinicalTrials.gov NCT02306096), we developed an optimized bioinformatics pipeline for detection of single nucleotide variants and small insertions and deletions from RNA‐seq data. From this, we describe the mutational landscape of 3,217 primary breast cancer transcriptomes and relate it to patient overall survival in a real‐world setting (median follow‐up 75 months, range 2–105 months). We demonstrate that RNA‐seq can be used to call mutations in important breast cancer genes such as PIK3CA, TP53, ESR1, and ERBB2, as well as mutation status of key molecular pathways and tumor mutational burden. We identify mutations in one or more potentially druggable genes in 86.8% of cases and reveal significant relationships to patient outcome within specific treatment groups, such as occurrence of mutations inducing resistance to standard of care drugs in untreated patients. To make this rich and growing mutational portraiture of breast cancer available for the wider research community, we developed an open source interactive web application, SCAN‐B MutationExplorer, publicly accessible at http://oncogenomics.bmc.lu.se/MutationExplorer.
Impact
These results add another dimension to the use of RNA‐seq as a potential clinical tool, where both gene expression‐based signatures and gene mutation‐based biomarkers can be interrogated simultaneously and in real‐time within 1 week of tumor sampling. Treatment resistance mutations can be detected in early disease and could inform clinical decision‐making.
Introduction
Mutations in the cancer genome, including single nucleotide variants (SNVs) and small insertions and deletions (indels), can shed light on cancer biology, tumor evolution and susceptibility or resistance to therapeutic agents (The Cancer Genome Atlas, 2012; Bose et al, 2013; Robinson et al, 2013). Mutations can now even be used to track circulating tumor DNA in the blood of patients (Garcia‐Murillas et al, 2015; Förnvik et al, 2019). In recent years, the characterization of the mutational landscape of breast cancer has been performed primarily on the DNA level (The Cancer Genome Atlas, 2012; Cheng et al, 2015; Ciriello et al, 2015). Adoption of massively parallel RNA sequencing (RNA‐seq) as a clinical tool has been slower, despite several complementary advantages over DNA‐seq. In addition to gene and isoform expression profiling and detection of de novo transcripts such as fusion genes, RNA‐seq can approximate classical DNA‐seq capabilities in the detection of SNVs, indels, as well as structural variants (Ma et al, 2018) and coarse copy number (preprint: Talevich & Shain, 2018). This makes RNA‐seq an excellent tool for biomarker development (Brueffer et al, 2018) and potential clinical deployment (Byron et al, 2016; Cieślik & Chinnaiyan, 2018).
For these reasons, among others, in 2010, the Sweden Cancerome Analysis Network–Breast (SCAN‐B) initiative (ClinicalTrials.gov ID NCT02306096) selected RNA‐seq as the primary analytic tool (Saal et al, 2015; Rydén et al, 2018). SCAN‐B is a prospective real‐world and population‐based multicenter study with the aim of developing, validating, and clinically implementing novel biomarkers. To this end, SCAN‐B collects tumor tissue and blood samples from enrolled patients with a diagnosis of primary breast cancer (BC). To date, over 15,000 patients have been enrolled, and messenger RNA (mRNA) sequencing is performed on patient tumors within 1 week of surgery. All patients are treated uniformly according to the Swedish national standard of care regimen.
Expression profiling is an excellent tool to develop gene signatures for established and novel biomarkers (Sotiriou et al, 2006; Roepman et al, 2009; Brueffer et al, 2018), and many such signatures can be applied to a single RNA‐seq dataset. However, for the detection of SNVs and indels from RNA‐seq data, there are several challenges. Unlike DNA‐seq, where whole‐genome or targeted sequencing reads are distributed approximately uniformly and in proportion to DNA copy number, the abundance of reads in RNA‐seq is proportional to the expression of each gene or locus. Consequently, only variants in expressed transcripts of sufficient level can be detected. In cancer, this means that variants in oncogenes can likely be detected, whereas those in tumor suppressor genes, e.g., TP53, BRCA1, or BRCA2, are more likely to be missed. For example, mutations inducing premature stop codons can lead to nonsense‐mediated decay, causing loss of expression and subsequently false‐negative calls. The transcriptome is also more complex and challenging than the genome. RNA structures, such as alternative splicing, add computational challenges to alignment, and RNA editing can contribute to false‐positive variant calls. Finally, there is the lack of benchmark datasets for RNA‐seq, as are available for DNA from the Genome in a Bottle consortium and others (Zook et al, 2016; Li et al, 2018).
The aim of this study was to optimize RNA‐seq somatic mutation calling through comparison to matched targeted DNA‐seq, discern the mutational landscape of the early breast cancer transcriptome across a large cohort of 3,217 treatment‐naïve SCAN‐B cases with sufficient follow‐up time, and to make the resulting vast dataset available for exploration by the wider research community. To demonstrate the power of the methodology and dataset, we assessed the impact of mutations in important breast cancer driver genes and pathways, as well as tumor mutational burden (TMB) on patient overall survival (OS).
Results
An outline of the study design, which comprised DNA sequencing and RNA sequencing of 275 samples from the ABiM cohort, and RNA sequencing of 3,217 samples from the SCAN‐B cohort, is shown in Fig 1.
Figure 1. Study design.
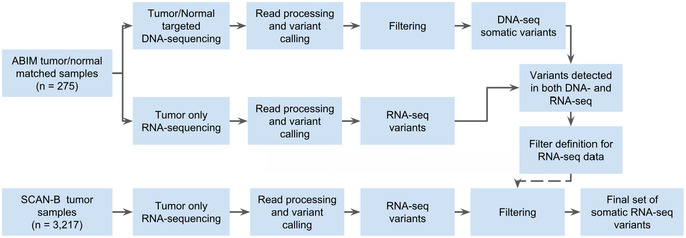
Study design flow diagram for DNA‐seq‐informed optimization of RNA‐seq variant calling.
Variant filter performance
Mutation calling in the 275 sample ABiM cohort resulted in 3,478 somatic post‐filter mutations from the matched tumor/normal targeted capture DNA, and 1,459 variants from tumor RNA‐seq in the DNA capture regions (Table 1 and Fig EV1A). Comparing these DNA and RNA variants resulted in 1,132 mutations that were present both in DNA and RNA in the capture regions and whose frequencies were generally in line with previous studies such as The Cancer Genome Atlas (TCGA) (The Cancer Genome Atlas, 2012) (Fig EV1B). Of the 1,459 RNA‐seq variants, 884 (60.6%) were identified as somatic in DNA, 248 (17.0%) as germline in DNA, and 327 (22.4%) as unique to RNA. These RNA‐unique variants are a mix of somatic mutations missed in DNA‐seq, e.g., due to regional higher sequencing coverage in RNA‐seq or tumor heterogeneity, unfiltered RNA editing sites, or artifacts caused by PCR, sequencing, or alignment and variant calling.
Table 1.
Number of mutations in the ABiM (DNA‐seq and RNA‐seq) and SCAN‐B (RNA‐seq) cohorts
| Cohort | Source | Coverage | Total mutations | SNVs | Insertions | Deletions | Samples with mutations | Mutations per sample |
|---|---|---|---|---|---|---|---|---|
| ABiM | DNA | Capture regions | 3,478 | 3,173 | 50 | 173 | 274 | 12.7 |
| ABiM | RNA | Capture regions | 1,459 | 1,304 | 57 | 98 | 265 | 5.5 |
| ABiM | RNA | Whole mRNA | 16,683 | 15,764 | 235 | 684 | 275 | 60.7 |
| SCAN‐B | RNA | Whole mRNA | 144,593 | 141,095 | 1,112 | 2,386 | 3,217 | 44.9 |
Sample numbers differ from total cohort sizes due to filtering resulting in samples with no remaining post‐filter mutations.
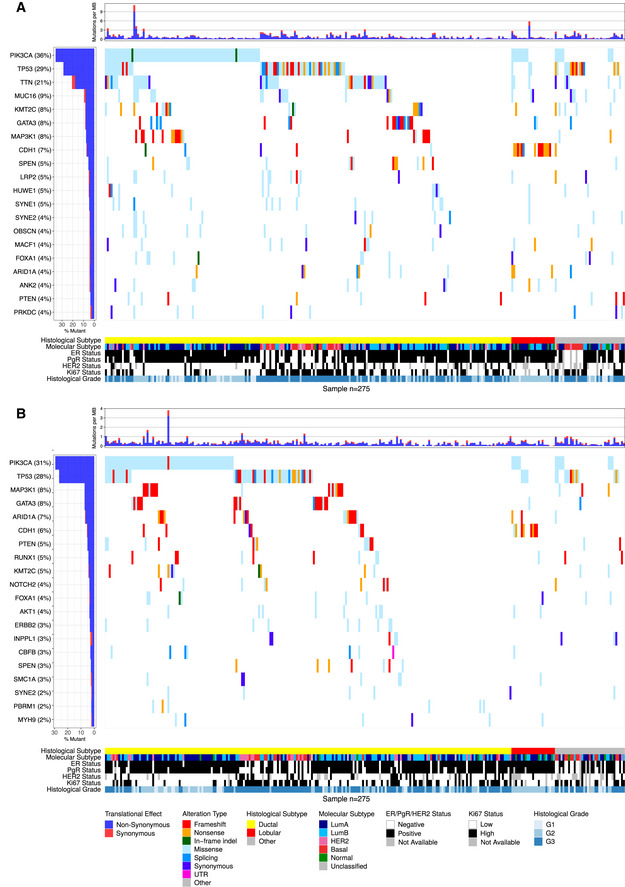
Figure EV1. Overview of frequently mutated genes in targeted DNA‐seq and RNA‐seq across 275 ABiM samples.
-
A, BWaterfall plot of the 20 most mutated genes (rows) across 275 ABiM samples (columns) in (A) targeted DNA‐seq and (B) RNA‐seq. Genes are ranked by variant frequency. Samples are sorted by histological subtype and alteration occurrence. Mutations are colored by predicted functional impact.
Landscape of somatic mutations in the breast cancer transcriptome
We applied the filters derived from the 275 sample set to the entire RNA‐seq SCAN‐B 3,217 sample set, resulting in 144,593 total variants comprised of 141,095 SNVs, 1,112 insertions, and 2,386 deletions (Table 1). The number of mutations per sample in the SCAN‐B set was lower compared to the ABiM set, likely due to the ABiM set being sequenced to a higher depth (Table EV1). The SNVs comprised 50,270 missense, 2,311 nonsense, 1,042 splicing, 68,819 affecting 3′/5′ untranslated regions (UTRs), 17,057 synonymous mutations, as well as 1,596 mutations predicted otherwise. The majority of indels were predicted to cause frameshifts or affect 3′/5′ UTRs (Table EV2). After removing synonymous mutations, the number of mutations was reduced to 127,536 variants in the SCAN‐B set, i.e., an average of 40 mutations per tumor.
We analyzed the contribution of the six nucleotide substitution types (C>A, C>G, C>T, T>A, T>C, and T>G) to SNVs in the ABiM and SCAN‐B sets (Fig 2A). Compared to DNA, RNA‐seq‐based variant calls showed a relative under‐representation of C>T substitutions and an over‐representation of T>C substitutions.
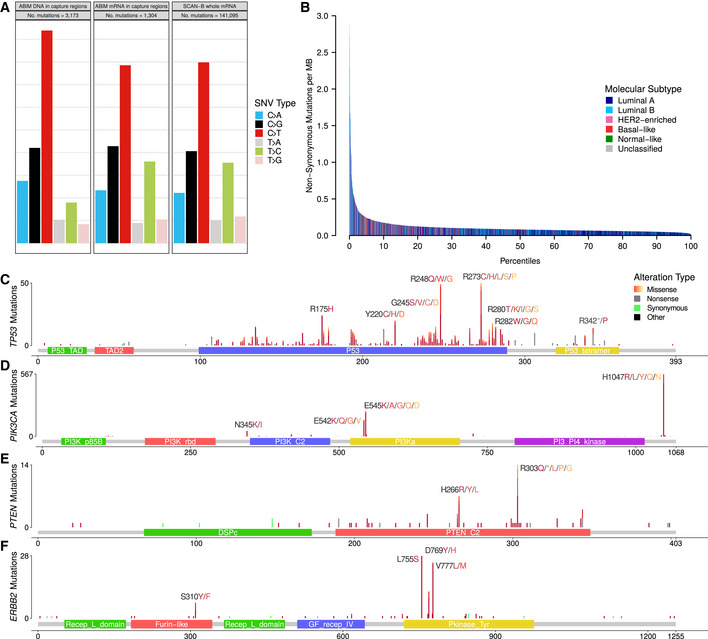
Figure 2. Overview of non‐synonymous mutations in terms of base substitution signatures, molecular subtype, and protein impact.
-
AContribution of base change types to the overall SNV composition in the ABiM cohort for captured DNA regions and mRNA in the captured DNA regions, as well as SCAN‐B whole mRNA.
-
BNumber of non‐synonymous mutations per sample. Bars are colored by PAM50 subtypes Luminal A (dark blue), Luminal B (light blue), HER2‐enriched (pink), basal‐like (red), Normal‐like (green) and Unclassified (gray).
-
C–FLollipop plots showing the location, abundance, and impact of SNVs in (C) TP53, (D) PIK3CA, (E) PTEN, and (F) ERBB2 on the respective encoded protein. Protein change labels are shown for the most mutated amino acid positions, with residues ordered left to right by mutation frequency within each label.
In accordance with published studies of primary BC, the most frequently mutated genes were the known BC drivers PIK3CA (34% of samples), TP53 (23%), MAP3K1 (7%), CDH1 (7%), GATA3 (7%), and AKT1 (5%) (Fig 3). As reported before (Ciriello et al, 2015), disruptive alterations in CDH1 were a hallmark of lobular carcinomas (135/386 [35.0%] of samples), while alterations in TP53, MAP3K1, and GATA3 were more common in the ductal type. 86.8% of SCAN‐B samples had at least one mutation in a gene targeted by an approved or experimental drug, based on the Database of Gene‐drug Interactions (DGI).
Figure 3. Overview of frequently mutated genes across 3,217 SCAN‐B samples.
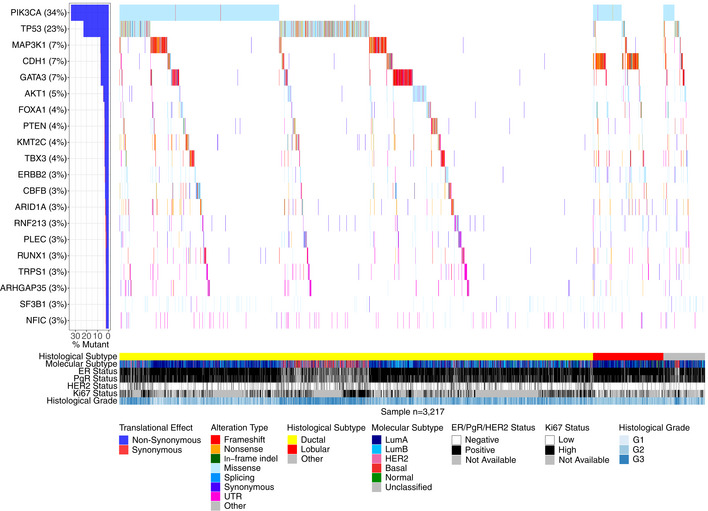
Waterfall plot of the 20 most frequently mutated genes (rows) across 3,217 SCAN‐B samples (columns). Genes are ranked from top to bottom by mutation frequency. Samples are sorted by histological subtype and alteration occurrence. Mutations are colored by predicted functional impact.
Somatic mutations in important BC genes
We examined known driver BC genes more closely and found our RNA‐seq‐based mutation calls to recapitulate known mutation rates and hot spots, summarized in Table 2, Table EV2, and Fig 2C–F. Associations of mutated genes and clinical and molecular biomarkers are summarized in Table EV3, and several examples are highlighted below.
Table 2.
The most occurring non‐synonymous mutations in the genes PIK3CA, AKT1, SF3B1, GATA3, ERBB2, TP53, FOXA1, and CDH1 in 3,217 SCAN‐B samples
| Gene | AA change | Number of mutations | Mut. samples (%) | Mut. in gene (%) |
|---|---|---|---|---|
| PIK3CA | H1047R | 483 | 15 | 41.5 |
| E545K | 212 | 6.6 | 18.2 | |
| E542K | 142 | 4.4 | 12.2 | |
| H1047L | 77 | 2.4 | 6.6 | |
| N345K | 49 | 1.5 | 4.2 | |
| E726K | 26 | 0.8 | 2.2 | |
| C420R | 20 | 0.6 | 1.7 | |
| E453K | 13 | 0.4 | 1.1 | |
| G1049R | 11 | 0.3 | 0.9 | |
| E545A | 10 | 0.3 | 0.9 | |
| Q546K | 10 | 0.3 | 0.9 | |
| M1043I | 8 | 0.2 | 0.7 | |
| Other | 102 | 3.2 | 8.8 | |
| AKT1 | E17K | 121 | 3.8 | 76.1 |
| Other | 38 | 1.2 | 23.9 | |
| SF3B1 | K700E | 60 | 1.9 | 74.1 |
| Other | 21 | 0.7 | 25.9 | |
| GATA3 | P409fs | 30 | 0.9 | 12.2 |
| M294K | 14 | 0.4 | 5.7 | |
| D336fs | 10 | 0.3 | 4.1 | |
| D332fs | 10 | 0.3 | 4.1 | |
| Other | 182 | 5.7 | 74 | |
| ERBB2 | L755S | 28 | 0.9 | 23.9 |
| V777L | 24 | 0.7 | 20.5 | |
| D769Y | 9 | 0.3 | 7.7 | |
| Other | 56 | 1.7 | 47.9 | |
| TP53 | R273C | 25 | 0.8 | 3.2 |
| R248Q | 25 | 0.8 | 3.2 | |
| R175H | 24 | 0.7 | 3.5 | |
| R248W | 22 | 0.7 | 3.1 | |
| R273H | 19 | 0.6 | 2.4 | |
| Y220C | 17 | 0.5 | 2.2 | |
| F134L | 14 | 0.4 | 1.8 | |
| E285K | 13 | 0.4 | 1.7 | |
| R213* | 12 | 0.4 | 1.5 | |
| R282W | 12 | 0.4 | 1.5 | |
| R306* | 10 | 0.3 | 1.3 | |
| Y163C | 10 | 0.3 | 1.3 | |
| L194R | 9 | 0.3 | 1.2 | |
| R342* | 9 | 0.3 | 1.2 | |
| E286K | 8 | 0.2 | 1 | |
| G245S | 8 | 0.2 | 1 | |
| H179R | 8 | 0.2 | 1 | |
| Q331* | 8 | 0.2 | 1 | |
| Other | 529 | 16.4 | 65.1 | |
| FOXA1 | S250F | 23 | 0.7 | 15.8 |
| F266L | 11 | 0.3 | 7.5 | |
| Other | 112 | 3.5 | 76.7 | |
| CDH1 | Q23* | 18 | 0.6 | 7.7 |
| I650fs | 8 | 0.2 | 3.4 | |
| P127fs | 8 | 0.2 | 3.4 | |
| Other | 199 | 6.2 | 85.4 |
Shown are the total number of mutations, the frequency of the mutations in the SCAN‐B cohort (Mut. samples), and the frequency of a particular mutation within all mutations in the gene (Mut. in gene).
PIK3CA was the most frequently mutated gene, with 1,163 non‐synonymous mutations in 1,095 patient samples (34% of patients). As expected, and in line with previous studies (Saal et al, 2005; The Cancer Genome Atlas, 2012; Pereira et al, 2016), the majority of alterations were the known hot spot mutations H1047R/L, E545K, and E542K (Table 2, Fig 2D), which lead to constitutive signaling (Bader et al, 2006). All hot spot mutations and the vast majority of other PIK3CA alterations were missense mutations. Mutations were associated with lobular, ER+, PgR+, HER2−, and Luminal A (LumA) BC (Table EV3).
TP53 is frequently disrupted by somatic SNVs; however, a few hot spot mutations exist (Giacomelli et al, 2018). The mutation frequency in BC is estimated to be 35.4‐37% (The Cancer Genome Atlas, 2012; Pereira et al, 2016), which we could confirm in our DNA‐seq ABiM filter‐definition cohort (37%). Likely due to nonsense‐mediated decay (NMD), loss of heterozygosity, and/or decreased mRNA transcription, in the 3,217 cases, the frequency of TP53 mutations was lower at 23% (782 mutations in 733 samples). Despite underdetection by RNA‐seq, the identified hot spot residues were the same as reported in the IARC TP53 database (release R20) (Bouaoun et al, 2016). The most often mutated amino acids we observed were R273, R248, R175 (50, 49, and 24 mutations respectively, total 123/782 [15.7%]), followed by positions Y220 (21/782 [2.7%]), R280 (19/782 [2.4%]), and R342 (17/782 [2.2%]) (Table 2, Fig 2C). Most detected mutations are in the DNA binding domain, and 77.6% of overall mutations are missense mutations, likely leading to protein loss of function (LoF). As anticipated, TP53 mutations were associated with ductal, ER−, PgR−, HER2+, hormone receptor positive (HoR+)/HER2+ (HoR+ defined as ER+ and PgR+, HoR− otherwise), HoR−/HER2+, triple‐negative BC (TNBC), and the basal‐like and HER2‐enriched PAM50 subtypes (Table EV3), as reported before (The Cancer Genome Atlas, 2012).
PTEN is a crucial tumor suppressor gene and regulator of PI3K activity, and PTEN protein expression is associated with poor outcome (Saal et al, 2007). In our dataset, we found 124 non‐synonymous mutations in 116/3,217 (3.6%) samples, including hot spot mutations in H303 and H266 of unknown significance (Fig 2E). Mutations were significantly associated with HER2− disease (Table EV3).
ERBB2 (HER2) mutations have emerged as a novel biomarker and occur by the majority in patients without ERBB2 amplification (Bose et al, 2013), but also in ERBB2‐amplified cases (Cocco et al, 2018). Evidence is mounting that recurrent ERBB2 mutations lead to increased activation of the HER2 receptor in tumors classified as HER2 normal (Bose et al, 2013; Wen et al, 2015; Pahuja et al, 2018). Activating ERBB2 mutations have been shown to confer therapy resistance against standard of care drugs such as trastuzumab and lapatinib (Cocco et al, 2018), but can be overcome using pan‐HER tyrosine kinase inhibitors (TKIs) such as neratinib (Bose et al, 2013; Ben‐Baruch et al, 2015; Ma et al, 2017; Cocco et al, 2018). ERBB2 mutations have also been shown to confer resistance to endocrine therapy in the metastatic setting (Nayar et al, 2018), where HER2‐directed drugs are effective (Murray et al, 2018). We identified 117 non‐synonymous ERBB2 mutations in 103 patients (3.2%), higher than the previously reported incidence rates of 1.6%‐2.4% (Bose et al, 2013; Wen et al, 2015; Ross et al, 2016), but lower than in metastatic BC where rates as high as ~ 7% have been reported (Cocco et al, 2018). Two hot spots, L755S (28/117) and V777L (24/117) that cause constitutive HER2 signaling (Fig 2F) (Bose et al, 2013; Wen et al, 2015), accounted for 44.4% of total ERBB2 mutations. Co‐occurrence of ERBB2 mutation and amplification has been reported before, however mainly in the metastatic setting (Cocco et al, 2018). In our untreated, early BC cohort, we observed ERBB2 mutation and amplification in 12 tumors, demonstrating that co‐incident ERBB2 mutation and amplification is rare but can occur in early, treatment‐naïve BC. Mutation and amplification were not mutually exclusive (P = 0.88), and interestingly ERBB2 mutations occurred predominantly in tumors classified as PAM50 HER2‐enriched subtype (P = 0.0001). Moreover, ERBB2 mutation was significantly associated with PgR− and lobular BC (Table EV3).
Loss of E‐cadherin (CDH1) protein expression is a hallmark of the lobular BC phenotype (Ciriello et al, 2015). With 12% of our cohort being of lobular type, we observed 137 of total 233 CDH1 mutations in lobular BCs (58.8%, P = 1.6E‐72). The mutations were mostly comprised of nonsense mutations (37.2%) and frameshift indels (35.4%), suggesting they contribute to CDH1 expression loss and drive the lobular phenotype. We observed one nonsense mutation hot spot (Q23*, n = 18), and this residue was also hit by a rare missense mutation (Q23K, n = 1). In addition to lobular BC, CDH1 mutations were associated with ER+, HER2−, and HoR+/ HER2− status, and the LumA subtype (Table EV3).
Other notable mutated genes in our set were MAP3K1, AKT1, ESR1, GATA3, FOXA1, SF3B1, and CBFB. MAP3K1 is a regulator of signaling pathways and regularly implicated in various cancer types. Loss of MAP3K1 expression activates the PI3K/AKT/mTOR pathway and desensitizes the tumor to PI3K inhibition (Avivar‐Valderas et al, 2018), thus mutation status of this gene may affect efficacy of PI3K‐targeting drugs. We observed a high rate of frameshift indels, and missense mutations mostly clustered in the kinase domain. Co‐mutation of MAP3K1 and PIK3CA occurred in 108 tumors (3.4%), and inactivating (frameshift/nonsense) MAP3K1 alterations occurred in 77 of 1,095 (7%) of PIK3CA‐mutant tumors. AKT1 is a common oncogene with 156 (4.8%) mutated samples and featured the fourth most mutated hot spot (E17K, 121 mutations) in the SCAN‐B cohort. These mutations are predictive of sensitivity to AKT inhibitors (Hyman et al, 2017). ESR1 encodes the estrogen receptor (ER) alpha, perhaps the most important clinical BC biomarker. Seventy‐seven tumors harbored 81 ESR1 variants, including known endocrine treatment resistance mutations, that are discussed elsewhere in detail (M. Dahlgren, AM. George, C. Brueffer, S. Gladchuk, Y. Chen, J. Vallon‐Christersson, C. Hegardt, J. Häkkinen, L. Rydén, M. Malmberg, C. Larsson, SK. Gruvberger‐Saal, A. Ehinger, N. Loman, Å. Borg, LH. Saal, submitted). Relatedly, GATA3 and FOXA1 are frequently mutated transcription factors that are directly involved in modulating ER signaling, and their expression is independently associated with beneficial survival in ER+ tumors (Hisamatsu et al, 2012). We identified 246 GATA3 mutations, including known recurrent frameshift mutations (P409fs, n = 30 and D336fs, n = 10) and the M294K/R missense mutation (n = 15), as well as 10 splice site variants. In FOXA1, we detected 146 total mutations, including known recurrent S250F (n = 23) and F266L/C (n = 12) missense mutations. Most mutations occurred in the forkhead DNA binding domain. While the role of mutations in these genes has not been thoroughly characterized, Takaku et al (2018) suggest that GATA3 can function as either oncogene or tumor suppressor depending on the mutations the gene accumulated, and which part of the protein product is impacted. According to their classification, the most frequent mutation in our cohort, the P409fs frameshift mutation, results in an elongated protein product compared to GATA3‐wt that has favorable survival compared to mutations of the second Zinc finger domain. In line with their involvement in ER signaling, mutations in GATA3, FOXA1, MAP3K1, and ESR1 were associated with ER+ and PgR+ disease. Further, GATA3, MAP3K1, and ESR1 were associated with HoR+/ HER2−, and GATA3 and MAP3K1 with ductal BC, while ESR1 and FOXA1 were more common in lobular BC. All these genes were associated with the LumA subtype, with the exception of GATA3 which was associated to Luminal B (LumB) (Table EV3).
SF3B1 encodes a subunit of the spliceosome and mutations in this gene have been identified as potentially interesting treatment targets after having been observed in myelodysplastic syndromes and chronic lymphocytic leukemia. We identified 81 SF3B1 mutations in 79 tumors, 60 of which were K700E hot spot mutations that deregulate splicing and result in differential splicing patterns in BC (Maguire et al, 2015). Alterations in this gene are associated with ER+ disease (Maguire et al, 2015) and affect alternative splicing patterns (Alsafadi et al, 2016). The cohort frequency of 1.9% K700E mutations matches up with previously reported 1.8% in an unselected breast cancer cohort (Maguire et al, 2015). We could not confirm the reported prevalence of SF3B1 mutations in ER+ tumors in the total ER+ group (P = 0.052), but in the ER+/ HER2− subgroup (68/79 mutated tumors ER+/ HER2−, P = 0.021), as well as the association with non‐ductal, and non‐lobular subtypes (P = 0.0033). Additionally, SF3B1 mutations were associated with LumB tumors (P = 0.0006) (Table EV3).
CBFB is a transcriptional co‐activator of RUNX2, an expression regulator of several genes involved in metastatic processes such as cell migration. Increased CBFB expression has been identified as essential for cell invasion in BC (Mendoza‐Villanueva et al, 2010). Recurrent CBFB mutations have recently been reported in ER+/HER2− disease; however, the significance of these mutations is unknown (Griffith et al, 2018). We could confirm this finding showing 107 mutations (3.3% cohort frequency), 95 of which were in ER+/ HER2− samples (4% of ER+/ HER2− samples, P = 0.0005). We also found them to be associated with the LumA subtype (Table EV3); however, we did not observe the splice site mutation described by Griffith et al (2018), perhaps due to degradation of the spliced mRNA by NMD.
Mutations in molecular pathways
We were interested whether the mutational data, when considered from the perspective of mutated pathways, could reveal new biological correlates. To test this, we mapped mutation status to important BC pathways as defined in the Reactome database (Fabregat et al, 2018; Jassal et al, 2020). We called a pathway mutated when at least one of the member genes had a non‐synonymous mutation and clustered samples by pathway mutation status using Euclidean distance and Ward linkage. Notable clusters that emerged were co‐mutated hedgehog signaling, p53‐independent DNA repair, and hypoxia response pathways, as well as a cluster of NOTCH1/2/3 signaling mutated tumors, both in mostly basal‐like and HER2‐enriched tumors. Both clusters are linked in their relation to cancer stem cell development (Habib & O'Shaughnessy, 2016; Locatelli & Curigliano, 2017), which, in addition to the NOTCH and Hedgehog pathways themselves, has emerged as a novel treatment target, particularly in TNBC. Another co‐mutation cluster was made up of PI3K/AKT, MET, RET, EGFR, ERBB2, and ERBB4 signaling pathways that occurred in a subset of Luminal A and B tumors (Fig 4; see Table EV4 for Reactome pathway IDs). Activation of these pathways is involved in the development of ER+ BC through proliferation‐inducing signaling, or endocrine therapy resistance, e.g., via activating ERBB2 mutations (Nayar et al, 2018).
Figure 4. Binary heatmap of mutation status of important breast cancer pathways in 3,217 samples.
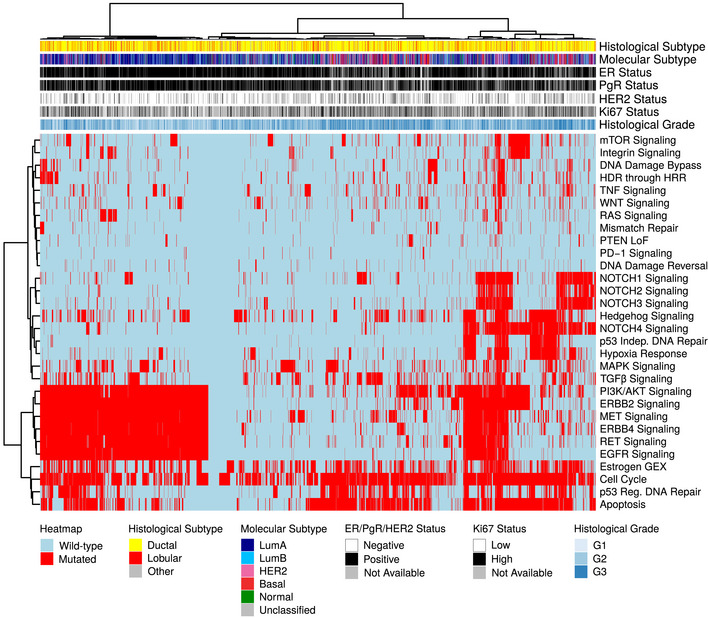
Binary heatmap of mutation status of important BC pathways in 3,217 samples. Samples with wild‐type (wt) pathway status (defined as all member genes being wt) are colored blue, those with mutated pathways (at least one member gene mutated) are colored red. Samples and pathways were clustered using Euclidean distance and Ward linkage. Reactome IDs for the pathways can be found in Table EV4.
Tumor mutational burden
Tumor mutational burden is increasingly of interest due to its association to neoantigen burden and response to immunotherapies. We used the median number of non‐synonymous mutations per transcriptome megabase (rnaMB), 0.082 mutations/rnaMB, to stratify all SCAN‐B samples into TMB‐high and TMB‐low groups. Samples with HER2‐enriched and basal‐like PAM50 subtypes were enriched in the top 10% of samples with the highest TMB compared to the lowest 90% (P = 2.2E‐16, Fig 2B), supporting previous results and indicating that immunotherapy may have higher activity in these two PAM50 subtypes (The Cancer Genome Atlas, 2012).
Mutational landscape and patient outcomes
Next, we were interested in the association between mutations in important BC genes and patient outcome under various treatments. Below we show the results for TP53, PIK3CA, ERBB2, and PTEN with OS of SCAN‐B patients in clinical biomarker and treatment groups (Figs 5 and EV2), as well as selected pathways (Figs 6 and EV3). Specific treatments stratified by clinical biomarker and treatment groups are detailed in Table EV4. The web tool SCAN‐B MutationExplorer may be used to query any gene(s) and pathway(s) of interest.
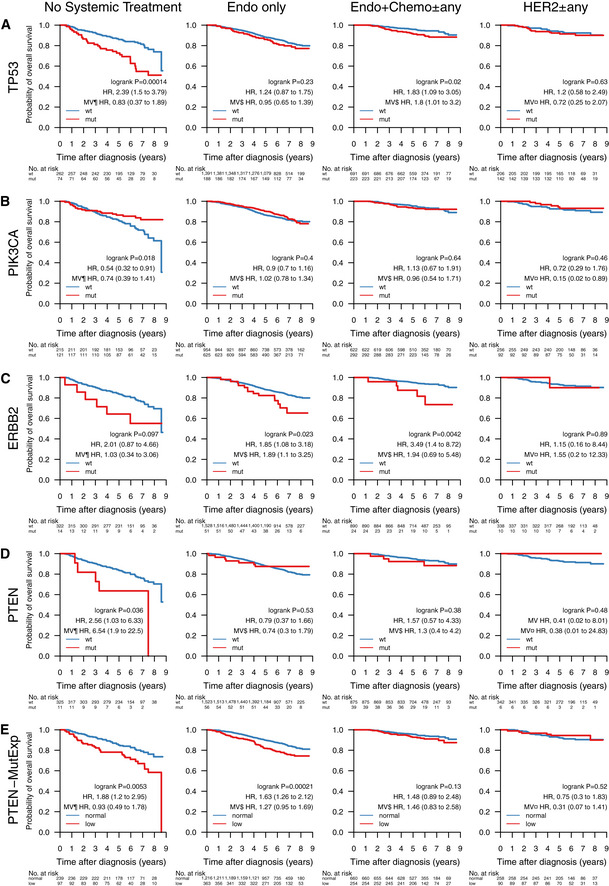
Figure 5. Impact of gene mutations on overall survival across treatment groups.
-
A–EOverall survival (OS) of patients with tumors containing mutations in the genes (A) TP53, (B) PIK3CA, (C) ERBB2, and (D) PTEN. (E) OS by PTEN‐MutExp genotype (“low” defined as PTEN mutation or PTEN expression in the lower quartile across the cohort, “normal” otherwise) stratified by groups receiving no systemic treatment (n = 336), endocrine therapy only (Endo only; n = 1,579), endocrine‐ and chemotherapy (Endo + Chemo ± any; n = 914), as well as HER2 treatment with any other treatment or none (HER2 ± any; n = 348). Specific treatments in these groups are detailed in Table EV5. In each Kaplan–Meier plot, wild‐type (wt) and normal cases are plotted in blue, mutated (mut) and low cases are plotted in red, the log‐rank P value is given, and the hazard ratio (HR) for mutation/low is given with a 95% CI and after univariable and multivariable (MV) Cox regression adjustment. Covariables included in the MV analysis were age at diagnosis, lymph node status, tumor size, and the variables denoted by the following symbols: ¶, ER, PgR, HER2, and NHG; ¤, ER, PgR, and NHG; $, HER2 and NHG. ER, estrogen receptor; HER2, human epidermal growth factor receptor 2; NHG, Nottingham histological grade; PgR, progesterone receptor.
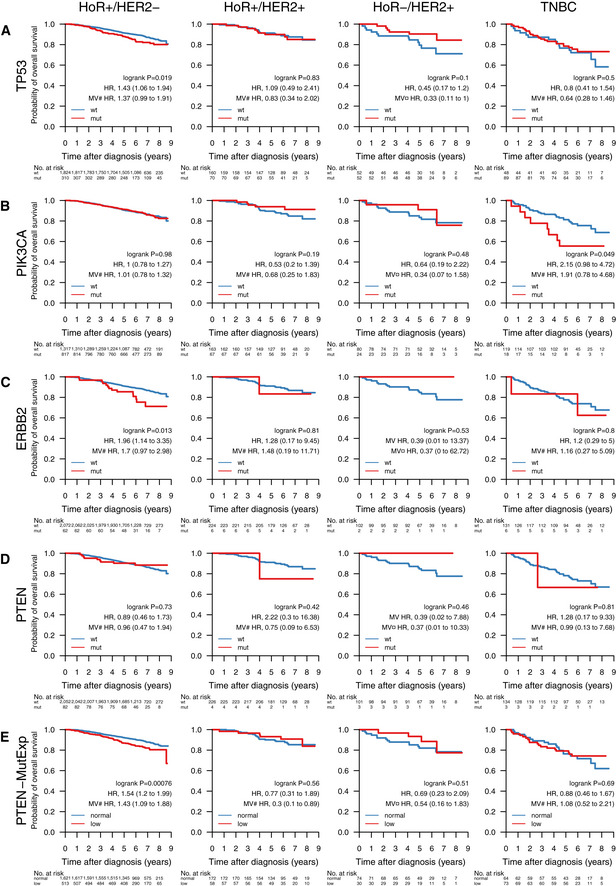
Figure EV2. Impact of gene mutations on overall survival across clinical subgroups.
-
A–EOverall survival (OS) of patients with tumors containing mutations in the genes (A) TP53, (B) PIK3CA, (C) ERBB2, and (D) PTEN. (E) OS by PTEN‐MutExp genotype (“low” defined as PTEN mutation or PTEN expression in the lower quartile across the cohort, “normal” otherwise) stratified by the clinical patient subgroups HoR+/HER2− (HoR+ when ER+ and PgR+, HoR− otherwise; n = 2,134), HoR+/HER2+ (n = 230), HoR−/HER2+ (n = 104), and TNBC (n = 137). Specific treatments in these groups are detailed in Table EV4. In each Kaplan–Meier plot, wild‐type (wt) and normal cases are plotted in blue, mutated (mut) and low cases are plotted in red, the log‐rank P value is given, and the hazard ratio (HR) for mutation/low is given with a 95% CI and after univariable and multivariable (MV) Cox regression adjustment. Covariables included in the MV analysis were age at diagnosis, lymph node status, tumor size, and the variables denoted by the following symbols: ¤, ER, PgR, and NHG; #, NHG. ER, estrogen receptor; HER2, human epidermal growth factor receptor 2; HoR, hormone receptor; NHG, Nottingham histological grade; PgR, progesterone receptor; TNBC, triple‐negative breast cancer.
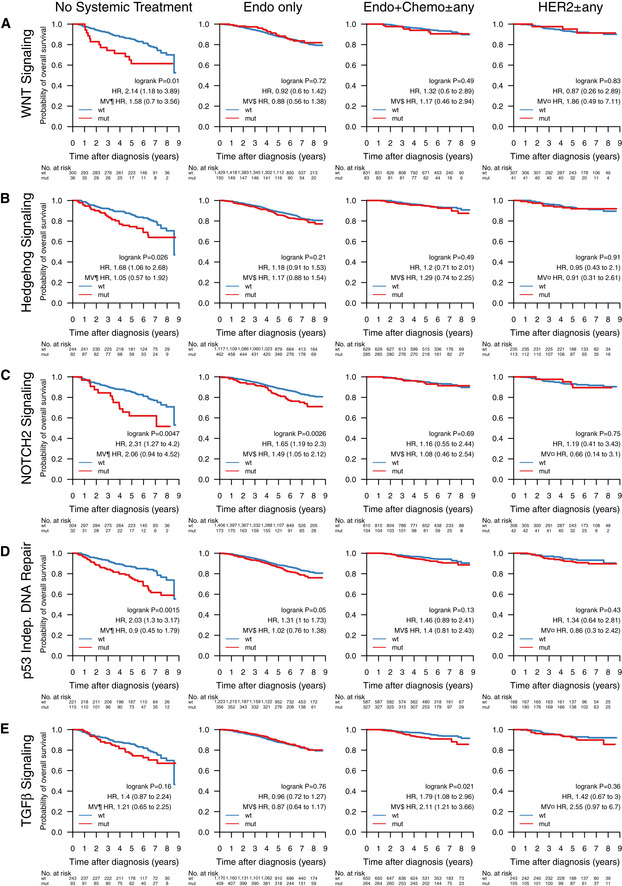
Figure 6. Impact of pathway mutations on overall survival across treatment groups.
-
A–EOverall survival of patients with tumors containing mutations in pathways (A) WNT signaling, (B) Hedgehog signaling, (C) NOTCH2 signaling, (D) p53 independent DNA damage repair, (E) TGFβ signaling, stratified by groups receiving no systemic treatment (n = 336), endocrine therapy only (Endo only; n = 1,579), endocrine‐ and chemotherapy (Endo + Chemo ± any; n = 914), as well as HER2 treatment with any other treatment or none (HER2 ± any; n = 348). Specific treatments in these groups are detailed in Table EV4. In each Kaplan–Meier plot, wild‐type (wt) cases are plotted in blue, mutated (mut) cases are plotted in red, the log‐rank P value is given, and the hazard ratio (HR) for mutation is given with a 95% CI and after univariable and multivariable (MV) Cox regression adjustment. Covariables included in the MV analysis were age at diagnosis, lymph node status, tumor size, and the variables denoted by the following symbols: ¶, ER, PgR, HER2, and NHG; ¤, ER, PgR, and NHG; $, HER2 and NHG. See Table EV3 for Reactome pathway IDs. ER, estrogen receptor; HER2, human epidermal growth factor receptor 2; NHG, Nottingham histological grade; PgR, progesterone receptor.
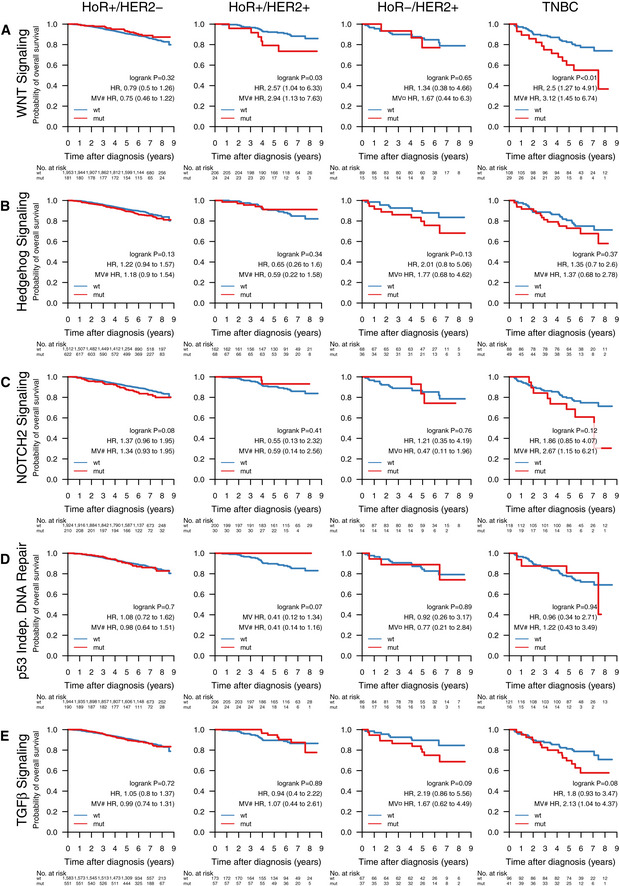
Figure EV3. Impact of pathway mutations on overall survival across clinical subgroups.
-
A–EOverall survival of patients with tumors containing mutations in pathways (A) WNT signaling, (B) Hedgehog signaling, (C) cell cycle, (D) p53 independent DNA damage repair, and (E) TGFβ signaling, stratified by the clinical patient subgroups HoR+/HER2− (HoR+ when ER+ and PgR+, HoR− otherwise; n = 2,134), HoR+/HER2+ (n = 230), HoR−/HER2+ (n = 104), and TNBC (n = 137). Specific treatments in these groups are detailed in Table EV4. In each Kaplan–Meier plot, wild‐type (wt) cases are plotted in blue, mutated (mut) cases are plotted in red, the log‐rank P value is given, and the hazard ratio (HR) for mutation is given with a 95% CI and after univariable and multivariable (MV) Cox regression adjustment. Covariables included in the MV analysis were age at diagnosis, lymph node status, tumor size, and the variables denoted by the following symbols: ¤, ER, PgR, and NHG; #, NHG. ER, estrogen receptor; HER2, human epidermal growth factor receptor 2; NHG, Nottingham histological grade; PgR, progesterone receptor.
In line with expectations, TP53 mutation predicted poor survival in untreated patients (hazard ratio [HR] 2.39, 95% CI [1.5–3.79], P = 0.00014), patients treated with endocrine‐ and chemotherapy (HR: 1.83 [1.09–3.05], P = 0.02), as well as the HoR+/HER2− biomarker subgroup (HR: 1.43 [1.06–1.94], P = 0.019). After adjusting for important covariates in multivariable (MV) Cox analyses, TP53 mutations remained a significant stratifier among patients receiving endocrine‐ and chemotherapy.
In early‐stage breast cancer, PIK3CA mutations have been associated with slightly better 5‐year OS than PIK3CA‐wt tumors in univariable analysis, but not when correcting for clinicopathological and treatment variables (Zardavas et al, 2018). In our hands, we saw a similar univariable effect in patients who did not receive systemic treatment (HR: 0.54 [0.32–0.91], P = 0.018), but not when adjusting for covariates. Additionally, PIK3CA mutations in HER2 ± any treated patients became significant in multivariable analysis.
ERBB2 mutations were indicators of poor prognosis in endocrine therapy only (HR: 1.85 [1.08–3.18], P = 0.023) and endocrine‐ and chemotherapy‐treated (HR: 3.49 [1.4–8.72], P = 0.0042) patients, as well as in the HoR+/HER2− subgroup (HR: 1.96 [1.14–3.35], P = 0.013). After multivariable adjustment, they remained a significant predictor in the endocrine‐only‐treated patient subgroup.
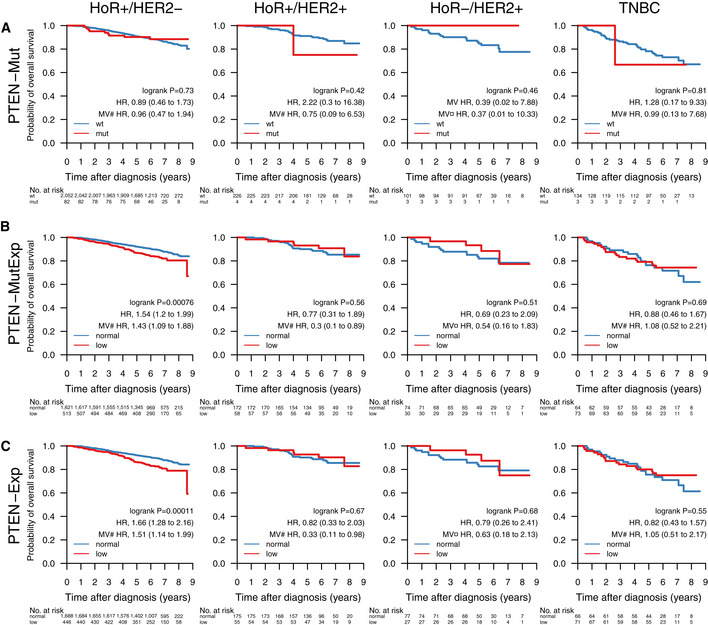
PTEN mutations alone were associated with poor survival in the patient group not receiving systemic treatment (HR: 2.56 [1.03–6.33], P = 0.036), but not in any of the other treatment or clinical biomarker groups (Fig 5 and EV2). While loss of PTEN protein expression or non‐functional PTEN protein can be caused by SNVs and indels, it can also be caused by other mechanisms such as large structural variants (Saal et al, 2008) and promoter methylation (Zhang et al, 2013) that have not been investigated in this study. To account for this, we defined a new subgroup PTEN‐MutExp, where a status of “low” identifies cases with either PTEN mutation or gene expression in the lower quartile within the cohort, and “normal” otherwise. The PTEN‐MutExp low group, incorporating gene expression, showed improved stratification in the no systemic treatment group (HR: 1.88 [1.2–2.95], P = 0.0053), and significantly lower OS in patients receiving only endocrine treatment (HR: 1.63 [1.26–2.12], P = 0.00021), as well as HoR+/HER2− patients (HR: 1.54 [1.2–1.99], P = 0.00076). Most of the prognostic value is provided by the gene expression, however mutation data improved stratification (Fig EV4). After multivariable adjustment, PTEN mutations in the no systemic‐treated subgroup, as well as the PTEN‐MutExp “low” group in HoR+/HER2− and HoR+/HER2+ patients, remained significant.
Figure EV4. Impact of PTEN mutation and expression on overall survival across treatment groups.
-
A–COverall survival of patients with tumors containing a (A) PTEN mutation (PTEN‐Mut), (B) a PTEN mutation and/or PTEN expression in the lower cohort‐quartile (PTEN‐MutExp), or (C) PTEN expression in the lower cohort‐quartile (PTEN‐Exp) in the clinical patient subgroups HoR+/HER2− (HoR+ when ER+ and PgR+, HoR− otherwise; n = 2,134), HoR+/HER2+ (n = 230), HoR−/HER2+ (n = 104), and TNBC (n = 137). Specific treatments in these groups are detailed in Table EV4. In each Kaplan–Meier plot, wild‐type (wt) and normal cases are plotted in blue, mutated (mut) and low cases are plotted in red, the log‐rank P value is given, and the hazard ratio (HR) for mutation/low is given with a 95% CI and after univariable and multivariable (MV) Cox regression adjustment. Covariables included in the MV analysis were age at diagnosis, lymph node status, tumor size, and the variables denoted by the following symbols: ¤, ER, PgR, and NHG; #, NHG. ER, estrogen receptor; HoR, hormone receptor; HER2, human epidermal growth factor receptor 2; NHG, Nottingham histological grade; PgR, progesterone receptor; TNBC, triple‐negative breast cancer.
Abstracting from mutations in individual genes, we investigated the effect of mutated pathways on OS in patient subgroups stratified by treatment (Fig 6) and clinical subgroup (Fig EV3). Mutated WNT (Fig 6A, HR: 2.14 [1.18–3.89], P = 0.01), Hedgehog (Fig 6B, HR: 1.68 [1.06–2.68], P = 0.026), and NOTCH2 (Fig 6C, HR: 2.31 [1.27–4.2], P = 0.0047) pathways, as well as the p53‐independent DNA damage repair pathway (Fig 6D, HR: 2.03 [1.3–3.17], P = 0.0015) were associated with worse survival in patients not receiving systemic treatment. Additionally, NOTCH2 signaling (Fig 6C, HR: 1.65 [1.19–2.3], P = 0.0026) was associated with worse OS in patients receiving only endocrine treatment, and TGFβ signaling (Fig 6E, HR: 1.79 [1.08–2.96], P = 0.021) with worse OS in patients treated with endocrine‐ and chemotherapy. Further, WNT signaling was associated with worse OS in HoR+/HER2+ (HR: 2.57 [1.04–6.33], P = 0.034) and TNBC patients (HR: 2.5 [1.27–4.91], P = 0.0061; Fig EV3). In multivariable analysis, WNT pathway mutations in HoR+/HER2+ and TNBC patients, NOTCH2 pathway mutations in endocrine‐only‐treated patients, and TGFβ pathway mutations in endocrine + chemo ± any treated patients remained significant stratifiers.
Given its importance as an emerging biomarker for response to immune checkpoint therapy (Goodman et al, 2017), we investigated whether TMB could also provide response information with respect to conventional treatment regimens (Fig 7). When stratified into TMB‐high and TMB‐low by the SCAN‐B cohort median TMB per rnaMB, low TMB was favorable to OS independent of treatment across the cohort (HR, 1.54 [1.28–1.86], P = 0.0000033), as well as in patients not systemically treated (HR: 2.53, [1.58–4.05], P = 0.000066), treated with endocrine therapy only (HR: 1.55 [1.22–1.98], P = 0.00036), endocrine ± any therapy (HR: 1.4 [1.12–1.74], P = 0.0028), and chemotherapy ± any therapy (HR: 1.66 [1.12–2.47], P = 0.011). High TMB is typically associated with improved survival in TNBC, possibly due to increased neoantigen load enabling a stronger immune response. However, we observed no such effect in TNBC patients within the SCAN‐B cohort (P = 0.34, Fig EV5). Mutational load was a significant survival stratifier across the Nottingham Histological Grade (NHG) grading scheme (G1, HR: 0.38 [0.16–0.9], P = 0.022; G2, HR: 1.46 [1.1–1.94], P = 0.0078; G3, HR: 1.53 [1.13–2.07], P = 0.0055), and within the ER+ (HR: 1.41 [1.15–1.74], P = 0.00097), PgR+ (HR: 1.28 [1.02–1.59], P = 0.031), HER2− (HR: 1.53 [1.25–1.86], P = 0.000024), and Ki67‐high (HR: 1.76 [1.17–2.65], P = 0.0064) patient subgroups (Fig EV5). Interestingly, LumB patients with high TMB showed worse survival (HR: 1.58 [1.13–2.21], P = 0.0064), whereas TMB was not a significant stratifier for any other molecular subtype (Fig EV5). LumB tumors were also the only subgroup where TMB remained a significant stratifier in multivariable analysis.
Figure 7. Impact of tumor mutational burden on overall survival across treatment groups.
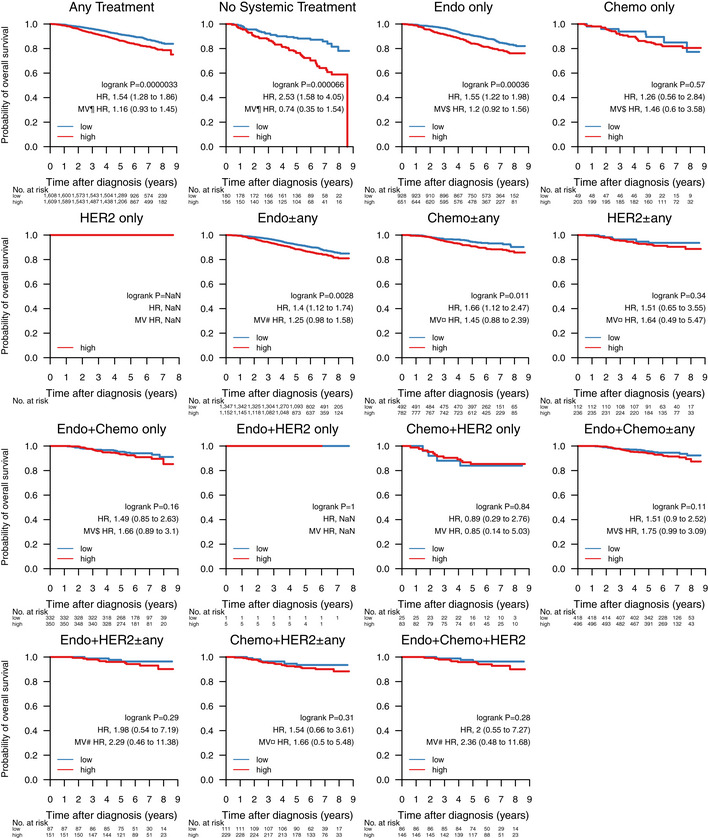
Overall survival stratified by tumor mutational burden (TMB) across treatment groups in 3,217 patients. Samples were classified as TMB‐high if the amount of non‐synonymous mutations per expressed MB (rnaMB) was ≥ the median number of non‐synonymous mutations per rnaMB across the whole SCAN‐B cohort (0.082 mutations per rnaMB) and TMB‐low otherwise. In each Kaplan–Meier plot, TMB‐low cases are plotted in blue, TMB‐high cases are plotted in red, the log‐rank P value is given, and the hazard ratio (HR) for TMB high is given with a 95% CI and after univariable and multivariable (MV) Cox regression adjustment. Covariables included in the MV analysis were age at diagnosis, lymph node status, tumor size, and the variables denoted by the following symbols: ¶, ER, PgR, HER2, and NHG; ¤, ER, PgR, and NHG; $, HER2 and NHG; #, NHG. ER, estrogen receptor; HER2, human epidermal growth factor receptor 2; HoR, hormone receptor; NHG, Nottingham histological grade; PgR, progesterone receptor; TMB, tumor mutational burden; TNBC, triple‐negative breast cancer.
Figure EV5. Impact of tumor mutational burden on overall survival across clinical subgroups.
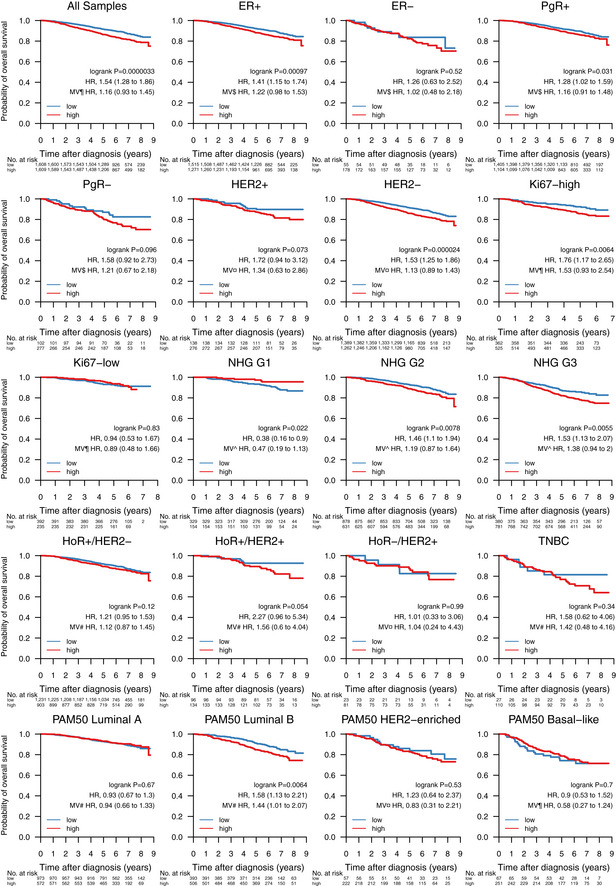
Association of tumor mutational burden (TMB) with overall survival in 3,217 patients, and within the biomarker patient subgroups ER+, ER−, PgR+, PgR−, HER2 amplified, HER2 normal, Ki67‐high, Ki67‐low, NHG Grade 1–3, HoR+/HER2−, HoR+/HER2+, HoR−/HER2+, TNBC, and molecular subtypes Luminal A and B, HER2‐enriched, and basal‐like according to the PAM50 gene list. In each Kaplan–Meier plot, TMB‐low cases are plotted in blue, TMB‐high cases are plotted in red, the log‐rank P value is given, and the hazard ratio (HR) for TMB‐high is given with a 95% CI and after univariable and multivariable (MV) Cox regression adjustment. Covariables included in the MV analysis were age at diagnosis, lymph node status, tumor size, and the variables denoted by the following symbols: ¶, ER, PgR, HER2, and NHG; ^, ER, PgR, HER2; ¤, ER, PgR, and NHG; $, HER2 and NHG; #, NHG. ER, estrogen receptor; HER2, human epidermal growth factor receptor 2; HoR, hormone receptor; NHG, Nottingham histological grade; PgR, progesterone receptor; TMB, tumor mutational burden; TNBC, triple‐negative breast cancer.
SCAN‐B MutationExplorer
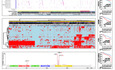
To enable public exploration and re‐use of our rich mutational dataset, we developed the web‐based application SCAN‐B MutationExplorer (available at http://oncogenomics.bmc.lu.se/MutationExplorer; Fig 8). With this interactive application, a user can filter the 3,217 SCAN‐B samples based on combinations of clinicopathological and molecular markers (histological type, ER, PgR, HER2, Ki67, NHG, and PAM50 subtype), treatments (endocrine, chemotherapy, HER2 treatment), and mutations based on mutation type (e.g., nonsense or missense) and COSMIC occurrence. From the filtered data, the user can create mutational landscape waterfall plots and conduct survival analysis using KM analysis and log‐rank tests based on mutations in single genes, pathways as defined in the Reactome database or custom, as well as TMB, either using the absolute number of mutations, or mutations per expressed MB of genome, using a user‐defined threshold. Mutations can also be plotted from a protein point of view using user‐defined occurrence cutoffs for showing and annotating mutations. Plots in PDF format as well as the mutation set underlying the currently active plot in tab‐separated values (TSV) format can be downloaded for further analysis. The application is based on R Shiny and the source code is available under the BSD 2‐clause open source license at http://github.com/cbrueffer/MutationExplorer.
Figure 8. The SCAN‐B MutationExplorer.
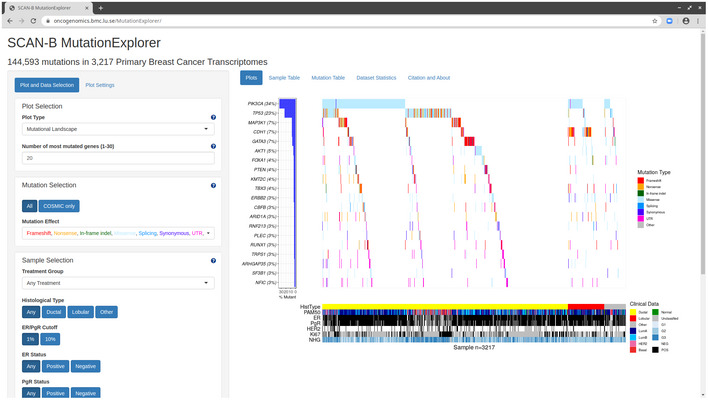
The SCAN‐B MutationExplorer web‐based application for interactive exploration of mutations, and their association with clinicopathological subgroups and overall survival. As an example, generation of the image used in Fig 2 is shown.
Discussion
Tumor somatic mutation status is a crucial piece of information for the future of precision medicine to guide treatment selection and give insight into tumor evolution. Analysis of DNA is the gold standard for detecting SNVs, indels, and larger structural variants. However, many interesting tumor properties are only accessible on the transcriptome level and cannot be interrogated using DNA; most prominently gene expression at the isoform and gene level, as well as de novo transcripts originating from gene fusions. The SCAN‐B initiative (Saal et al, 2015) decided early on to perform RNA‐seq on the tumors of all enrolled patients. Based on this, we have developed, refined, and benchmarked gene expression signatures (Brueffer et al, 2018; Dihge et al, 2019; Lundgren et al, 2019; Søkilde et al, 2019; Vallon‐Christersson et al, 2019), and detected recurring fusions affecting miRNAs (Persson et al, 2017). Herein, we described the development of a pipeline for detection of somatic SNVs and indels based on RNA‐seq, adding another layer to information that can now be obtained from a single sequencing analysis within 1 week of surgery (Saal et al, 2015).
To date, several approaches for RNA‐seq mutation calling, mostly in combination with matched DNA, have been developed (Horvath et al, 2013; Piskol et al, 2013; Radenbaugh et al, 2014; Wilkerson et al, 2014; Guo et al, 2017; Siegel et al, 2018); however, calling from RNA‐seq alone, particularly from tumor‐only samples, is still a challenge. With the advance of targeted and whole exome sequencing into the clinics, and efforts such as TCGA, MSK‐Impact, and others, variant calling from DNA‐seq has improved in recent years, although discordance between detection pipelines still exists (Hofmann et al, 2017; Ellrott et al, 2018; Shi et al, 2018). Part of this improvement is the availability of validation resources such as the Genome in a Bottle datasets (Zook et al, 2016). With clinical interest in RNA‐seq only recently picking up, e.g., as shown by two recent review articles (Byron et al, 2016; Cieślik & Chinnaiyan, 2018), comparably well‐characterized RNA‐seq datasets for validation do not yet exist to our knowledge.
The strategy for mutation calling herein was to perform initial variant calling with low requirements on coverage and base quality to increase sensitivity while allowing false positives. To increase specificity, we then applied stringent post hoc filtering that can be easily amended as further annotation data become available, or as existing sources receive updates. The advantage of this two‐step strategy is the possibility to accommodate different research and clinical questions in the future that may have different filtering needs.
Two major contributors of false‐positive mutation calls are germline SNPs/indels and RNA editing. Common approaches for dealing with germline events are calling mutations from matched tumor/normal samples, or filtering SNPs present in databases such as dbSNP. The latter is problematic, since some dbSNP entries with a low variant allele frequency (VAF) may be legitimate somatic mutations. On the other hand, filtering on the dbSNP “common” flag (at least 1% VAF in any of the 1,000 genomes populations) can lead to many low‐VAF germline SNPs remaining. We tried to address this issue by combining the dbSNP and COSMIC databases, and only filtering variants present in dbSNP if they were not present in COSMIC. We filtered out known RNA editing sites using publicly available databases; however, there is still an overabundance of T>C substitutions in our RNA‐based calls compared to DNA‐based calls, suggesting many unknown editing sites and insufficient filtering (Fig 2B). Approaches have been developed to identify RNA editing sites using DNA/RNA‐trained machine learning models (Sun et al, 2016) or RNA‐seq data alone (Ramaswami et al, 2013), which may provide ways to improve filtering in the future by creating a SCAN‐B RNA editing database.
The overall landscape of somatic mutations in our study looked similar to that reported previously from DNA (The Cancer Genome Atlas, 2012; Pereira et al, 2016), with the two most frequently mutated genes PIK3CA (34% of samples) and TP53 (23%), followed by other known drivers MAP3K1 (7%), CDH1 (7%), GATA3 (7%), and AKT1 (5%) (Fig 2). While mutation frequencies in oncogenes such as PIK3CA are generally in line with previous reports, frequencies in tumor suppressor genes were generally lower in RNA‐seq than would be expected from our study population. For example, our TP53 RNA‐seq somatic mutation frequency of 23% (reference: 36%, cBioPortal.org) suggests we may be missing a significant fraction of TP53 mutations present in DNA. Similar trends can be seen in PTEN (observed: 3.6%, reference: 4.6%), BRCA1 (observed: 0.2%, reference: 1.6%), and BRCA2 (observed: 0.03%, reference: 2.2%). This is not surprising since only mutations in sufficiently highly expressed genomic regions can be detected by RNA‐seq and loss of expression of tumor suppressor genes is a hallmark of oncogenesis. Furthermore, truncated mRNAs caused by nonsense mutations are typically removed by nonsense‐mediated decay before they can be captured for sequencing. Thus, our findings do not reflect the true mutational spectrum of tumor suppressor genes. Despite these limitations, we could identify a putative mutation in at least one gene targeted by an existing drug in the majority of patient tumors (86.8%), demonstrating that it should be feasible to match most patients to targeted treatments using RNA‐seq analyses.
One of the major oncogenic pathways in breast cancer is PI3K/AKT/mTOR, which is frequently upregulated by activating mutations in PIK3CA, MAP3K1, and AKT1, or inactivating mutations in PTEN, leading to increased growth signaling. This pathway is being targeted by multiple drugs, such as alpelisib (Novartis) (Juric et al, 2018) in HoR+/HER2− PIK3CA mutant tumors in combination with fulvestrant (André et al, 2019), and the AKT1 inhibitor AZD5363 (AstraZeneca) (Hyman et al, 2017). The strength of RNA‐seq in mutation profiling lies within oncogenes, and we demonstrate that alterations in drug targets such as PIK3CA and AKT, as well as genes potentially modulating drug efficacy, such as MAP3K1, can be detected. Eventually, RNA‐seq may be used as companion diagnostic for oncogene‐targeting drugs such as these. While we also detected mutations in PTEN, these only showed significant prognostic power when combined with low gene expression in the PTEN‐MutExp low group, suggesting either SNVs and indels are a minor mechanism of PTEN loss in early BC compared to structural rearrangements (Saal et al, 2008), and other means of PTEN expression loss. Taken together, we detected mutations in multiple PI3K/AKT/mTOR signaling nodes that lead to increased pathway activation and have emerging clinical utility in luminal BC, e.g., through combination with EGFR inhibition as demonstrated in basal‐like BC (She et al, 2016).
Loss of p53 activity, either through LoF mutations, dominant‐negative mutations, or low expression, is a major contributor to tumorigenesis. While RNA‐seq generally underdetects TP53 mutations, the identified hot spot residues remain the same as reported in the IARC TP53 database. Clinically these mutations could already be actionable, as TP53 mutations are a sign of DNA damage repair deficiency and may be prognostic for sensitivity to PARP inhibition (Holstege et al, 2010; Severson et al, 2015). Patients with TP53‐mutant tumors had significantly worse OS in the patient subgroups treated only with endocrine therapy, or no systemic treatment at all (Fig 5), and HoR+/HER2− patients (Fig EV2), suggesting that TP53 mutations identify a subgroup of patients that are spared chemotherapy or systemic therapy overall by appearing low risk, but are in fact high‐risk patients that should be treated accordingly.
Endocrine treatment is the most important first‐line treatment in BC. Resistance to these treatments leads to disease progression and recurrence and has been studied extensively. Drivers for endocrine resistance include activating mutations in ESR1 and ERBB2 which have been studied mostly in the metastatic setting. We show that mutations in these genes already occur in early, untreated BC, with 177 (5.5%) of patients in our population‐based cohort having a mutation in either gene. We further demonstrate that patients with these mutations that received only endocrine treatment have inferior OS, suggesting drug resistance. Detecting these patients early could open up additional treatment options that have shown efficacy in the metastatic setting, such as selective estrogen receptor degraders (SERDs) in ESR1‐mutated tumors, or TKIs such as neratinib in ERBB2‐mutated BC.
The role of alternative splicing in tumorigenesis has recently garnered increased attention, and the extend of isoform switching in several cancer types, including BC, has been characterized (Vitting‐Seerup & Sandelin, 2017). Mutations such as the SF3B1 K700E hot spot mutation deregulate splicing and result in differential splicing patterns in BC (Maguire et al, 2015). The clinical effect of these mutations is unclear, and we did not detect significant survival stratification in important biomarker or treatment groups. However, the fact that mutations in splicing‐related genes can be detected from RNA‐seq make this method attractive for research and possible clinical use, as they can be correlated with expression originating from the same sequencing experiment.
Individual mutations, particularly in infrequently mutated genes, affect a smaller number of molecular pathways to achieve the classical hallmarks of cancer such as sustained proliferative signaling. Mutation status of several individual pathways was associated with reduced OS in different treatment subgroups. In patients not systemically treated or only treated with endocrine therapy WNT, NOTCH2, p53‐independent DNA repair pathway mutation status, and Hedgehog signaling mutation status may identify patients diagnosed as low risk who may benefit from more adjuvant treatment (Fig 6). While these stratification profiles were visible in treatment subgroups, they mostly did not yield significant results in clinical biomarker subgroups (Fig EV3). This may indicate that current risk stratification in histopathological biomarker subgroups is inadequate and should take molecular information into account—something we and others have also shown on the level of gene expression (Brueffer et al, 2018). Identifying the mutation status of pathways and pathway clusters may aid in future clinical trials and treatment, e.g., by aiding selection of treatments that exploit synthetic lethality (Weidle et al, 2011).
High TMB has been identified as a predictive biomarker for response to immune checkpoint therapy in diverse solid tumors (Goodman et al, 2017; Lauss et al, 2017; Hellmann et al, 2018; Thomas et al, 2018; Zacharakis et al, 2018). Using RNA‐seq to assess mutational burden may be a useful capability for clinical trials and eventual clinical implementation in BC (Schmid et al, 2018). Questions remain however, as TMB is influenced by many biological and technical factors such as ploidy, tumor heterogeneity and clonality (Conroy et al, 2019), sample tumor cell content, sequencing depth, and variant filtering. Which cutoff to use for stratifying patients into TMB groups is also still emerging (Panda et al, 2017; Schmid et al, 2018), and specifically has not been addressed to our knowledge in RNA‐seq data. Due to this, and to account for different expression profiles per tumor, we decided to use the median number of non‐synonymous mutations per MB of transcriptome across the cohort to stratify patients into TMB‐high and TMB‐low groups and use it to study OS in different conventional treatment and biomarker subgroups. In several of these groups, high TMB was significantly associated with worse survival, confirming previous reports (Xu et al, 2018), however interestingly not in TNBC. These tumors typically show higher TMB than other clinical BC subtypes, likely because many of them have impaired DNA damage repair mechanisms. Shah and colleagues (Shah et al, 2012) showed that only ~ 36% of mutations in TNBCs are expressed; we speculate that due to this, we may underestimate TMB in several of our TMB‐low patients. Additionally, RNA‐seq underdetects truncating mutations such as frameshift indels that are a major source of neoantigens. Immune checkpoint therapy is a particularly attractive treatment approach in patients with TNBC and basal‐like tumors for which currently no targeted therapy exists. For these patients, determination of TMB using DNA‐seq may be a better option than relying on RNA‐seq.
Large‐scale projects such as TCGA and SCAN‐B generate vast amounts of data, but bioinformatics skills are required to make efficient use of them. Web portals such as cBioPortal (Cerami et al, 2012) have emerged to make these huge datasets explorable without specialized skills. In this spirit, we developed the open source web application SCAN‐B MutationExplorer to make our mutation dataset easily accessible for other researchers. We hope that SCAN‐B MutationExplorer will aid knowledge generation and the development of better BC biomarkers in the future. The open source nature of the portal allows developers to adopt the code for their own purposes, and we welcome contributions of any kind.
Limitations
The mutation calling we have performed herein tries to achieve sensitive variant calling by using lenient parameters, and heavy filtering of the resulting variants based on stringent quality factors, annotations, and curated databases. This approach has several limitations. While our 275 patient cohort for filter development had matched tumor and normal DNA sequencing data, the SCAN‐B cohort only consisted of tumor RNA‐seq data. This made accounting for PCR and sequencing artifacts more challenging. Further while many germline events can be filtered by comparing to general databases such as dbSNP, and population‐specific ones such as SweGen, these databases are incomplete, and it is thus not possible to remove all germline events this way. As these databases improve, our filters can be upgraded to increase performance. Herein, we also applied filters developed in a matched DNA/RNA set of targeted capture sequencing of 1,697 genes and 1,047 miRNAs (275 sample ABiM cohort) to whole mRNA‐seq (3,217 sample SCAN‐B cohort). This assumes the transcriptional characteristics of the captured regions are representative for the whole mRNA.
Conclusion
In summary, we present a tumor‐only RNA‐seq variant calling strategy and resulting mutation dataset from a large population‐based early breast cancer cohort. Although variant calling from RNA‐seq data is limited to expressed regions of the genome, mutations in important BC genes such as PIK3CA, TP53, and ERBB2, as well as pathways can be reliably detected, which may be used to inform clinical trials and eventual reporting to the clinic. Mutations in TP53, PIK3CA, ERBB2, and PTEN provided prognostic information in several treatment and biomarker patient subgroups, demonstrating the utility of the dataset for research. We make this dataset available for analysis and download via the open source web application SCAN‐B MutationExplorer, accessible at http://oncogenomics.bmc.lu.se/MutationExplorer.
Materials and Methods
Patients
The study was approved by the Regional Ethics Review Board of Lund at Lund University (diary numbers 2007/155, 2009/658, 2009/659, 2010/383, 2012/58, 2013/459). We analyzed data from two previously described cohorts. For 273 patients, including two patients with bilateral disease (thus 275 tumors), enrolled in the All Breast Cancer in Malmö (ABiM) study from 2007 to 2009, matched snap‐frozen primary breast tumor tissue and blood samples were collected as previously described (Winter et al, 2016). A cohort of 3,273 SCAN‐B primary breast tumors described previously (Brueffer et al, 2018) was reduced to 3,217 samples following additional quality controls. All patients provided informed consent, and the study conforms to the WMA Declaration of Helsinki and the Department of Health and Human Services Belmont Report. Tissue collection, preservation in RNAlater, sequencing, expression estimation, and molecular subtyping using the PAM50 gene list were performed as previously reported (Saal et al, 2015; Brueffer et al, 2018). Clinical records were retrieved from the Swedish National Cancer Registry (NKBC). Estrogen receptor (ER) and progesterone receptor (PgR) status was categorized using an immunohistochemical staining cutoff of 1%. Patients in the SCAN‐B cohort had median 74.5 months follow‐up, and patient demographics for both cohorts are detailed in Table 3.
Table 3.
Patient demographics and clinicopathological variables in the ABiM and SCAN‐B cohorts
| ABiM cohort (275 Samples) | SCAN‐B cohort (3,217 Samples) | |||
|---|---|---|---|---|
| Patient count | Percent (%) | Patient count | Percent (%) | |
| Age (years) | ||||
| <50 | 64 | 23.3 | 597 | 18.6 |
| ≥50 | 211 | 76.7 | 2,620 | 81.4 |
| Tumor size (mm) | ||||
| ≤20 | 145 | 52.7 | 2,080 | 64.7 |
| 21–50 | 120 | 43.6 | 1,018 | 31.6 |
| >50 | 6 | 2.2 | 77 | 2.4 |
| Missing | 3 | 1.1 | 42 | 1.3 |
| Positive lymph nodes (number) | ||||
| 0 | 151 | 54.9 | 1,974 | 61.4 |
| 1–3 | 60 | 21.8 | 851 | 26.5 |
| ≥4 | 44 | 16.0 | 290 | 9.0 |
| Missing | 20 | 7.3 | 102 | 3.2 |
| Histological type | ||||
| Ductal | 215 | 78.2 | 2,602 | 80.9 |
| Lobular | 23 | 8.4 | 386 | 12.0 |
| Other | 28 | 10.2 | 229 | 7.1 |
| Missing | 9 | 3.3 | 0 | 0.0 |
| ER status (1% cutoff) | ||||
| Positive | 223 | 81.1 | 2,786 | 86.6 |
| Negative | 48 | 17.5 | 233 | 7.2 |
| Missing | 4 | 1.5 | 198 | 6.2 |
| PgR status (1% cutoff) | ||||
| Positive | 204 | 74.2 | 2,509 | 78.0 |
| Negative | 64 | 23.3 | 379 | 11.8 |
| Missing | 7 | 2.5 | 329 | 10.2 |
| HER2 status | ||||
| Positive | 44 | 16.0 | 414 | 12.9 |
| Negative | 197 | 71.6 | 2,651 | 82.4 |
| Missing | 34 | 12.4 | 152 | 4.7 |
| Nottingham histological grade | ||||
| Grade 1 | 31 | 11.3 | 483 | 15.0 |
| Grade 2 | 97 | 35.3 | 1,509 | 46.9 |
| Grade 3 | 146 | 53.1 | 1,161 | 36.1 |
| Missing | 1 | 0.4 | 64 | 2.0 |
| Ki67 status | ||||
| High | 109 | 39.6 | 887 | 27.6 |
| Low | 153 | 55.6 | 627 | 19.5 |
| Missing | 13 | 4.7 | 1,703 | 52.9 |
| Molecular subtype | ||||
| Luminal A | 109 | 39.6 | 1,545 | 48.0 |
| Luminal B | 83 | 30.2 | 899 | 27.9 |
| HER2‐enriched | 30 | 10.9 | 279 | 8.7 |
| Basal‐like | 35 | 12.7 | 318 | 9.9 |
| Normal‐like | 13 | 4.7 | 112 | 3.5 |
| Unclassified | 5 | 1.8 | 64 | 2.0 |
Library preparation and sequencing
For the 275 sample ABiM cohort, tumor and normal DNA was sequenced using a custom targeted capture panel of 1,697 genes and 1,047 miRNAs as described (Winter et al, 2016). For the same tumors, RNA‐seq was performed as described (Brueffer et al, 2018) (a subset of the 405 sample cohort therein). In short, strand‐specific dUTP libraries were prepared and sequenced on an Illumina HiSeq 2000 sequencer to an average of 50 million 101 bp reads per sample (Parkhomchuk et al, 2009; Saal et al, 2015).
For the 3,217 sample SCAN‐B cohort, RNA‐seq data were generated as previously described (Brueffer et al, 2018). In short, strand‐specific dUTP mRNA‐seq libraries were prepared (Parkhomchuk et al, 2009; Saal et al, 2015), and an average 38 million 75 bp reads were sequenced on an Illumina HiSeq 2000 or NextSeq 500 instrument (Table EV1).
Sequence data processing
For tumor and normal DNA, reads were aligned to the GRCh37 reference genome using Novoalign 2.07.18 (Novocraft Technologies, Malaysia). Using a modified version of the variant workflow of the bcbio‐nextgen NGS framework (https://github.com/bcbio/bcbio-nextgen, modified version https://github.com/cbrueffer/bcbio-nextgen/tree/v1.0.2-scanb-calling) utilizing Bioconda for software management (Grüning et al, 2018), duplicate reads were marked using biobambam v2.0.62 (Tischler & Leonard, 2014) and variants were called from paired tumor/normal samples using VarDict‐Java 1.5.0 (Lai et al, 2016) (with default options except ‐f 0.02 ‐N ${SAMPLE} ‐b ${BAM_FILE} ‐c 1 ‐S 2 ‐E 3 ‐g 4 ‐Q 10 ‐r 2 ‐q 20), which internally performs local realignment around indels. Variant coordinates were converted to the GRCh38 reference genome using CrossMap 2.5 (Zhao et al, 2014). Raw RNA‐seq reads were trimmed and filtered as described previously (Brueffer et al, 2018) and then processed using the modified bcbio‐nextgen 1.0.2 variant workflow. Reads were aligned to a version of the GRCh38.p8 reference genome that included alternative sequences and decoys and was patched with dbSNP Build 147 common SNPs, and the GENCODE 25 transcriptome model using HISAT2 2.0.5 (Kim et al, 2015) (with default options except ‐‐rna‐strandness RF ‐‐rg‐id ${ID_NAME} ‐‐rg PL:illumina ‐‐rg PU:${UNIT} ‐‐rg SM:${SAMPLE}). BAM index files were generated using Sambamba 0.6.6 (Faust & Hall, 2014), and duplicate reads were marked using SAMBLASTER 0.1.24 (Tarasov et al, 2015). Variants were called using VarDict‐Java 1.5.0 with default options except ‐f 0.02 ‐N ${SAMPLE} ‐b ${BAM_FILE} ‐c 1 ‐S 2 ‐E 3 ‐g 4 ‐Q 10 ‐r 2 ‐q 20 callable_bed, where callable_bed was a sample‐specific BED file containing all regions of depth ≥ 4.
All variants were annotated using a Snakemake (Köster & Rahmann, 2012) workflow around vcfanno 0.3.1 (Pedersen et al, 2016) and the data sources dbSNP v151 (Sherry et al, 2001), Genome Aggregation Database (gnomAD) (Karczewski et al, 2020), Catalogue of Somatic Mutations in Cancer (COSMIC) v87 (Forbes et al, 2015; Sondka et al, 2018), CIViC (Griffith et al, 2017), MyCancerGenome (release March 2016, http://www.mycancergenome.org), SweGen version 20171025 (Ameur et al, 2017), the Danish Genome Project population reference (Maretty et al, 2017), RNA editing databases (Kiran & Baranov, 2010; Ramaswami & Li, 2014; Sun et al, 2016; Picardi et al, 2017), UCSC low complexity regions, IntOGen breast cancer driver gene status (Gonzalez‐Perez et al, 2013) (accessed 2018‐08‐02), and the drug gene interaction database (DGIdb) v3.0.2 (Cotto et al, 2017). We used SnpEff v4.3.1t (with default parameters except hg38 ‐t ‐canon) (Cingolani et al, 2012b) to predict functional variant impact on canonical transcripts as defined by SnpEff.
To filter out recurrent artifacts introduced during library preparation or sequencing, we constructed a panel of “normal” tissues consisting of all variants enumerated from RNA‐seq analysis of adjacent non‐tumoral breast tissues sampled from 10 SCAN‐B patients.
Gene expression data in fragments per kilobase of transcript per million mapped reads (FPKM) for the ABiM and SCAN‐B cohorts were generated as previously reported and is available from the NCBI Gene Expression Omnibus, accession GSE81540 (Brueffer et al, 2018).
Variant filtering
The strategy we applied for developing DNA‐seq‐informed filters is outlined in Fig 1. Due to the lenient settings used for sensitive initial variant calling, we developed and applied rigid filters to reduce false‐positive calls resulting from either sequencing or PCR artifacts, RNA editing, or germline variants. To this end, variants called from 275 matched tumor/normal targeted capture DNA datasets were filtered, among other parameters, for low complexity regions, SNP status (dbSNP “common”, SweGen and COSMIC SNPs, high gnomAD allele frequency), allele frequency ≥ 0.05, depth ≥ 8, homopolymer environments, and RNA editing sites. Using the resulting DNA variants as reference, we developed filters for the 275 sample RNA‐seq variants by permuting values of the sequencing, variant calling, and annotation variables, and for each permutation calculating the concordance to the DNA mutations. Following these “negative” filters, we applied a range of “positive” filters to rescue filtered variants, e.g., to retain a variant if it is present in the curated MyCancerGenome database of clinically important mutations. Finally, we selected the combination of “negative” and “positive” filter settings with the best balance of sensitivity and specificity. Using SnpSift (Cingolani et al, 2012a), we applied the filters to RNA‐seq mutation calls from the 3,217 patient cohort. A complete list of final filter variables and values for both the tumor/normal DNA variant calls, as well as the RNA‐seq variant calls can be found in Table EV6.
Data analysis
All analyses were performed using R 3.5.1. Waterfall, heatmap, and lollipop plots were made using the GenVisR 1.14.2 (Skidmore et al, 2016), pheatmap 1.0.12, and RTrackLayer 1.42.1 packages. Substitution signatures were analyzed using the MutationalPatterns 1.8.0 package (Blokzijl et al, 2018). Survival analysis was conducted using OS as endpoint. Overall survival was analyzed using the Kaplan–Meier (KM) method, two‐sided log‐rank tests, and Cox models, all implemented in the survival 2.44‐1.1 package. Multivariable Cox models included the variables age at diagnosis, lymph node status, and tumor size as covariables, as well as ER, PgR, HER2, and NHG as relevant. All models were checked for proportional hazards using Grambsch and Therneau's test for non‐proportionality and Schoenfeld residuals (Grambsch and Therneau, 1994). Associations were tested using one‐tailed and two‐tailed Fisher's exact test. P‐values < 0.05 were considered significant. The web application SCAN‐B MutationExplorer was written in R using the Shiny, GenVisR, and SurvMiner packages.
Author contributions
CB, CW, and LHS conceived the study. CB, SG, CW, JV‐C, JH, AMG, YC, NL, and LHS analyzed data. JV‐C, CH, JH, AE, CL, NL, MM, LR, ÅB, and LHS established the SCAN‐B initiative. CB, CW, and LHS established the DNA‐seq analyses. CB, SG, and LHS established the RNA‐seq mutation calling pipeline and filters. JV‐C, CH, JH, AE, CL, NL, MM, LR, ÅB, and LHS provided clinical information. LHS supervised the project, and CB and LHS wrote the report with assistance from all authors. All authors discussed, critically revised, and approved the final version of the report for publication.
Conflict of interest
CB, SG, AMG, YC, and LHS are shareholders and/or employees of SAGA Diagnostics AB. LHS has received honorarium from Novartis and Boehringer‐Ingelheim. All remaining authors have declared no conflicts of interest.
Supporting information
Expanded View Figures PDF
Table EV1
Table EV2
Table EV3
Table EV4
Table EV5
Table EV6
Review Process File
Acknowledgements
We thank the patients who were part of this study and the SCAN‐B study, the employees of the SCAN‐B laboratory, the South Sweden Breast Cancer Group, and all SCAN‐B collaborators at Hallands Hospital Halmstad, Helsingborg Hospital, Blekinge County Hospital, Central Hospital Kristianstad, Skåne University Hospital Lund/Malmö, Central Hospital Växjö, for inclusion of patients and sampling of tissue for this study. We also thank the Swedish National Breast Cancer Registry and Regional Cancer Center South for clinical data. The SweGen allele frequency data were generated by Science for Life Laboratory. This work was supported by the Mrs. Berta Kamprad Foundation (to ÅB, LHS) and funded in part by the Swedish Research Council (ÅB, LHS), Swedish Cancer Society (ÅB, LHS), Swedish Foundation for Strategic Research (ÅB), Knut and Alice Wallenberg Foundation (ÅB), VINNOVA (ÅB), Governmental Funding of Clinical Research within National Health Service (ALF) (ÅB, LHS), Scientific Committee of Blekinge County Council (AE), Crafoord Foundation (LHS), Lund University Medical Faculty (LHS), Gunnar Nilsson Cancer Foundation (LHS), Skåne University Hospital Foundation (LHS), BioCARE Research Program (LHS), King Gustav Vth Jubilee Foundation (LHS), and the Krapperup Foundation (LHS).
EMBO Mol Med (2020) 12: e12118
Data availability
The datasets produced and used in this study are available in the following databases:
Clinical data and mutation calls: http://oncogenomics.bmc.lu.se/MutationExplorer
Gene expression data: NCBI Gene Expression Omnibus GSE81540 (https://www.ncbi.nlm.nih.gov/geo/query/acc.cgi?acc=GSE81540; Brueffer et al, 2018).
Raw patient sequencing data cannot be provided due to Swedish data protection laws.
References
- Alsafadi S, Houy A, Battistella A, Popova T, Wassef M, Henry E, Tirode F, Constantinou A, Piperno‐Neumann S, Roman‐Roman S et al (2016) Cancer‐associated SF3B1 mutations affect alternative splicing by promoting alternative branchpoint usage. Nat Commun 7: 10615 [DOI] [PMC free article] [PubMed] [Google Scholar]
- Ameur A, Dahlberg J, Olason P, Vezzi F, Karlsson R, Martin M, Viklund J, Kähäri AK, Lundin P, Che H et al (2017) SweGen: a whole‐genome data resource of genetic variability in a cross‐section of the Swedish population. Eur J Hum Genet 25: 1253–1260 [DOI] [PMC free article] [PubMed] [Google Scholar]
- André F, Ciruelos E, Rubovszky G, Campone M, Loibl S, Rugo HS, Iwata H, Conte P, Mayer IA, Kaufman B et al (2019) Alpelisib for PIK3CA‐mutated, hormone receptor‐positive advanced breast cancer. N Engl J Med 380: 1929–1940 [DOI] [PubMed] [Google Scholar]
- Avivar‐Valderas A, McEwen R, Taheri‐Ghahfarokhi A, Carnevalli LS, Hardaker EL, Maresca M, Hudson K, Harrington EA, Cruzalegui F (2018) Functional significance of co‐occurring mutations in PIK3CA and MAP3K1 in breast cancer. Oncotarget 9: 21444–21458 [DOI] [PMC free article] [PubMed] [Google Scholar]
- Bader AG, Kang S, Vogt PK (2006) Cancer‐specific mutations in PIK3CA are oncogenic in vivo . Proc Natl Acad Sci USA 103: 1475–1479 [DOI] [PMC free article] [PubMed] [Google Scholar]
- Ben‐Baruch E, Bose R, Kavuri SM, Ma CX, Ellis MJ (2015) HER2‐mutated breast cancer responds to treatment with single‐agent neratinib, a second‐generation HER2/EGFR tyrosine kinase inhibitor. J Natl Compr Canc Netw 13: 1061–1064 [DOI] [PMC free article] [PubMed] [Google Scholar]
- Blokzijl F, Janssen R, Boxtel RV, Cuppen E (2018) MutationalPatterns: comprehensive genome‐wide analysis of mutational processes. Genome Med 10: 33 [DOI] [PMC free article] [PubMed] [Google Scholar]
- Bose R, Kavuri SM, Searleman AC, Shen W, Shen D, Koboldt DC, Monsey J, Goel N, Aronson AB, Li S et al (2013) Activating HER2 mutations in HER2 gene amplification negative breast cancer. Cancer Discov 3: 224–237 [DOI] [PMC free article] [PubMed] [Google Scholar]
- Bouaoun L, Sonkin D, Ardin M, Hollstein M, Byrnes G, Zavadil J, Olivier M (2016) TP53 variations in human cancers: new lessons from the IARC TP53 database and genomics data. Hum Mutat 37: 865–876 [DOI] [PubMed] [Google Scholar]
- Brueffer C, Vallon‐Christersson J, Grabau D, Ehinger A, Häkkinen J, Hegardt C, Malina J, Chen Y, Bendahl P‐O, Manjer J et al (2018) Clinical value of RNA sequencing‐based classifiers for prediction of the five conventional breast cancer biomarkers: a report from the population‐based multicenter sweden cancerome analysis network—breast initiative. JCO Precis Oncol 2: 1–18 [DOI] [PMC free article] [PubMed] [Google Scholar]
- Byron SA, Van Keuren‐Jensen KR, Engelthaler DM, Carpten JD, Craig DW (2016) Translating RNA sequencing into clinical diagnostics: opportunities and challenges. Nat Rev Genet 17: 257–271 [DOI] [PMC free article] [PubMed] [Google Scholar]
- Cerami E, Gao J, Dogrusoz U, Gross BE, Sumer SO, Aksoy BA, Jacobsen A, Byrne CJ, Heuer ML, Larsson E et al (2012) The cBio Cancer Genomics Portal: an open platform for exploring multidimensional cancer genomics data. Cancer Discov 2: 401–404 [DOI] [PMC free article] [PubMed] [Google Scholar]
- Cheng DT, Mitchell TN, Zehir A, Shah RH, Benayed R, Syed A, Chandramohan R, Liu ZY, Won HH, Scott SN et al (2015) Memorial Sloan Kettering‐integrated mutation profiling of actionable cancer targets (MSK‐IMPACT): a hybridization capture‐based next‐generation sequencing clinical assay for solid tumor molcular oncology. J Mol Diagn 17: 251–264 [DOI] [PMC free article] [PubMed] [Google Scholar]
- Cieślik M, Chinnaiyan AM (2018) Cancer transcriptome profiling at the juncture of clinical translation. Nat Rev Genet 19: 93–109 [DOI] [PubMed] [Google Scholar]
- Cingolani P, Patel VM, Coon M, Nguyen T, Land SJ, Ruden DM, Lu X (2012a) Using Drosophila melanogaster as a model for genotoxic chemical mutational studies with a new program, SnpSift. Front Genet 3: 35 [DOI] [PMC free article] [PubMed] [Google Scholar]
- Cingolani P, Platts A, Coon M, Nguyen T, Wang L, Land SJ, Lu X, Ruden DM (2012b) A program for annotating and predicting the effects of single nucleotide polymorphisms, SnpEff: SNPs in the genome of Drosophila melanogaster strain w1118; iso‐2; iso‐3. Fly 6: 80–92 [DOI] [PMC free article] [PubMed] [Google Scholar]
- Ciriello G, Gatza ML, Beck AH, Wilkerson MD, Rhie SK, Pastore A, Zhang H, McLellan M, Yau C, Kandoth C et al (2015) Comprehensive molecular portraits of invasive lobular breast cancer. Cell 163: 506–519 [DOI] [PMC free article] [PubMed] [Google Scholar]
- Cocco E, Carmona FJ, Razavi P, Won HH, Cai Y, Rossi V, Chan C, Cownie J, Soong J, Toska E et al (2018) Neratinib is effective in breast tumors bearing both amplification and mutation of ERBB2 (HER2). Sci Signal 11: eaat9773 [DOI] [PMC free article] [PubMed] [Google Scholar]
- Conroy JM, Pabla S, Glenn ST, Nesline M, Burgher B, Lenzo FL, Papanicolau‐Sengos A, Gardner M, Morrison C (2019) Tumor mutational burden (TMB): assessment of inter and intra‐tumor heterogeneity. J Clin Oncol, 37(suppl 8; abstr 27): 27 [Google Scholar]
- Cotto KC, Griffith OL, Wollam A, Wagner AH, Griffith M, Feng Y‐Y, Spies G, Coffman AC, Spies NC, Kiwala S (2017) DGIdb 3.0: a redesign and expansion of the drug–gene interaction database. Nucleic Acids Res 46: D1068–D1073 [DOI] [PMC free article] [PubMed] [Google Scholar]
- Dihge L, Vallon‐Christersson J, Hegardt C, Saal LH, Häkkinen J, Larsson C, Ehinger A, Loman N, Malmberg M, Bendahl P‐O et al (2019) Prediction of lymph node metastasis in breast cancer by gene expression and clinicopathological models: development and validation within a population based cohort. Clin Cancer Res 25: 6368–6381 [DOI] [PubMed] [Google Scholar]
- Ellrott K, Bailey MH, Saksena G, Covington KR, Kandoth C, Stewart C, Hess J, Ma S, Chiotti KE, McLellan M et al (2018) Scalable open science approach for mutation calling of tumor exomes using multiple genomic pipelines. Cell Syst 6: 271–281 [DOI] [PMC free article] [PubMed] [Google Scholar]
- Fabregat A, Jupe S, Matthews L, Sidiropoulos K, Gillespie M, Garapati P, Haw R, Jassal B, Korninger F, May B et al (2018) The reactome pathway knowledgebase. Nucleic Acids Res 46: D649–D655 [DOI] [PMC free article] [PubMed] [Google Scholar]
- Faust GG, Hall IM (2014) SAMBLASTER: fast duplicate marking and structural variant read extraction. Bioinformatics 30: 2503–2505 [DOI] [PMC free article] [PubMed] [Google Scholar]
- Forbes SA, Beare D, Gunasekaran P, Leung K, Bindal N, Boutselakis H, Ding M, Bamford S, Cole C, Ward S et al (2015) COSMIC: exploring the world's knowledge of somatic mutations in human cancer. Nucleic Acids Res 43: D805–D811 [DOI] [PMC free article] [PubMed] [Google Scholar]
- Förnvik D, Aaltonen KE, Chen Y, George AM, Brueffer C, Rigo R, Loman N, Saal LH, Rydén L (2019) Detection of circulating tumor cells and circulating tumor DNA before and after mammographic breast compression in a cohort of breast cancer patients scheduled for neoadjuvant treatment. Breast Cancer Res Treat 177: 447–455 [DOI] [PMC free article] [PubMed] [Google Scholar]
- Garcia‐Murillas I, Schiavon G, Weigelt B, Ng C, Hrebien S, Cutts RJ, Cheang M, Osin P, Nerurkar A, Kozarewa I et al (2015) Mutation tracking in circulating tumor DNA predicts relapse in early breast cancer. Sci Transl Med 7: 302ra133 [DOI] [PubMed] [Google Scholar]
- Giacomelli AO, Yang X, Lintner RE, McFarland JM, Duby M, Kim J, Howard TP, Takeda DY, Ly SH, Kim E et al (2018) Mutational processes shape the landscape of TP53 mutations in human cancer. Nat Genet 50: 1381–1387 [DOI] [PMC free article] [PubMed] [Google Scholar]
- Gonzalez‐Perez A, Perez‐llamas C, Deu‐Pons J, Tamborero D, Schroeder MP, Jene‐Sanz A, Santos A, Lopez‐Bigas N (2013) IntOGen‐mutations identifies cancer drivers across tumor types. Nat Methods 10: 1081–1082 [DOI] [PMC free article] [PubMed] [Google Scholar]
- Goodman AM, Kato S, Bazhenova L, Patel SP, Frampton GM, Miller V, Stephens PJ, Daniels GA, Kurzrock R (2017) Tumor mutational burden as an independent predictor of response to immunotherapy in diverse cancers. Mol Cancer Ther 16: 2598–2608 [DOI] [PMC free article] [PubMed] [Google Scholar]
- Grambsch PM, Therneau TM (1994) Proportional hazards tests and diagnostics based on weighted residuals. Biometrika 81: 515–526 [Google Scholar]
- Griffith M, Spies NC, Krysiak K, McMichael JF, Coffman AC, Danos AM, Ainscough BJ, Ramirez CA, Rieke DT, Kujan L et al (2017) CIViC is a community knowledgebase for expert crowdsourcing the clinical interpretation of variants in cancer. Nat Genet 49: 170–174 [DOI] [PMC free article] [PubMed] [Google Scholar]
- Griffith OL, Spies NC, Anurag M, Griffith M, Luo J, Tu D, Yeo B, Kunisaki J, Miller CA, Krysiak K et al (2018) The prognostic effects of somatic mutations in ER‐positive breast cancer. Nat Commun 9: 3476 [DOI] [PMC free article] [PubMed] [Google Scholar]
- Grüning B, Dale R, Sjödin A, Rowe J, Chapman BA, Tomkins‐Tinch CH, Valieris R, Team TB, Köster J (2018) Bioconda: sustainable and comprehensive software distribution for the life sciences. Nat Methods 15: 475–476 [DOI] [PMC free article] [PubMed] [Google Scholar]
- Guo Y, Zhao S, Sheng Q, Samuels DC, Shyr Y (2017) The discrepancy among single nucleotide variants detected by DNA and RNA high throughput sequencing data. BMC Genom 18: 690 [DOI] [PMC free article] [PubMed] [Google Scholar]
- Habib JG, O'Shaughnessy JA (2016) The hedgehog pathway in triple‐negative breast cancer. Cancer Med 5: 2989–3006 [DOI] [PMC free article] [PubMed] [Google Scholar]
- Hellmann M. D., Ciuleanu T.‐E., Pluzanski A., Lee J. S., Otterson G. A., Audigier‐Valette C., Minenza E., Linardou H., Burgers S., Salman P. et al (2018) Nivolumab plus Ipilimumab in lung cancer with a high tumor mutational burden. N Engl J Med 378: 2093–2104 [DOI] [PMC free article] [PubMed] [Google Scholar]
- Hisamatsu Y, Tokunaga E, Yamashita N, Akiyoshi S, Okada S, Nakashima Y, Aishima S, Morita M, Kakeji Y, Maehara Y (2012) Impact of FOXA1 expression on the prognosis of patients with hormone receptor‐positive breast cancer. Ann Surg Oncol 19: 1145–1152 [DOI] [PubMed] [Google Scholar]
- Hofmann AL, Behr J, Singer J, Kuipers J, Beisel C, Schraml P, Moch H, Beerenwinkel N (2017) Detailed simulation of cancer exome sequencing data reveals differences and common limitations of variant callers. BMC Bioinformatics 18: 1–15 [DOI] [PMC free article] [PubMed] [Google Scholar]
- Holstege H, Horlings HM, Velds A, Langerød A, Børresen‐Dale AL, van de Vijver MJ, Nederlof PM, Jonkers J (2010) BRCA1‐mutated and basal‐like breast cancers have similar aCGH profiles and a high incidence of protein truncating TP53 mutations. BMC Cancer 10: 654 [DOI] [PMC free article] [PubMed] [Google Scholar]
- Horvath A, Pakala SB, Mudvari P, Reddy SDN, Ohshiro K, Casimiro S, Pires R, Fuqua SA, Toi M, Costa L et al (2013) Novel insights into breast cancer genetic variance through RNA sequencing. Sci Rep 3: 2256 [DOI] [PMC free article] [PubMed] [Google Scholar]
- Hyman DM, Smyth LM, Donoghue MTA, Westin SN, Bedard PL, Emma J, Bando H, El‐khoueiry AB, Mita A, Schellens JHM et al (2017) AKT inhibition in solid tumors with AKT1 mutations. J Clin Oncol 35: 2251–2259 [DOI] [PMC free article] [PubMed] [Google Scholar]
- Jassal B, Matthews L, Viteri G, Gong C, Lorente P, Fabregat A, Sidiropoulos K, Cook J, Gillespie M, Haw R et al (2020) The reactome pathway knowledgebase. Nucleic Acids Res 48: D498–D503 [DOI] [PMC free article] [PubMed] [Google Scholar]
- Juric D, Rodon J, Tabernero J, Janku F, Burris HA, Schellens JH, Middleton MR, Berlin J, Schuler M, Gil‐Martin M et al (2018) Phosphatidylinositol 3‐kinase α–selective inhibition with alpelisib (BYL719) in PIK3CA ‐altered solid tumors: results from the first‐in‐human study. J Clin Oncol 36: 1291–1299 [DOI] [PMC free article] [PubMed] [Google Scholar]
- Karczewski KJ, Francioli LC, Tiao G, Cummings BB, Alföldi J, Wang Q, Collins RL, Laricchia KM, Ganna A, Birnbaum DP et al (2020) The mutational constraint spectrum quantified from variation in 141,456 humans. Nature 581: 434–443 [DOI] [PMC free article] [PubMed] [Google Scholar]
- Kim D, Langmead B, Salzberg SL (2015) HISAT: a fast spliced aligner with low memory requirements. Nat Methods 12: 357–360 [DOI] [PMC free article] [PubMed] [Google Scholar]
- Kiran A, Baranov PV (2010) DARNED: a database of RNA editing in humans. Bioinformatics 26: 1772–1776 [DOI] [PubMed] [Google Scholar]
- Köster J, Rahmann S (2012) Snakemake‐a scalable bioinformatics workflow engine. Bioinformatics 28: 2520–2522 [DOI] [PubMed] [Google Scholar]
- Lai Z, Markovets A, Ahdesmaki M, Chapman B, Hofmann O, McEwen R, Johnson J, Dougherty B, Barrett JC, Dry JR (2016) VarDict: a novel and versatile variant caller for next‐generation sequencing in cancer research. Nucleic Acids Res 44: e108 [DOI] [PMC free article] [PubMed] [Google Scholar]
- Lauss M, Donia M, Harbst K, Andersen R, Mitra S, Rosengren F, Salim M, VallonChristersson J, Törngren T, Kvist A et al (2017) Mutational and putative neoantigen load predict clinical benefit of adoptive T cell therapy in melanoma. Nat Commun 8: 1738 [DOI] [PMC free article] [PubMed] [Google Scholar]
- Li H, Bloom JM, Farjoun Y, Fleharty M, Gauthier LD, Neale B, MacArthur D (2018) A synthetic‐diploid benchmark for accurate variant‐calling evaluation. Nat Methods 15: 595–597 [DOI] [PMC free article] [PubMed] [Google Scholar]
- Locatelli M, Curigliano G (2017) Notch inhibitors and their role in the treatment of triple negative breast cancer: promises and failures. Curr Opin Oncol 29: 411–427 [DOI] [PubMed] [Google Scholar]
- Lundgren C, Bendahl P‐O, Borg Å, Ehinger A, Hegardt C, Larsson C, Loman N, Malmberg M, Olofsson H, Saal LH et al (2019) Agreement between molecular subtyping and surrogate subtype classification: a contemporary population‐based study of ER‐positive/HER2‐negative primary breast cancer. Breast Cancer Res Treat 178: 459–467 [DOI] [PMC free article] [PubMed] [Google Scholar]
- Ma CX, Bose R, Gao F, Freedman RA, Telli ML, Kimmick G, Winer E, Naughton M, Goetz MP, Russell C et al (2017) Neratinib efficacy and circulating tumor DNA detection of HER2 mutations in HER2 nonamplified metastatic breast cancer. Clin Cancer Res 23: 5687–5695 [DOI] [PMC free article] [PubMed] [Google Scholar]
- Ma C, Shao M, Kingsford C (2018) SQUID: transcriptomic structural variation detection from RNA‐seq. Genome Biol 19: 52 [DOI] [PMC free article] [PubMed] [Google Scholar]
- Maguire SL, Leonidou A, Wai P, Marchiò C, Ng CK, Sapino A, Salomon A‐V, ReisFilho JS, Weigelt B, Natrajan RC (2015) SF3B1 mutations constitute a novel therapeutic target in breast cancer. J Pathol 235: 571–580 [DOI] [PMC free article] [PubMed] [Google Scholar]
- Maretty L, Jensen JM, Petersen B, Sibbesen JA, Liu S, Villesen P, Skov L, Belling K, Theil Have C, Izarzugaza JM et al (2017) Sequencing and de novo assembly of 150 genomes from Denmark as a population reference. Nature 548: 87–91 [DOI] [PubMed] [Google Scholar]
- Mendoza‐Villanueva D, Deng W, Lopez‐Camacho C, Shore P (2010) The Runx transcriptional co‐activator, CBFbeta, is essential for invasion of breast cancer cells. Mol Cancer 9: 171 [DOI] [PMC free article] [PubMed] [Google Scholar]
- Murray EM, Cherian MA, Ma CX, Bose R (2018) HER2 activating mutations in estrogen receptor positive breast cancer. Curr Breast Cancer Rep 10: 41–47 [Google Scholar]
- Nayar U, Cohen O, Kapstad C, Cuoco MS, Waks AG, Wander SA, Painter C, Freeman S, Persky NS, Marini L et al (2018) Acquired HER2 mutations in ER+ metastatic breast cancer confer resistance to estrogen receptor–directed therapies. Nat Genet 51: 207–216 [DOI] [PubMed] [Google Scholar]
- Pahuja KB, Nguyen TT, Jaiswal BS, Prabhash K, Thaker TM, Senger K, Chaudhuri S, Kljavin NM, Antony A, Phalke S et al (2018) Actionable activating oncogenic ERRB2/HER2 transmembrane and juxtamembrane domain mutations. Cancer Cell 34: 792–806 [DOI] [PMC free article] [PubMed] [Google Scholar]
- Panda A, Betigeri A, Subramanian K, Ross JS, Pavlick DC, Ali S, Markowski P, Silk A, Kaufman HL, Lattime E et al (2017) Identifying a clinically applicable mutational burden threshold as a potential biomarker of response to immune checkpoint therapy in solid tumors. JCO Precis Oncol 1: 1–13 [DOI] [PMC free article] [PubMed] [Google Scholar]
- Parkhomchuk D, Borodina T, Amstislavskiy V, Banaru M, Hallen L, Krobitsch S, Lehrach H, Soldatov A (2009) Transcriptome analysis by strand‐specific sequencing of complementary DNA. Nucleic Acids Res 37: e123 [DOI] [PMC free article] [PubMed] [Google Scholar]
- Pedersen BS, Layer RM, Quinlan AR, Li H, Wang K, Li M, Hakonarson H, McLaren W, Pritchard B, Rios D et al (2016) Vcfanno: fast, flexible annotation of genetic variants. Genome Biol 17: 118 [DOI] [PMC free article] [PubMed] [Google Scholar]
- Pereira B, Chin S‐F, Rueda OM, Vollan H‐KM, Provenzano E, Bardwell HA, Pugh M, Jones L, Russell R, Sammut S‐J et al (2016) The somatic mutation profiles of 2,433 breast cancers refines their genomic and transcriptomic landscapes. Nat Commun 7: 11479 [DOI] [PMC free article] [PubMed] [Google Scholar]
- Persson H, Søkilde R, Häkkinen J, Pirona AC, Vallon‐Christersson J, Kvist A, Mertens F, Borg Å, Mitelman F, Höglund M et al (2017) Frequent miRNA‐convergent fusion gene events in breast cancer. Nat Commun 8: 788 [DOI] [PMC free article] [PubMed] [Google Scholar]
- Picardi E, Erchia AMD, Giudice CL, Pesole G (2017) REDIportal: a comprehensive database of A‐to‐I RNA editing events in humans. Nucleic Acids Res 45: D750–D757 [DOI] [PMC free article] [PubMed] [Google Scholar]
- Piskol R, Ramaswami G, Li JB (2013) Reliable identification of genomic variants from RNA‐seq data. Am J Hum Genet 93: 641–651 [DOI] [PMC free article] [PubMed] [Google Scholar]
- Radenbaugh AJ, Ma S, Ewing A, Stuart JM, Collisson EA, Zhu J, Haussler D (2014) RADIA: RNA and DNA integrated analysis for somatic mutation detection. PLoS ONE 9: e111516 [DOI] [PMC free article] [PubMed] [Google Scholar]
- Ramaswami G, Zhang R, Piskol R, Keegan LP, Deng P, O'Connell MA, Li JB (2013) Identifying RNA editing sites using RNA sequencing data alone. Nat Methods 10: 128–132 [DOI] [PMC free article] [PubMed] [Google Scholar]
- Ramaswami G, Li JB (2014) RADAR: a rigorously annotated database of A‐to‐I RNA editing. Nucleic Acids Res 42: D109–D113 [DOI] [PMC free article] [PubMed] [Google Scholar]
- Robinson DR, Wu YM, Vats P, Su F, Lonigro RJ, Cao X, Kalyana‐Sundaram S, Wang R, Ning Y, Hodges L et al (2013) Activating ESR1 mutations in hormone‐resistant metastatic breast cancer. Nat Genet 45: 1446–1451 [DOI] [PMC free article] [PubMed] [Google Scholar]
- Roepman P, Horlings HM, Krijgsman O, Kok M, Bueno‐de-Mesquita JM, Bender R, Linn SC, Glas AM, van de Vijver MJ (2009) Microarray‐based determination of estrogen receptor, progesterone receptor, and HER2 receptor status in breast cancer. Clin Cancer Res 15: 7003–7011 [DOI] [PubMed] [Google Scholar]
- Ross JS, Gay LM, Wang K, Ali SM, Chumsri S, Elvin JA, Bose R, Vergilio JA, Suh J, Yelensky R et al (2016) Nonamplification ERBB2 genomic alterations in 5605 cases of recurrent and metastatic breast cancer: an emerging opportunity for anti‐HER2 targeted therapies. Cancer 122: 2654–2662 [DOI] [PubMed] [Google Scholar]
- Rydén L, Loman N, Larsson C, Hegardt C, Vallon‐Christersson J, Malmberg M, Lindman H, Ehinger A, Saal LH, Borg Å (2018) Minimizing inequality in access to precision medicine in breast cancer by real‐time population‐based molecular analysis in the SCAN‐B initiative. Br J Surg 105: e158–e168 [DOI] [PMC free article] [PubMed] [Google Scholar]
- Saal LH, Holm K, Maurer M, Memeo L, Su T, Wang X, Yu JS, Malmström PO, Mansukhani M, Enoksson J et al (2005) PIK3CA mutations correlate with hormone receptors, node metastasis, and ERBB2, and are mutually exclusive with PTEN loss in human breast carcinoma. Cancer Res 65: 2554–2559 [DOI] [PubMed] [Google Scholar]
- Saal LH, Johansson P, Holm K, Gruvberger‐Saal SK, She QB, Maurer M, Koujak S, Ferrando AA, Malmstrom P, Memeo L et al (2007) Poor prognosis in carcinoma is associated with a gene expression signature of aberrant PTEN tumor suppressor pathway activity. Proc Natl Acad Sci USA 104: 7564–7569 [DOI] [PMC free article] [PubMed] [Google Scholar]
- Saal LH, Gruvberger‐Saal SK, Persson C, Lövgren K, Jumppanen M, Staaf J, Jönsson G, Pires MM, Maurer M, Holm K et al (2008) Recurrent gross mutations of the PTEN tumor suppressor gene in breast cancers with deficient DSB repair. Nat Genet 40: 102–107 [DOI] [PMC free article] [PubMed] [Google Scholar]
- Saal LH, Vallon‐Christersson J, Häkkinen J, Hegardt C, Grabau D, Winter C, Brueffer C, Tang M‐HE, Reuterswärd C, Schulz R et al (2015) The Sweden Cancerome Analysis Network Breast (SCAN‐B) Initiative: a large‐scale multicenter infrastructure towards implementation of breast cancer genomic analyses in the clinical routine. Genome Med 7: 20 [DOI] [PMC free article] [PubMed] [Google Scholar]
- Schmid P, Adams S, Rugo HS, Schneeweiss A, Barrios C, Iwata H, Diéras V, Hegg R, Im S, Wright GS et al (2018) Atezolizumab and Nab‐paclitaxel in advanced triple‐negative breast cancer. N Engl J Med 379: 2108–2121 [DOI] [PubMed] [Google Scholar]
- Severson TM, Peeters J, Majewski I, Michaut M, Bosma A, Schouten PC, Chin SF, Pereira B, Goldgraben MA, Bismeijer T et al (2015) BRCA1‐like signature in triple negative breast cancer: molecular and clinical characterization reveals subgroups with therapeutic potential. Mol Oncol 9: 1528–1538 [DOI] [PMC free article] [PubMed] [Google Scholar]
- Shah SP, Roth A, Goya R, Oloumi A, Ha G, Zhao Y, Turashvili G, Ding J, Tse K, Haffari G et al (2012) The clonal and mutational evolution spectrum of primary triple‐negative breast cancers. Nature 486: 395–399 [DOI] [PMC free article] [PubMed] [Google Scholar]
- She QB, Gruvberger‐Saal SK, Maurer M, Chen Y, Jumppanen M, Su T, Dendy M, Lau YKI, Memeo L, Horlings HM et al (2016) Integrated molecular pathway analysis informs a synergistic combination therapy targeting PTEN/PI3K and EGFR pathways for basal‐like breast cancer. BMC Cancer 16: 587 [DOI] [PMC free article] [PubMed] [Google Scholar]
- Sherry ST, Ward M, Kholodov M, Baker J, Phan L, Smigielski E, Sirotkin K (2001) dbSNP: the NCBI database of genetic variation. Nucleic Acids Res 29: 308–311 [DOI] [PMC free article] [PubMed] [Google Scholar]
- Shi W, Ng CK, Lim RS, Jiang T, Kumar S, Li X, Wali VB, Piscuoglio S, Gerstein MB, Chagpar AB et al (2018) Reliability of whole‐exome sequencing for assessing intratumor genetic heterogeneity. Cell Rep 25: 1446–1457 [DOI] [PMC free article] [PubMed] [Google Scholar]
- Siegel MB, He X, Hoadley KA, Hoyle A, Pearce JB, Garrett AL, Kumar S, Moylan VJ, Brady CM, Swearingen AEDV et al (2018) Integrated RNA and DNA sequencing reveals early drivers of metastatic breast cancer. J Clin Invest 128: 1–13 [DOI] [PMC free article] [PubMed] [Google Scholar]
- Skidmore ZL, Wagner AH, Lesurf R, Campbell KM, Kunisaki J, Griffith OL, Griffith M (2016) GenVisR: genomic visualizations in R. Bioinformatics 32: 3012–3014 [DOI] [PMC free article] [PubMed] [Google Scholar]
- Søkilde R, Persson H, Ehinger A, Pirona AC, Fernö M, Hegardt C, Larsson C, Loman N, Malmberg M, Rydén L et al (2019) Refinement of breast cancer molecular classification by miRNA expression profiles. BMC Genom 20: 1–12 [DOI] [PMC free article] [PubMed] [Google Scholar]
- Sondka Z, Bamford S, Cole CG, Ward SA, Dunham I, Forbes SA (2018) The COSMIC Cancer Gene Census: describing genetic dysfunction across all human cancers. Nat Rev Cancer 18: 696–705 [DOI] [PMC free article] [PubMed] [Google Scholar]
- Sotiriou C, Wirapati P, Loi S, Harris A, Fox S, Smeds J, Nordgren H, Farmer P, Praz V, Haibe‐Kains B et al (2006) Gene expression profiling in breast cancer: understanding the molecular basis of histologic grade to improve prognosis. J Natl Cancer Inst 98: 262–272 [DOI] [PubMed] [Google Scholar]
- Sun J, De Marinis Y, Osmark P, Singh P, Bagge A, Valtat B, Vikman P, Spégel P, Mulder H (2016) Discriminative prediction of A‐To‐I RNA editing events from DNA sequence. PLoS ONE 11: 1–18 [Google Scholar]
- Takaku M, Grimm SA, Roberts JD, Chrysovergis K, Bennett BD, Myers P, Perera L, Tucker CJ, Perou CM, Wade PA (2018) GATA3 zinc finger 2 mutations reprogram the breast cancer transcriptional network. Nat Commun 9: 1–14 [DOI] [PMC free article] [PubMed] [Google Scholar]
- Talevich E, Shain AH (2018) CNVkit‐RNA: copy number inference from RNA‐sequencing data. bioRxiv 10.1101/408534 [PREPRINT] [DOI] [Google Scholar]
- Tarasov A, Vilella AJ, Cuppen E, Nijman IJ, Prins P (2015) Sambamba: fast processing of NGS alignment formats. Bioinformatics 31: 2032–2034 [DOI] [PMC free article] [PubMed] [Google Scholar]
- The Cancer Genome Atlas (2012) Comprehensive molecular portraits of human breast tumours. Nature 490: 61–70 [DOI] [PMC free article] [PubMed] [Google Scholar]
- Thomas A, Routh ED, Pullikuth A, Jin G, Su J, Chou JW, Hoadley KA, Print C, Knowlton N, Black MA et al (2018) Tumor mutational burden is a determinant of immunemediated survival in breast cancer. OncoImmunology 7: e1490854 [DOI] [PMC free article] [PubMed] [Google Scholar]
- Tischler G, Leonard S (2014) Biobambam: tools for read pair collation based algorithms on BAM files. Source Code Biol Med 9: 13 [Google Scholar]
- Vallon‐Christersson J, Häkkinen J, Hegardt C, Saal LH, Larsson C, Ehinger A, Lindman H, Olofsson H, Sjöblom T, Wärnberg F et al (2019) Cross comparison and prognostic assessment of breast cancer multigene signatures in a large population‐based contemporary clinical series. Sci Rep 9: 12184 [DOI] [PMC free article] [PubMed] [Google Scholar]
- Vitting‐Seerup K, Sandelin A (2017) The landscape of isoform switches in human cancers. Mol Cancer Res 15: 1206–1220 [DOI] [PubMed] [Google Scholar]
- Weidle UH, Maisel D, Eick D (2011) Synthetic lethality‐based targets for discovery of new cancer therapeutics. Cancer Genomics Proteomics 8: 159–171 [PubMed] [Google Scholar]
- Wen W, Chen WS, Xiao N, Bender R, Ghazalpour A, Tan Z, Swensen J, Millis SZ, Basu G, Gatalica Z et al (2015) Mutations in the kinase domain of the HER2/ERBB2 gene identified in a wide variety of human cancers. J Mol Diagn 17: 487–495 [DOI] [PMC free article] [PubMed] [Google Scholar]
- Wilkerson MD, Cabanski CR, Sun W, Hoadley KA, Walter V, Mose LE, Troester MA, Hammerman PS, Parker JS, Perou CM et al (2014) Integrated RNA and DNA sequencing improves mutation detection in low purity tumors. Nucleic Acids Res 42: e107 [DOI] [PMC free article] [PubMed] [Google Scholar]
- Winter C, Nilsson M, Olsson E, George A, Chen Y, Kvist A, Törngren T, Vallon‐Christersson J, Hegardt C, Häkkinen J et al (2016) Targeted sequencing of BRCA1 and BRCA2 across a large unselected breast cancer cohort suggests one‐third of mutations are somatic. Ann Oncol 27: 1532–1538 [DOI] [PMC free article] [PubMed] [Google Scholar]
- Xu J, Guo X, Jing M, Sun T (2018) Prediction of tumor mutation burden in breast cancer based on the expression of ER, PR, HER‐2, and Ki‐67. Onco Targets Ther 11: 2269–2275 [DOI] [PMC free article] [PubMed] [Google Scholar]
- Zacharakis N, Chinnasamy H, Black M, Xu H, Lu Y‐C, Zheng Z, Pasetto A, Langhan M, Shelton T, Prickett T et al (2018) Immune recognition of somatic mutations leading to complete durable regression in metastatic breast cancer. Nat Med 24: 724–730 [DOI] [PMC free article] [PubMed] [Google Scholar]
- Zardavas D, te Marvelde L, Milne RL, Fumagalli D, Fountzilas G, Kotoula V, Razis E, Papaxoinis G, Joensuu H, Moynahan ME et al (2018) Tumor PIK3CA genotype and prognosis in early‐stage breast cancer: a pooled analysis of individual patient data. J Clin Oncol 36: 981–990 [DOI] [PubMed] [Google Scholar]
- Zhang HY, Liang F, Jia ZL, Song ST, Jiang ZF (2013) PTEN mutation, methylation and expression in breast cancer patients. Oncol Lett 6: 161–168 [DOI] [PMC free article] [PubMed] [Google Scholar]
- Zhao H, Sun Z, Wang J, Huang H, Kocher JP, Wang L (2014) CrossMap: a versatile tool for coordinate conversion between genome assemblies. Bioinformatics 30: 1006–1007 [DOI] [PMC free article] [PubMed] [Google Scholar]
- Zook JM, Catoe D, McDaniel J, Vang L, Spies N, Sidow A, Weng Z, Liu Y, Mason CE, Alexander N et al (2016) Extensive sequencing of seven human genomes to characterize benchmark reference materials. Sci Data 3: 160025 [DOI] [PMC free article] [PubMed] [Google Scholar]
Associated Data
This section collects any data citations, data availability statements, or supplementary materials included in this article.
Supplementary Materials
Expanded View Figures PDF
Table EV1
Table EV2
Table EV3
Table EV4
Table EV5
Table EV6
Review Process File
Data Availability Statement
The datasets produced and used in this study are available in the following databases:
Clinical data and mutation calls: http://oncogenomics.bmc.lu.se/MutationExplorer
Gene expression data: NCBI Gene Expression Omnibus GSE81540 (https://www.ncbi.nlm.nih.gov/geo/query/acc.cgi?acc=GSE81540; Brueffer et al, 2018).
Raw patient sequencing data cannot be provided due to Swedish data protection laws.