Abstract
New tools and techniques have dramatically accelerated the field of structural biology over the past several decades. One potent and relatively new technique that is now being utilized by an increasing number of laboratories is the combination of so-called “native” electrospray ionization (ESI) with mass spectrometry (MS) for the characterization of proteins and their noncovalent complexes. However, native ESI-MS produces species at increasingly higher m/z with increasing molecular weight, leading to substantial differences when compared to traditional mass spectrometric approaches using denaturing ESI solutions. Herein, these differences are explored both theoretically and experimentally to understand the role that charge state and isotopic distributions have on signal-to-noise (S/N) as a function of complex molecular weight and how the reduced collisional cross sections of proteins electrosprayed under native solution conditions can lead to improved data quality in image current mass analyzers, such as Orbitrap and FT-ICR. Quantifying ion signal differences under native and denatured conditions revealed enhanced S/N and a more gradual decay in S/N with increasing mass under native conditions. Charge state and isotopic S/N models, supported by experimental results, indicate that analysis of proteins under native conditions at 100 kDa will be 17 times more sensitive than analysis under denatured conditions at the same mass. Higher masses produce even larger sensitivity gains. Furthermore, reduced cross sections under native conditions lead to lower levels of ion decay within an Orbitrap scan event over long transient acquisition times, enabling isotopic resolution of species with molecular weights well in excess of those typically resolved under denatured conditions.
Graphical Abstract:
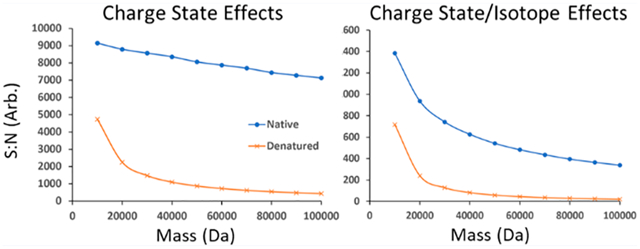
Over the past decade, the use of electrospray ionization mass spectrometry (ESI-MS) from solutions containing little to no organic solvents at near-neutral pH has evolved into a potent technique for protein analysis with a rapidly growing number of practitioners.1,2 Now termed native mass spectrometry (nMS),3 it has gained momentum as a method to further understand proteins and their secondary, tertiary, and quaternary structures.4–6 The growth of nMS has been accelerated by advances in electrospray ionization techniques,7,8 increasing instrumentation mass range, decreased resolution limitations,9–14 and activation techniques to monitor complex dissociation.15–18 Native MS provides not only insight into protein structure but also reveals information pertaining to topology and architecture.19 Increased mass range and resolution, important for protein complex identification, and dissociation techniques, enabling gas phase disassembly of protein complexes, have made nMS an integral part of the structural biologist’s toolbox.20
Native analysis has been applied to a range of analytes with diverse masses, including small proteins, ribosomes, and virus capsids. In these analyses, new understanding of their natural form and their noncovalent interactions with proteins, nucleic acids, ligands, cofactors, or metal ions can be gained.21,22 Additional examples include the study of drug-fragment binding, the elucidation of heterogeneous antibody-based molecules,23,24 the characterization of catalytic mechanisms, and the identification and localization of post-translational modifications (PTMs).25–29 In addition, native analysis has been applied to intact membrane proteins, which are essential to many cellular processes.30–32 Recently, there has been a strong interest in combining native mass spectrometry with more traditional top-down proteomics methods.33,34 These applications and advances are possible due to the native structure of the protein that remains intact when electrosprayed with nonharsh buffer conditions.
The principal difference between traditional denaturing and native electrospray ionization mass spectrometry is the composition and pH of the solution. Denaturing solutions containing organic solvents and non-neutral pH conditions produce unfolded molecules by disrupting noncovalent interactions, causing molecules to unfold and expose sites of protonation. On the other hand, native solutions with minimal concentrations of organic solvents and a neutral pH (~7) preserve noncovalent interactions, including those between subunits of protein complexes, as these molecules transition to the gas phase. Charge state and intensity during electrospray ionization are determined by the number and character of ionizable sites, solvent surface tension, intramolecular interactions, ion surface area, and Columbic repulsion.35–40 ESI-MS of denatured species typically produces a normal distribution of highly charged ions in a wider charge state distribution, usually with a consistent charge density centered around one charge every 9–10 residues. Native ESI produces ions with lower charge states and a narrower charge state distribution.35,41–44 Largely, this is due to the globular nature of folded proteins, limiting solvent accessible residues to only those on the surface of the protein/complex. In turn, globular, native proteins with less exposed surface residues will have smaller collisional cross sections when compared to their denatured counterparts.
The collisional cross-section of a protein plays an important role in the rate of ion decay within an Orbitrap analyzer. In such detectors, mass resolving power is limited by the duration of detectable ion signal.45–49 Signal decay can be attributed to ion dephasing associated with field anharmonicity, ion fragmentation during injection into the Orbitrap, and metastable decay during detection. Proteins with smaller collisional cross sections have a lower rate (higher mean free path) of ion/background gas molecule collisions.50–52 The reduced collisional rate for globular species under native conditions enhances ion lifetime during ion injection and detection events. To investigate this, we have studied the effects of collisional cross-section under native conditions and its relation to signal decay.
Herein, we present a companion paper to that presented by Compton et al. in which the challenges of detecting increasingly larger proteins via denaturing ESI-MS were treated theoretically.53 Although we do not investigate nor contemplate differences in ionization efficiency between the two methods across the range of flow rates, source gas flows, emitter types, and spray voltages that are used in the field, a similar approach has been employed here to model the charge state distributions of native-like protein ions of any mass, ultimately enabling the calculation of theoretical signal-to-noise (S/N) values for a range of molecular weights. Other factors of interest were also investigated, including differences in sample complexity and Orbitrap mass analyzer ion decay, to provide a robust, theoretical comparison between native and denatured techniques followed by validation with experimental measurements.
EXPERIMENTAL SECTION
Sample Preparation and MS Analysis.
Ubiquitin (8.7 kDa), myoglobin (16.5 kDa), carbonic anhydrase (29.0 kDa), and enolase (46.5 kDa) solutions were desalted using Amicon Ultra-0.5 mL centrifugal filters and prepared in 5 μM concentrations for subsequent analysis under native and denatured conditions. Native protein samples were prepared in 100 mM ammonium acetate buffer. Denatured samples were prepared in 60:40 water/acetonitrile with 0.2% acetic acid. Native and denatured samples were electrosprayed with a custom nanoelectrospray source (spray voltage 0.8 to 1.6 kV) and analyzed with a modified Q-Exactive HF (Thermo Fisher Scientific) mass spectrometer as described previously.15,33
Experimental S/N values for ubiquitin, myoglobin, carbonic anhydrase, and enolase were determined with a standard Q-Exactive Plus (Thermo Fisher Scientific) mass spectrometer at two resolution settings. First, a resolution setting of 17500 for m/z 200 was used to produce charge state distributions that were not isotopically resolved. For ubiquitin the resolution was set even lower, to 7000 for m/z 200, to ensure no isotopic resolution. Second, under similar instrumental conditions the resolution was set to 140000 for m/z 200 to produce charge state distributions that were isotopically resolved. The Automatic Gain Control (AGC) target was held constant at 1 million charges for both resolution settings. These conditions were used to allow for a robust comparison of theoretically determined S/N values with the splitting of 1 million charges between, in first case, only charge state distributions and, in the second case, charge state and isotopic distributions in a controlled manner.
Isotopic Distribution and S/N Calculation.
Similar assumptions and calculations employed by Compton et al. were utilized to provide a direct comparison between native and denatured theoretical charge state, isotope, and combined effects.53 Briefly, theoretical isotopic distributions were generated using the algorithm previously described by Rockwood and co-workers with distributions truncated where the isotopic distributions fell below 1 × 10⁻⁴%.54 The conservative relationship between S/N and the number of charges present in a peak, as determined by Limbach et al., is represented by55
| (1) |
S/N calculation of charge state and combined charge state/isotope models, a fixed number of charges, 1 million, was populated along the respective distributions. Twenty-two native complexes used to create the charge state model are listed in the Supporting Information, and a detailed method for their preparation is described elsewhere.33
RESULTS AND DISCUSSION
Proteins in denaturing and native solutions have a drastically different number of charge states for a fixed number of ions to populate. For example, under denaturing conditions, carbonic anhydrase adopts a charge state distribution consisting of 29 charge states ranging from +18 to +46. In comparison, the charge state distribution resulting from native electrospray of the same protein ranges from +8 to +12. This nearly 5-fold difference in the number of charge states present between these two conditions indicates a large difference in the structure of these ions.
Measurements of collisional cross-section for ions of carbonic anhydrase resulting from denaturing and native electrospray are significantly different. The reported cross sections for the most abundant charge states in the distributions in Figure 1 for native (+10) and denaturing (+33) mode are 2000 and 8000 Å2, respectively.56 The 4-fold change in cross-section confirms a more compact structure is maintained under native conditions.
Figure 1.
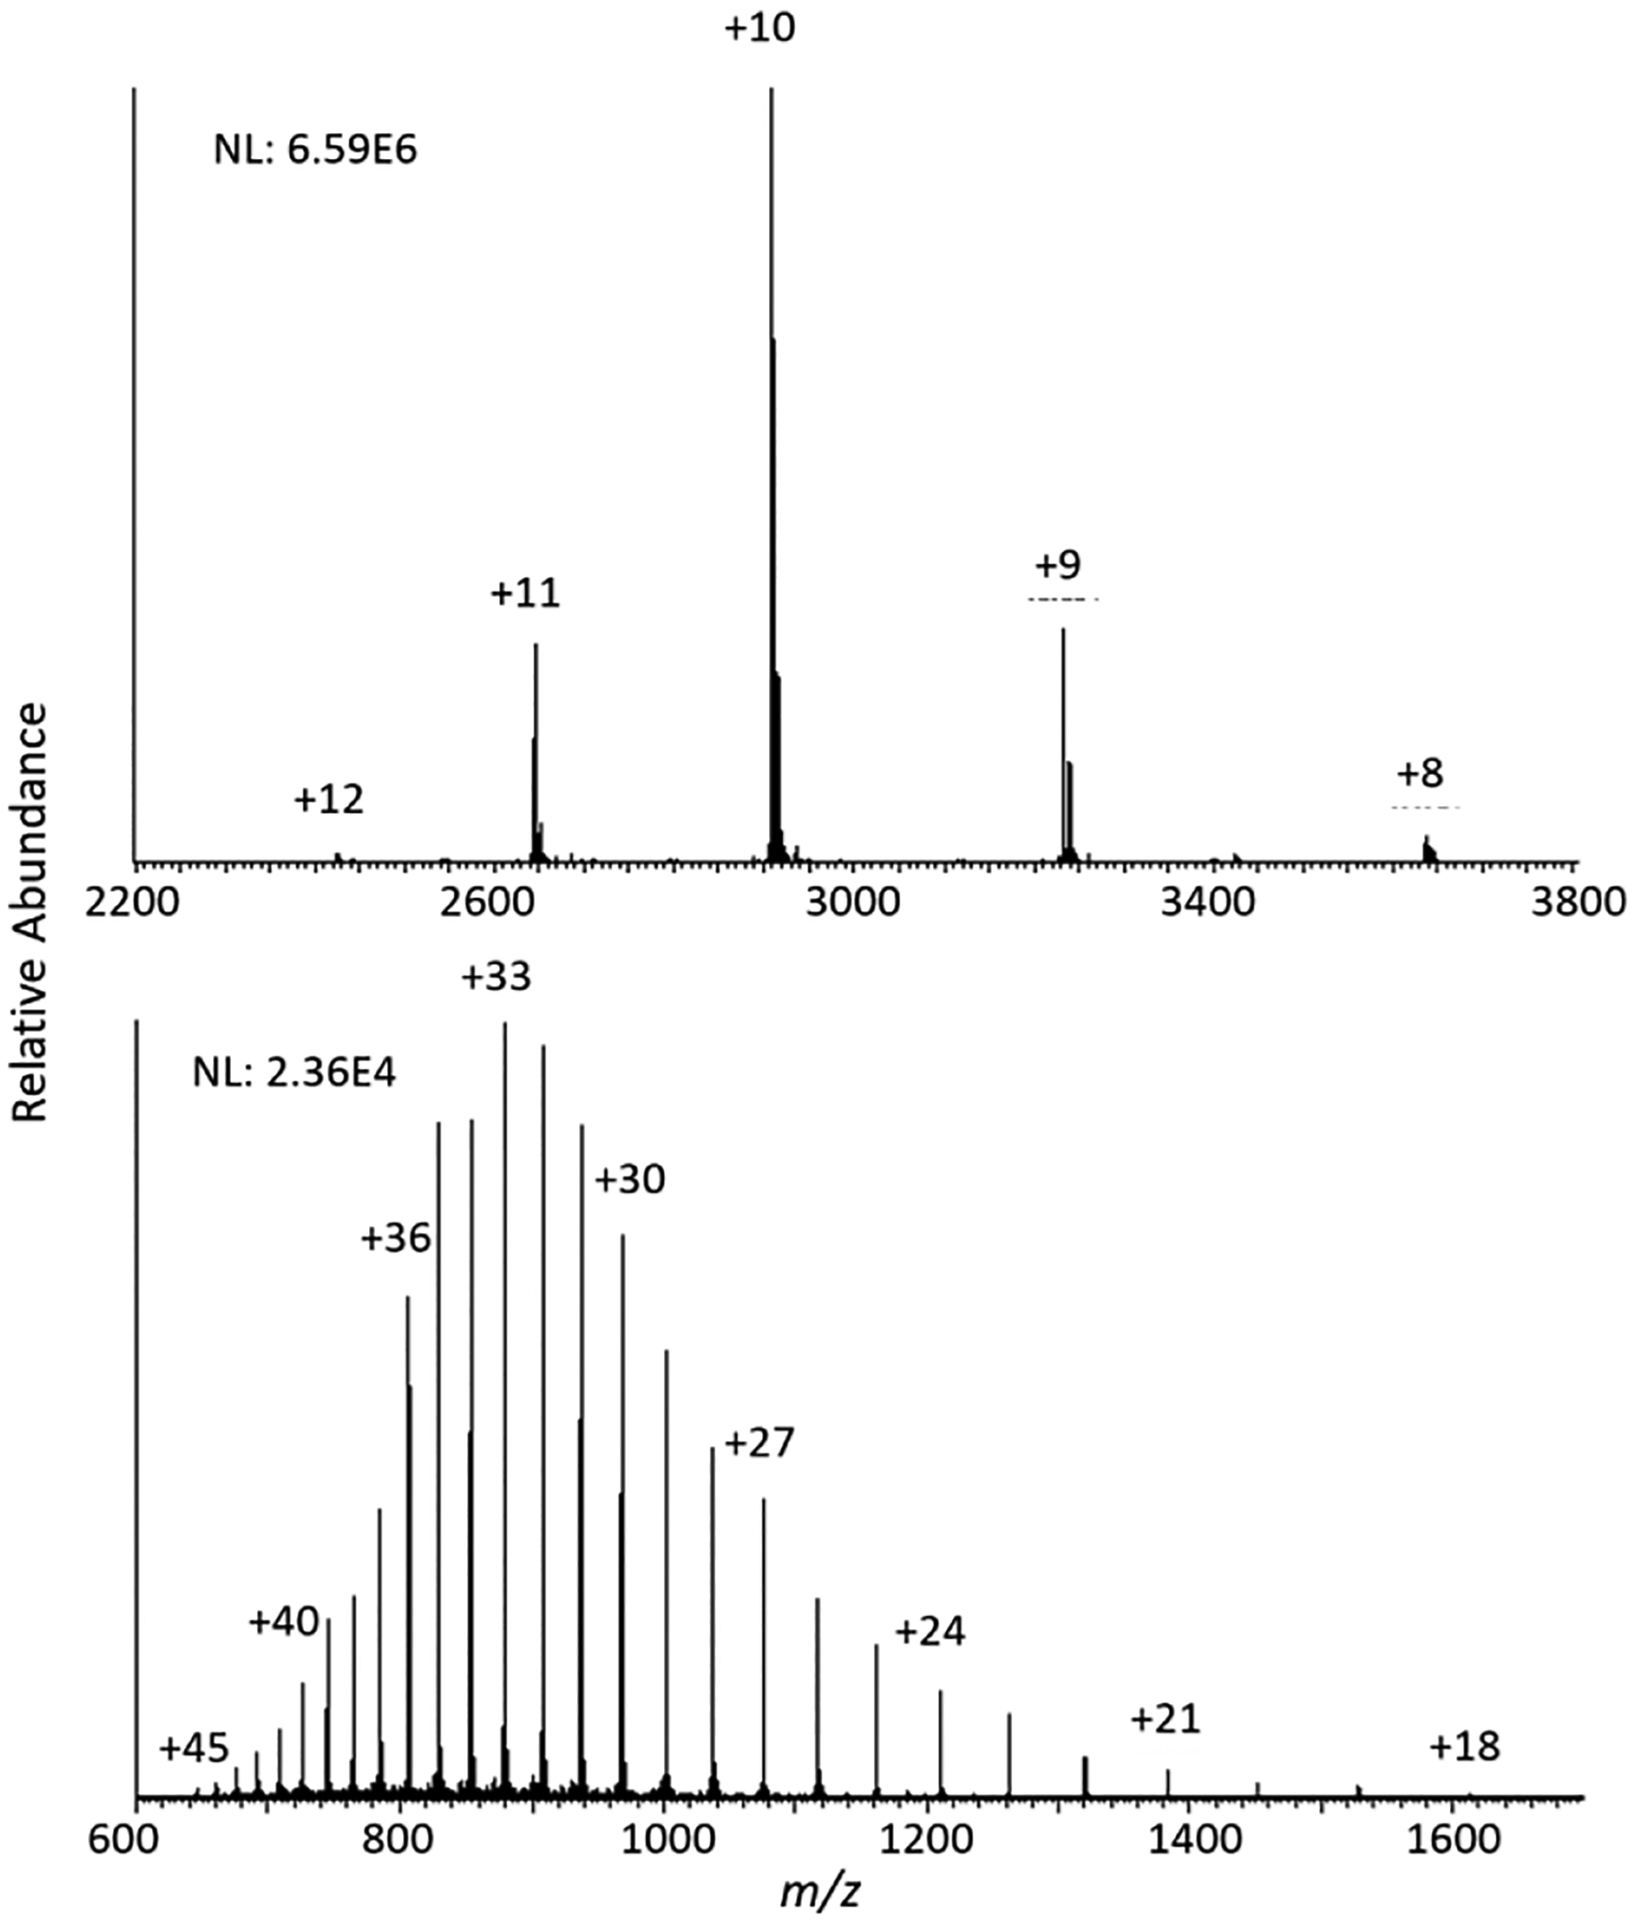
Charge state distributions of carbonic anhydrase under native (top) and denaturing (bottom) electrospray ionization conditions.
The fewer number of charge states associated with this more compact structure provides a significant benefit in sensitivity. The base peak abundances of the native and denaturing spectra were 6.59 × 10⁶ and 2.36 × 10⁶, respectively. The 2.8-fold improvement in sensitivity under native conditions can be explained by the difference in the number of charge states the fixed number of ions analyzed per detection are distributed into between the two conditions. This concept is further investigated later in the paper.
Charge-State Distributions and Modeling.
To produce an accurate native theoretical charge state model, the Gaussian nature of these distributions need to be examined experimentally. Charge state distributions for 22 protein complexes ranging from 12.4 to 316.6 kDa recently published by Skinner et al. were used to model charge state parameters as a function of the complex molecular weight.34 Each distribution was fit to a Gaussian function
| (2) |
where n is the charge state number, μ is the mean number of occupied charge states, and σ is the standard deviation of the charge state distribution. Charge states were numbered from 1 to the highest visible charge state to exclude 1/z spacing variations from standard charge state distributions. Although the mean number of occupied charge states (μ) follows a linear trendline with increasing complex masses, it is good to note that the average charge state as a function of mass for a native species as illustrated in Supplemental Figure S1 follows a power trendline similar to previously published data.57 Figure 2 illustrates the fit for three of the 22-normalized experimental charge state distributions utilized to produce the charge state model. n, μ, and σ values were plotted as a function of complex molecular weight and fit with a linear regression to produce the expression
| (3) |
where a native theoretical distribution can be modeled for any precursor mass. Figure 3 demonstrates the comparison between the theoretically determined native charge state distribution of carbonic anhydrase and the associated experimental result. Similar analysis was expanded to nucleo-side diphosphate kinase (90 kDa), transketolase (146 kDa), cytosol aminopeptidase (317 kDa), and HSP90 alpha (168 kDa) where calculated n, μ, and σ values were on average within 10% of the experimentally measured charge state distributions. In addition to modeling charge state distributions, the native charge state model is implemented to calculate theoretical S/N values for various protein masses.
Figure 2.
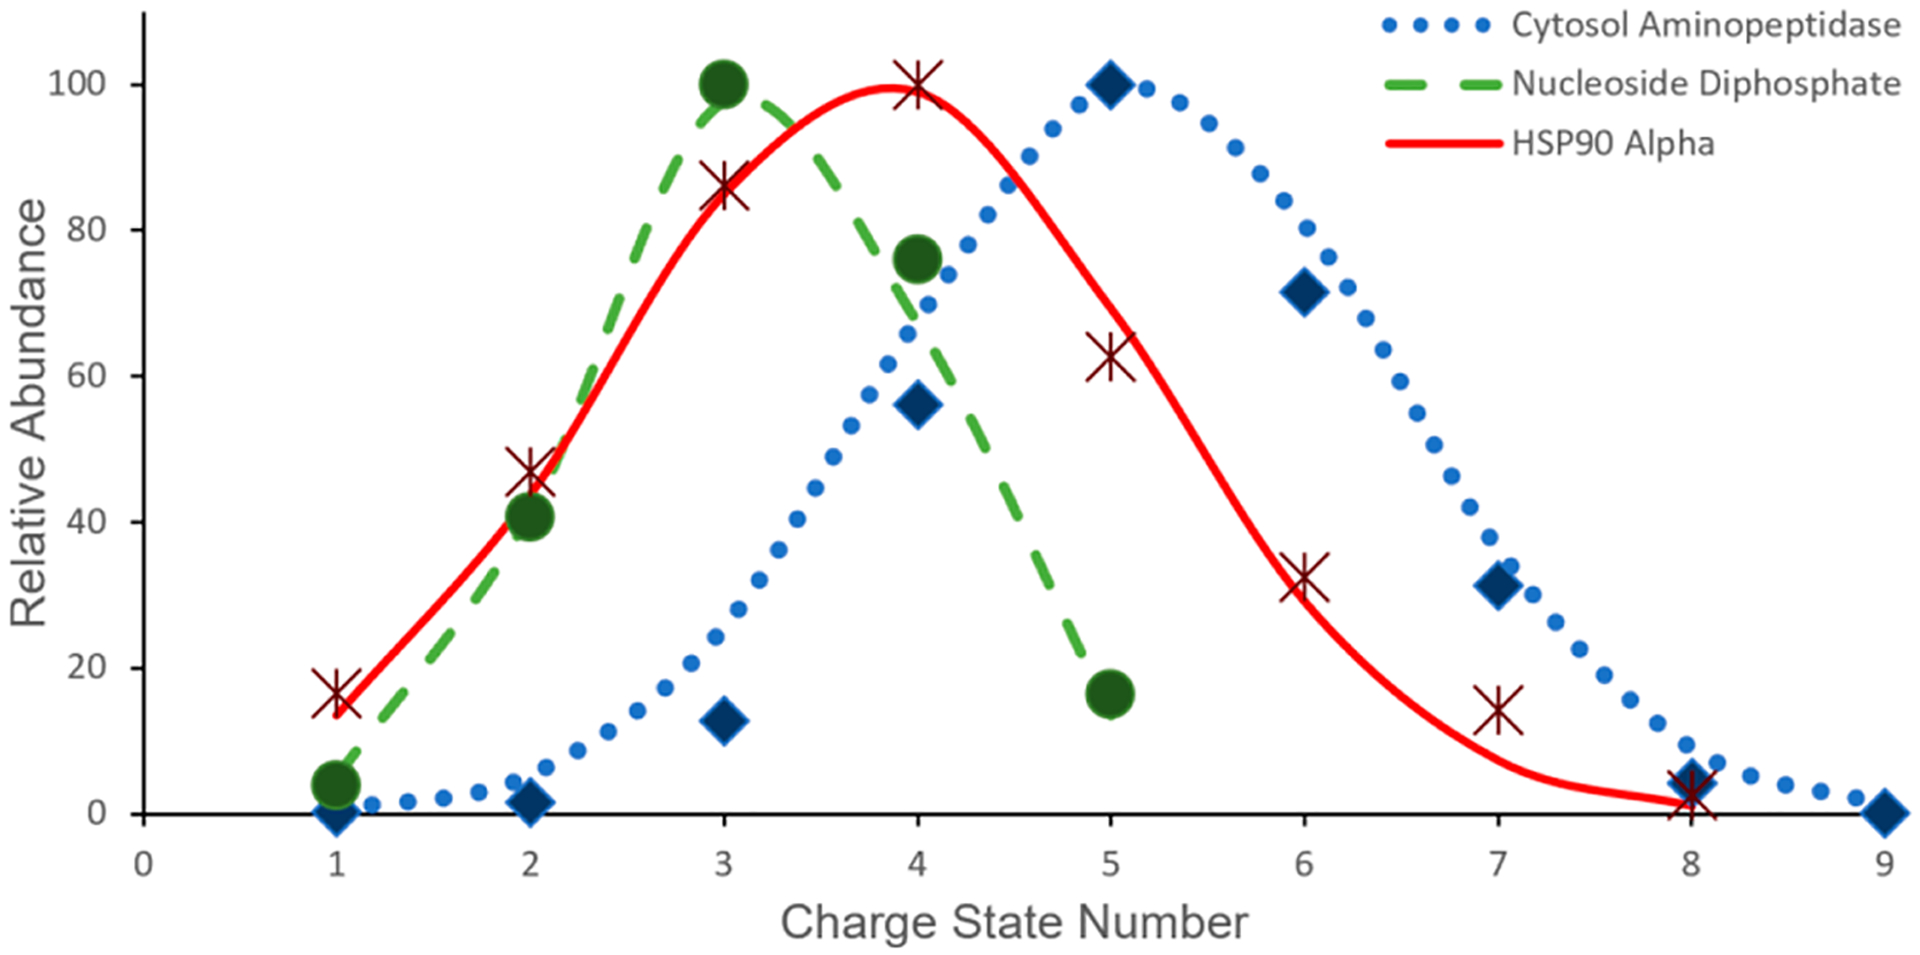
Examples of Gaussian fits to experimental charge state distributions for 3 out of the 22 native complexes utilized to create the corresponding native charge state model (eq 3).
Figure 3.
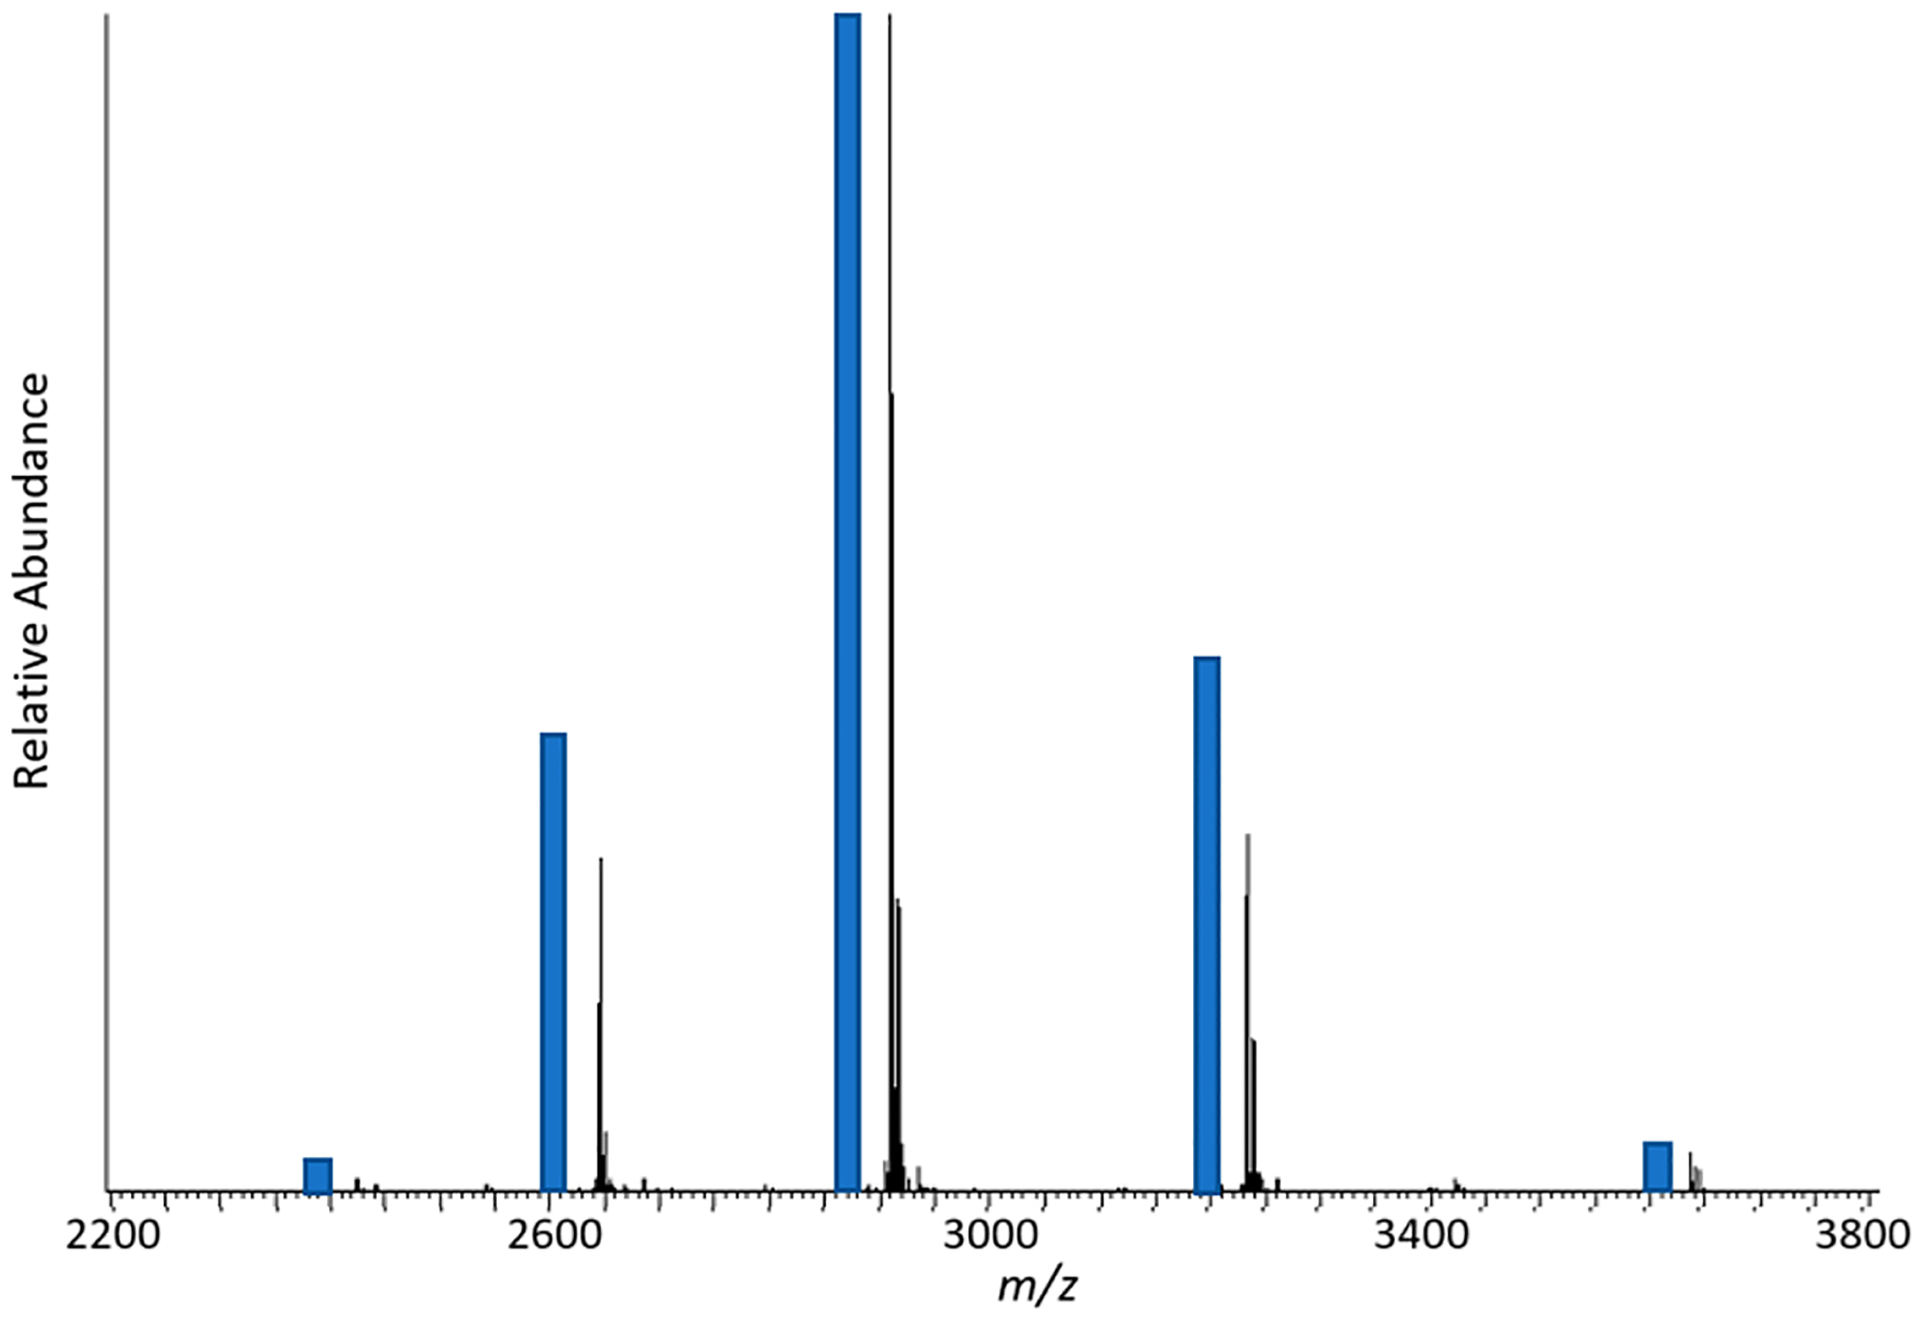
Theoretical charge state intensity fit (offset blue bars) compared to experimental charge state distribution of carbonic anhydrase.
A fixed number of charges (1 million), distributed over denaturing and native theoretical models, can be used to calculate S/N for both resolution settings as a function of molecular weight. Ions were assumed to have a 1+ charge state to eliminate any difference in the total number of ions distributed into available charge state channels. Figure 4 shows the trends for theoretically calculated and experimentally determined S/N values for native and denatured species as a function of mass. Again, splitting ions solely into charge states (no isotopic distributions) was acquired experimentally with low resolution settings to collect data on one peak per charge state for ubiquitin, myoglobin, carbonic anhydrase, and enolase (Supplemental Figures S3–10; top panels). For both theoretical and experimental S/N values, narrower charge state distributions under native conditions produce much higher S/N than under denatured conditions. Additionally, substantial decay in S/N under denatured conditions occurs around 20–30 kDa; this is not the case under native conditions. For masses over 30 kDa, native conditions are associated with S/N values 10x higher than denatured conditions. The reduced number of charge states calculated for native over the 10–100 kDa range results in a decay constant too small to see over the explored mass range. These effects can be explained by the significantly lower number of charge states observed under native conditions, shown visually by Figure 1 for a species around 30 kDa.
Figure 4.

Differences in decay of theoretically calculated (blue) and experimentally determined (orange) S/N values as a function of increasing mass taking into account the differences in number of charge states observed for electrosprayed native (circles) and denatured (triangles) protein ions. For experimentally determined points proteins used for their calculation are labeled on the plot (orange).
As mass increases for species under native conditions, there is a significantly smaller number of visible charge states when compared to the same mass species under denaturing conditions. Over the 90 kDa mass weight range explored theoretically in this study, the number of visible charge states increases from 10 to 87 under denatured conditions, while increasing from 4 to 6 under native conditions. Even if the mass range is extended out to 1 megadalton (Supplemental Figure S2) there are only 16 visible charge states under native conditions with a S/N still higher than their denatured counterparts at 30 kDa.
Effects of Charge State and Isotopic Distribution.
To obtain a more realistic understanding of the S/N comparison between native and denatured conditions, effects of signal dilution from both charge state and isotopic distributions have to be taken into account:
| (4) |
Equation 4 is the relationship of the (target) number of charges collected within a scan, the sensitivity of the detector (previously shown in eq 1), and S/N under native conditions taking into account distribution of ions into isotopic distributions in each charge state. To accomplish this, contribution from isotopic distributions are normalized to the relative intensity of each charge state and summed. This is repeated for all visible charge states present at a particular analyte mass weight. Figure 5 shows the comparison of theoretically calculated and experimentally determined S/N values under denatured and native conditions as a function of mass, accounting for contributions from charge state and isotopic distributions. To account for both charge state and isotope effects experimentally the instrumental resolution was increased approximately 10-fold to achieve isotopic resolution for all charge states of ubiquitin, myoglobin, carbonic anhydrase, and enolase (Supplemental Figures S3–10; bottom panels). When accounting for both charge state and isotope effects in S/N values (Figure 5), a few similarities and differences from the previous analysis (shown in Figure 4) need to be noted. Although S/N values under native conditions are still higher than under denatured conditions, incorporating isotopic distributions has a pronounced effect on S/N under native conditions. This pronounced S/N reduction under native conditions is attributed to splitting ion signals from only a few charge state channels into approximately an order of magnitude more peaks upon adding isotope effects. As a result, S/N under native conditions shows a much higher exponential decay constant with the inclusion of isotope effects (Figure 5), similar to that under denatured conditions. Still, even with increased S/N decay under native conditions, S/N is increased by 10 times in the 30–100 kDa range in comparison to S/N under denatured conditions.
Figure 5.
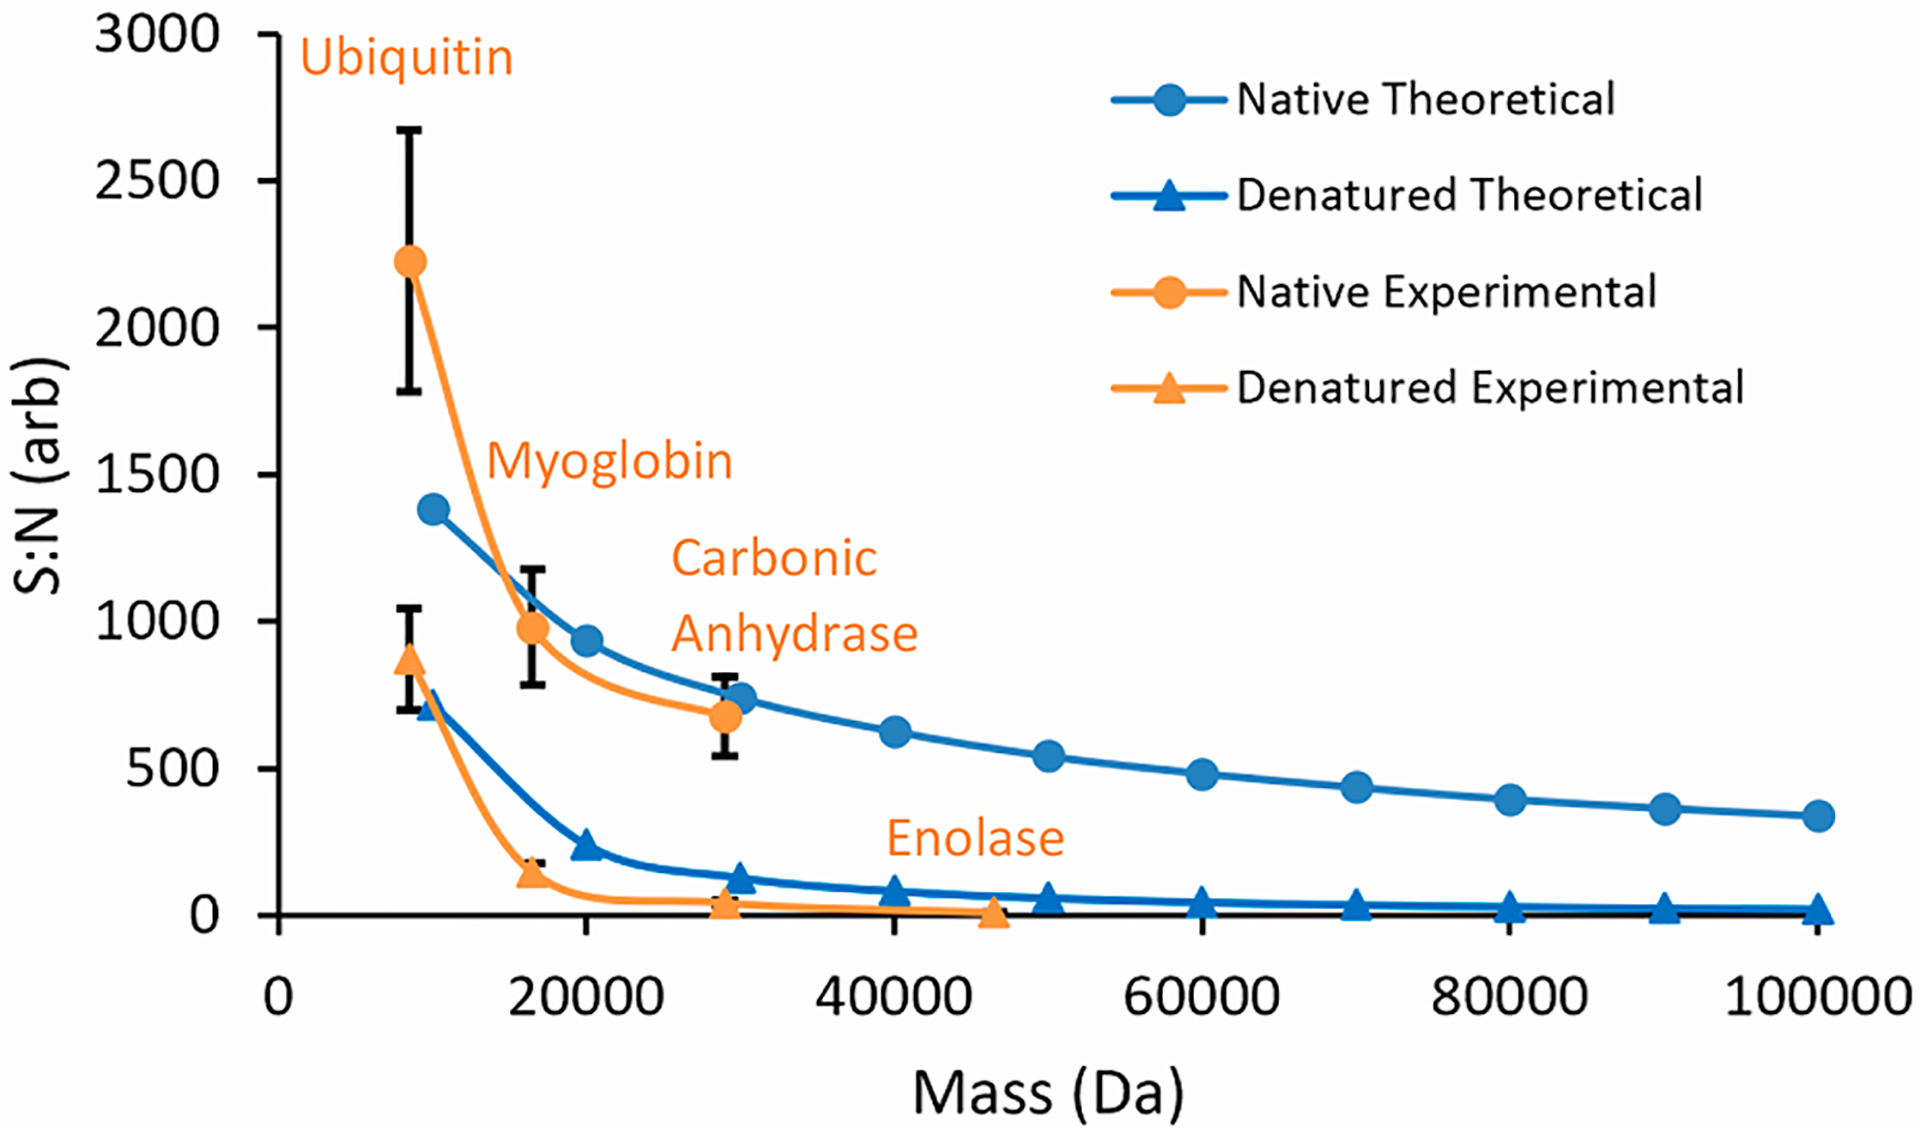
Differences in decay of theoretically calculated (blue) and experimentally determined (orange) S/N values as a function of increasing mass taking into account the differences in number of charge states and isotopic distributions observed for electrosprayed native (circles) and denatured (triangles) protein ions. For experimental determined points proteins used for their calculation are labeled on the plot (orange). Added isotope effects result in overall lower S/N values and a higher exponential decay constant for native species when compared to Figure 4. Due to loss of isotopic resolution and inability to hit the specified AGC target limit, enolase under native conditions was not added to the plot.
The addition of isotopes to the model provides further insight for situations in which isotopic resolution is required. Currently, practitioners of denaturing, and, to some extent, native mass spectrometric analysis of proteins rely on isotopic distributions for data analysis.33 Therefore, understanding the extent to which isotopic distributions affect the detection of proteins is relevant and timely.
Peak Capacity.
The different carbonic anhydrase charge state distributions under native and denatured conditions, shown in Figure 1, can be further explored in complex mixtures. Figure 6 shows examples of mass spectra of a four-protein mixture (enolase, carbonic anhydrase, myoglobin, and ubiquitin) under native and denatured conditions. For this elementary example, species overlap from extended charge state distributions are extensive under denaturing conditions. This complicates peak identification and assignment. However, minimal peak overlap issues are present under native conditions.
Figure 6.
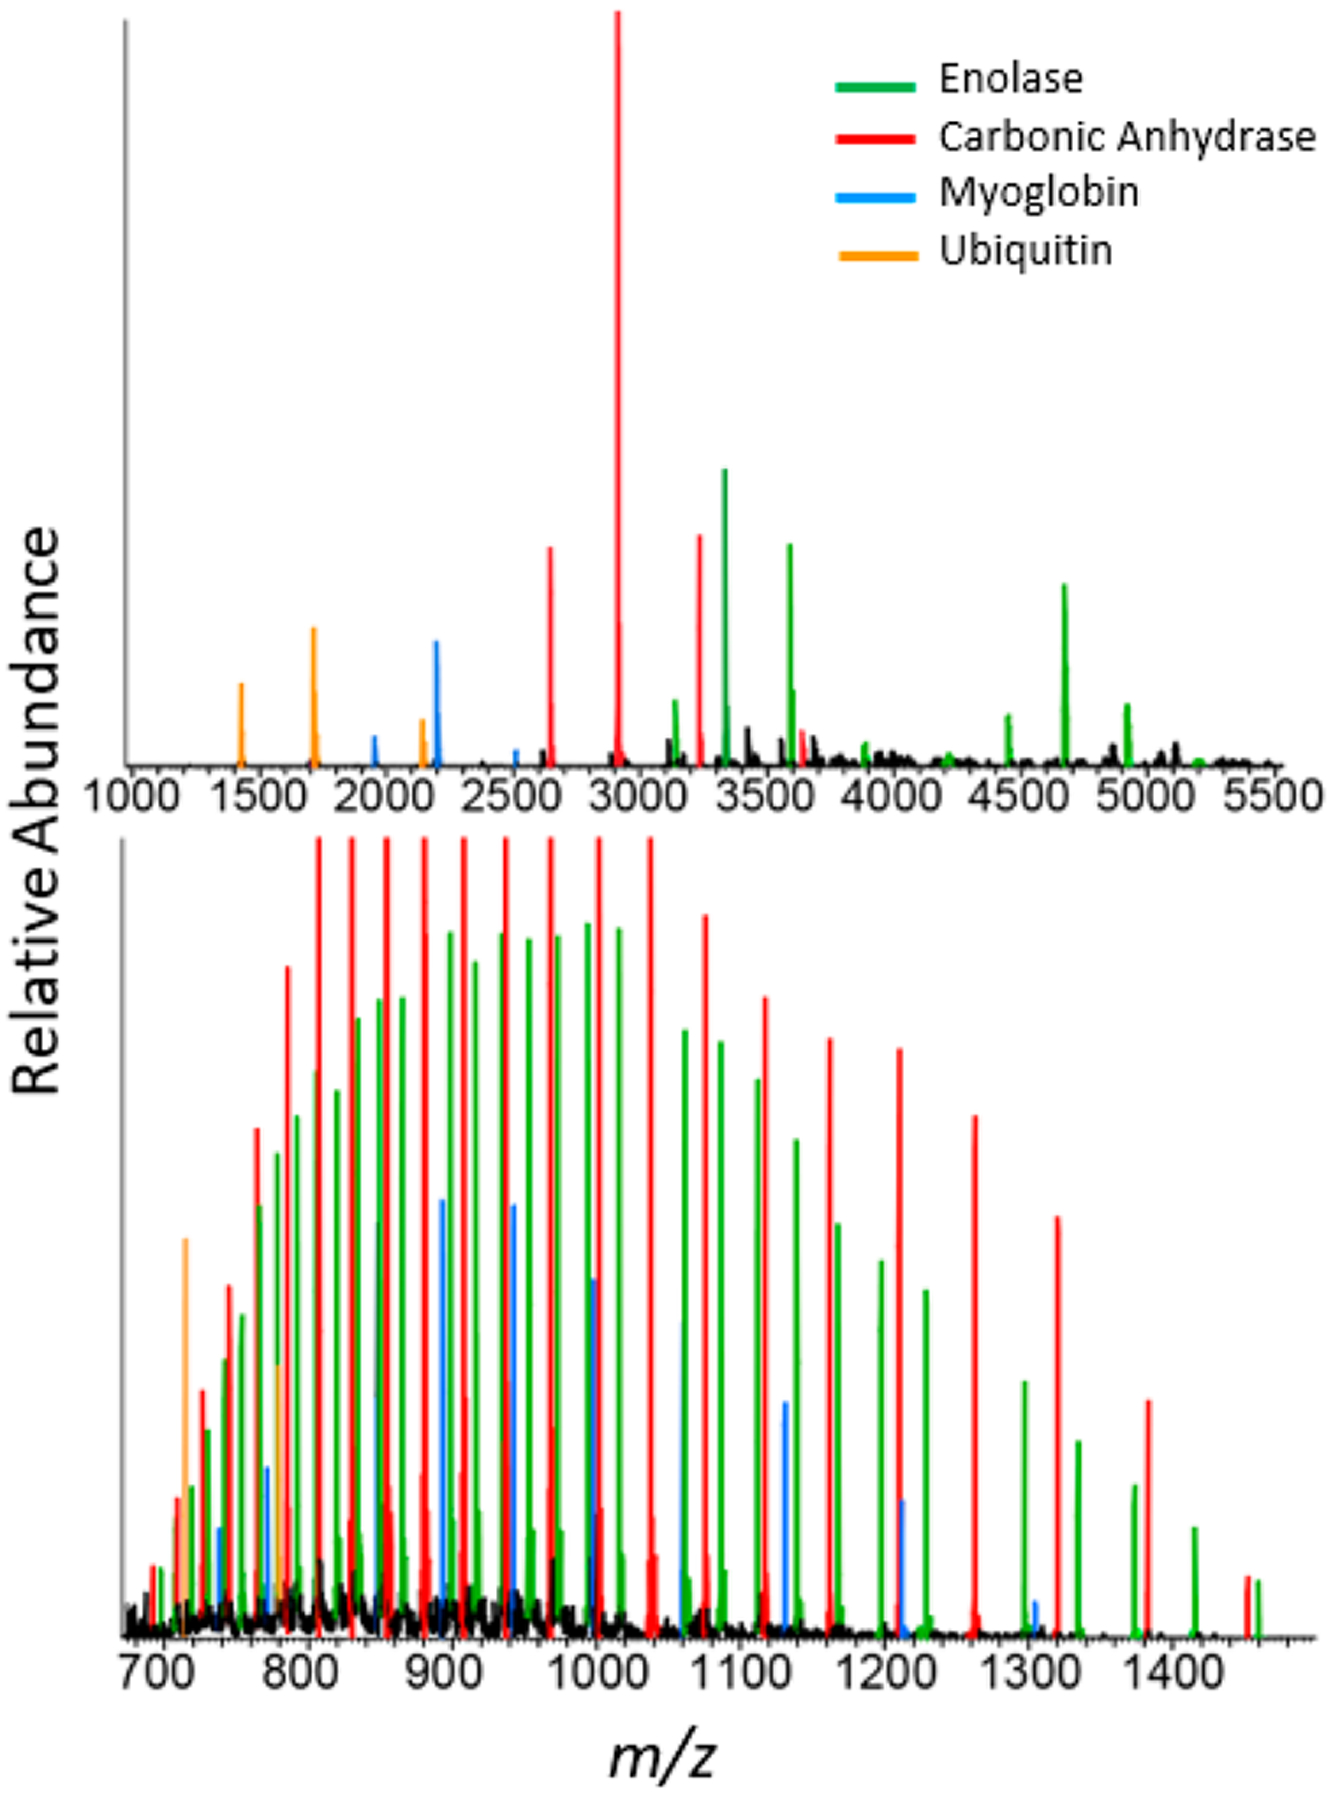
Mixture of enolase (green), carbonic anhydrase (red), myoglobin (blue), and ubiquitin (orange) under native (top panel) and denaturing (bottom panel) electrospray ionization conditions. Under native conditions enolase forms dimer and monomer charge state distributions at higher and lower m/z values, respectively.
Extending this analysis further to a higher number of proteins, we explore differences in peak density for the entire human proteome. For the 20415 human protein entries present in the Uniprot database,58 the highest and lowest possible m/z values under native conditions were calculated to be 19979 (ID: Q8WZ42, MW: 3.81 MDa, charge: +191) and 130 (ID: P0DPR3, MW: 260 Da, charge: +2), respectively, and under denatured conditions were calculated to be 3456 (ID: P62945, MW: 3.456 kDa, charge: +1) and 250.5 (ID: P01858, MW: 501 Da, charge: +2). The number of charge states, average charge state, and corresponding highest/lowest charge state was calculated for each Uniprot mass entry utilizing the previously determined denatured charge state model53 and newly determined native charge state model (eq 3). In addition, the total number of individual charge state peaks for the proteome was calculated to be 105379 under native conditions and 1115629 under denatured conditions. The number of individual charge state peaks can be divided by the width of the mass window (highest m/z – lowest m/z) to calculate the average peak density per 1 m/z. This produces a peak density of 5 under native conditions and 348 under denatured conditions. This large difference in peak density is one of the strongest arguments for native type analysis of complex mixtures. As the field advances and higher complexity protein mixtures are produced from processes such as GELFrEE fractionation, native mass spectrometry can be a tool utilized to analyze these protein mixtures without further prefractionation or online separation techniques.
Beat Frequency Patterns.
Transient beat patterns under native and denatured conditions are intrinsically different in nature. Theoretical difference in isotopic beat spacing was calculated by using the Fernando de la Mora equation and constant charge density equation to determine approximate charge states under native and denatured conditions. Beat spacings for masses ranging between 10 and 100 kDa are illustrated in Figure 7. The frequency of the Orbitrap mass analyzer was held constant at an approximate value of 1 MHz at m/z 200, and the calculated charge states were utilized to determine isotope spacing. Finally, the beat frequency between two isotopes under native and denatured conditions was calculated at each selected mass. At low mass, isotope beat frequency under native conditions is higher than that under denatured conditions, but decreases significantly faster as a function of mass. At mass values ≥8 kDa the native isotope beat frequency is lower than the denatured isotope beat frequency. This is explained by the dominating contribution of the base frequency on which the isotopic distribution is centered. Although the distance between isotopes under native conditions is larger, its effect on beat frequency is minimal. As a result, longer acquisition times will be needed to collect the same number of beats for native species as their denatured counterparts to further resolve native spectra.
Figure 7.
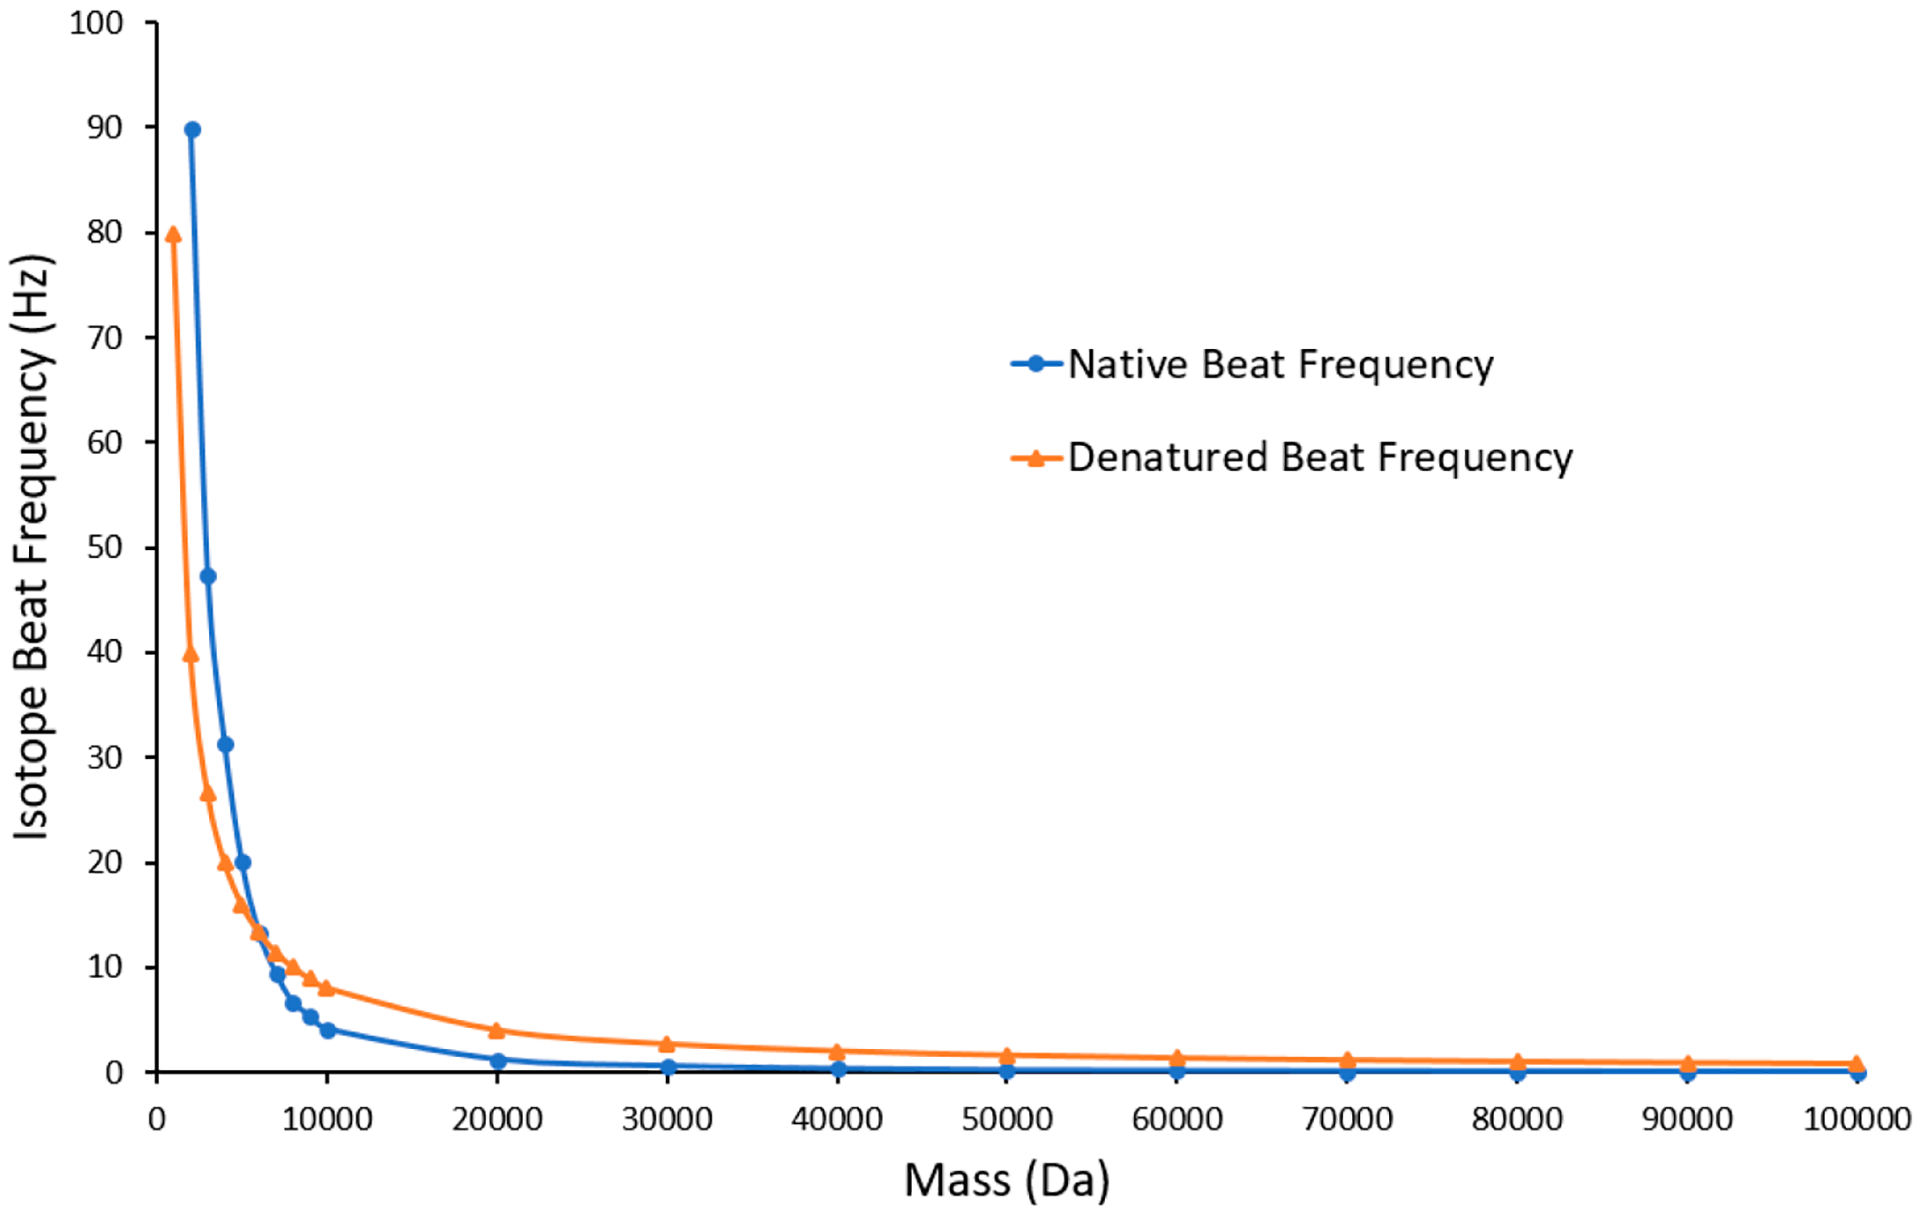
Native (blue) and denatured (orange) isotope beat frequencies as a function of species mass.
However, narrower charge state distribution and lower charge states available under native conditions have a positive effect on transients. Lower charge states result in higher beat frequencies and fewer visible charge states coincide with less irregular and complicated beat patterns.59 The collisional cross-section of the analyte ion with the Orbitrap background gas plays an integral part in transient beat exponential decay. Holding the background gas pressure constant at 2 × 10⁻¹⁰ Torr, we explored the transients for the most abundant carbonic anhydrase charge state under native (+10) and denatured (+26) conditions. At a resolution setting of 240000 at m/z 200 the exponential decay rate for the isolated native and denatured charge state corresponds to λ ≈ 1.5 and 8, respectively. This results in 77% signal loss under native conditions and 99.99% signal loss under denatured conditions over the transient acquisition time. Hence, the utilization of longer transients has been cautioned due to collision-induced signal dampening.60 As increasing resolution requires longer transient acquisition times, this effect will be smaller under native conditions.
Lower amounts of signal loss for native species is positive news as mass spectrometry continues to push the resolution limits on larger native proteins and their complexes. Although native beat spacing is further apart as depicted in Figure 7, the exponential decay rate for native signals is over 5 times lower. This ratio is expected to improve for protein masses over ~29 kDa with even higher collisional cross sections than carbonic anhydrase under denaturing conditions. Increased ion lifetimes overcompensate for lower beat frequencies accompanied by native species, enabling isotopic resolution of species with molecular weights well in excess of those typically resolved under denatured conditions.
Mass spectrometers and ionization techniques are continually being optimized to increase resolution, mass range, and sensitivity. As a result, native mass spectrometry has substantially grown over the past decade. With this in mind, there is still much work to be completed with improving native ionization conditions and creating high-throughput mass spectrometry options. The lack of native compatible fractionation methods has limited the expansion of native techniques into routine laboratory applications. In addition, precursor fragmentation (MS/MS) experiments are more difficult as native ions have structures presenting lower collisional cross sections and many times contain disulfide bonds that further stabilize the proteins. These conditions can cause the generation of less fragment ions, increasing difficulty for protein identification and proteoform characterization.
CONCLUSION
The theoretical and experimental data presented in this study exemplify many of the strengths of native mass spectrometry. The first is the ~10× S/N sensitivity gain from narrower charge state distributions accessed through native conditions. This sensitivity further increases when isotopic resolution is achieved for native and denatured species. Narrower charge state distributions produce simple native spectra with minimal overlap in mixtures containing multiple proteins when compared to their denatured counterparts. In addition, the lower exponential decay constant for native ions with lower collisional cross sections was determined within the Orbitrap analyzer. Slower signal decay is necessary to isotopically resolve high mass species with longer acquisition times.
Supplementary Material
ACKNOWLEDGMENTS
We Konstantin Ayzikov and Thermo Fisher Scientific for their help with native and denatured experimental ion decay determination from time domain transient files.
Footnotes
Supporting Information
The Supporting Information is available free of charge at https://pubs.acs.org/doi/10.1021/jasms.9b00040.
Statistical trends including average charge state vs mass, extension of Figure 4 to 1 megadalton, experimental examples of S/N calculations for charge state and isotope effects, and list of native complexes used to produce native models (PDF)
Complete contact information is available at: https://pubs.acs.org/10.1021/jasms.9b00040
The authors declare no competing financial interest.
REFERENCES
- (1).Loo JA Studying noncovalent protein complexes by electrospray ionization mass spectrometry. Mass Spectrom. Rev 1997, 16, 1–23. [DOI] [PubMed] [Google Scholar]
- (2).Loo JA Electrospray ionization mass spectrometry: a technology for studying noncovalent macromolecular complexes. Int. J. Mass Spectrom 2000, 200, 175–186. [Google Scholar]
- (3).Kaddis CS; Loo JA Native Protein MS and Ion Mobility: Large Flying Proteins with ESI. Anal. Chem 2007, 79, 1778–1784. [DOI] [PubMed] [Google Scholar]
- (4).Catherman AD; Skinner OS; Kelleher NL Top Down Proteomics: Facts and Perspectives. Biochem. Biophys. Res. Commun 2014, 445, 683–693. [DOI] [PMC free article] [PubMed] [Google Scholar]
- (5).Heck AJR; van den Heuvel RHH Investigation of intact protein complexes by mass spectrometry. Mass Spectrom. Rev 2004, 23, 368–389. [DOI] [PubMed] [Google Scholar]
- (6).Benesch JLP; Ruotolo BT Mass Spectrometry: an Approach Come-of-Age for Structural and Dynamical Biology. Curr. Opin. Struct. Biol 2011, 21, 641–649. [DOI] [PMC free article] [PubMed] [Google Scholar]
- (7).Wilm M; Mann M Analytical Properties of the Nano-electrospray Ion Source. Anal. Chem 1996, 68, 1–8. [DOI] [PubMed] [Google Scholar]
- (8).Wilm MS; Mann M Electrospray and Taylor-Cone theory, Dole’s beam of macromolecules at last? Int. J. Mass Spectrom. Ion Processes 1994, 136, 167–180. [Google Scholar]
- (9).Rosati S; Rose RJ; Thompson NJ; van Duijn E; Damoc E; Denisov E; Makarov A; Heck AJR Exploring an Orbitrap Analyzer for the Characterization of Intact Antibodies by Native Mass Spectrometry. Angew. Chem., Int. Ed 2012, 51, 12992–12996. [DOI] [PubMed] [Google Scholar]
- (10).Eckers C; Laures AMF; Giles K; Major H; Pringle S Evaluating the utility of ion mobility separation in combination with high-pressure liquid chromatography/mass spectrometry to facilitate detection of trace impurities in formulated drug products. Rapid Commun. Mass Spectrom 2007, 21, 1255–1263. [DOI] [PubMed] [Google Scholar]
- (11).Sobott F; Hernández H; McCammon MG; Tito MA; Robinson CV A Tandem Mass Spectrometer for Improved Transmission and Analysis of Large Macromolecular Assemblies. Anal. Chem 2002, 74, 1402–1407. [DOI] [PubMed] [Google Scholar]
- (12).Fort KL; van de Waterbeemd M; Boll D; Reinhardt-Szyba M; Belov ME; Sasaki E; Zschoche R; Hilvert D; Makarov AA; Heck AJR Expanding the structural analysis capabilities on an Orbitrap-based mass spectrometer for large macromolecular complexes. Analyst 2018, 143, 100–105. [DOI] [PubMed] [Google Scholar]
- (13).Li H; Nguyen HH; Ogorzalek Loo RR; Campuzano IDG; Loo JA An integrated native mass spectrometry and top-down proteomics method that connects sequence to structure and function of macromolecular complexes. Nat. Chem 2018, 10, 139. [DOI] [PMC free article] [PubMed] [Google Scholar]
- (14).van de Waterbeemd M; Fort KL; Boll D; Reinhardt-Szyba M; Routh A; Makarov A; Heck AJR High-fidelity mass analysis unveils heterogeneity in intact ribosomal particles. Nat. Methods 2017, 14, 283. [DOI] [PubMed] [Google Scholar]
- (15).Belov ME; Damoc E; Denisov E; Compton PD; Horning S; Makarov AA; Kelleher NL From Protein Complexes to Subunit Backbone Fragments: A Multi-stage Approach to Native Mass Spectrometry. Anal. Chem 2013, 85, 11163–11173. [DOI] [PubMed] [Google Scholar]
- (16).Li H; Sheng Y; McGee W; Cammarata M; Holden D; Loo JA Structural Characterization of Native Proteins and Protein Complexes by Electron Ionization Dissociation-Mass Spectrometry. Anal. Chem 2017, 89, 2731–2738. [DOI] [PMC free article] [PubMed] [Google Scholar]
- (17).Cammarata MB; Schardon CL; Mehaffey MR; Rosenberg J; Singleton J; Fast W; Brodbelt JS Impact of G12 Mutations on the Structure of K-Ras Probed by Ultraviolet Photodissociation Mass Spectrometry. J. Am. Chem. Soc 2016, 138, 13187–13196. [DOI] [PubMed] [Google Scholar]
- (18).Haverland NA; Skinner OS; Fellers RT; Tariq AA; Early BP; LeDuc RD; Fornelli L; Compton PD; Kelleher NL Defining Gas-Phase Fragmentation Propensities of Intact Proteins During Native Top-Down Mass Spectrometry. J. Am. Soc. Mass Spectrom 2017, 28, 1203–1215. [DOI] [PMC free article] [PubMed] [Google Scholar]
- (19).Lorenzen K, Duijn E. v. Native Mass Spectrometry as a Tool in Structural Biology; John Wiley & Sons, Inc., 2001. [DOI] [PubMed] [Google Scholar]
- (20).Sharon M; Robinson CV The Role of Mass Spectrometry in Structure Elucidation of Dynamic Protein Complexes. Annu. Rev. Biochem 2007, 76, 167–193. [DOI] [PubMed] [Google Scholar]
- (21).Benesch JLP; Ruotolo BT; Simmons DA; Robinson CV Protein Complexes in the Gas Phase: Technology for Structural Genomics and Proteomics. Chem. Rev 2007, 107, 3544–3567. [DOI] [PubMed] [Google Scholar]
- (22).Uetrecht C; Versluis C; Watts NR; Roos WH; Wuite GJL; Wingfield PT; Steven AC; Heck AJR High-resolution mass spectrometry of viral assemblies: Molecular composition and stability of dimorphic hepatitis B virus capsids. Proc. Natl. Acad. Sci. U. S. A 2008, 105, 9216–9220. [DOI] [PMC free article] [PubMed] [Google Scholar]
- (23).Zhang Z; Pan H; Chen X Mass spectrometry for structural characterization of therapeutic antibodies. Mass Spectrom. Rev 2009, 28, 147–176. [DOI] [PubMed] [Google Scholar]
- (24).Beck A; Sanglier-Cianférani S; Van Dorsselaer A Biosimilar, Biobetter, and Next Generation Antibody Characterization by Mass Spectrometry. Anal. Chem 2012, 84, 4637–4646. [DOI] [PubMed] [Google Scholar]
- (25).Wu S-L; Jiang H; Lu Q; Dai S; Hancock WS; Karger BL Mass Spectrometric Determination of Disulfide Linkages in Recombinant Therapeutic Proteins Using Online LC-MS with Electron-Transfer Dissociation. Anal. Chem 2009, 81, 112–122. [DOI] [PMC free article] [PubMed] [Google Scholar]
- (26).Sundaram S; Matathia A; Qian J; Zhang J; Hsieh M-C; Liu T; Crowley R; Parekh B; Zhou Q An innovative approach for the characterization of the isoforms of a monoclonal antibody product. mAbs. 2011, 3, 505–512. [DOI] [PMC free article] [PubMed] [Google Scholar]
- (27).Mauko L; Nordborg A; Hutchinson JP; Lacher NA; Hilder EF; Haddad PR Glycan profiling of monoclonal antibodies using zwitterionic-type hydrophilic interaction chromatography coupled with electrospray ionization mass spectrometry detection. Anal. Biochem 2011, 408, 235–241. [DOI] [PubMed] [Google Scholar]
- (28).Huang S-Y; Hsieh Y-T; Chen C-H; Chen C-C; Sung W-C; Chou M-Y; Chen S-F Automatic Disulfide Bond Assignment Using a1 Ion Screening by Mass Spectrometry for Structural Characterization of Protein Pharmaceuticals. Anal. Chem 2012, 84, 4900–4906. [DOI] [PubMed] [Google Scholar]
- (29).Atmanene C; Wagner-Rousset E; Malissard M; Chol B; Robert A; Corvaïa N; Dorsselaer AV; Beck A; Sanglier-Cianférani S Extending Mass Spectrometry Contribution to Therapeutic Monoclonal Antibody Lead Optimization: Characterization of Immune Complexes Using Noncovalent ESI-MS. Anal. Chem 2009, 81, 6364–6373. [DOI] [PubMed] [Google Scholar]
- (30).Whitelegge JP; Gundersen CB; Faull KF Electrosprayionization mass spectrometry of intact intrinsic membrane proteins. Protein Sci. 1998, 7, 1423–1430. [DOI] [PMC free article] [PubMed] [Google Scholar]
- (31).Zhan L-P, Liu C-Z, Nie Z-X In Mass Spectrometry of Membrane Proteins; Wang H, Li G, Eds.; Springer: Singapore, 2018. [Google Scholar]
- (32).Lippens JL; Nshanian M; Spahr C; Egea PF; Loo JA; Campuzano IDG Fourier Transform-Ion Cyclotron Resonance Mass Spectrometry as a Platform for Characterizing Multimeric Membrane Protein Complexes. J. Am. Soc. Mass Spectrom 2018, 29, 183–193. [DOI] [PMC free article] [PubMed] [Google Scholar]
- (33).Skinner OS; Havugimana PC; Haverland NA; Fornelli L; Early BP; Greer JB; Fellers RT; Durbin KR; Do Vale LHF; Melani RD; Seckler HS; Nelp MT; Belov ME; Horning SR; Makarov AA; LeDuc RD; Bandarian V; Compton PD; Kelleher NL An informatic framework for decoding protein complexes by top-down mass spectrometry. Nat. Methods 2016, 13, 237. [DOI] [PMC free article] [PubMed] [Google Scholar]
- (34).Skinner OS; Haverland NA; Fornelli L; Melani RD; Do Vale LHF; Seckler HS; Doubleday PF; Schachner LF; Srzentić K; Kelleher NL; Compton PD Top-down characterization of endogenous protein complexes with native proteomics. Nat. Chem. Biol 2018, 14, 36. [DOI] [PMC free article] [PubMed] [Google Scholar]
- (35).Chowdhury SK; Katta V; Chait BT Probing conformational changes in proteins by mass spectrometry. J. Am. Chem. Soc 1990, 112, 9012–9013. [Google Scholar]
- (36).amalikova M; Grandori R Protein Charge-State Distributions in Electrospray-Ionization Mass Spectrometry Do Not Appear To Be Limited by the Surface Tension of the Solvent. J. Am. Chem. Soc 2003, 125, 13352–13353. [DOI] [PubMed] [Google Scholar]
- (37).Grandori R Origin of the conformation dependence of protein charge state distributions in electrospray ionization mass spectrometry. J. Mass Spectrom 2003, 38, 11–15. [DOI] [PubMed] [Google Scholar]
- (38).Hall Z; Robinson CV Do Charge State Signatures Guarantee Protein Conformations? J. Am. Soc. Mass Spectrom 2012, 23, 1161–1168. [DOI] [PubMed] [Google Scholar]
- (39).Fenn JB; Mann M; Meng CK; Wong SF; Whitehouse CM Electrospray ionization–principles and practice. Mass Spectrom. Rev 1990, 9, 37–70. [Google Scholar]
- (40).Konijnenberg A; Butterer A; Sobott F Native ion mobility-mass spectrometry and related methods in structural biology. Biochim. Biophys. Acta, Proteins Proteomics 2013, 1834, 1239–1256. [DOI] [PubMed] [Google Scholar]
- (41).Konermann L Addressing a Common Misconception: Ammonium Acetate as Neutral pH “Buffer” for Native Electrospray Mass Spectrometry. J. Am. Soc. Mass Spectrom 2017, 28, 1827–1835. [DOI] [PubMed] [Google Scholar]
- (42).Nielsen JE Analyzing Enzymatic pH Activity Profiles and Protein Titration Curves Using Structure-Based pKa Calculations and Titration Curve Fitting. Methods Enzymol. 2009, 454, 233. [DOI] [PubMed] [Google Scholar]
- (43).Bisswanger H Enzyme assays. Perspectives in Science. 2014, 1, 41–55. [Google Scholar]
- (44).Kaltashov IA; Mohimen A Estimates of Protein Surface Areas in Solution by Electrospray Ionization Mass Spectrometry. Anal. Chem 2005, 77, 5370–5379. [DOI] [PMC free article] [PubMed] [Google Scholar]
- (45).Konermann L; Douglas DJ Equilibrium unfolding of proteins monitored by electrospray ionization mass spectrometry: distinguishing two-state from multi-state transitions. Rapid Commun. Mass Spectrom 1998, 12, 435–442. [DOI] [PubMed] [Google Scholar]
- (46).Loo JA; Edmonds CG; Udseth HR; Smith RD Effect of reducing disulfide-containing proteins on electrospray ionization mass spectra. Anal. Chem 1990, 62, 693–698. [DOI] [PubMed] [Google Scholar]
- (47).Gumerov DR; Dobo A; Kaltashov IA Protein—Ion Charge-State Distributions in Electrospray Ionization Mass Spectrometry: Distinguishing Conformational Contributions from Masking Effects. Eur. J. Mass Spectrom 2002, 8, 123–129. [Google Scholar]
- (48).Jhingree JR; Beveridge R; Dickinson ER; Williams JP; Brown JM; Bellina B; Barran PE Electron transfer with no dissociation ion mobility–mass spectrometry (ETnoD IM-MS). The effect of charge reduction on protein conformation. Int. J. Mass Spectrom 2017, 413, 43–51. [Google Scholar]
- (49).Chandler SA; Benesch JLP Mass spectrometry beyond the native state. Curr. Opin. Chem. Biol 2018, 42, 130–137. [DOI] [PubMed] [Google Scholar]
- (50).Makarov A; Denisov E Dynamics of Ions of Intact Proteins in the Orbitrap Mass Analyzer. J. Am. Soc. Mass Spectrom 2009, 20, 1486–1495. [DOI] [PubMed] [Google Scholar]
- (51).Scigelova M; Hornshaw M; Giannakopulos A; Makarov A Fourier transform mass spectrometry. Mol. Cell. Proteomics 2011, DOI: 10.1074/mcp.O111.009431. [DOI] [PMC free article] [PubMed] [Google Scholar]
- (52).Zubarev RA; Makarov A Orbitrap Mass Spectrometry. Anal. Chem 2013, 85, 5288–5296. [DOI] [PubMed] [Google Scholar]
- (53).Compton PD; Zamdborg L; Thomas PM; Kelleher NL On the Scalability and Requirements of Whole Protein Mass Spectrometry. Anal. Chem 2011, 83, 6868–6874. [DOI] [PMC free article] [PubMed] [Google Scholar]
- (54).Rockwood AL; Van Orden SL; Smith RD Rapid Calculation of Isotope Distributions. Anal. Chem 1995, 67, 2699–2704. [DOI] [PubMed] [Google Scholar]
- (55).Limbach PA; Grosshans PB; Marshall AG Experimental determination of the number of trapped ions, detection limit, and dynamic range in Fourier transform ion cyclotron resonance mass spectrometry. Anal. Chem 1993, 65, 135–140. [Google Scholar]
- (56).Leary JA; Schenauer MR; Stefanescu R; Andaya A; Ruotolo BT; Robinson CV; Thalassinos K; Scrivens JH; Sokabe M; Hershey JWB Methodology for Measuring Conformation of Solvent-Disrupted Protein Subunits using T-WAVE Ion Mobility MS: An Investigation into Eukaryotic Initiation Factors. J. Am. Soc. Mass Spectrom 2009, 20, 1699–1706. [DOI] [PubMed] [Google Scholar]
- (57).Stengel F; Baldwin AJ; Painter AJ; Jaya N; Basha E; Kay LE; Vierling E; Robinson CV; Benesch JLP Quaternary dynamics and plasticity underlie small heat shock protein chaperone function. Proc. Natl. Acad. Sci. U. S. A 2010, 107, 2007. [DOI] [PMC free article] [PubMed] [Google Scholar]
- (58).The Human Protein Atlas, 2019; https://www.proteinatlas.org.
- (59).Hofstadler SA; Bruce JE; Rockwood AL; Anderson GA; Winger BE; Smith RD Isotopic beat patterns in Fourier transform ion cyclotron resonance mass spectrometry: implications for high resolution mass measurements of large biopolymers. Int. J. Mass Spectrom. Ion Processes 1994, 132, 109–127. [Google Scholar]
- (60).Easterling ML; Amster IJ; van Rooij GJ; Heeren RMA Isotope beating effects in the analysis of polymer distributions by Fourier transform mass spectrometry. J. Am. Soc. Mass Spectrom 1999, 10, 1074–1082. [Google Scholar]
Associated Data
This section collects any data citations, data availability statements, or supplementary materials included in this article.


