

Abstract
This study shows that it is possible to obtain homogeneous mixtures of two chemically distinct polymers with a lithium salt for electrolytic applications. This approach is motivated by the success of using mixtures of organic solvents in modern lithium-ion batteries. The properties of mixtures of a polyether, poly(ethylene oxide) (PEO), a poly(ether–acetal), poly(1,3,6-trioxocane) (P(2EO-MO)), and lithium bis(trifluoromethanesulfonyl)imide (LiTFSI) salt were studied by small-angle neutron scattering (SANS) and electrochemical characterization in symmetric cells. The SANS data are used to determine the miscibility window and quantify the effect of added salt on the thermodynamic interactions between the polymers. In the absence of salt, PEO/P(2EO-MO) blends are homogeneous and characterized by attractive interactions, i.e., a negative Flory–Huggins interaction parameter, χ. The addition of small amounts of salt results in a positive effective Flory–Huggins interaction parameter, χeff, and macrophase separation. Surprisingly, miscible blends and negative χeff parameters are obtained when the salt concentration is increased beyond a critical value. The electrochemical properties of PEO/P(2EO-MO)/LiTFSI blends at a given salt concentration were close to those obtained in PEO/LiTFSI electrolytes at the same salt concentration. This suggests that in the presence of PEO the electrochemical properties exhibited by P(2EO-MO) chains are similar to those of PEO chains. This work opens the door to a new direction for creating new and improved polymer electrolytes either by combining existing polymers and salt or by synthesizing new polymers with the specific aim of including them in miscible polymer blend electrolytes.
Graphical Abstract
INTRODUCTION
There is considerable interest in replacing flammable organic solvents with nonvolatile polymers in rechargeable lithium batteries. It has long been recognized that high dielectric constant and low viscosity are necessary for rapid ion transport in liquid electrolytes. In the case of lithium-ion batteries designed to operate at room temperature, this is achieved by blending materials. Ethylene carbonate has a dielectric constant of 89.8 but is a solid at room temperature (mp = 36.4 °C) while dimethyl carbonate is a low-viscosity liquid (mp = 4.6 °C) but has a dielectric constant of 3.1.1 Neither is a suitable solvent for electrolytic applications. However, a blend of ethylene carbonate and dimethyl carbonate is an excellent solvent for these applications and is a major component of lithium-ion battery electrolytes.
Translating the notion of liquid electrolyte mixtures to polymer electrolyte blends is nontrivial. While most low molar mass liquids are miscible with each other (e.g., polar molecules like ethanol are miscible in nonpolar liquids such as hexanes), finding pairs of miscible polymers is extremely rare.2,3 Polymers with seemingly minor differences in monomer structure are entirely immiscible. For example, the solubility of polyethylene in polypropylene (both polymers have empirical formulas CH2) is negligible.4,5 The reason for this is well established: mixing is usually promoted by entropic considerations. The entropic gain of mixing polymers with long chains, however, is orders of magnitude smaller due to the connectivity of the monomers.
The purpose of this paper is to demonstrate that it is possible to create homogeneous mixtures of polymers with different polarities to create a new type of material for use in lithium batteries: miscible polymer blend electrolytes.
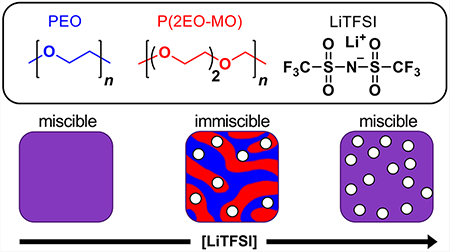
Our system of interest is a blend of a polyether, poly(ethylene oxide) (PEO), a poly(ether–acetal), poly-(1,3,6-trioxocane) (P(2EO-MO)), and lithium bis(trifluoromethanesulfonyl)imide (LiTFSI) salt (see Figure 1). PEO has been thoroughly studied as a potential electrolyte for lithium batteries due to its nonvolatility, electrochemical stability, and compatibility with lithium salts.6–8 The ability of PEO to dissolve lithium salts is due to the presence of oxygen-containing ether linkages. The properties of P(2EO-MO)/LiTFSI electrolytes were reported in ref 9. We expect P(2EO-MO) to be more polar than PEO due to the increased concentration of ether and acetal oxygens. Ternary blends with polymer components of different polarities have been discussed as a means for improving ion transport in a recent theoretical paper by using a coarse-grained bead–spring model.10
Figure 1.
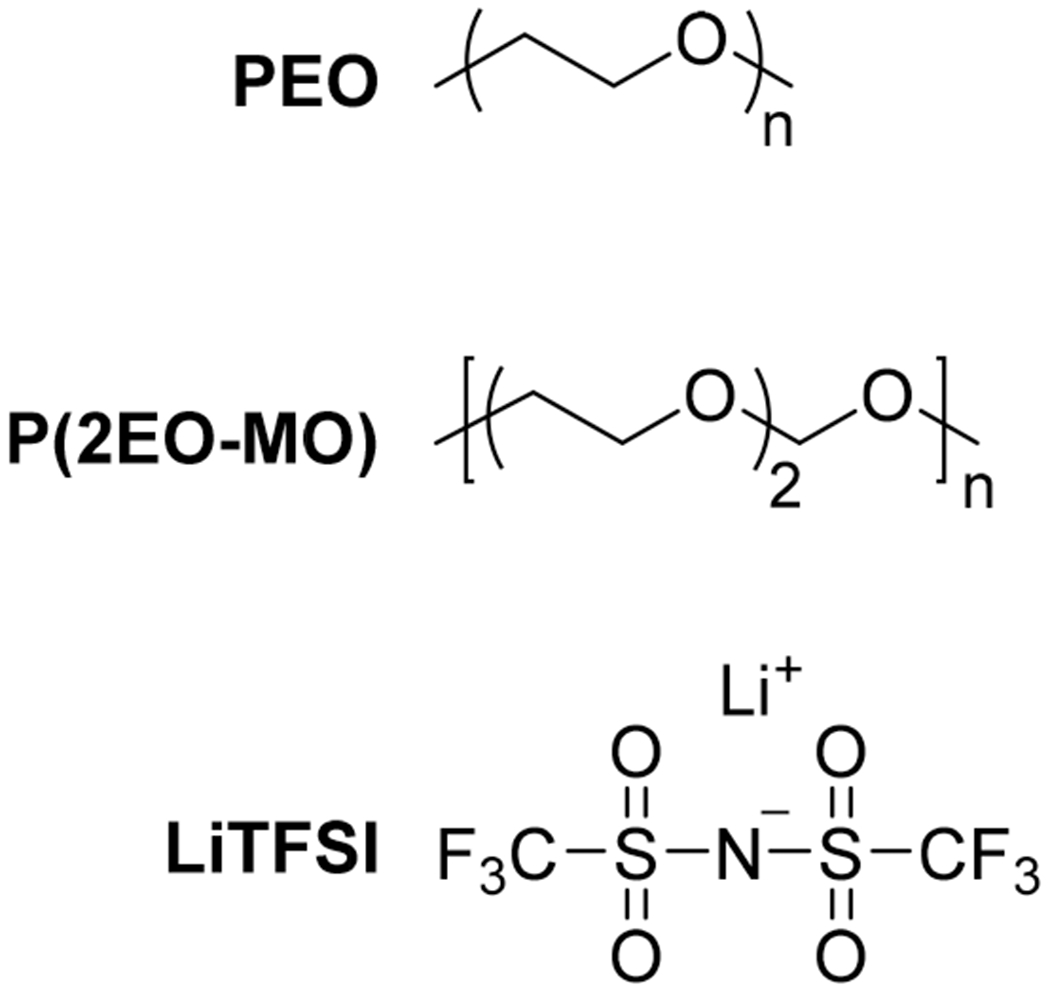
Chemical structure of poly(ethylene oxide) (PEO), poly(1,3,6-trioxocane) (P(2EO-MO)), and lithium bis(trifluoromethanesulfonyl) imide (LiTFSI).
In this work, we demonstrate that PEO is miscible with P(2EO-MO) in the neat, salt-free, state. We have also identified a range of salt concentrations over which PEO/P(2EO-MO)/LiTFSI blends remain miscible. We use the term conventional polymer electrolytes to refer to binary mixtures of a polymer and a salt such as PEO/LiTFSI or P(2EO-MO)/LiTFSI. We use the term polymer blend electrolyte to refer to ternary mixtures of two distinct polymers and a salt. The thermodynamic properties of PEO/P(2EO-MO)/LiTFSI were determined by small-angle neutron scattering (SANS) experiments. The SANS results are consistent with phase behavior inferences based on differential scanning calorimetry (DSC) experiments. Ion transport in the polymer blend electrolytes is compared with that obtained from conventional polymer electrolytes (PEO/LiTFSI and P(2EO-MO)/LiTFSI) by using both blocking and nonblocking electrodes.
MATERIALS AND METHODS
Synthesis of 1,3,6-Trioxocane, (2EO-MO).
Diethylene glycol (100 g, 0.942 mol), paraformaldehyde (37 g, 1.3 equiv), poly-(phosphoric acid) (4.0 g, 0.03 equiv), and heptane (160 mL) were combined in a 250 mL flask fitted with a Dean–Stark adapter and condenser. The reaction was stirred at 115 °C for 12 h, and water (~15 mL) was collected as the bottom layer in the trap. After the reaction mixture was cooled to room temperature, heptane was removed via rotary evaporation to give a cloudy, viscous solution. This oligomerized product was distilled at 150–180 °C under high vacuum into a receiving flask cooled in a dry ice/acetone bath. The crude mixture of diethylene glycol and 1,3,6-trioxocane was then fractionally distilled under high vacuum at 80 °C to give clear, colorless 1,3,6-trioxocane in 70% yield. The monomer was dried over CaH2 for 3 days, distilled, and degassed via three freeze–pump–thaw cycles. Spectral data matched that previously reported in ref 9. 1H NMR (500 MHz, CDCl3): δ 4.57 (s, 2H), 3.50 (s, 8H) ppm. 13C NMR (125 MHz, CDCl3): δ 97.91, 72.58, 70.61 ppm. HRMS (DART-MS): m/z calculated for C5H10O3 [H]+ 119.0703; found 119.0703.
Synthesis of Poly(1,3,6-trioxocane), P(2EO-MO).
In a glovebox under a N2 atmosphere, 1,3,6-trioxocane (6.0 g, 51 mmol) and CH2Cl2 (25.4 mL) were combined in a 100 mL flask equipped with a stir bar. Then, BF3·OEt2 (0.130 mL, 0.02 equiv) was added instantaneously, and the flask was sealed with a rubber septum. The reaction gelled after 30 min such that stirring ceased, and the solution gradually turned pink. After 1 h, the reaction was removed from the glovebox and quenched with a 1:1 mixture of acetonitrile:water (40 mL) to give a clear, colorless solution. The crude mixture was extracted with CH2Cl2 (30 mL × 3), dried with Na2SO4, filtered, and rotovapped until reaching a total volume of ~30 mL. The polymer was then precipitated into hexanes (400 mL), redissolved in CH2Cl2 (30 mL), and precipitated again into cold isopropanol (400 mL) to give a white solid. The polymer was dried under high vacuum overnight. Typical yields ranged from 50 to 60%, and 1H and 13C NMR analyses suggest that the polymerization proceeds with excellent regioregularity. Notably, polymerization is initiated by adventitious water in the reaction mixture. Furthermore, monomer conversion is highly dependent on monomer concentration and reaction temperature. Therefore, molar mass is difficult to control in this system, and variance was expected across multiple batches. Sample 1: Mn = 26.1 kg mol−1, Đ = 1.83. Sample 2: Mn = 16.1 kg mol−1, Đ = 1.76. Sample 3: Mn = 26.7 kg mol−1, Đ = 1.66. Sample 4: Mn = 55.2 kg mol−1, Đ = 1.97. Tg = −66 °C, Tm = 39 °C. Spectral data matched that previously reported in ref 9. 1H NMR (500 MHz, CDCl3): δ 4.74 (s, 2H), 3.69 (m, 8H) ppm. 13C NMR (125 MHz, CDCl3): δ 95.73, 70.60, 67.02 ppm.
Polymer Blend Electrolyte Preparation and Composition.
The molar masses, Mn, and dispersities, Đ, of PEO (Polymer Source), deuterated PEO (dPEO) (Polymer Source), and P(2EO-MO) (synthesized as described above) used in this study are summarized in Table 1.
Table 1.
Molar Masses and Dispersities of Homopolymers Used in This Study
| polymer | Mn (kg mol−1) | Đ |
|---|---|---|
| PEO | 35.0 | 1.08 |
| dPEO | 35.0 | 1.09 |
| P(2EO-MO) sample 1 | 26.1 | 1.83 |
| P(2EO-MO) sample 2 | 26.7 | 1.66 |
| P(2EO-MO) sample 3 | 16.0 | 1.76 |
| P(2EO-MO) sample 4 | 55.2 | 1.97 |
Electrolytes used for SANS experiments were made up of blends of dPEO, P(2EO-MO) (Mn = 26.7 or 16.0 kg mol−1), and LiTFSI, while electrolytes for DSC and electrochemical experiments were made up of blends of PEO, P(2EO-MO) (Mn = 26.1 kg mol−1), and LiTFSI (see Table 2). Electrochemical measurements were also performed on conventional polymer electrolytes of P(2EO-MO) (Mn = 55.2 kg mol−1) with LiTFSI. All polymers were dried in a glovebox antechamber under vacuum at 90 °C for at least 24 h prior to use. LiTFSI was dried under vacuum at 120 °C for at least 72 h.
Table 2.
Polymer Components of Blends Used in Each Experiment
| experiment | component 1 | component 2 |
|---|---|---|
| DSC and electrochemistry | PEO | P(2EO-MO) sample 1 |
| SANS | dPEO | P(2EO-MO) sample 2 |
| SANS | dPEO | P(2EO-MO) sample 3 |
The polymer composition of the blends was 50/50 by weight. We denote component 1 as PEO and component 2 as P(2EO-MO). The volume fraction of each component, on a salt-free basis, is given by
| (1) |
and
| (2) |
where wi and ρi are the mass and density, respectively, of component i in the blend. The volume fractions are approximately equal (see Table 3). The volume fraction occupied by the polymer components in the blends containing LiTFSI is given by
| (3) |
where wsalt is the mass of LiTFSI in the blend and ρsalt = 2.023 g cm−3.11 Volume changes of mixing are ignored in our analysis.
Table 3.
Volume Fractions, ϕi, and α Values Used in RPA Fits of dPEO/P(2EO-MO)/LiTFSI Blendsa
| dPEO/P(2EO-MO)/LiTFSI (dPEO Mn = 35.0 kg mol−1; P(2EO-MO) Mn = 26.7 kg mol−1) | dPEO/P(2EO-MO)/LiTFSI (dPEO Mn = 35.0 kg mol−1; P(2EO-MO) Mn = 16.0 kg mol−1) | |||||||
|---|---|---|---|---|---|---|---|---|
| r | ϕ1 | ϕ2 | ϕpolymer | α | ϕ1 | ϕ2 | ϕpolymer | α |
| 0 | 0.516 | 0.484 | 1 | 1.274 ± 0.007 | 0.517 | 0483 | 1 | 1.331 ± 0.044 |
| 0.08 | 0.517 | 0.483 | 0.742 | 1.205 ± 0.014 | ||||
| 0.10 | 0.518 | 0.482 | 0.696 | 1.173 ± 0.001 | 0.517 | 0483 | 0.705 | 1.212 ± 0.011 |
| 0.14 | 0.515 | 0.485 | 0.621 | 1.122 ± 0.002 | ||||
The errors shown correspond to one standard deviation from the temperature averaging.
We assume that the salt is uniformly distributed in the blend. The salt concentration of the blends was quantified by the molar ratio of Li atoms in the salt to O atoms in the polymers (r = [Li]/[O]), calculated as follows:
| (4) |
where MEO is the monomer molar mass of PEO (MEO = 44.05 g mol−1), M2EO-MO is the monomer molar mass of P(2EO-MO) (M2EO-MO = 118.1 g mol−1), and Msalt is the molar mass of LiTFSI (Msalt = 287.1 g mol−1). A factor of 3 was included as 2EO-MO contains three oxygen atoms, while EO contains one oxygen atom per monomer, as shown in Figure 1.
The volume fraction of PEO and the LiTFSI associated with PEO in the polymer blend electrolytes, f, is estimated via the following equation:
| (5) |
Equation 5 is based on the assumption that the value of r in the PEO-rich fluctuations is the same as that in the P(2EO-MO)-rich fluctuations.
Electrolyte r values ranged from 0 to 0.14. All electrolyte solutions in acetonitrile were transparent, indicating complete dispersion of all mixture components. The electrolytes were stirred on a hot plate at 80 °C until all of the acetonitrile had evaporated and then further dried in a glovebox antechamber under vacuum at 90 °C for 24 h to remove any residual solvent.
Density measurements for neat P(2EO-MO) at 90 °C were taken by measuring the mass of electrolyte within a known volume, following procedures described previously.11 The average of three density measurements (ρ2 = 1.32 ± 0.04 g cm−3) was used for subsequent calculations.
DSC Sample Preparation and Experiments.
Samples (~10 mg) were hermetically sealed in aluminum pans in an argon glovebox. DSC experiments were run with two heating and cooling cycles at a heating rate of 20 °C min−1 and a cooling rate of 5 °C min−1 using a Thermal Advantage Q200 calorimeter at the Molecular Foundry, Lawrence Berkeley National Lab. The temperature ranged from −80 to 120 °C. The glass transition temperature (Tg) values are obtained from analysis of the second heating run.
SANS Sample Preparation and Experiment.
Sample preparation for SANS experiments was conducted following procedures outlined previously.12 The blends were made such that the volume fractions of each component were ~0.5 (see Table 3).
SANS experiments were conducted on the NG7SANS beamline at the National Institute of Standards and Technology Center for Neutron Research.13 Measurements were performed with a neutron wavelength of 6 Å and up to three sample-to-detector distances (SDDs) of 13, 4, and 1 m. The shortest, 1 m distance, was used with a detector offset of 25 cm to extend the scattering angle (2θ) attainable. Overall, the three configurations allowed for access to a scattering wave-vector magnitude, , ranging from 0.03 to 5.5 nm−1. The neutron beam size was defined by a 9.5 × 10⁻³ m aperture. Data were collected at 10 °C increments between 60 and 110 °C. All measurements were reversible and repeatable upon either heating or cooling. Samples were equilibrated for at least 30 min at each temperature. A 9-position Peltier cooling/heating sample changer block was used to drive and maintain constant sample temperature. Samples of thickness of 1 mm were used. Data were reduced by using the software package for IGOR provided by the NIST Center for Neutron Research.14 The total scattering intensity was corrected for detector sensitivity, background, and empty cell contributions as well as sample transmission and thickness.14,15
Electrochemical Sample Preparation and Experiments.
Electrochemical sample preparation and experiments were conducted following the procedures previously described,16 using 508 μm thick silicone spacers and conducting the measurements at 90 °C.
RESULTS AND DISCUSSION
A commonly used method to determine polymer miscibility is the measurement of the glass transition temperature, Tg, via DSC. The existence of a single Tg is indicative of a miscible blend.17 Figure 2a shows DSC curves for PEO/P(2EO-MO)/LiTFSI blends at r = 0.04 and 0.10. The r = 0.04 blend exhibits two glass transitions (Tg1 = −46 °C, Tg2 = −38 °C) which indicates the blend is phase separated. In contrast, the r = 0.10 blend exhibits a single glass transition (Tg = −24 °C), which indicates that the blend is composed of a single phase. The absence of a melting transition in the DSC data from the higher salt blend is consistent with numerous reports in the literature indicating that the addition of salt suppresses crystallization of PEO.9,16,18,19 All of the thermodynamic and electrochemical data presented in this paper were obtained above the melting temperatures of the blends.
Figure 2.
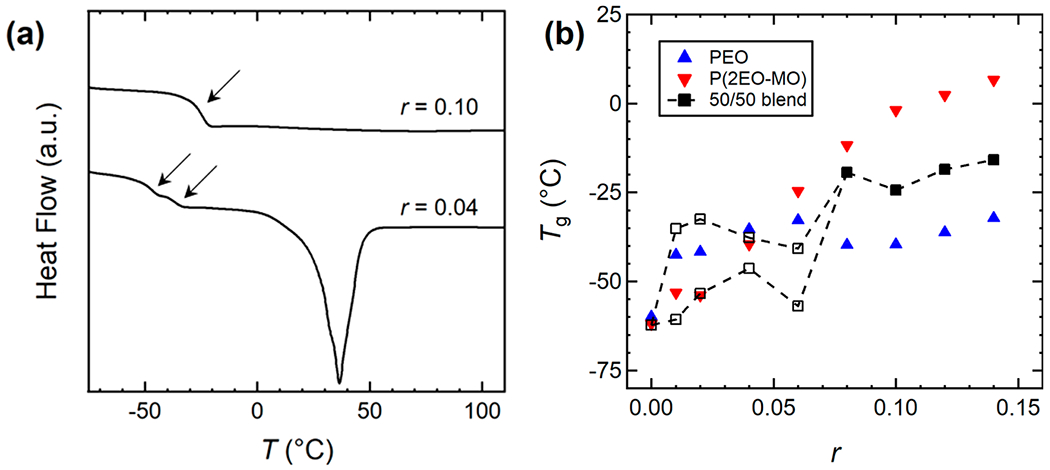
(a) Representative DSC curves showing one Tg for a 50/50 blend of PEO (Mn = 35.0 kg mol−1) and P(2EO-MO) (Mn = 26.1 kg mol−1) at r = 0.10 and two Tg values at r = 0.04. Arrows denote regions associated with the glass transition. (b) Tg as a function of salt concentration, r, for each conventional polymer electrolyte system (solid blue triangles for PEO (Mn = 100 kg mol−1) and solid red triangles for P(2EO-MO) (Mn = 55.2 kg mol−1)) and the polymer blend electrolytes. Polymer blends possessing a single Tg at high r values (0.08 ≤ r ≤ 0.14) and blends exhibiting two Tg values at low r values (0.02 ≤ r ≤ 0.06) are denoted by closed black squares and open black squares, respectively. The uncertainty of the Tg measurements is assumed to be that of the instrument’s given calorimetric reproducibility and precision (±0.05%). Data for PEO and P(2EO-MO) were taken from ref 9.
Figure 2b shows the complete set of glass transition temperatures for each polymer blend electrolyte and the corresponding conventional polymer electrolyte taken from ref 9. In the neat blend, the Tg values of PEO and P(2EO-MO) are too close to be distinguished by DSC. For r values between 0.02 and 0.06, the polymer blend electrolytes exhibit two Tg values, denoted by open squares, indicating immiscibility. However, from r = 0.08 to 0.14, the blend has a single Tg, indicating miscibility at these higher salt concentrations. The Tg for all systems generally increases with increasing salt concentration. The correlation between Tg and salt loading is attributed to the solvated ions inducing physical cross-linking of the polymer chains.20
The measured absolute SANS intensity, I(q), as a function of the magnitude of the scattering vector, q, for the dPEO/P(2EO-MO)/LiTFSI blends at 90 °C is shown in Figure 3. Also shown as a reference is a dPEO/PEO/LiTFSI blend with volume fraction ϕ1 = 0.50 and r = 0.10 at 90 °C. Distinct differences are apparent between the scattering profiles of dPEO/P(2EO-MO)/LiTFSI blends with low salt concentrations (0.02 ≤ r ≤ 0.06) and that of the neat blend (r = 0) and blends with high salt concentrations (r ≥ 0.08). The blends with low salt concentration show a rapid rise in I(q) at low q (q < 0.1 nm−1), indicative of phase separation. The neat blend and high r-value blends have similar scattering profiles as that of the dPEO/PEO/LiTFSI sample. In the range 0.4 < q (nm−1) < 2, I(q) from these blends is approximately proportional to q−2 while I(q) is a much weaker function of q for q < 0.4 nm−1. These features are characteristic of scattering from a homogeneous binary polymer blend wherein the polymer chains obey random walk statistics.21 The SANS results regarding polymer blend miscibility are consistent with the results obtained from DSC.
Figure 3.
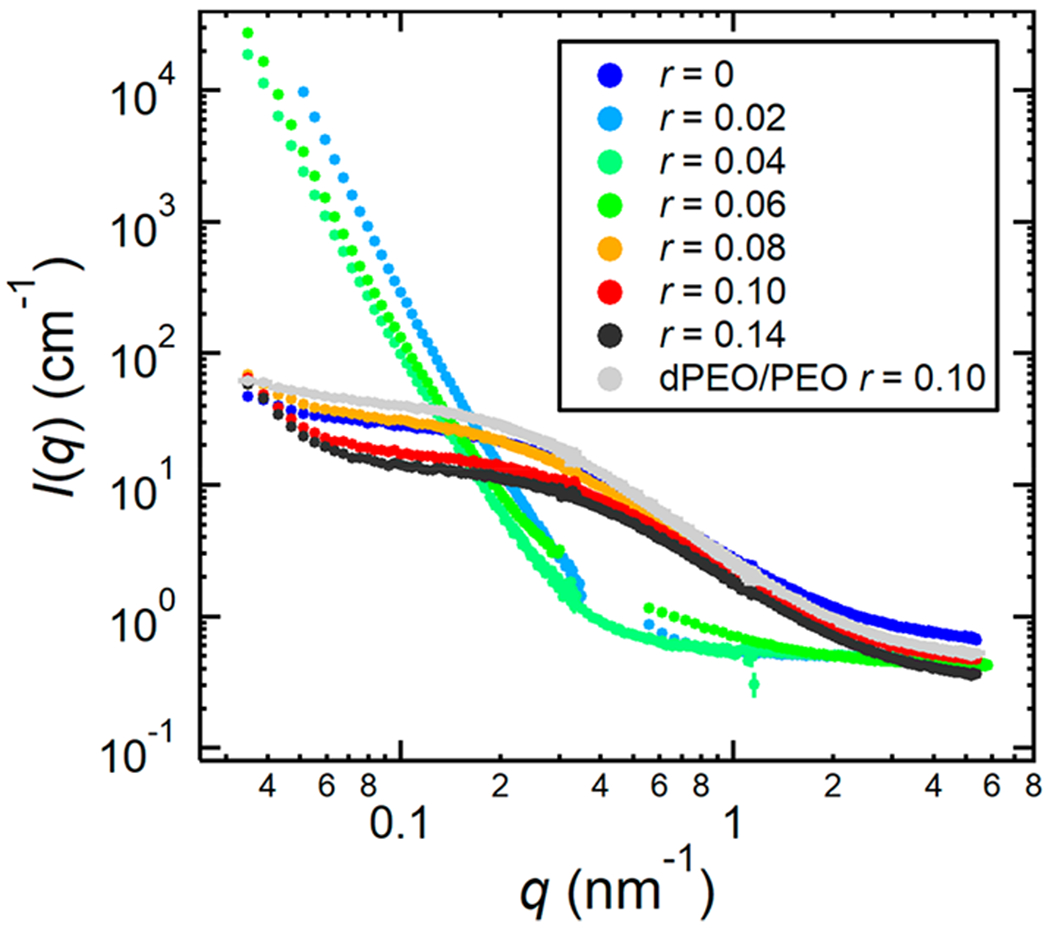
Measured absolute SANS intensity, I(q), vs scattering vector, q, at 90 °C, for blends of dPEO (Mn = 35.0 kg mol−1) and P(2EO-MO) (Mn = 26.7 kg mol−1) at varying LiTFSI salt concentrations, r, and a dPEO/PEO sample with r = 0.10. Note that for r = 0.02 and r = 0.06 there is an intermediate range of q that was not recorded due to insufficient beamtime. Error bars represent one standard deviation of the scattering data and in most cases are smaller than the data points.
Analysis of SANS data begins with a thermodynamic model for the polymer blend electrolytes. We start with the thermodynamics of mixing in a two-component polymer blend in the absence of salt. The Gibbs free energy of mixing of a homogeneous mixture of two polymers can be described by the Flory–Huggins theory:
| (6) |
where ΔGm is the free energy of mixing per unit volume, kB is the Boltzmann constant, T is the absolute temperature, ϕi is the volume fraction of component i, Ni, is the number of repeat units in chain i, and χ is the Flory–Huggins interaction parameter which describes the thermodynamic incompatibility between component 1 and 2.22,23 N1, N2 and χ are based on a reference volume, v = 0.1 nm3. A miscible blend, one that is homogeneous down to the molecular level, requires both a negative Gibbs free energy of mixing (ΔGm < 0) and a positive second derivative (∂2ΔGm/∂ϕ12 > 0).17 The critical Flory–Huggins interaction parameter value, χcrit, is given by the following:
| (7) |
Blends with χ < χcrit are predicted to be miscible, regardless of composition.
For salt-containing mixtures, we use a simple extension of eq 6:
| (8) |
where ϕpolymer is the total polymer volume fraction and ϕi (i = 1 or 2) are the salt-free polymer volume fractions. The effect of added salt is captured mainly by an effective Flory–Huggins parameter, χeff, which depends on salt concentration. In the limit of r → 0, ϕpolymer → 1, eq 8 reduces to eq 6, and χeff reduces to the conventional χ parameter for polymer blends.
Following the analysis in ref 24, the absolute SANS intensity was corrected for the contributions from scattering of the deuterated chains as well as the contributions from the incoherent scattering to obtain the absolute coherent SANS intensity:
| (9) |
where f is the estimated volume fraction of dPEO and LiTFSI in our polymer blend electrolytes (f ≈ 0.5) and IdPEO/LiTFSI(q) is the scattering from dPEO/LiTFSI mixtures taken from ref 12. Iinc(q) is the incoherent scattering background contribution to the intensities, determined by fitting I(q) to the following expression:
| (10) |
where P(q) is a form factor given by the Debye function (see eq 14), a is a constant scaling factor, and b is a constant assumed to be equal to Iinc(q).14,15,25 Figure 4 shows the coherent SANS profiles, Icoh(q), of the miscible blends at 90 °C.
Figure 4.
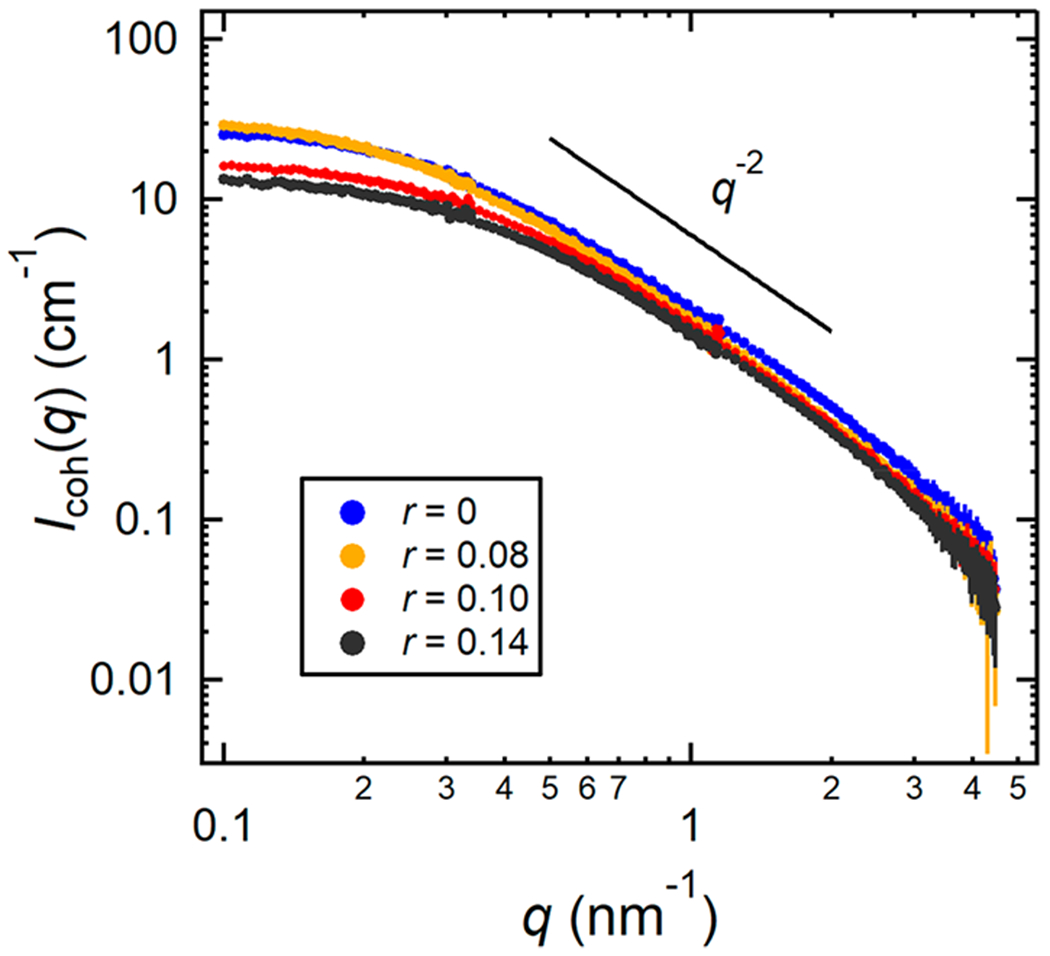
SANS intensities, Icoh(q), plotted as a function of the magnitude of the scattering vector, q, at 90 °C for the dPEO/P(2EOMO)/LiTFSI (P(2EO-MO) Mn = 26.7 kg mol−1) blends at the miscible salt concentrations. Error bars represent one standard deviation of the scattering data and in most cases are smaller than the data points.
The coherent scattering intensity for homogeneous PEO/P(2EO-MO)/LiTFSI blends is calculated by using the random phase approximation (RPA):
| (11) |
In our analysis, component 1 is dPEO, component 2 is P(2EO-MO), ϕpolymer is the volume fraction of both polymer components, dPEO and P(2EO-MO), Bi, is the coherent neutron scattering length density of component i given by Bi = bi/νi, vi and bi, are the molar monomer volumes and neutron scattering lengths of component i, respectively, and χeff is the effective Flory–Huggins interaction parameter between dPEO and P(2EO-MO) both with and without salt.21,24,26–28 In the limit q → 0, eq 11 is consistent with eq 8. The neutron scattering lengths of dPEO and P(2EO-MO) are 4.58 × 10⁻¹² cm and 1.32 × 10⁻¹² cm, respectively. The molar monomer volumes of dPEO and P(2EO-MO) were calculated in the absence of salt (ν1 = 38.98 cm3 mol−1 and ν2 = 89.47 cm3 mol−1 at 90 °C). We assume dPEO occupies the same molar volume as hydrogenous PEO. We thus obtain ρ1 = 1.23 g cm−3 and ρ2 = 1.32 g cm−3 at 90 °C. The temperature dependence of monomer volumes was applied to the contrast terms, and was determined by using the following equations: ρ1 = 1.23 − 7.31 × 10⁻⁴(T − 363) g cm−3 and ρ2 = 1.32 − 7.31 × 10⁻⁴(T − 363) g cm−3 where T is the temperature in Kelvin.29 The thermal expansion coefficient of P(2EO-MO) has not been measured; it was assumed to be the same as that of PEO.
The structure factor, Sii, is given by
| (12) |
where ϕi, is the volume fraction of polymer i on a salt-free basis. Icoh(q) depends on three volume fractions: ϕ1, ϕ2, and ϕpolymer (see eqs 11 and 12). For the blends covered in this study, these volume fractions are listed in Table 3.
Ni, is the number of repeat units in each polymer calculated by
| (13) |
where Nav is Avogadro’s number and Mi, and ρi, are the polymer molar masses (g mol−1) and densities (g cm−3) of component i, and
| (14) |
with xi = q2Rg,i2. Both components are modeled as flexible Gaussian chains according to
| (15) |
where li, is the statistical segment length of each component. The statistical segment length of PEO is l1 = 0.58 nm (based on a 0.1 nm3 reference volume).12 The statistical segment length of P(2EO-MO) has not been measured. In our calculations, we assume l1 = l2 = l = 0.58α nm, where α is a fitting parameter that accounts for differences in the statistical segment length of PEO and P(2EO-MO) and distortions of chains (e.g., chain stretching) in the blends.
Icoh(q) values for the miscible blends were first fit to eq 11 with two adjustable parameters: α and χeff. For each blend, α was found to be essentially invariant with temperature so α was averaged across all temperatures and fixed. The parameter α is greater than 1 for all blends, likely due to the increased stiffness of P(2EO-MO) chains relative to that of the PEO chains. These values are given in Table 3. Icoh(q) was then fit to eq 11 with only χeff as a fitting parameter. Representative RPA fits of Icoh(q) for a dPEO/P(2EO-MO) blend with r = 0.08 are shown in Figure 5. χeff values of −4.67 × 10⁻³ and 7.64 × 10⁻⁴ are obtained from the profiles at 70 °C and 90 °C, respectively. At 110 °C, the blend is phase separated and cannot be analyzed by RPA. Note that χeff increases with increasing temperature.
Figure 5.
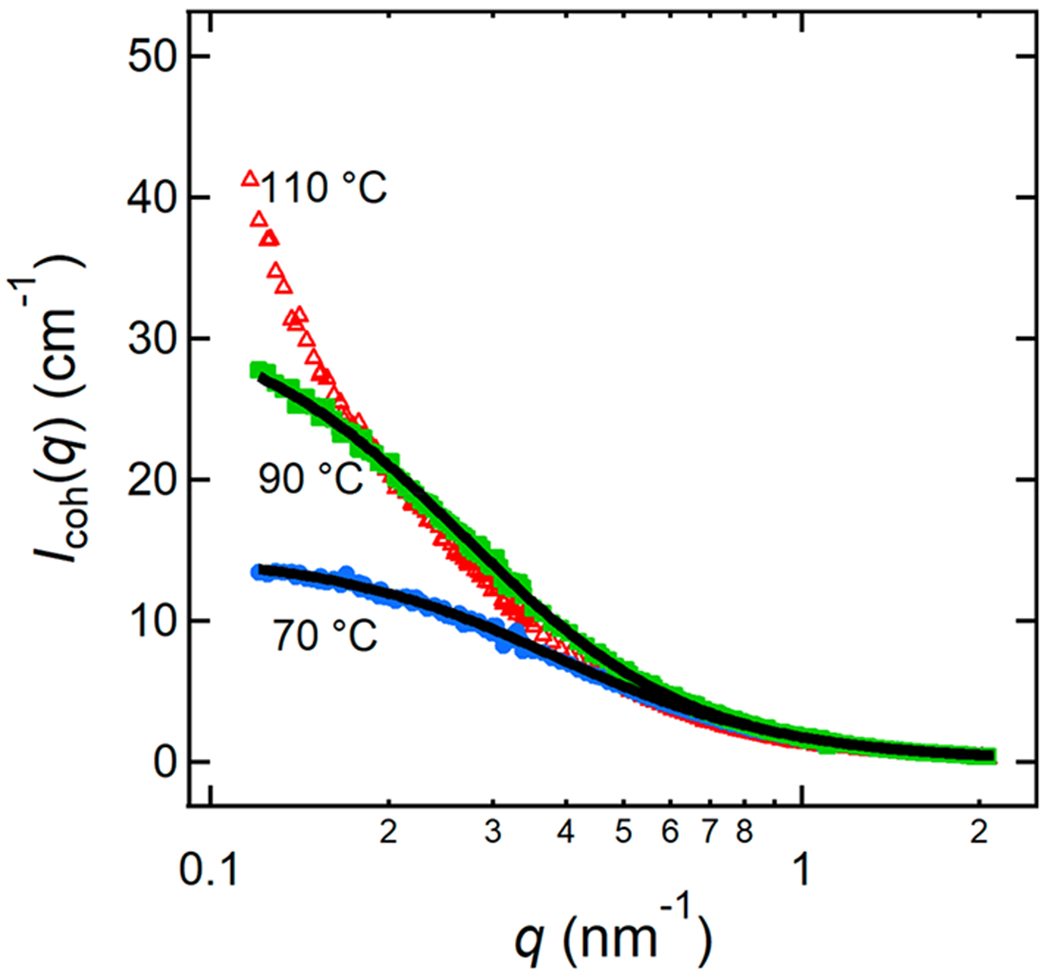
RPA fits (solid black lines) for a dPEO/P(2EO-MO)/LiTFSI (P(2EO-MO) Mn = 26.7 kg mol−1) blend with r = 0.08 at 70 °C (filled blue circles) and 90 °C (filled green squares). The 110 °C measurements (open red triangles) indicate phase separation. Error bars represent one standard deviation of the scattering data and in most cases are smaller than the data points.
Effective Flory–Huggins interaction parameters were extracted by fitting Icoh(q) to RPA for all miscible blends across a range of temperatures (60 ≤ T (°C) ≤ 110) for the high molar mass P(2EO-MO)-containing (Mn = 26.7 kg mol−1) blends at r = 0, 0.08, 0.10, and 0.14 and the low molar mass P(2EO-MO)-containing (Mn = 16.0 kg mol−1) blends at r = 0 and 0.10. The temperature dependence of χeff is given by
| (16) |
where A and B are empirically determined constants.3,30 For each blend sample, χeff was linearly fit to inverse temperature using eq 16 to extract values for A and B. These values are summarized in Table 4.
Table 4.
A and B Constants for dPEO/P(2EO-MO)/LiTFSI Blends at Various Salt Concentrations, r, and Their Linear Fit R2 Valuesa
| dPEO/P(2EO-MO)/LiTFSI (P(2EO-MO) Mn = 26.7 kg mol−1) | dPEO/P(2EO-MO)/LiTFSI (P(2EO-MO) Mn = 16.0 kg mol−1) | |||||
|---|---|---|---|---|---|---|
| r | A | B | R2 | A | B | R2 |
| 0 | −5.401 ± 0.241 | 0.0133 ± 0.0007 | 0.986 | −5.773 ± 0.172 | 0.0149 ± 0.0005 | 0.994 |
| 0.08 | −32.127 ± 1.146 | 0.0891 ± 0.0032 | 0.997 | |||
| 0.10 | −17.682 ± 0.305 | 0.0460 ± 0.0008 | 0.998 | −21.537 ± 0.480 | 0.0576 ± 0.0013 | 0.997 |
| 0.14 | 1.383 ± 1.350 | −0.0072 ± 0.0037 | 0.344 | |||
The errors shown represent one standard deviation of uncertainty for the fit for A and B according to eq 16.
All χeff parameters calculated in this study and their temperature and molar mass dependence are shown in Figure 6. Solid markers represent experimental measurements, and the solid lines are a fit to the data according to eq 16. The dashed line denotes χcrit, which was calculated from eqs 7 and 13 for blends comprising P(2EO-MO) of lower (16.0 kg mol−1) and higher (26.7 kg mol−1) molar masses. Figure 6a shows the temperature dependence of χeff in the higher molar mass P(2EO-MO)-containing blends. In the neat state, χeff is negative with a value of −3.07 × 10⁻³ at 60 °C and increases with increasing temperature (A = −5.401), increasing to a value of −9.67 × 10⁻⁴ at 110 °C. χeff is a more sensitive function of temperature in the salt-containing blends where 0.08 ≤ r ≤ 0.10. For the r = 0.08 blend, χeff increases from −4.67 × 10⁻³ at 70 °C to 2.77 × 10⁻³ at 100 °C, and phase separation is observed experimentally at 110 °C (see Figure 5). At 110 °C, χeff predicted by extrapolating the data below 100 °C is larger than χcrit = 5.06 × 10⁻³, as expected. For r = 0.10, we see a similarly strong dependence with temperature, and χeff varies from −7.29 × 10⁻³ at 60 °C to −3.41 × 10⁻⁴ at 110 °C. The value of A is negative and B is positive for all miscible blends except at r = 0.14. At this concentration, A is positive and B is negative, and there is a very weak dependence on temperature.
Figure 6.
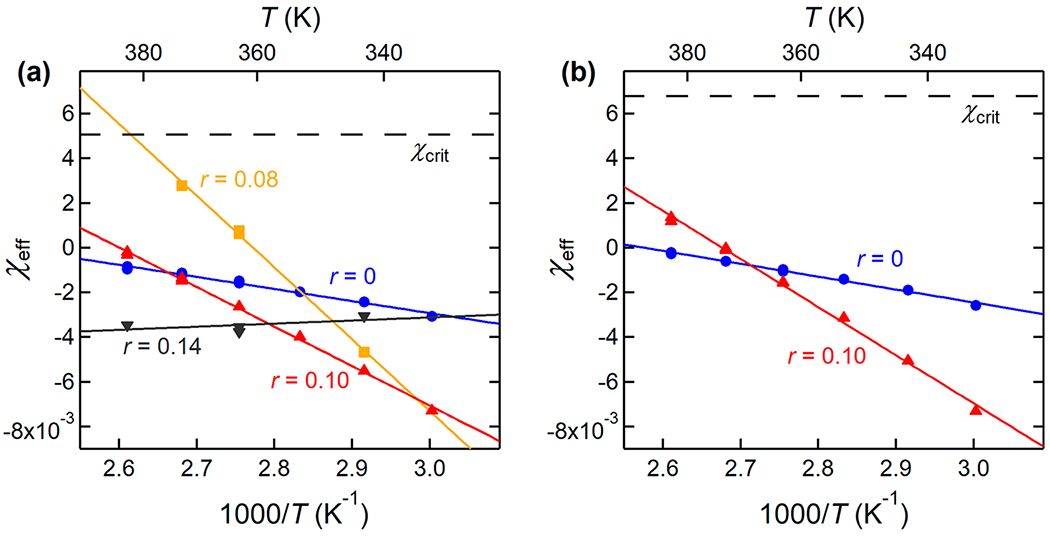
Effective Flory–Huggins interaction parameter, χeff, as a function of inverse temperature, 1/T, for the dPEO/P(2EO-MO)/LiTFSI blend (a) with higher P(2EO-MO) molar mass (Mn = 26.7 kg mol−1) and (b) with lower P(2EO-MO) molar mass (Mn = 16.0 kg mol−1). The solid lines are linear fits to the data according to eq 16; values for A and B are reported in Table 4. Error bars represent one standard deviation of the χeff fits and are smaller than the symbols. Typical error bars on χ range between 5 and 20%, as previously shown in ref 24.
Similarly, Figure 6b shows the temperature dependence of χeff in the lower molar mass P(2EO-MO)-containing blends. At the same salt concentration, the temperature dependences of χeff obtained from lower and higher molar mass P(2EO-MO) blends are similar. At r = 0, the difference in A and B values is less than 10%, while at r = 0.10, A is within 10% while the value of B differs by about 20% (see Table 4). The absolute value of χeff is greater in the lower molar mass P(2EO-MO)-containing blends than in the higher molar mass blends. χeff is always below χcrit = 6.78 × 10⁻³ for these lower molar mass blends.
In all cases where χeff is a sensitive function of temperature, R2 values for the linear fits are greater than 0.98 (see Table 4). The R2 value for the r = 0.14 blend is 0.344, which is expected as χeff is insensitive to temperature in this case.
Salt concentration is known to affect χeff in multicomponent polymer systems.31,32 This effect has primarily been studied in phase-separated or microphase-separated systems, e.g., polystyrene and PEO.33–42 In the dPEO/P(2EO-MO) (Mn = 26.7 kg mol−1) blend, the addition of salt up to r = 0.02 induces phase separation, while sufficient salt concentrations (r ≥ 0.08) render the mixture miscible again. The dependence of χeff on r is shown in Figure 7 for three temperatures (70 °C, 90 °C, and 110 °C). χeff is slightly negative in the neat blend, with similar values across the three temperatures. Addition of salt to r = 0.02 increases χeff above χcrit = 5.06 × 10⁻³. χ remains above this critical value at r = 0.04 and r = 0.06. Because the samples at 0.02 ≤ r ≤ 0.06 were immiscible at all temperatures studied, no information about χeff is available besides a lower bound, as indicated in Figure 7. At 90 °C and 110 °C, χeff decreases with increasing r for r ≥ 0.08. The data in Figure 7 suggest that χeff goes through a maximum at a value of r between 0.02 and 0.08 at 90 °C and 110 °C. At 70 °C, χeff is a nonmonotonic function of r for r ≥ 0.08. At this temperature, χeff exhibits both a maximum and a minimum with respect to r.
Figure 7.
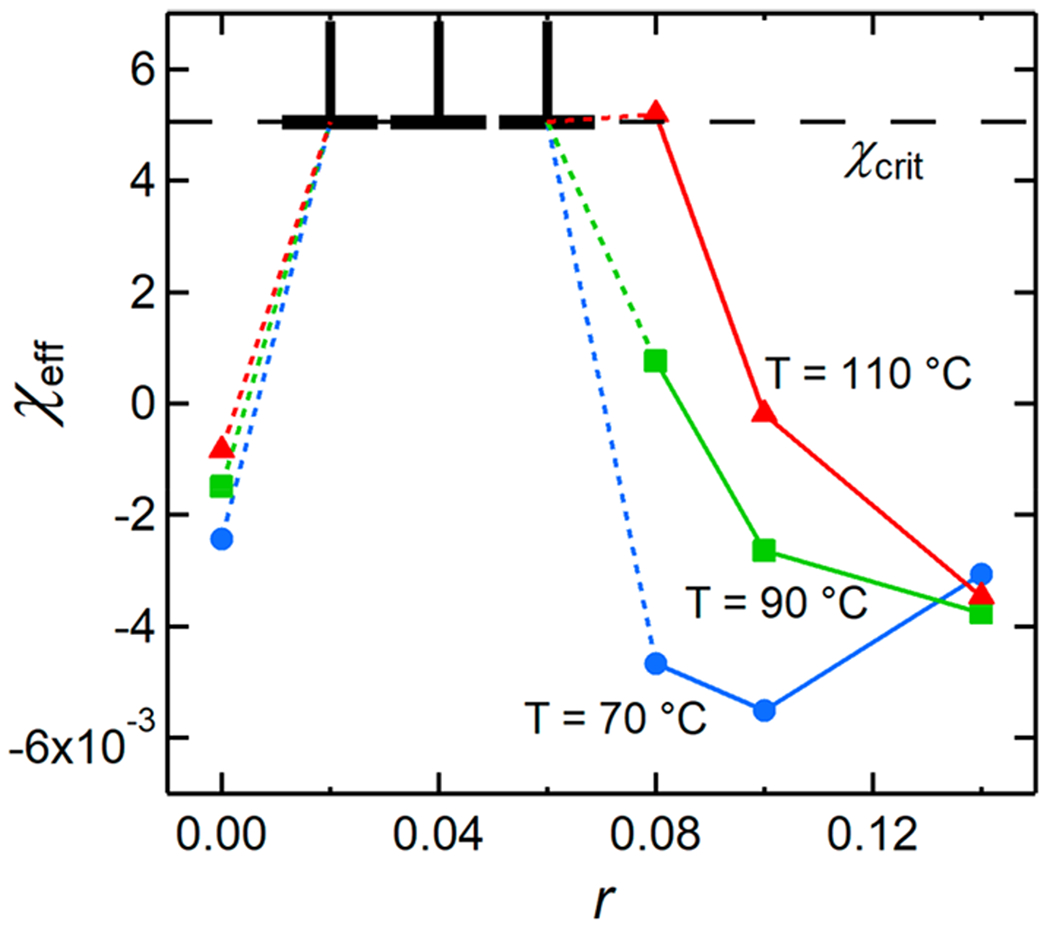
Effective Flory–Huggins interaction parameter, χeff, for the dPEO/P(2EO-MO)/LiTFSI (P(2EO-MO) Mn = 26.7 kg mol−1) blends as a function of salt concentration, r, at three different temperatures: 70 °C (blue circles), 90 °C (green squares), and 110 °C (red triangles). The lower limit of the error bars at 0.02 ≤ r ≤ 0.06 is the critical value for the Flory–Huggins interaction parameter, χcrit, at which this system phase separates. Error bars for the solid markers represent one standard deviation of the χeff fits and are smaller than the symbols.
We now discuss the ion transport properties of the higher molar mass polymer blend electrolytes. For reference, we also include ion transport properties of conventional PEO/LiTFSI (Mn = 35.0 kg mol−1) and P(2EO-MO)/LiTFSI (Mn = 55.2 kg mol−1) electrolytes.43 The ionic conductivity of the PEO/P(2EO-MO)/LiTFSI blend as a function of r is shown in Figure 8a. The conductivity increases with increasing r due to the higher concentration of charge carrying species. To a good approximation, the conductivity of the blend matches that of PEO/LiTFSI at all values of r.
Figure 8.
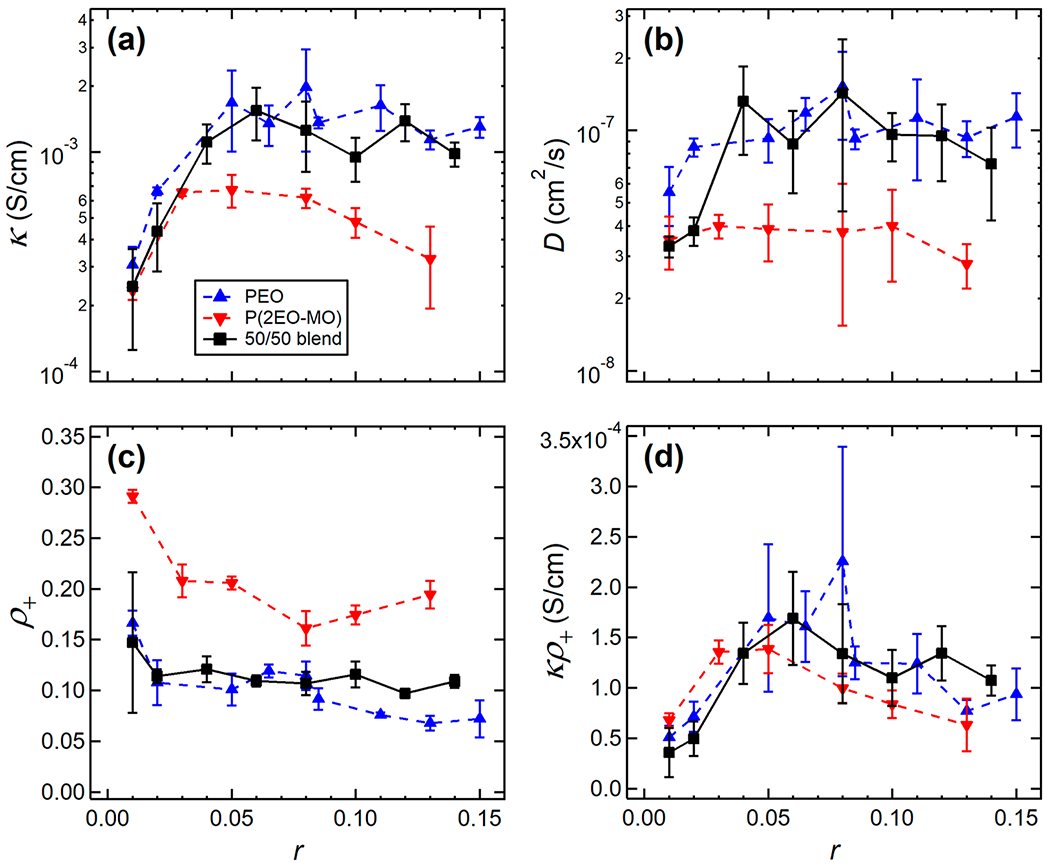
Electrochemical characterization of the PEO/P(2EO-MO)/LiTFSI blend as a function of salt concentration, r, compared with conventional PEO/LiTFSI (Mn = 35.0 kg mol−1) and P(2EO-MO)/LiTFSI (Mn = 55.2 kg mol−1) polymer electrolyte systems. (a) Ionic conductivity, κ, from ac impedance spectroscopy of symmetric cells with blocking electrodes. (b) Salt diffusion coefficient, D, from restricted diffusion measurements in a lithium symmetric cell. (c) Current fractions, ρ+, calculated from the Bruce–Vincent method using a lithium symmetric cell. (d) Efficacy, κρ+. Data were taken at 90 °C. PEO/LiTFSI data were taken from ref 43. Error bars represent the standard deviation of three measurements.
The salt diffusion coefficient, D, of the blend shown in Figure 8b is similar to that of the conventional P(2EO-MO)/LiTFSI polymer electrolyte system for r ≤ 0.02 but is nearly equal to that of PEO/LiTFSI for higher r. The dependence of the current fraction, ρ+, of the polymer blend on r, plotted in Figure 8c, matches that of PEO/LiTFSI at all salt concentrations.44
One measure of the efficacy of an electrolyte is the product of the ionic conductivity and current fraction. This measure gives a metric for sustaining steady currents in battery applications at low current densities. The efficacies of all three electrolyte systems are similar, as shown in Figure 8d.
The immiscible blends obtained in the regime 0.01 ≤ r ≤ 0.06 undoubtedly contain macroscopic PEO-rich and P(2EO-MO)-rich domains. However, we expect a considerable concentration of P(2EO-MO) in the PEO-rich domains, and vice versa. The fact that the ion transport data (see Figure 8) obtained from immiscible blends do not differ significantly from that of miscible blends may be attributed to this effect. A more thorough investigation into the impact of miscibility on ion transport is warranted but is beyond the scope of this study.
We were curious whether ion transport behavior in miscible polymer blend electrolytes can be predicted based on the known properties of conventional polymer electrolytes. It is well-established that ionic conductivity in polymers depends on the relative segmental motion of the polymer backbone, which can be gauged by the Tg value.9,19,45,46 The Tg values of the miscible polymer blend electrolytes (PEO/P(2EO-MO)/LiTFSI) were consistently between the Tg values of the PEO/LiTFSI and P(2EO-MO)/LiTFSI electrolytes (see Figure 2b). However, conductivity measurements indicate that PEO, the component with the lower Tg, dominates conductivity. At most salt concentrations, this general behavior also applies to the measured current fractions and salt diffusion coefficients (see Figures 8b and 8c). These observations do not indicate that only PEO chains contribute to conductivity; if this were the case, then the conductivity of the 50/50 polymer blend electrolytes would be half that of PEO/LiTFSI. The data in Figures 2b, 8b, and 8c suggest that the P(2EO-MO) chains in the miscible polymer blend electrolytes behave as if they were PEO. It is evident that ion transport in miscible polymer blend electrolytes differs qualitatively from that in conventional polymer electrolytes.
We conclude this section by reviewing previous studies of ion transport in polymer blends. It is important to distinguish between oligomers and polymers: PEO analogues such as tetraethylene glycol dimethyl ether (tetraglyme), a short chain molecule comprising four ethylene oxide units, are commonly used as solvents for electrolytic applications.47–49 The ionic conductivity of PEO/LiTFSI mixtures is independent of chain length when the molar mass of the PEO chains exceeds 2 kg mol−1.50 The entanglement molar mass of PEO is also reported to be 2 kg mol−1.51 This value (2 kg mol−1) serves as an approximate marker to distinguish between oligomers and polymers in the context of electrolytes. There have been a few reports of mixtures of polymers, salts, and a third component.52–61 Tsuchida et al. studied mixtures of PEO, poly(methyl methacrylate) (PMMA), and lithium perchlorate (LiClO4); however, the molar masses of examined PEO ranged from 0.7 to 2 kg mol−1.52 While the miscibility of PEO and PMMA is well-established in the absence of salt,62 the effect of added salt on miscibility is not yet known. Abraham et al. blended PEO and poly[bis((methoxyethoxy)ethoxy) phosphazene] (MEEP) with different lithium salts.53 The molar mass of MEEP was not reported. Interestingly, the blends exhibited two exothermic melting transitions: one similar to that of pure PEO in the vicinity of 55 °C and an additional peak at 140 °C, in spite of the fact that MEEP is amorphous. This suggests the presence of two phases in the PEO/MEEP electrolytes. Li et al. prepared blends of PEO, poly(2-vinylpyridine) (P2VP), and LiClO4. While PEO and P2VP are miscible in the absence of salt,63 the possibility of salt-induced phase separation was not addressed. Kim et al. report both conductivity and current fraction in mixtures of PEO, poly(oligo[oxyethylene]oxysebacoyl), and LiClO4.57 This is one of the few studies on electrochemical properties in polymer blends that go beyond conductivity; however, miscibility of the polymers in the presence of salt was not established. Rocco et al. studied mixtures of PEO, poly(methyl vinyl ether–maleic acid), and LiClO4 as well as PEO, poly(bisphenol A-co-epichlorohydrin), poly(vinyl ethyl ether), and LiClO4 blends for use as electrolytes.59,60 Inferences regarding miscibility were mainly made on the basis of DSC. In contrast to all previous studies,52–61 this paper definitively demonstrates the miscibility of a polymer blend electrolyte system by using a rigorous approach based on SANS, wherein concentration fluctuations on the nanometer length scale are quantified. Unlike previous studies,52–61 this work compares the characteristics of the PEO/P(2EO-MO)/LiTFSI polymer blend electrolyte system to that of its constituent polymer electrolytes (PEO/LiTFSI and P(2EO-MO)/LiTFSI).
CONCLUSION
This study demonstrates that it is possible to create homogeneous mixtures of chemically distinct polymers and a lithium salt for use in lithium batteries. This demonstration is nontrivial because polymers rarely mix with each other. Blending polymers for electrolytic applications is advantageous because of the ease of preparation and control of physical properties by simple changes in composition or chain lengths of the components. This initial study, based on PEO/P(2EO-MO)/LiTFSI, can serve as a template for future work aimed at optimizing ion transport in polymer electrolytes in a manner that mirrors the development of mixtures of organic solvents used in current day lithium ion batteries. The thermodynamic properties of PEO/P(2EO-MO)/LiTFSI blends, determined by SANS, are surprisingly complex. This initial study is restricted to blends with roughly equal volume fractions of PEO and P(2EO-MO). Neat PEO/P(2EO-MO) blends exhibit a negative Flory–Huggins interaction parameter across the accessible temperature window. If we assume that the phase behavior of PEO/P(2EO-MO)/LiTFSI blends can be approximated by Flory–Huggins theory for binary blends of homopolymers with an effective interaction parameter that accounts for the presence of salt, it would imply that these blends would be miscible irrespective of blend composition and chain lengths of the components. Adding a small amount of LiTFSI (0.02 ≤ r ≤ 0.06) renders the PEO/P(2EO-MO) blends immiscible; blends containing either 26.7 or 16.0 kg mol−1 P(2EO-MO) were immiscible. Increasing the salt concentration to r > 0.08 results in negative effective Flory–Huggins interaction parameters across the accessible temperature window, implying miscibility irrespective of blend composition and chain lengths of the components.
Ion transport in the blends was characterized by measuring the ionic conductivity, salt diffusion coefficient, and current fraction. Surprisingly, the values of these parameters in blends at a given salt concentration, r, were close to those obtained in conventional PEO/LiTFSI electrolytes at the same value of r. In other words, the blends that we have characterized thus far do not exhibit superior ion transport properties. However, a wide variety of ether- and carbonate-containing polymers have been synthesized for electrolytic applications.64–67 This work opens the door to a new direction for creating new and improved polymer electrolytes either by combining existing polymers with salt or by synthesizing new polymers with the specific aim of including them in miscible polymer blend electrolytes.
Supplementary Material
ACKNOWLEDGMENTS
This work was intellectually led by the Joint Center for Energy Storage Research (JCESR), an Energy Innovation Hub funded by the U.S. Department of Energy, Office of Science, Office of Basic Energy Science, under Contract DE-AC02-06CH11357, which supported synthesis work conducted by R.L.S. and B.A.A. under the supervision of G.W.C and characterization work conducted by K.W.G., W.S.L., and Y.C. under the supervision of N.P.B. Characterization work conducted by A.L. under the supervision of B.A.G. was supported by the National Science Foundation through Award DMR-1904537. Work at the Molecular Foundry, which is a DOE Office of Science User Facility, was supported by Contract DE-AC02-05CH11231. S.C.M.T. acknowledges the Center for Neutron Studies at the University of Delaware and funding under cooperative agreements #370NANB17H302 and #70NANB15H260 from NIST, U.S. Department of Commerce. We acknowledge the support of the National Institute of Standards and Technology, U.S. Department of Commerce, in providing the neutron facilities used in this work. K.W.G. acknowledges funding from a National Defense and Science Engineering Graduate Fellowship. W.S.L. acknowledges funding from the National Science Foundation Graduate Student Research Fellowship DGE-1106400.
LIST OF SYMBOLS
- PEO
poly(ethylene oxide)
- P(2EO-MO)
poly(1,3,6-trioxocane)
- LiTFSI
lithium bis(trifluoromethanesulfonyl)imide
- SANS
small-angle neutron scattering
- DSC
differential scanning calorimetry
- 2EO-MO
1,3,6-trioxocane
- Mn
number-average molar mass (kg mol−1)
- Đ
dispersity
- dPEO
deuterated poly(ethylene oxide)
- ϕi
volume fraction of component i
- ϕpolymer
volume fraction of polymer components in a blend containing LiTFSI
- wi
weight of component i (g)
- wsalt
weight of LiTFSI salt (g)
- ρi
density of component i (g cm−3)
- ρsalt
density of LiTFSI salt (g cm−3)
- r
molar ratio of lithium to oxygen atoms
- MEO
monomer molar mass of PEO (g mol−1)
- M2EO-MO
monomer molar mass of P(2EO-MO) (g mol−1)
- Msalt
molar mass of LiTFSI salt (g mol−1)
- f
volume fraction of PEO and LiTFSI associated with PEO
- Tg
glass transition temperature
- SDD
sample-to-detector distance
- θ
scattering angle
- q
magnitude of the scattering vector (nm−1)
- λ
wavelength (nm)
- q
magnitude of the scattering vector (nm−1)
- I(q)
measured absolute SANS intensity (cm−1)
- ΔGm
free energy of mixing per unit volume (J m−3)
- kB
Boltzmann constant (m2 kg s−2 K−1)
- v
reference volume (nm3)
- T
absolute temperature (K)
- Ni
number of repeat units per chain
- χ
Flory–Huggins interaction parameter
- χcrit
critical Flory–Huggins interaction parameter
- χeff
effective Flory–Huggins interaction parameter
- Icoh(q)
coherent scattering intensity (cm−1)
- IdPEO/LiTFSI(q)
SANS intensity from dPEO/LiTFSI mixtures (cm−1)
- Iinc(q)
incoherent scattering intensity (cm−1)
- Pi(q)
form factor
- Bi
neutron scattering length density of component i (cm−2 mol−1)
- bi
neutron scattering length of component i (cm mol−1)
- vi
monomer molar volume of component i (cm3 mol−1)
- Sii
structure factor
- Mi
molar mass of component i (g mol−1)
- Rg,i
radius of gyration (cm)
- li
statistical segment length of component i (nm)
- α
RPA fitting parameter accounting for chain distortion
- A, B
empirical constants for fitting χ
- R2
coefficient of determination
- κ
ionic conductivity (S cm−1)
- D
salt diffusion coefficient (cm2 s−1)
- ρ+
current fraction
- κρ+
efficacy (S cm−1)
- PMMA
poly(methyl methacrylate)
- LiClO4
lithium perchlorate
- MEEP
poly[bis((methoxyethoxy)ethoxy)-phosphazene]
- P2VP
poly(2-vinylpyridine)
Footnotes
Supporting Information
The Supporting Information is available free of charge at https://pubs.acs.org/doi/10.1021/acs.macromol.0c00747.
Synthesis and characterization of P(2EO-MO) as well as ac impedance spectroscopy of representative PEO/P(2EO-MO)/LiTFSI blends (PDF)
Complete contact information is available at: https://pubs.acs.org/10.1021/acs.macromol.0c00747
The statements, findings, conclusions and recommendations are those of the authors and do not necessarily reflect the view of NIST or the U.S. Department of Commerce. Certain commercial equipment, instruments, suppliers and software are identified in this paper to foster understanding. Such identification does not imply recommendation or endorsement by the National Institute of Standards and Technology, nor does it imply that the materials or equipment identified are necessarily the best available for the purpose.
The authors declare no competing financial interest.
Contributor Information
Kevin W. Gao, Department of Chemical and Biomolecular Engineering, University of California, Berkeley, Berkeley, California 94720, United States; Materials Sciences Division, Lawrence Berkeley National Laboratory, Berkeley, California 94720, United States; Joint Center for Energy Storage Research (JCESR), Argonne National Laboratory, Lemont, Illinois 60439, United States.
Whitney S. Loo, Department of Chemical and Biomolecular Engineering, University of California, Berkeley, Berkeley, California 94720, United States.
Rachel L. Snyder, Department of Chemistry and Chemical Biology, Cornell University, Ithaca, New York 14850, United States; Joint Center for Energy Storage Research (JCESR), Argonne National Laboratory, Lemont, Illinois 60439, United States.
Brooks A. Abel, Department of Chemistry and Chemical Biology, Cornell University, Ithaca, New York 14850, United States; Joint Center for Energy Storage Research (JCESR), Argonne National Laboratory, Lemont, Illinois 60439, United States.
Youngwoo Choo, Materials Sciences Division, Lawrence Berkeley National Laboratory, Berkeley, California 94720, United States; Joint Center for Energy Storage Research (JCESR), Argonne National Laboratory, Lemont, Illinois 60439, United States.
Andrew Lee, Department of Chemical and Biomolecular Engineering, NYU Tandon School of Engineering, New York University, Brooklyn, New York 11201, United States.
Susana C. M. Teixeira, NIST Center for Neutron Research, National Institute of Standards and Technology, Gaithersburg, Maryland 20899, United States; Department of Chemical and Biomolecular Engineering, University of Delaware, Newark, Delaware 19716, United States
Bruce A. Garetz, Department of Chemical and Biomolecular Engineering, NYU Tandon School of Engineering, New York University, Brooklyn, New York 11201, United States.
Geoffrey W. Coates, Department of Chemistry and Chemical Biology, Cornell University, Ithaca, New York 14850, United States; Joint Center for Energy Storage Research (JCESR), Argonne National Laboratory, Lemont, Illinois 60439, United States.
Nitash P. Balsara, Department of Chemical and Biomolecular Engineering, University of California, Berkeley, Berkeley, California 94720, United States; Materials Sciences Division, Lawrence Berkeley National Laboratory, Berkeley, California 94720, United States; Joint Center for Energy Storage Research (JCESR), Argonne National Laboratory, Lemont, Illinois 60439, United States.
REFERENCES
- (1).Xu K Nonaqueous Liquid Electrolytes for Lithium-Based Rechargeable Batteries. Chem. Rev 2004, 104, 4303–4417. [DOI] [PubMed] [Google Scholar]
- (2).Flory PJ Principles of Polymer Chemistry; Cornell University Press: Ithaca, NY, 1953. [Google Scholar]
- (3).Knychała P; Timachova K; Banaszak M; Balsara NP 50th Anniversary Perspective: Phase Behavior of Polymer Solutions and Blends. Macromolecules 2017, 50 (8), 3051–3065. [Google Scholar]
- (4).Lohse DJ The Melt Compatibility of Blends of Polypropylene and Ethylene-propylene Copolymers. Polym. Eng. Sci 1986, 26 (21), 1500–1509. [Google Scholar]
- (5).Kwag H; Rana D; Cho K; Rhee J; Woo T; Lee BH; Choe S Binary Blends of Metallocene Polyethylene with Conventional Polyolefins: Rheological and Morphological Properties. Polym. Eng. Sci 2000, 40 (7), 1672–1681. [Google Scholar]
- (6).Fenton DE; Parker JM; Wright PV Complexes of Alkali Metal Ions with Poly(Ethylene Oxide). Polymer 1973, 14 (11), 589. [Google Scholar]
- (7).Armand M Polymer Solid Electrolytes - an Overview. Solid State Ionics 1983, 9–10, 745–754. [Google Scholar]
- (8).Xue Z; He D; Xie X Poly(Ethylene Oxide)-Based Electrolytes for Lithium-Ion Batteries. J. Mater. Chem. A 2015, 3 (38), 19218–19253. [Google Scholar]
- (9).Zheng Q; Pesko DM; Savoie BM; Timachova K; Hasan AL; Smith MC; Miller TF; Coates GW; Balsara NP Optimizing Ion Transport in Polyether-Based Electrolytes for Lithium Batteries. Macromolecules 2018, 51 (8), 2847–2858. [Google Scholar]
- (10).Wheatle BK; Lynd NA; Ganesan V Effect of Host Incompatibility and Polarity Contrast on Ion Transport in Ternary Polymer-Polymer-Salt Blend Electrolytes. Macromolecules 2020, 53 (3), 875–884. [Google Scholar]
- (11).Pesko DM; Timachova K; Bhattacharya R; Smith MC; Villaluenga I; Newman J; Balsara NP Negative Transference Numbers in Poly(Ethylene Oxide)-Based Electrolytes. J. Electrochem. Soc 2017, 164 (11), E3569–E3575. [Google Scholar]
- (12).Loo WS; Mongcopa KI; Gribble DA; Faraone AA; Balsara NP Investigating the Effect of Added Salt on the Chain Dimensions of Poly(Ethylene Oxide) through Small-Angle Neutron Scattering. Macromolecules 2019, 52 (22), 8724–8732. [Google Scholar]
- (13).Glinka CJ; Barker JG; Hammouda B; Krueger S; Moyer JJ; Orts WJ The 30 m Small-Angle Neutron Scattering Instruments at the National Institute of Standards and Technology. J. Appl. Crystallogr 1998, 31 (3), 430–445. [Google Scholar]
- (14).Kline SR Reduction and Analysis of SANS and USANS Data Using IGOR Pro. J. Appl. Crystallogr 2006, 39 (6), 895–900. [Google Scholar]
- (15).Kline S SANS Data Reduction Tutorial; NIST Center for Neutron Research: 2001. [Google Scholar]
- (16).Gao KW; Jiang X; Hoffman ZJ; Sethi GK; Chakraborty S; Villaluenga I; Balsara NP Optimizing the Monomer Structure of Polyhedral Oligomeric Silsesquioxane for Ion Transport in Hybrid Organic-Inorganic Block Copolymers. J. Polym. Sci 2020, 58 (2), 363–371. [Google Scholar]
- (17).Utracki LA; Wilkie CA Polymer Blends Handbook, 2nd ed.; Springer: New York, 2014. [Google Scholar]
- (18).Vallée A; Besner S; Prud’Homme J Comparative Study of Poly(Ethylene Oxide) Electrolytes Made with LiN(CF3SO2)2, LICF3SO3 and LiClO4: Thermal Properties and Conductivity Behaviour. Electrochim. Acta 1992, 37 (9), 1579–1583. [Google Scholar]
- (19).Lascaud S; Perrier M; Vallée A; Besner S; Prud’homme J; Armand M Phase Diagrams and Conductivity Behavior of Poly(Ethylene Oxide)-Molten Salt Rubbery Electrolytes. Macromolecules 1994, 27 (25), 7469–7477. [Google Scholar]
- (20).Le Nest JF; Gandini A; Cheradame H; Cohen-Addad JP Influence of LiClO4 on the Properties of Polyether Networks: Specific Volume and Glass Transition Temperature. Macromolecules 1988, 21 (4), 1117–1120. [Google Scholar]
- (21).de Gennes PG Scaling Concepts in Polymer Chemistry; Cornell University Press: Ithaca, NY, 1979. [Google Scholar]
- (22).Flory PJ Thermodynamics of High Polymer Solutions. J. Chem. Phys 1942, 10 (1), 51–61. [Google Scholar]
- (23).Huggins ML Some Properties of Solutions of Long-Chain Compounds. J. Phys. Chem 1942, 46 (1), 151–158. [Google Scholar]
- (24).Balsara NP; Fetters LJ; Hadjichristidis N; Lohse DJ; Han CC; Graessley WW; Krishnamoorti R Thermodynamic Interactions in Model Polyolefin Blends Obtained by Small-Angle Neutron Scattering. Macromolecules 1992, 25 (23), 6137–6147. [Google Scholar]
- (25).Dubner WS; Schultz JM; Wignall GD Estimation of Incoherent Backgrounds in SANS Studies of Polymers. J. Appl. Crystallogr 1990, 23 (6), 469–475. [Google Scholar]
- (26).de Gennes PG Theory of X-Ray Scattering by Liquid Macromolecules with Heavy Atom Labels. J. Phys. (Paris) 1970, 31 (2–3), 235–238. [Google Scholar]
- (27).Hammouda B Random Phase Approximation for Compressible Polymer Blends. J. Non-Cryst. Solids 1994, 172–174, 927–931. [Google Scholar]
- (28).Qiu J; Mongcopa KI; Han R; López-Barrón CR; Robertson ML; Krishnamoorti R Thermodynamic Interactions in a Model Polydiene/Polyolefin Blend Based on 1,2-Polybutadiene. Macromolecules 2018, 51 (8), 3107–3115. [Google Scholar]
- (29).Mark JE Physical Properties of Polymers Handbook, 2nd ed.; Springer: New York, 2007. [Google Scholar]
- (30).Bates FS; Fredrickson GH Block Copolymer Thermodynamics: Theory And Experiment. Annu. Rev. Phys. Chem 1990, 41 (1), 525–557. [DOI] [PubMed] [Google Scholar]
- (31).Wang ZG Effects of Ion Solvation on the Miscibility of Binary Polymer Blends. J. Phys. Chem. B 2008, 112 (50), 16205–16213. [DOI] [PubMed] [Google Scholar]
- (32).Nakamura I; Balsara NP; Wang ZG Thermodynamics of Ion-Containing Polymer Blends and Block Copolymers. Phys. Rev. Lett 2011, 107 (19), 1–5. [DOI] [PubMed] [Google Scholar]
- (33).Young WS; Epps TH Salt Doping in PEO-Containing Block Copolymers: Counterion and Concentration Effects. Macromolecules 2009, 42 (7), 2672–2678. [Google Scholar]
- (34).Naidu S; Ahn H; Gong J; Kim B; Ryu DY Phase Behavior and Ionic Conductivity of Lithium Perchlorate-Doped Polystyrene-b-Poly(2-Vinylpyridine) Copolymer. Macromolecules 2011, 44 (15), 6085–6093. [Google Scholar]
- (35).Huang J; Tong ZZ; Zhou B; Xu JT; Fan ZQ Salt-Induced Microphase Separation in Poly(ε-Caprolactone)-b-Poly(Ethylene Oxide) Block Copolymer. Polymer 2013, 54 (12), 3098–3106. [Google Scholar]
- (36).Teran AA; Balsara NP Thermodynamics of Block Copolymers with and without Salt. J. Phys. Chem. B 2014, 118 (1), 4–17. [DOI] [PubMed] [Google Scholar]
- (37).Irwin MT; Hickey RJ; Xie S; So S; Bates FS; Lodge TP Structure-Conductivity Relationships in Ordered and Disordered Salt-Doped Diblock Copolymer/Homopolymer Blends. Macromolecules 2016, 49 (18), 6928–6939. [Google Scholar]
- (38).Xie S; Lodge TP Phase Behavior of Binary Polymer Blends Doped with Salt. Macromolecules 2018, 51, 266–274. [Google Scholar]
- (39).Hou KJ; Qin J Solvation and Entropic Regimes in Ion-Containing Block Copolymers. Macromolecules 2018, 51, 7463–7475. [Google Scholar]
- (40).Loo WS; Jiang X; Maslyn JA; Oh HJ; Zhu C; Downing KH; Balsara NP Reentrant Phase Behavior and Coexistence in Asymmetric Block Copolymer Electrolytes. Soft Matter 2018, 14 (15), 2789–2795. [DOI] [PubMed] [Google Scholar]
- (41).Loo WS; Balsara NP Organizing Thermodynamic Data Obtained from Multicomponent Polymer Electrolytes: Salt-Containing Polymer Blends and Block Copolymers. J. Polym. Sci., Part B: Polym. Phys. 2019, 57 (18), 1177–1187. [Google Scholar]
- (42).Morris MA; Sung SH; Ketkar PM; Dura JA; Nieuwendaal RC; Epps TH Enhanced Conductivity via Homopolymer-Rich Pathways in Block Polymer-Blended Electrolytes. Macromolecules 2019, 52 (24), 9682–9692. [PMC free article] [PubMed] [Google Scholar]
- (43).Gribble DA; Frenck L; Shah DB; Maslyn JA; Loo WS; Mongcopa KIS; Pesko DM; Balsara NP Comparing Experimental Measurements of Limiting Current in Polymer Electrolytes with Theoretical Predictions. J. Electrochem. Soc 2019, 166 (14), A3228–A3234. [Google Scholar]
- (44).Galluzzo MD; Maslyn JA; Shah DB; Balsara NP Ohm’s Law for Ion Conduction in Lithium and beyond-Lithium Battery Electrolytes. J. Chem. Phys 2019, 151 (2), 020901. [DOI] [PubMed] [Google Scholar]
- (45).Ratner MA; Johansson P; Shriver DF P Olymer Electrolytes: Ionic Transport Mechanisms and Relaxation Coupling. MRS Bull. 2000, 25, 31–37. [Google Scholar]
- (46).Borodin O; Smith GD Mechanism of Ion Transport in Amorphous Poly(Ethylene Oxide)/LiTFSI from Molecular Dynamics Simulations. Macromolecules 2006, 39, 1620–1629. [Google Scholar]
- (47).Jung H-G; Hassoun J; Park J-B; Sun Y-K; Scrosati B An Improved High-Performance Lithium-Air Battery. Nat. Chem 2012, 4, 579–585. [DOI] [PubMed] [Google Scholar]
- (48).Nasybulin E; Xu W; Engelhard MH; Nie Z; Burton SD; Cosimbescu L; Gross ME; Zhang J Effects of Electrolyte Salts on the Performance Li-O2 Batteries. J. Phys. Chem. C 2013, 117, 2635–2645. [Google Scholar]
- (49).Jache B; Binder JO; Abe T; Adelhelm P A Comparative Study on the Impact of Different Glymes and Their Derivatives as Electrolyte Solvents for Graphite Co-Intercalation Electrodes in Lithium-Ion and Sodium-Ion Batteries. Phys. Chem. Chem. Phys 2016, 18, 14299–14316. [DOI] [PubMed] [Google Scholar]
- (50).Teran AA; Tang MH; Mullin SA; Balsara NP Effect of Molecular Weight on Conductivity of Polymer Electrolytes. Solid State Ionics 2011, 203, 18–21. [Google Scholar]
- (51).Fetters LJ; Lohse DJ; Milner ST; Graessley WW Packing Length Influence in Linear Polymer Melts on the Entanglement, Critical, and Reptation Molecular Weights. Macromolecules 1999, 32, 6847–6851. [Google Scholar]
- (52).Tsuchida E; Ohno H; Tsunemi K; Kobayashi N Lithium Ionic Conduction in Poly(Methacrylic Acid)-Poly(Ethylene Oxide) Complex Containing Lithium Perchlorate. Solid State Ionics 1983, 11, 227–233. [Google Scholar]
- (53).Abraham KM; Alamgir M; Reynolds RK Polyphosphazene-Poly(Olefin Oxide) Mixed Polymer Electrolytes. J. Electrochem. Soc 1989, 136 (12), 3576–3582. [Google Scholar]
- (54).Orihara K; Yonekura H Nonlinear Effects on the Ionic Conductivity of Poly(Ethylene Oxide)/Lithium Perchlorate Complexes Caused by the Blending of Poly(Vinyl Acetate). J. Macromol Sci. Chem. 1990, 27, 1217–1223. [Google Scholar]
- (55).Li J; Mintz EA; Khan IM Poly(Ethylene Oxide)/(Poly(2-Vinylpyridine)/Lithium Perchlorate Blends. New Materials for Solid Polymer Electrolytes. Chem. Mater 1992, 4 (6), 1131–1134. [Google Scholar]
- (56).Acosta JL; Morales E Structural, Morphological and Electrical Characterization of Polymer Electrolytes Based on PEO/PPO Blends. Solid State Ionics 1996, 85, 85–90. [Google Scholar]
- (57).Kim D; Park J; Rhee H Conductivity and Thermal Studies of Solid Polymer Electrolytes Prepared by Blending Poly(Ethylene Oxide), Poly(Oligo[Oxyethylene]Oxysebacoyl) and Lithium Perchlorate. Solid State Ionics 1996, 83, 49–56. [Google Scholar]
- (58).Jacob MME; Prabaharan SRS; Radhakrishna S Effect of PEO Addition on the Electrolytic and Thermal Properties of PVDF-LiClO4 Polymer Electrolytes. Solid State Ionics 1997, 104, 267–276. [Google Scholar]
- (59).Rocco AM; da Fonseca CP; Pereira RP A Polymeric Solid Electrolyte Based on a Binary Blend of Poly(Ethylene Oxide), Poly(Methyl Vinyl Ether-Maleic Acid) and LiClO4. Polymer 2002, 43 (13), 3601–3609. [Google Scholar]
- (60).Rocco AM; de Assis Carias A; Pereira RP Polymer Electrolytes Based on a Ternary Miscible Blend of Poly(Ethylene Oxide), Poly(Bisphenol A-Co-Epichlorohydrin) and Poly(Vinyl Ethyl Ether). Polymer 2010, 51 (22), 5151–5164. [Google Scholar]
- (61).Correia DM; Costa CM; Nunes-Pereira J; Silva MM; Botelho G; Ribelles J; Lanceros-Mendez S Physicochemical Properties of Poly(Vinylidene Fluoride-Trifluoroethylene)/Poly(Ethylene Oxide) Blend Membranes for Lithium Ion Battery Applications: Influence of Poly(Ethylene Oxide) Molecular Weight. Solid State Ionics 2014, 268, 54–67. [Google Scholar]
- (62).Ito H; Russell TP; Wignall GD Interactions in Mixtures of Poly(Ethylene Oxide) and Poly(Methyl Methacrylate). Macromolecules 1987, 20 (9), 2213–2220. [Google Scholar]
- (63).Yeh C; Hou T; Chen H; Yeh L; Chiu F-C; Muller AJ; Hadjichristidis N Lower Critical Ordering Transition of Poly(Ethylene Oxide)-Block-Poly(2-Vinylpyridine). Macromolecules 2011, 44, 440–443. [Google Scholar]
- (64).Watanabe M; Hirakimoto T; Mutoh S; Nishimoto A Polymer Electrolytes Derived from Dendritic Polyether Macromonomers. Solid State Ionics 2002, 148 (3–4), 399–404. [Google Scholar]
- (65).Sun B; Mindemark J; Edström K; Brandell D Polycarbonate-Based Solid Polymer Electrolytes for Li-Ion Batteries. Solid State Ionics 2014, 262, 738–742. [Google Scholar]
- (66).Zhang J; Yang J; Dong T; Zhang M; Chai J; Dong S; Wu T; Zhou X; Cui G Aliphatic Polycarbonate-Based Solid-State Polymer Electrolytes for Advanced Lithium Batteries: Advances and Perspective. Small 2018, 14 (36), 1–16. [DOI] [PubMed] [Google Scholar]
- (67).Pesko DM; Webb MA; Jung Y; Zheng Q; Miller TF; Coates W; Balsara NP Universal Relationship between Conductivity and Solvation-Site Connectivity in Ether-Based Polymer Electrolytes. Macromolecules 2016, 49, 5244–5255. [Google Scholar]
Associated Data
This section collects any data citations, data availability statements, or supplementary materials included in this article.