Abstract
Increases in coniferaldehyde content, a minor lignin residue, significantly improves the sustainable use of plant biomass for feed, pulping, and biorefinery without affecting plant growth and yields. Herein, different analytical methods are compared and validated to distinguish coniferaldehyde from other lignin residues. It is shown that specific genetic pathways regulate amount, linkage, and position of coniferaldehyde within the lignin polymer for each cell type. This specific cellular regulation offers new possibilities for designing plant lignin for novel and targeted industrial uses.
Keywords: analytical methods, biomass, coniferaldehyde, mutagenesis, polymers
It′s all in the genes: Increases in coniferaldehyde residue contents in lignins greatly improve plant biomass sustainable uses for feed, pulping, biogas production, and other biorefinery processes without affecting plant growth or seed/fruit yield. We show that coniferaldehyde incorporation in lignin is regulated by specific genetic processes in different lignified cell types to control its amount, its linkages as well as its position within the lignin polymer.
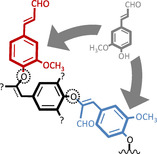
Lignins constitute a class of water‐insoluble phenolic polymers of variable size accumulating in plant cell walls. These polymers have different compositions and concentrations, depending on cell type, their developmental state, and environmental conditions, in order to ensure the chemical and mechanical properties required for the function of each cell type. Lignin is the most abundant renewable source of aromatics representing 15 to 45 % of the dry biomass of plants.1, 2, 3 These large quantities make lignin an ideal resource for future sustainable bio‐economy, but only if we can fully understand, predict and exploit its formation and structure. Lignins are synthesized by the oxidative polymerization of secreted C6C3 phenylpropenoid compounds differing in their C6 aromatic substitution (hydroxyl and methoxyl groups) as well as their C3 sidechain terminal function (mostly alcohol) (Scheme 1). Monomeric units with other C3 functions are also present in lower amounts, such as acids, esters and aldehydes.1, 2, 3 The main lignin C6C3 aldehyde monomers derive from coniferaldehyde (C6 with 1 hydroxyl and 1 methoxyl group) and sinapaldehyde (C6 with 1 hydroxyl and 2 methoxyl groups). It however remains unknown whether p‐coumaraldehyde (C6 with 1 hydroxyl and C3 with aldehyde) also forms residues in developmental lignin. Lignin residues are joined by different linkages, with the β‐O‐4, forming an ether linkage between the central C atom of the C3 of one residue and the para O of the C6 of another residue, being the most abundant.1, 2, 3 β‐O‐4 linkage with the C3 of aldehyde residues results in an unsaturated link, in contrast to C3 of alcohol residues (Scheme 1).2, 3, 4 The industrial valorization of lignin aromatic structure, through its depolymerization by methods such as catalytic fractionation, or biogas production,5, 6 offers promising opportunities to sustainably exploit the lignin in plant biomass by biorefineries. However, the efficiency of these future uses depends on a clear understanding of the different lignin residues incorporated, their distribution and homogeneity between cell types, their position within the polymers as well as their genetic regulation to allow for the optimal utilization of available biomass, and the design of improved plants for biorefineries.
Scheme 1.
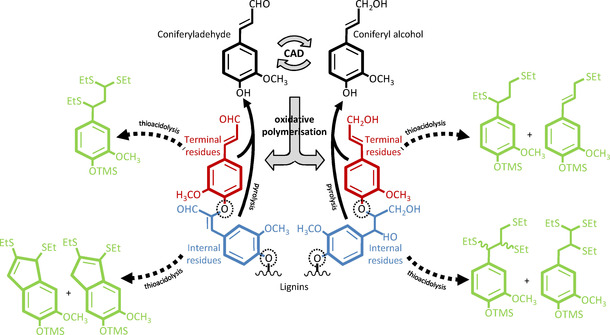
Schematic representation of lignin C6C3 monomers, coniferaldehyde, and coniferyl alcohol, interconverted by the activity of the NADP+/NADPH+H+‐dependent CADs as well as β‐O‐4‐linked oxidative polymerization lignin products. Enzyme‐catalyzed steps are shown by large grey arrows. Note that terminal residues are indicated in red, internal residues colored in blue, and β‐O‐4 linkages indicated by dotted circles. Trimethylsilylated (TMS)‐derivatized thioacidolyzed products corresponding to the different lignin residues are indicated by black dotted lines in green. Black plain arrows indicate pyrolytic products obtained from lignin polymer irrespective of residue position.
Mutagenesis of CINNAMYL ALCOHOL DEHYDROGENASE (CAD) genes has allowed modulating C6C3 aldehyde residue levels in lignin (Scheme 1). In the herbaceous plant model Arabidopsis thaliana, the combined insertional mutagenesis of two CAD paralogs (cad4/c and cad5/d) exhibited large increases in lignin aldehyde levels ranging from 35 to 65 % of total measured lignin residues, without altering stem width, biomass weight or fruit yield per plant (Figure 1).6, 7, 8, 9 Saccharification and catalytic fractionation yields of cad4xcad5 stem biomass were increased approximately two‐ and threefold respectively, compared to wild‐type (WT) plants.6, 8 Similar increases of aldehyde residues in lignin by reducing CAD expression, using mutagenesis and transgenic approaches in poplar, tobacco, flax, brachypodium, switchgrass, rice and sorghum, have all showed either increased pulping, saccharification and/or biogas yields without affecting plant productivity.5, 10, 11, 12, 13, 14, 15, 16, 17, 18 In fact, natural mutants in CADs thrive in the wild and have been readily identified, such as the CAD‐null mutant of pine.19, 20 Natural mutants in CAD have also been selected and preferentially used in agriculture more than 100‐years ago, like the Sekizaisou variety of mulberry trees, which improved both silkworm growth and silk quality when used for feed.21 The far reaching effects of aldehyde concentration on biomass properties suggest that these residues, despite being considered minor lignin constituents, have a determining role in diversifying the biological functions and industrial uses of lignin in plants. However, although different methods have been previously used to quantify coniferaldehyde residues in lignin, their position, amount and linkage have never been compared to obtain a full picture of how these less abundant residues are accumulated.
Figure 1.
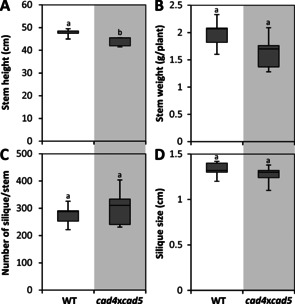
Impact of aldehyde residue over‐accumulation in lignin on Arabidopsis plant productivity. Phenotypic differences between wild‐type (WT) and cad4xcad5 double mutant Columbia‐0 plants on stem height (A, n=10 plants), stem weight (B, n=5 plants), number of fruit per plant (C, n=5 plants) as well as fruit size (D, n=5 stems and 5 fruits each). Different letters indicate significant differences according to a student t‐test with Tukey test (α=0.05).
Indeed, synthetic lignins, or dehydrogenation polymers (DHPs), synthesized by directly incubating coniferaldehyde (GCHO) monomers with peroxidases (Figure S1 in the Supporting Information), were more hydrophobic and less soluble in a range of solvents than those made from coniferyl alcohol (GCHOH).4 The artificial lignification of isolated primary cell walls only with GCHO moreover decreased the cross‐bridging between lignin and other cell wall polysaccharides.22 Increased lignin aldehyde levels in Arabidopsis, poplar and flax stems also decreased their flexural stiffness.17, 23, 24, 25 The impact on whole plant physical properties suggests that lignin composition, such as in GCHO residues, alters the overall cell wall organization and its interconnections. Incorporated GCHO, but not sinapaldehyde, within the lignin polymer can moreover specifically cross‐react in acid conditions and covalently bind other free phenolic compounds, such as phloroglucinol.7 These GCHO residues can also react with NaHSO3/Na2SO3 to form sulfonic acid derivatives.26 This suggests that the lateral functionalization of lignin polymers, using internal GCHO residues as anchors, could be used similarly to the lateral functionalization of cellulose using 2,2,6,6‐tetramethylpiperidine‐1‐oxyl (TEMPO) oxidative treatment.27 To this end, the reliable quantification of GCHO residue amounts in lignin as well as the quantification of their proportion at the end and/or within the lignin polymer are necessary, but has not yet been demonstrated.
Nuclear magnetic resonance (NMR) analyses of lignin showed that GCHO content in lignin represented ∼7 % in pine, ∼4 % in spruce, ∼8 % in alfalfa and ∼6 % in rice, and reached ∼15 % in CAD‐null pine, ∼19 % and ∼88 % respectively in the cad mutants of rice and alfalfa.16, 18, 19, 20, 28 Pyrolysis coupled to gas chromatography and mass spectroscopy (Py−GC/MS), which enables the quantitative measurement of GCHO, GCHOH and sinapyl alcohol (SCHOH) residues,29, 30, 31, 32 showed that total GCHO content in lignin represented ∼9 % in spruce, ∼5 % in Arabidopsis, ∼2 % in eucalyptus and ∼0.2 % in poplar.7, 33, 34 The content variability in lignin of GCHO, GCHOH and SCHOH residues was further examined using pyrolysis/GC−MS on a set of Arabidopsis thaliana mutants affected in one or several genes encoding for enzymes responsible of changing the C6 and/or C3 parts of lignin monomers (Figure S1). The use of Arabidopsis represents an ideal model to quickly investigate multiple genetic engineering strategies and validate analytical methodologies, both transposable to agronomically relevant lignocellulosic feedstock species.6, 7, 8, 9, 10, 11, 12, 13, 14, 15, 16, 17, 18, 19, 20, 21 In contrast to total GCHOH and SCHOH residue levels which could only be reduced or annulled compared to WT plants, total GCHO residue content varied by roughly threefold changes in either direction in Arabidopsis with specific genetic changes, namely increasing in the cad4xcad5 mutant and decreasing in the 4cl1x4cl2 mutant (Figure 2A). Arabidopsis natural ecotype variant Wassilewskija (WS) presented ∼60 % more GCHO residues than the Columbia‐0 (Col‐0) ecotype, although their GCHOH and SCHOH residue amounts did not differ (Figure S2). The GCHO over‐accumulation due to the cad4xcad5 mutations was even more accentuated in the WS than in the Col‐0 ecotype, also without affecting GCHOH and SCHOH residue amounts (Figure S2). Overall, our results highlight that the accumulation of GCHO residues in lignin follows a specific regulation differing from the one controlling the abundant GCHOH and SCHOH residue amounts.
Figure 2.
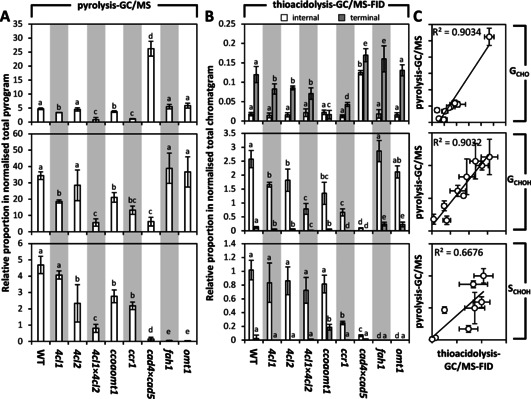
Residue proportions in a set of Arabidopsis mutants differently altered in lignin monomer biosynthesis. Analysis of the relative proportion of GCHO, GCHOH, and SCHOH in lignins of stems using pyrolysis‐GC/MS (A) and thioacidolysis‐GC/MS‐FID (B), with n=2–6 independent biological replicates per genotype. Terminal and internal residues correspond to the sum of the different relative peak contributions as shown in Figure 3. The respective position of each mutation in the metabolic pathway is indicated in Figure S1. Different letters for each residue category indicate significant differences according to a one‐way analysis of variance (ANOVA) with Tukey test (with a 95% confidence level α=0.05). Linear correlations between the methods for each residue are presented in (C). Note that R 2 value of the linear regression between thioacidolysis and pyrolysis for GCHO residues is reduced to 0.5685 when removing the cad4xcad5 mutant (extreme value).
We then evaluated the relative positions of GCHO residues in the lignin polymer linked by β‐O‐4 (Scheme 1) using thioacidolysis coupled to gas chromatography and detection with mass spectroscopy and flame ionization (thioacidoylsis/GC‐MS‐FID). Lower proportion of β‐O‐4 have been reported for DHPs made of only GCHO compared to GCHOH.4, 35, 36, 37 However, the formation of this link in DHPs also depends on the relative proportion of enzyme to substrate.38 We simplified lignin as a linear polymer39 with terminal residues at one end keeping their C3 sidechain unaltered (Scheme 1). Thioacidolyzed products of the internal and terminal residues were identified using DHPs made of only GCHOH, SCHOH or GCHO residues (Figure 3). Terminal and internal residues formed different derivatives depending on their C6 and C3, allowing the precise distinction between the position of the different monomeric constituents: terminal GCHO as well as internal GCHOH and SCHOH formed different trithioketal derivatives whereas internal GCHO residues formed indene derivatives, and terminal GCHOH and SCHOH formed mono/dithioketal derivatives, as previously reported (Scheme 1 and Figures 3 and S3).40, 41, 42, 43, 44, 45 We then measured the positional proportion of β‐O‐4 linked GCHOH, SCHOH and GCHO residues in stems of our Arabidopsis mutant series with modified lignins. Each type of β‐O‐4 linked residues showed specific genetic control: (i) GCHOH content decreased in all mutants except for fah1 and omt1; (ii) SCHOH amounts decreased in ccr1‐3 and cad4xcad5, and were absent in fah1 and omt1; and (iii) GCHO levels decreased in 4cl1, 4cl1x4cl2, ccoaomt1, and ccr1‐3 but increased in cad4xcad5 (Figure 2B). Comparing the levels of β‐O‐4 linked GCHOH, SCHOH and GCHO determined by thioacidolysis with the total amounts of these residues measured by Py−GC/MS showed different correlation strengths for each residue (Figure 2C). GCHO and GCHOH content correlated strongly between the two methods, suggesting that β‐O‐4 represented the main linkage for GCHO and GCHOH in lignin (Figure 2C). In contrast, SCHOH residue content correlated to a lesser extent between the methods, suggesting fewer β‐O‐4 linkages exist for SCHOH (Figure 2C). This lower proportion of β‐O‐4 for SCHOH residues confirmed previous studies showing higher capacity of SCHOH residues to form other bonds, such as β‐β, in DHPs as well as the low correlation between β‐O‐4 proportion and the relative S residue content in poplar natural variants.46, 47 Altogether, our results showed that different residues are subjected to a specific proportion of β‐O‐4 linkages within the lignin polymer. Positional analyses of GCHOH, SCHOH and GCHO residues moreover revealed a clear decoupling between the proportion of terminal and internal residues depending on the mutation. WT plants had GCHO terminal residues representing ∼83 % of the normalized chromatogram compared to ∼17 % for internal GCHO residues (Figure 2B). Specific mutants exhibited distinct changes differently affecting the positional proportion: (i) terminal GCHO were specifically decreased by the 4cl1, 4cl2, 4cl1x4cl2, ccoaomt1, and ccr1‐3 mutations, but increased in the fah1 and cad4xcad5 mutants; whereas (ii) internal GCHO were only increased by the cad4xcad5 mutation (Figure 2B). Analyses of the positional proportion of β‐O‐4 linked GCHOH and SCHOH residues revealed a different genetic control: (i) terminal GCHOH residues were increased by the fah1 and omt1 mutations and decreased in the other mutants, in contrast to internal GCHOH residues which were unaltered in the fah1 and omt1 mutations but decreased in the other mutants; and (ii) SCHOH residues were completely absent from the fah1 and omt1 mutants, but terminal SCHOH residues increased in the ccoaomt1 mutant, although internal SCHOH residues only decreased in the ccr1‐3 and cad4xcad5 mutants (Figure 2B). Overall, our results show that the different lignin monomers are subjected to specific incorporation genetically controlling their amount, their position as well as their linkage‐types within the lignin polymer.
Figure 3.
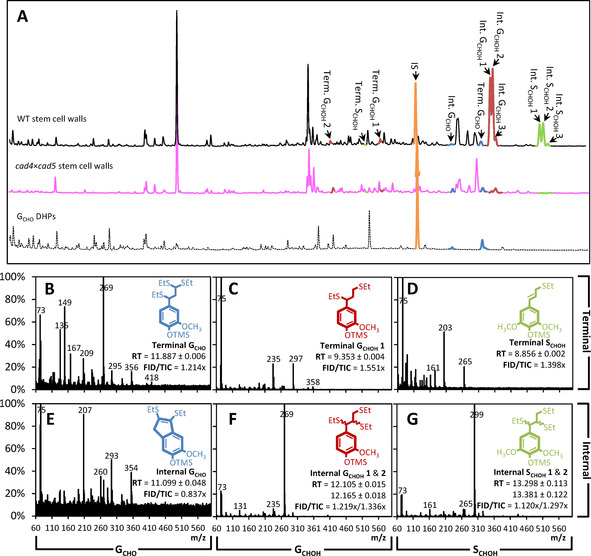
Diagnostic thioacidolyzed compounds deriving from terminal and internal residues of GCHO, GCHOH, and SCHOH in cell walls of stem tissues. Thioacidolysis chromatogram profiles for WT and cad4xcad5 Arabidopsis stems compared to GCHO DHPs, in orange the internal standard (IS, tetracosane), in blue GCHO residues, in red GCHOH residues, and in green SCHOH residues (A). Characteristics of diagnostic compounds are presented for terminal (B–D) and internal (E–G) residues of GCHO (B,E), GCHOH (C,F) and SCHOH (D,G) by their m/z,40, 41, 42, 43, 44, 45 retention time (RT in min) and FID/TIC fold‐ratio (see also Figure S3). Note that internal GCHOH (F) and SCHOH (G) each form two diastereoisomers with different RT (respectively erythro and then threo form in order of elution).40, 41, 42, 43, 44, 45
One essential characteristic of lignin generally overlooked in the context of biomass optimization is its heterogeneity at the cellular and sub‐cellular levels.1, 7, 48 By neglecting this crucial aspect, opportunities are missed to design plant biomass with homogeneous lignin composition to improve its valorization potential. To characterize this cellular heterogeneity of lignin composition, the cell type specific accumulation of GCHO, GCHOH and S residues were measured using two in situ quantitative methods. These included the histochemical Wiesner test7 as well as Raman confocal microspectroscopy,49, 50, 51 both recently reported to enable quantitative measurement of GCHO, GCHOH and S residues in the cell walls of the different cell types (Figure 4A–C). A recent study however showed that the 1625 and 1141 cm−1 Raman bands, previously suggested to reflect lignin GCHO residues,49, 50, 51, 52, 53 did not correlate strongly with either the Wiesner test7 or pyrolysis/GC‐MS51 quantification of total GCHO residues. Raman microspectra of GCHO residues as monomers and DHPs confirmed the presence of these two characteristic 1625 and 1141 cm−1 Raman bands (Figure 4C). Comparison of Raman microspectra obtained from cross‐sections also showed an increased 1625 cm−1 and to a lesser extent 1141 cm−1 Raman bands in cad4xcad5 mutant compared to WT plants (Figure 4C). We therefore hypothesized that the differences between the Wiesner test and 1625/1141 cm−1 Raman bands depended on the position of GCHO residues within the lignin polymer, as they exhibited distinct cell type values (Figure 4D,E). The Wiesner test intensity showed strong correlation with the total β‐O‐4 linked GCHO residues measured by thioacidolysis/GC‐MS‐FID, but weaker correlations with terminal or internal GCHO residues (Figure 5). These results confirmed that the Wiesner test detects all GCHO residues in the lignin polymer, thus providing the most precise in situ quantitative method currently available. In contrast, correlation of the 1625 cm−1 Raman band did not show any strong association with the total β‐O‐4 linked GCHO measured by thioacidolysis/GC‐MS‐FID (Figure 5). Instead, the 1625 cm−1 Raman band reflected more the concentration of terminal β‐O‐4 linked GCHO residues (Figure 5). This result confirmed previous hypotheses which suggested that the 1625 cm−1 band originated predominantly from GCHO units with an unsaturated and unlinked C3, such as lignin terminal residues.53 The influence of residue position in the lignin polymer on Raman scattering was however specific to GCHO and was not observed for GCHOH or S residues (Figure 5). The 1141 cm−1 Raman band had also been used to quantify GCHO residues in milled wood lignin,52 but showed weaker correlations than the 1625 cm−1 band, probably due to the presence in cross‐sections of other cell wall polymers removed by the milling process (Figure S4). Altogether, our results show that the different in situ imaging methods allowed distinguishing and quantifying GCHO residues in different positions within the lignin polymer at the cellular level.
Figure 4.
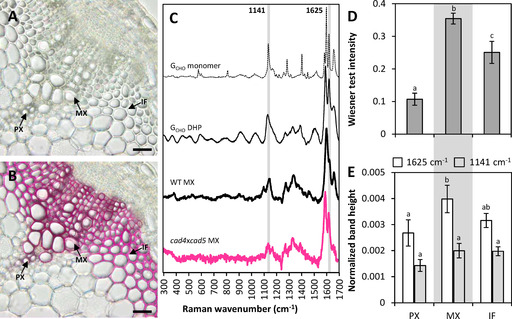
In situ quantitative detection of GCHO content in cell walls of specific cell types in stem cross‐sections of Arabidopsis. Sample response before (A) and after (B) staining with to the Wiesner test (phloroglucinol/HCl). Bars=30 μm. Protoxylem vessels (PXs), metaxylem vessels (MXs) and interfascicular fibers (IFs) are indicated by arrows. Standard average Raman spectra of GCHO monomers, DHPs and MXs in WT and cad4xcad5 Arabidopsis stem cross‐sections (C). The 1141 and 1625 cm−1 bands, previously suggested to reflect GCHO residues, are indicated by grey line. Cell type‐specific responses in WT plant cross‐sections for the Wiesner test (D) and Raman (E), n=average of each cell type in 3–5 independent biological replicates. Different letters for each category indicate significant differences according to a one‐way ANOVA with Tukey test (α=0.05).
Figure 5.
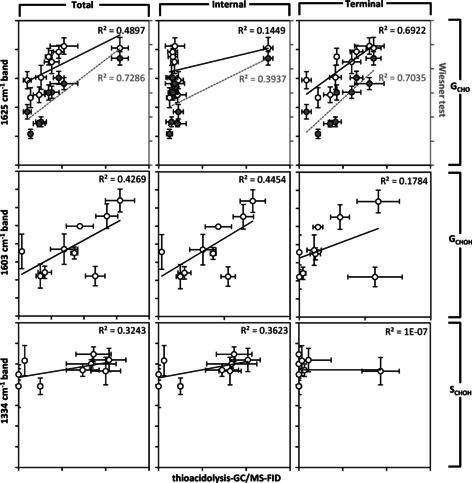
Linear regression analyses between specific Raman band heights and thioacidolysis‐GC/MS‐FID for GCHO, GCHOH, and SCHOH residues connected by β‐O‐4 linkages at different positions with the lignin polymers of stem tissues in a set of Arabidopsis with differently modified lignins. Note that instead of Raman, regression analyses between thioacidolysis with Wiesner intensity for GCHO residues are indicated in the right y axis of the upper row in grey. Note that the R 2 value of linear regressions between internal GCHO and 1625 cm−1 Raman band is reduced to 0.0001 when removing the cad4xcad5 mutant (extreme value), and between terminal SCHOH and 1334 cm−1 Raman band is reduced to 0.1339 when removing the ccoaomt1 mutant (extreme value).
A recent study has shown that specific genetic regulation controls GCHO residue amounts in the different cell types of Arabidopsis and poplar stems.7 The accumulation of terminal and total GCHO residues in specific cell types was thus monitored in Arabidopsis stems for protoxylem vessels (PX), metaxylem vessels (MX) and interfascicular fibers (IFs). The relative positional proportion of GCHO residues was estimated using the ratio of the 1625 cm−1 Raman band, reflecting β‐O‐4 linked terminal residues, to the Wiesner test intensity, to account for all GCHO residues. Arabidopsis WT plants showed that the three cell types presented different positional proportions in their lignin: PX presented low amount of terminal residue whereas MXs and IFs had similar higher amounts (Figure 6). Analyses of cross‐sections from the Arabidopsis mutant series revealed that the genetic regulation controlling the position of GCHO residues differed between the three cell types. PXs and MXs, which have respectively the lowest and highest concentrations of total and terminal GCHO residues in their cell wall (Figure 4D,E),7 were not affected by the different genetic regulation altering GCHO biosynthesis (Figure 6). In contrast, IFs were the most susceptible to large changes in the positional proportion of GCHO residues, with large increases in the 4cl1x4cl2 and ccr1‐3 mutants, compared to slight to no decreases in the cad4xcad5, fah1 and omt1 mutants (Figure 6). These results represent an unsuspected discovery on the genetic regulation of the distribution of GCHO residues within the lignin polymer in specific cell types. This specific regulation of GCHO residues in lignin was anticipated from previous analyses using NMR spectroscopy, which only detected β‐O‐4 linked GCHO with syringyl (S) residue, but not other guaiacyl (G) residues in CAD down‐regulated angiosperm tobacco, poplar and mulberry – all species with wood composed of more IFs than PXs/MXs.27, 31, 54, 55 In contrast, CAD down‐regulated plants from gymnosperms, such as the CAD‐null pine, having wood composed of mostly PXs/MXs, or angiosperms devoid of S residues, such as the fah1 mutant, are nevertheless capable of linking GCHO residues by β‐O‐4 links to other G residues.8, 37 The proportions of the different lignified cell types vary between plant organs and their developmental state, thus allowing one to harvest biomass with distinct coniferaldehyde profiles. This aspect highlights the advantages of plant biomass as a multipurpose renewable resource for sustainable uses. Although the exact molecular mechanisms enabling the positional control of GCHO residues yet remain unclear, such specific genetic control suggests that the molecular nature by which GCHO monomers are secreted and/or oxidatively polymerized, depending on their positions in the polymer, are differently regulated in each cell type.
Figure 6.
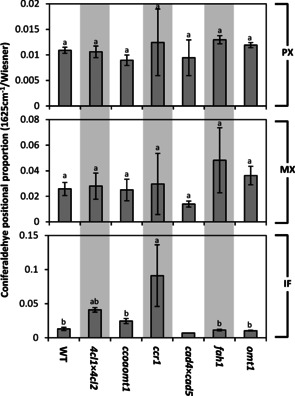
Genetic regulation of the GCHO positional proportion in lignin of different cell types in stem cross‐sections of a set of Arabidopsis mutants differently altered in lignin. Cell types include protoxylem vessels (PX), metaxylem vessels (MX), and interfascicular fibers (IFs). Different letters for each residue category indicate significant differences according to a one‐way ANOVA with Tukey test (α=0.05), n=2–6 cells from 2–3 individual plants per genotype for Raman divided by n=cellular average of 5 individual plants per genotype for the Wiesner test.
The extent of the possibilities for the sustainable uses of plant cell wall biomass depends on the compositional homogeneity and predictability of the lignin polymer structure in the feedstock used. Our study details how the amount of GCHO residues in lignin differs between the cell types making up the plant biomass. Such cellular specificity, with large differences in G and S residue levels, had already been reported between MXs and IFs.1 These specificities appear to depend on the cell type itself as genetic engineering or monomer feeding to force both angiosperm and gymnosperm MXs to incorporate S residues only slightly changed their lignin composition.48 We also showed that the positional distribution of the GCHO residues within the lignin polymer varied between the cell types. It yet remains unknown whether similar cell‐specific regulation mechanisms also exist for the more abundant C6C3 alcohol monomers. The apparent complexity and evolutionary conservation48 of these regulatory systems is understandable from a biological perspective as both the proportions and positions of specific residues will diversify the lignin polymer‘s chemical and mechanical properties to vary its physiological functions. Future studies to decipher the underlying genetic and molecular mechanisms will thus allow defining to which extent plants can be selected or genetically designed to control the GCHO residue distribution within lignin and/or between cell types without hindering agronomical yields for future sustainable uses in biorefineries.
Experimental Section
Plant material: Arabidopsis thaliana plants were grown from seeds for 8 weeks on 1 : 3 (v/v) vermiculite/soil in controlled growth chambers under a 16/8 h and 22 °C/18 °C photoperiod with 60 % humidity and 150 μmol m−2 s−1 illumination using Aura T5 Eco Saver Long Life HO light tubes (AuraLight, Sweden). Arabidopsis mutants in the Columbia‐0 background obtained from the European Stock center included: 4cl1‐1 (SALK_14252618), 4cl2‐4 (SALK_11019719), ccr1‐3 (SALK_123‐68920), cad4 (SAIL_1265_A0621), cad5 (SAIL_776_B0621), ccoaomt1 (SALK_15150722), fah1‐2 (EMS mutant), omt1 (SALK_13529024) and double mutants 4cl1‐1x4cl2‐4, and cad4xcad5. Wassilewskija (WS) wild‐type and cad4xcad5 were provided by Dr. Richard Sibout (INRA Versailles). Basal 4–5 cm of stems were harvested in 70 % ethanol and sectioned, and the rest of the stems were flash‐frozen in liquid nitrogen and stored at ‐20 °C. Transverse cross‐sections were stored in 70 % ethanol to remove protoplasts and extractives and washed twice in ultrapure water prior to imaging.
Chemicals: Phenolic compounds used included coniferaldehyde (Aldrich, 382051), coniferyl alcohol (Aldrich, 223735), and sinapyl alcohol (Aldrich, 404586).
Dehydrogenation polymers (DHPs): DHPs were synthesized according to the Zutropf method as previously described.51 10 mL of a solution with 1 mg of horseradish peroxidase (Sigma, P8375‐10KU) in 0.1 M NaHPO4 buffer at pH 6 was mixed under magnetic stirring with 10 mL solutions of 14 mM H2O2 (Sigma‐Aldrich, 95299) and 12 mM of monomer in 3 : 7 methanol/0.1 M NaHPO4 buffer at pH 6 at a rate of 0.5 mL h−1 using a Legato 200 syringe pump (KdScientific, USA). After 24 h, DHPs in the mixture were isolated by centrifugation at 10000 g for 10 min, the supernatant was removed, and the pellet was washed three times in ultrapure water and freeze‐dried.
Cell wall isolation: Extract‐free cell wall material were isolated from stems ground in liquid nitrogen using ceramic mortar and pestle. Proteins and membranes were removed by three washes using vortex mixer agitation with a solution containing 140 mM Tris‐base (Sigma‐Aldrich, T1503), 105 mM tris acetate (Sigma‐Aldrich, T1258), 0.5 mM ethylenediamine tetraacetic acid (EDTA, Scharlau Chemie, AC0965), and 8 % w/v lithium dodecyl sulfate (LDS, Sigma‐Aldrich, L4632) combined with centrifugation (10000 g, 10 min) and the removal of supernatant. Pellets were then successively washed/centrifuged with water, 100 % methanol and finally chloroform/methanol (1 : 1). Pellets were then washed in acetone and air dried overnight.
Thioacidolysis‐GC/MS‐FID: Thioacidolysis of plant samples was performed according to Ref. [56]. 5–10 mg of extract‐free cell wall or DHPs and 100 μg internal standard tetracosan (Fuji Film Wako Pure Chem. Ind., 209‐04351) as an internal standard were mixed with a freshly made thioacidolysis reagent containing 87.5 % dioxane (Fuji Film Wako Pure Chem. Ind., 042‐03766), 10 % ethanethiol (97 %, Alfa Aesar, 22585), and 2.5 % boron trifluoride diethyl etherate (>46.5 % BF3, Sigma‐Aldrich, 216607) were mixed in a 1 mL screw‐cap reaction vial. The vial cap was screwed on tightly and kept on a sand bath at 100 °C for 4 h with gentle shaking. After cooling the vial in ice water for 5 min, 200 μL of product mixture solution was transferred into a new vial, and 100 μL of 1 M sodium hydrogen carbonate was added. Next, 130 μL of 1 M hydrochloric acid solution was used to adjust the pH to below 3. The resultant solution was extracted three times with 250 μL diethyl ether (Fuji Film Wako Pure Chem. Ind., 055‐01155). The combined organic phase was washed with saturated sodium chloride and then evaporated after drying over anhydrous sodium sulfate. 50 μL of N,O‐bis(trimethylsilyl)trifluoroacetamide (Sigma‐Aldrich, 15222) and 50 μL anhydrous pyridine (Sigma‐Aldrich, 270970) were added to the vial and kept at 60 °C for 1 h. The mixture was diluted with dichloromethane prior to GC/MS‐FID analysis. GC were performed on a Shimadzu GC‐2010 Plus equipped with a HP‐5 MS capillary column (30 m×0.25 mm×0.25 μm), a FID detector and a Shimadzu GC‐MS‐QP2020 (Shimadzu, Japan). GC/MS‐FID analysis: injector was operated at 250 °C. The column temperature program: 60 °C (2 min), from 60 °C to 260 °C (15 °C ⋅ min−1), 260 °C (18 min), from 260 to 300 °C (5 °C ⋅ min−1), 300 °C (10 min). Mobile phase used helium at a rate of 1.46 mL min−1. The identification of thioacidolyzed derivatives of lignin monomers was based on previous publications.40, 41, 42, 43, 44, 45 Chromatograms were analyzed using Openchrom (https://lablicate.com/platform/openchrom) and proportion of each residue was expressed as their contribution to the total chromatogram area relatively to the initial cell wall weight and internal standard.
Pyrolysis‐GC/MS: Pyrolysis GC‐MS analysis was performed according to Ref. [32] on 60 μg (±10 μg) of freeze‐dried ball‐milled stem samples using a pyrolyzer equipped with an autosampler (PY‐2020iD and AS‐1020E, Frontier Lab, Japan) connected to a GC/MS (7890A/5975C; Agilent Technologies AB, Sweden). Pyrolytic peak identification of lignin monomers was based on previous publications.29, 30, 31, 32 Proportion of each residue was expressed as their contribution to the total pyrogram area.
In situ quantitative lignin analysis: Quantitative Wiesner data was taken from Ref. [7], and is available in the Supporting Information of that publication. Briefly, 50 μm stem cross‐sections were imaged before and after staining with 0.5 % phloroglucinol (Sigma, P3502) in 1 : 1 ethanol/HCl (37 %). The acquired images were transformed into absorbance using ImageJ, aligned, and measured in 50 circular points per plant and cell type. Finally, the unstained background absorbance of each point was subtracted from the stained absorbance. Quantitative Raman microspectroscopy data was partly taken from Ref. [51] and extended using the same experimental setup. Briefly, spectra from stem cross‐sections were acquired using a Raman Touch‐VIS‐NIR (Nanophoton, Japan) equipped with a 532 nm laser. Spectra (1.6 cm−1 resolution) were baseline corrected using an asymmetric least‐squares algorithm and normalized to the total Raman signal (area under the curve) between 300 and 1700 cm−1.
Conflict of interest
The authors declare no conflict of interest.
Supporting information
As a service to our authors and readers, this journal provides supporting information supplied by the authors. Such materials are peer reviewed and may be re‐organized for online delivery, but are not copy‐edited or typeset. Technical support issues arising from supporting information (other than missing files) should be addressed to the authors.
Supplementary
Acknowledgements
We thank Prof. Joseph Samec for critical comments. We thank Delphine Ménard, Louis Leboa, Charilaos Dimotakis and Dr. Junko Takahashi‐Schmidt for their help with plant phenotypic analysis and pyrolysis‐GC/MS. We thank Dr. Richard Sibout (INRA Versailles) for the WT and cad4xcad5 seeds in the WS background. This work was supported in part by the Japan Science and Technology Agency (Advanced Low Carbon Technology Research and Development Program). EP acknowledges funding from Vetenskapsrådet (VR) research grants 2010‐4620 and 2016‐04727, the Stiftelsen för Strategisk Forskning ValueTree, the Bolin Centre for Climate Research RA4 “seed money”, and the Carl Tryggers Foundation CTS16‐362/17 : 16/18 : 308. We also thank Bio4Energy (a strategic research environment appointed by the Swedish government) cell wall analysis platform for access to the pyrolysis‐GC/MS, as well as the National Institute for Materials Science (NIMS, Japan) Molecule & Material Synthesis Platform in the “Nanotechnology Platform Project” operated by the Ministry of Education, Culture, Sports, Science and Technology (MEXT, Japan). We also thank the Institute of Global Innovation Research (GIR) of Tokyo University of Agriculture and Technology (TUAT) and the Departments of Organic Chemistry and of Ecology, Environment and Plant Sciences (DEEP) of Stockholm University (SU).
M. Yamamoto, L. Blaschek, E. Subbotina, S. Kajita, E. Pesquet, ChemSusChem 2020, 13, 4400.
Dedicated to the memory of Professor Dr. Julius Ritter von Wiesner, who initiated coniferaldehyde research in plant lignified biomass.
References
- 1. Barros J., Serk H., Granlund I., Pesquet E., Ann. Bot. 2015, 115, 1053–1074. [DOI] [PMC free article] [PubMed] [Google Scholar]
- 2. Boerjan W., Ralph J., Baucher M., Annu. Rev. Plant Biol. 2003, 54, 519–546. [DOI] [PubMed] [Google Scholar]
- 3. Vanholme R., Morreel K., Darrah C., Oyarce P., Grabber J. H., Ralph J., Boerjan W., New Phytol. 2012, 196, 978–1000. [DOI] [PubMed] [Google Scholar]
- 4. Holmgren A., Norgren M., Zhang L., Henriksson G., Phytochemistry 2009, 70, 147–55. [DOI] [PubMed] [Google Scholar]
- 5. Wróbel-Kwiatkowska M., Jabłoński S., Szperlik J., Dymińska L., Łukaszewicz M., Rymowicz W., Hanuza J., Szopa J., Transgenic Res. 2015, 24, 971–978. [DOI] [PMC free article] [PubMed] [Google Scholar]
- 6. Kim K. H., Eudes A., Jeong K., Yoo C. G., Kim C. S., Ragauskas A., Proc. Natl. Acad. Sci. USA 2019, 116, 13816–13824. [DOI] [PMC free article] [PubMed] [Google Scholar]
- 7. Blaschek L., Champagne A., Dimotakis C., Nuoendagula, Decou R., Hishiyama S., Kratzer S., Kajita S., Pesquet E., Front. Plant Sci. 2020, 11, 109. [DOI] [PMC free article] [PubMed] [Google Scholar]
- 8. Anderson N. A., Tobimatsu Y., Ciesielski P. N., Ximenes E., Ralph J., Donohoe B. S., Ladisch M., Chapple C., Plant Cell 2015, 27, 2195–2209. [DOI] [PMC free article] [PubMed] [Google Scholar]
- 9. Sibout R., Eudes A., Mouille G., Pollet B., Lapierre C., Jouanin L., Séguin A., Plant Cell 2005, 17, 2059–76. [DOI] [PMC free article] [PubMed] [Google Scholar]
- 10. Baucher M., Chabbert B., Pilate G., Van Doorsselaere J., Tollier M. T., Petit-Conil M., Cornu D., Monties B., Van Montagu M., Inze D., Jouanin L., Boerjan W., Plant Physiol. 1996, 112, 1479–1490. [DOI] [PMC free article] [PubMed] [Google Scholar]
- 11. Stewart D., Yahiaoui N., McDougall G. J., Myton K., Marque C., Boudet A. M., Haigh J., Planta 1997, 201, 311–318. [DOI] [PubMed] [Google Scholar]
- 12. Baucher M., Bernard-vailhé M. A., Chabbert B., Besle J.-M., Opsomer C., Van Montagu M., Botterman J., Plant Mol. Biol. 1999, 39, 437–447. [DOI] [PubMed] [Google Scholar]
- 13. Sattler S. E., Saathoff A. J., Haas E. J., Palmer N. A., Funnell-Harris D. L., Sarath G., Pedersen J. F., Plant Physiol. 2009, 150, 584–595. [DOI] [PMC free article] [PubMed] [Google Scholar]
- 14. Saathoff A. J., Sarath G., Chow E. K., Dien B. S., Tobias C. M., PLoS One 2011, 6, e16416. [DOI] [PMC free article] [PubMed] [Google Scholar]
- 15. Bouvier D'Yvoire M., Bouchabke-Coussa O., Voorend W., Antelme S., Cézard L., Legée F., Lebris P., Legay S., Whitehead C., McQueen-Mason S. J., Gomez L. D., Jouanin L., Lapierre C., Sibout R., Plant J. 2013, 73, 496–508. [DOI] [PubMed] [Google Scholar]
- 16. Zhao Q., Tobimatsu Y., Zhou R., Pattathil S., Gallego-Giraldo L., Fu C., Jackson L. A., Hahn M. G., Kim H., Chen F., Ralph J., Dixon R. A., Proc. Natl. Acad. Sci. USA 2013, 110, 13660–13665. [DOI] [PMC free article] [PubMed] [Google Scholar]
- 17. Preisner M., Kulma A., Zebrowski J., Dymińska L., Hanuza J., Arendt M., Starzycki M., Szopa J., BMC Plant Biol. 2014, 14, 50. [DOI] [PMC free article] [PubMed] [Google Scholar]
- 18. Martin A. F., Tobimatsu Y., Kusumi R., Matsumoto N., Miyamoto T., Lam P. Y., Yamamura M., Koshiba T., Sakamoto M., Umezawa T., Sci. Rep. 2019, 9, 17153. [DOI] [PMC free article] [PubMed] [Google Scholar]
- 19. Ralph J., MacKay J. J., Hatfield R. D., O'Malley D. M., Whetten R. W., Sederoff R. R., Science 1997, 277, 235–239. [DOI] [PubMed] [Google Scholar]
- 20. MacKay J. J., O'Malley D. M., Presnell T., Booker F. L., Campbell M. M., Whetten R. W., Sederoff R. R., Proc. Natl. Acad. Sci. USA 1997, 94, 8255–8260. [DOI] [PMC free article] [PubMed] [Google Scholar]
- 21. Yamamoto M., Tomiyama H., Koyama A., Okuizumi H., Liu S., Vanholme R., Goeminne G., Hirai Y., Shi H., Nuoendagula, Takata N., Ikeda T., Uesugi M., Kim H., Sakamoto S., Mitsuda N., Plant Physiol. 2020, 182, 1821–1828. [DOI] [PMC free article] [PubMed] [Google Scholar]
- 22. Grabber J. H., Ralph J., Hatfield R. D., J. Sci. Food Agric. 1998, 78, 81–87. [Google Scholar]
- 23. Özparpucu M., Rüggeberg M., Gierlinger N., Cesarino I., Vanholme R., Boerjan W., Burgert I., Plant J. 2017, 91, 480–490. [DOI] [PubMed] [Google Scholar]
- 24. Özparpucu M., Gierlinger N., Burgert I., Van Acker R., Vanholme R., Boerjan W., Pilate G., Déjardin A., Rüggeberg M., Planta 2018, 247, 887–897. [DOI] [PubMed] [Google Scholar]
- 25. Jourdes M., Cardenas C. L., Laskar D. D., Moinuddin S. G. A., Davin L. B., Lewis N. G., Phytochemistry 2007, 68, 1932–1956. [DOI] [PubMed] [Google Scholar]
- 26. Lundquist K., Parkås J., Paulsson M., Heitner C., BioResources 2007, 2, 334–350. [Google Scholar]
- 27. Isogai A., Saito T., Fukuzumi H., Nanoscale 2011, 3, 71–85. [DOI] [PubMed] [Google Scholar]
- 28. Brunow G., Lundquist K., Pap. Ja Puu 1980, 62, 669–672. [Google Scholar]
- 29. Sonoda T., Ona T., Yokoi H., Ishida Y., Ohtani H., Tsuge S., Anal. Chem. 2001, 73, 5429–5435. [DOI] [PubMed] [Google Scholar]
- 30. Faix O., Meier D., Grobe I., J. Anal. Appl. Pyrolysis 1987, 11, 403–416. [Google Scholar]
- 31. Ralph J., Hatfield R. D., J. Agric. Food Chem. 1991, 39, 1426–1437. [Google Scholar]
- 32. Gerber L., Eliasson M., Trygg J., Moritz T., Sundberg B., J. Anal. Appl. Pyrolysis 2012, 95, 95–100. [Google Scholar]
- 33. Yokoi H., Ishida Y., Ohtani H., Tsuge S., Sonoda T., Ona T., Analyst 1999, 124, 669–674. [Google Scholar]
- 34. Du X., Pérez-Boada M., Fernández C., Rencoret J., del Río J. C., Jiménez-Barbero J., Li J., Gutiérrez A., Martínez A. T., Planta 2014, 239, 1079–1090. [DOI] [PubMed] [Google Scholar]
- 35. Ralph J., Kim H., Lu F., Ralph S. A., Landucci L. L., Ito T., Kawai S., Tappi 1999, 58–63. [Google Scholar]
- 36. Kim H., Ralph J., Yahiaoui N., Pean M., Boudet M., Org. Lett. 2000, 2, 2197–2200. [DOI] [PubMed] [Google Scholar]
- 37. Kim H., Ralph J., Lu F., Ralph S. A., Boudet A. M., MacKay J. J., Sederoff R. R., Ito T., Kawai S., Ohashi H., Higuchi T., Org. Biomol. Chem. 2003, 1, 268–281. [DOI] [PubMed] [Google Scholar]
- 38. Méchin V., Baumberger S., Pollet B., Lapierre C., Phytochemistry 2007, 68, 571–579. [DOI] [PubMed] [Google Scholar]
- 39. Crestini C., Melone F., Sette M., Saladino R., Biomacromolecules 2011, 12, 3928–3935. [DOI] [PubMed] [Google Scholar]
- 40. Ito T., Kawai S., Ohashi H., Higuchi T., J. Wood Sci. 2002, 48, 409–413. [Google Scholar]
- 41. Kim H., Ralph J., Lu F., Pilate G., Leplé J.-C., Pollet B., Lapierre C., J. Biol. Chem. 2002, 277, 47412–47419. [DOI] [PubMed] [Google Scholar]
- 42. Lapierre C., Pilate G., Pollet B., Mila I., Leplé J.-C., Jouanin L., Kim H., Ralph J., Phytochemistry 2004, 65, 313–321. [DOI] [PubMed] [Google Scholar]
- 43. Thévenin J., Pollet B., Letarnec B., Saulnier L., Gissot L., Maia-Grondard A., Lapierre C., Jouanin L., Mol. Plant 2011, 4, 70–82. [DOI] [PubMed] [Google Scholar]
- 44. Rolando C., Monties B., Lapierre C., Methods in Lignin Chemistry (Eds.: S. Y. Lin, C. W. Dence), Springer, Berlin, Heidelberg: 1992, pp. 334–349. [Google Scholar]
- 45. Kishimoto T., Chiba W., Saito K., Fukushima K., Uraki Y., Ubukata M., J. Agric. Food Chem. 2010, 58, 895–901. [DOI] [PubMed] [Google Scholar]
- 46. Tobimatsu Y., Takano T., Kamitakahara H., Nakatsubo F., J. Wood Sci. 2010, 56, 233–241. [Google Scholar]
- 47. Anderson E. M., Stone M. L., Katahira R., Reed M., Muchero W., Ramirez K. J., Beckham G. T., Román-Leshkov Y., Nat. Commun. 2019, 10, 2033. [DOI] [PMC free article] [PubMed] [Google Scholar]
- 48. Pesquet E., Wagner A., Grabber J. H., Curr. Opin. Biotechnol. 2019, 56, 215–222. [DOI] [PubMed] [Google Scholar]
- 49. Gierlinger N., Schwanninger M., Plant Physiol. 2006, 140, 1246–1254. [DOI] [PMC free article] [PubMed] [Google Scholar]
- 50. Gorzsás A., Methods in Molecular Biology (Eds.: M. de Lucas, J. P. Etchells), Springer, New York: 2017, pp. 133–178. [Google Scholar]
- 51. Blaschek L., Nuoendagula, Bacsik Z., Kajita S., Pesquet E., ACS Sustainable Chem. Eng. 2020, 8, 4900–4909. [Google Scholar]
- 52. Agarwal U. P., Ralph S. A., Holzforschung 2008, 62, 667–675. [Google Scholar]
- 53. Bock P., Gierlinger N., J. Raman Spectrosc. 2019, 50, 778–792. [DOI] [PMC free article] [PubMed] [Google Scholar]
- 54. Russell W. R., Provan G. J., Burkitt M. J., Chesson A., J. Biotechnol. 2000, 79, 73–85. [DOI] [PubMed] [Google Scholar]
- 55. Van Acker R., Déjardin A., Desmet S., Hoengenaert L., Vanholme R., Morreel K., Laurans F., Kim H., Santoro N., Foster C., Goeminne G., Légée F., Lapierre C., Pilate G., Ralph J., Boerjan W., Plant Physiol. 2017, 175, 1018–1039. [DOI] [PMC free article] [PubMed] [Google Scholar]
- 56. Yamamura M., Hattori T., Suzuki S., Shibata D., Umezawa T., Plant Biotechnol. 2012, 29, 419–423. [Google Scholar]
Associated Data
This section collects any data citations, data availability statements, or supplementary materials included in this article.
Supplementary Materials
As a service to our authors and readers, this journal provides supporting information supplied by the authors. Such materials are peer reviewed and may be re‐organized for online delivery, but are not copy‐edited or typeset. Technical support issues arising from supporting information (other than missing files) should be addressed to the authors.
Supplementary


