Abstract
Sarcopenia is an age-associated disorder that results in skeletal muscle loss. Apoptosis and inflammation are the two major contributors to sarcopenia. Emerging evidence has shown that long-chain fatty acids (LCFAs) are implicated in the muscles of sarcopenic animal models. However, it is unknown whether LCFAs are correlated with apoptosis or inflammation in the pathogenesis of sarcopenia. Herein, we found that pentadecanoic acid (PDA), a C15 LCFA, was significantly accumulated in human sarcopenic muscles. In vitro PDA treatment could dose-dependently induce the expression of the transcription factor FOXM1 (forkhead box M1) and several proapoptotic genes, such as PUMA (p53-upregulated modulator of apoptosis), BAX (B-cell/lymphoma 2-associated X) and APAF1 (apoptotic peptidase activating factor 1), thereby causing apoptosis. Mechanically, PDA activated AKT1 (AKT serine/threonine kinase 1) to phosphorylate NCOR1 (nuclear receptor corepressor 1). The phosphorylated NCOR1 disassociated from the NCOR1-FOXM1 transcriptional complex and could not repress FOXM1-mediated transcription, leading to the induction of PUMA. The activated PUMA further triggered downstream apoptotic signaling, including activation of the BAX, APAF1 and caspase cascades, leading to the occurrence of apoptosis. Alkaline phosphatase or knockdown of AKT1 in vitro reversed the FOXM1-mediated apoptotic signaling. Collectively, our results provide new evidence that LCFAs are involved in the pathogenesis of sarcopenia by activating apoptotic signaling. Attempts to decrease the intake of PDA-containing foods or blocking AKT1 may improve the symptoms of sarcopenia.
Keywords: Sarcopenia, pentadecanoic acid, apoptosis, AKT1, FOXM1, NCOR1
Introduction
Sarcopenia, a disorder characterized by the degenerative loss of skeletal muscles, is prevalent in people over 65 years old. The epidemiology of sarcopenia in people 65-70 years old is nearly 14%, while it rises to over 50% in those over 80 years old [1,2]. However, the etiopathogenetic mechanisms of sarcopenia are still not clearly defined. Sarcopenia is simply divided into two categories: primary sarcopenia and secondary sarcopenia [1]. Primary sarcopenia refers to patients who do not have other underlying medical problems, such as cardiovascular disease, diabetes, chronic respiratory disease or cancer, but are only experiencing aging itself [1,3]. Apoptosis and inflammation are recognized as the two major contributors to the pathology of primary sarcopenia [1,3]. Secondary sarcopenia is associated with the incidence of other diseases such as obesity, osteoporosis or type 2 diabetes [1,3]. These sarcopenic patients often have a physical disability and a poor quality of life [1,3]. Thus, in-depth research is urgently required to elucidate the pathogenic mechanisms of sarcopenia and discover strategies that can delay or even overcome sarcopenia.
Obesity is normally caused by the increased deposition of long-chain fatty acids (LCFAs) [4,5]. The deposition of LCFAs in muscle can compromise muscle integrity [4,5]. Because obesity is a risk factor for secondary sarcopenia, some studies have investigated the roles of LCFAs in animal models of secondary sarcopenia [6-8]. Laurentius et al. found that LCFAs, such as linoleic acid, stearic acid, and vaccenic acid, and inflammatory markers, such as CCL2 (C-C motif chemokine ligand 2), CCL5, and CXCL2 (C-X-C motif chemokine ligand 2), were coaccumulated in the skeletal muscle of sarcopenic rats [6]. Other studies have found that LCFA accumulation in muscle can compromise protein anabolism and cause lipotoxicity, leading to low-grade inflammation [7,8]. In vitro analyses indicated that LCFAs can directly induce the expression of cytokines [9]. However, it is unclear whether LCFAs can contribute to apoptosis in sarcopenic muscle. Recently, Chen et al. found that the accumulation of palmitic acid (PA), an LCFA, can induce apoptosis and inflammation in astrocytes in a Cav1 (caveolin 1) autophagic degradation-dependent manner [10]. Because of this important finding, together with the critical role of LCFAs in obesity, we speculate that LCFAs may contribute to the pathogenesis of sarcopenia through activating apoptosis.
Apoptosis can be stimulated by either external or internal signals and thus is divided into two pathways: the intrinsic and extrinsic apoptosis pathways [11]. The extrinsic pathway is mediated by death receptors such as Fas receptors, tumor necrosis factor receptors (TNFRs), and TNF-related apoptosis-inducing ligand (TRAIL) receptors [11,12]. Once extracellular ligands such as TNF-α, FasL, and TRAIL bind to the death receptors, they further recruit adaptor proteins such as FADD (Fas-associated protein with death domain) and TRADD (TNFR1-associated DEATH domain protein) [11,12]. The adaptor proteins initiate a series of downstream cascades, including Caspase 8 (CASP8) and CASP3/7/9, eventually resulting in apoptosis [11,12]. The intrinsic pathway, also known as the mitochondrial pathway, is initiated by sensing intracellular stresses such as cell toxins, free radicals, DNA damage and viral infections [11,12]. Upon sensing stress signals, cells activate a p53-dependent apoptotic pathway, causing the induction of p53-upregulated modulator of apoptosis (PUMA) [11-13]. The activated PUMA interacts with anti-apoptotic proteins such as Bcl-xL and Bcl-2, inhibiting their interactions with two proapoptotic proteins, BAX (BCL2 associated X) and BAK1 (BCL2 antagonist/killer 1) [11-13]. The activation of BAX and BAK1 induces mitochondrial outer membrane permeabilization (MOMP), causing the release of cytochrome c, which promotes CASP9 and APAF1 (apoptotic protease activating factor 1) to assemble the caspase-activating complex [11-13]. The apoptosome initiates caspase cascades, including CASP3 and CASP7, thereby advancing apoptosis. In addition to the p53-dependent activation of apoptotic signaling, a p53-independent pathway has also been identified in which the transcription factor FOXO3a (forkhead box O3a) can bind to the promoter of PUMA to mediate its expression [14-16]. The activation of autophagy can lead to the degradation of FOXO3a, thereby repressing the expression of PUMA and inhibiting PUMA downstream signaling [16]. Although the activation of apoptotic signaling in sarcopenic muscle was found many years ago, it is still unknown whether the p53-independent signaling also exists in this process.
To investigate whether LCFAs accumulate in human sarcopenic muscle, we measured their concentrations using gas chromatography-mass spectrometry (GC-MS). We found that pentadecanoic acid (PDA) was the LCFA with the highest muscle tissue concentration. We then performed a microarray analysis in cells treated with different doses of PDA to identify PDA-dependent genes. We found that FOXM1 (forkhead box M1) and several proapoptotic genes such as PUMA, BAX, BAK1 and APAF1 were dose-dependently activated by PDA. We discovered a FOXM1 binding site in the promoter of PUMA. In vitro knockdown of FOXM1 decreased the expression of PUMA, suggesting that PUMA was a target of FOXM1. We investigated how PDA activates FOXM1-mediated apoptotic signaling and explored the inhibition of this signaling in vitro. These findings may lead to future strategies for preventing the progression of sarcopenia in vivo.
Materials and methods
Sarcopenic muscle collection
A total of 24 paired quadriceps muscle tissue samples from young people without sarcopenia (Control) and older sarcopenic patients were used in this study. These quadriceps muscle tissues were the same samples that were used in a previous study [17]. All participants were informed of the purpose of this study and signed a consent form that was reviewed by the Ethics Board of Jiangxi Provincial People’s Hospital.
Measurement of LCFAs by GC-MS
The preparation of lipid fractions from the quadriceps muscle tissues and the measurement of LCFAs were conducted according to a previous protocol [6]. In brief, 50 mg of muscle tissue (n=10 for both control and sarcopenic tissues) was homogenized in 500 μL of PBS (Sigma-Aldrich, Shanghai, China, #806552), followed by adding 667 μL of chloroform (Sigma-Aldrich, #650498) and 333 μL of methanol (Sigma-Aldrich, #646377). The mixtures were vortexed for 1 min and then centrifuged at 13000 × g for 1 min. An SPE (solid phase extraction) column supplemented with 200 mg of dry silica gel (Sigma-Aldrich, #288624) was loaded with 100 mL of the chloroform layer. The LCFAs were eluted with 3 mL of 80% hexane/diethyl ether (Sigma-Aldrich, #270504 and #309966) and 4 mL of methanol. The elutes were thoroughly mixed with 2 mL of a 1% sulfuric acid (Sigma-Aldrich, #339741)/methanol mixture (v/v), followed by incubating at 50°C for 1 h. The resulting mixtures were incubated with 5% sodium chloride (Sigma-Aldrich, #S7653). The hexane layer was collected, and the individual LCFAs were measured by GC-MS according to a previous protocol [6].
Cell culture and transfection
The human skeletal muscle myoblast cell line HSMM-1 was purchased from Lonza (Basel, Switzerland, #CC2580). The cells were cultured in Dulbecco’s modified Eagle’s medium (DMEM) (Sigma-Aldrich, #D5546) containing 10% fetal bovine serum (FBS) (Sigma-Aldrich, #F4135) and 10 units of antibiotic solution (Sigma-Aldrich, #P4333). For gene overexpression (OE), cells were transfected with the following plasmids: pCDNA3-2 × Flag (empty vector), pCDNA3-2 × Flag-FOXM1, pCDNA3-2 × Flag-NCOR1 and pCDNA3-2 × Flag-AKT1. For gene knockdown (KD), cells were transfected with short hairpin RNA (shRNA) lentiviral transduction particles of individual genes, including FOXM1 (#TRCN0000273939), NCOR1 (#TRCN0000299677), and AKT1 (#TRCN0000199889), using FuGene 6 (Roche Diagnostics Corp., Indianapolis, IN, USA, #E2691). The transfected cells recovered in DMEM for 6 h, followed by selection with medium containing 1 μg/mL puromycin for 48 h. The single puromycin-resistant cells were sorted for further culturing, followed by measuring the mRNA and protein levels of the target proteins.
Cell treatment with PDA
HSMM-1 cells at 80% confluence were treated with different concentrations (0, 0.1, 0.3 and 0.6 mM) of PDA (Sigma-Aldrich, #P6125) at 37°C for 12 h. The cells were then washed twice with PBS buffer, collected, and used in subsequent experiments.
Total RNA isolation, microarray and real-time quantitative PCR (RT-qPCR)
Total RNA was extracted from the PDA-treated cells, transfected cells and muscle tissues using TRIzol reagent (Sigma-Aldrich, #T9424) according to the manufacturer’s protocol. After NanoDrop quantification, 1.0 μg of total RNA was applied to microarray analysis using a SurePrint G3 Human Gene Expression 8 × 60 K v2 Kit (Agilent Technologies, Santa Clara, CA, USA, #G4851B) following a previous protocol [17]. Briefly, total RNA samples were reversely transcribed into complementary DNAs (cDNAs) with a cDNA synthesis kit (Sigma-Aldrich, #11483188001), followed by fluorescent labeling with the SuperScript Plus Indirect cDNA Labeling System (Invitrogen, Shanghai, China, #L1014-05 and #L1014-06). The labeled cDNAs were fragmented and hybridized to the array chip at 45°C for 12 h, followed by washing to remove non-bound sequences. The fluorescent cDNAs were scanned using an iScan System (Illumina, San Diego, CA, USA, SY-101-1001). The differentially expressed genes were discovered by examining the hybridization intensity data with the iScan software (#20020824). For the RT-qPCR analyses, 500 ng of total RNA was subjected to reverse transcription to synthesize the first-strand cDNA. The individual gene expression level was examined by RT-qPCR with a SYBR Green PCR Kit (Sigma-Aldrich, #QR0100) using the primers listed in Supplementary Table 1. The PCR procedures and quantification method were as described previously [17].
Western blotting
The PDA-treated cells, transfected cells and muscle tissues were subjected to immunoblot analysis to determine protein levels using a previous protocol [17]. In brief, total cell extracts were obtained by lysing the cells and muscle tissues in RIPA (radioimmunoprecipitation assay) buffer (Sigma-Aldrich, #R0278) containing protease inhibitor (Sigma-Aldrich, #S8820). After centrifuging at 13000 × g for 15 min, the supernatant was quantified by NanoDrop. Equal amounts of total proteins were loaded onto 10% SDS-PAGE gels for separation, followed by transferring to PVDF (polyvinylidene difluoride) membranes. The membranes were blocked with 5% milk at room temperature for 1 h and then incubated at 4°C for 12 h with the following primary antibodies: anti-FOXM1 (Abcam, Cambridge, MA, USA, #ab207298), anti-PUMA (Abcam, #ab9643), anti-BAX (Sigma-Aldrich, #ZRB1103), anti-BAK1 (Thermo Fisher Scientific, Waltham, MA, USA, #MA5-32111), anti-CASP3 (Abcam, #ab4051), anti-CASP7 (Abcam, #ab181579), anti-CASP9 (Abcam, #ab25758), anti-BCL2 (Abcam, #ab196495), anti-FAS (Abcam, #ab82419), anti-BIM (Sigma-Aldrich, #B7929), anti-NCOR1 (Abcam, #ab58396), anti-AKT1 (Sigma-Aldrich, #SAB4300334), anti-Flag (Sigma-Aldrich, #F7425), anti-MYC (Sigma-Aldrich, #SAB4800447), and anti-GAPDH (Abcam, #ab9483). The membranes were then washed five times with TBST (tris-buffered saline with Tween 20), followed by incubating at room temperature for 1 h with the secondary antibodies anti-rabbit IgG (#ab6721) and anti-mouse IgG (#ab6728). After rinsing five times with TBST, the protein signals on the membrane were visualized using an ECL (enhanced chemiluminescence) kit (Sigma-Aldrich, #GERPN2016). The protein signal intensities were quantified with ImageJ software.
Immunoprecipitation (IP), mass spectrometry, and coimmunoprecipitation (Co-IP) assays
For the IP assay, equal weights (100 mg) of three sarcopenic muscle tissues were mixed and homogenized in 500 μL of RIPA buffer containing protease inhibitor. After centrifuging at 13000 × g for 15 min, 50 mL of supernatant was retained as input, while the remaining 450 mL of supernatant was immunoprecipitated with protein A agarose (Abcam, #ab193254) coated with anti-FOXM1. The purified FOXM1-associated complex was resolved on a 10% SDS-PAGE gel and then stained with a silver staining kit (Thermo Fisher Scientific, #24612). The positive protein bands were cut into ~1 mm slices and eluted with a trypsin kit (Thermo Fisher Scientific, #60109101), followed by mass spectrometry analysis. Meanwhile, the input and output proteins were subjected to western blotting to determine protein interactions. For the Co-IP assay, different combinations of plasmids, as indicated in the figures, were cotransfected into the HSMM-1 cells (1 × 10⁷). After incubation at 37°C for 48 h, the cells were lysed in 400 μL of RIPA buffer containing protease inhibitor. The samples were then centrifuged at 13000 × g for 15 min, and 40 μL of supernatant was retained as input, while the remaining 360 μL of supernatant was immunoprecipitated with anti-Flag agarose (Sigma-Aldrich, #A4596) and anti-MYC agarose (Sigma-Aldrich, #A7470). The input and output proteins were subjected to western blotting to determine protein interactions.
Chromatin immunoprecipitation (ChIP) assay
Cells (~1 × 10⁸) were rinsed twice with PBS buffer, followed by crosslinking with 1% formaldehyde/PBS (v/v) at room temperature for 15 min. The cells were then collected and subjected to ChIP procedures using a kit (Sigma-Aldrich, #17-295) following the manufacturer’s method. The purified DNA samples were used for RT-qPCR analysis with the following primers: forward: 5’-AGGCAGTCCACGCACCTTGGCC-3’; reverse: 5’-CACAGGGGACACACACATACACA-3’.
Luciferase assay
The wild-type (WT) promoter of PUMA was cloned into the pGL3 firefly vector. Using pGL3-pPUMAWT as the template, we generated its two mutants [deletions of the two potential FOXM1 binding sites (BS)], termed pGL3-pPUMA▽-830-838 (BS1) and pGL3-pPUMA▽-982-990 (BS2). These three vectors were cotransfected with Renilla into Control-KD, FOXM1-KD1, FOXM1-KD2, Control-OE and FOXM1-OE cells. After incubating at 37°C for 24 h, the cells were applied to a luciferase assay using a Dual-Luciferase Report Assay Kit (Promega, Madison, WI, USA, #E1910) following the protocol provided by the manufacturer.
Statistical analysis
Except for the microarray analysis, all other experiments were performed in triplicate independently. The data were analyzed using SPSS software (version 22) to determine the mean ± standard deviation (SD) using two-sided Student’s t tests. The significance levels are presented as P>0.05 (no significance, ns), P<0.05 (*), P<0.01 (**) and P<0.001 (***).
Results
PDA was significantly accumulated in sarcopenic muscle tissues
Previous studies in sarcopenic animal models have shown that the LCFAs, such as linoleic acid, stearic acid and vaccenic acid, accumulate in obese sarcopenic animals [6]. In a recent publication from our group, we collected 24 muscle tissues from sarcopenic patients and found that apoptotic signaling was activated [17]. To determine whether the LCFA concentrations were changed in our samples, we randomly selected 10 paired nonsarcopenic and sarcopenic tissues, extracted the LCFAs, and then measured their concentrations by GC-MS. We discovered that three LCFAs, PDA (C15), stearic acid (C17) and palmitic acid (C16), were accumulated in the sarcopenic muscle tissues compared to nonsarcopenic muscles (Figure 1A-C). Of these LCFAs, PDA showed the most significant increase (~2.3-fold increase) (Figure 1A), while stearic acid and palmitic acid increased by only ~1.5-fold in the sarcopenic tissues (Figure 1B and 1C). In addition, we also identified unchanged concentrations of three other LCFAs: nonadecanoic acid (C19), arachidic acid (C20) and behenic acid (C22) (Figure 1D-F). The chemical structures of these six LCFAs are shown in Supplementary Figure 1. The substantial differences between our current results from human sarcopenic patients and previous results from animal sarcopenic muscles suggest that the LCFA distributions found among various species and pathological conditions might differ considerably. Because PDA showed the most significant accumulation in sarcopenic muscle tissues, we further investigated its molecular effects.
Figure 1.
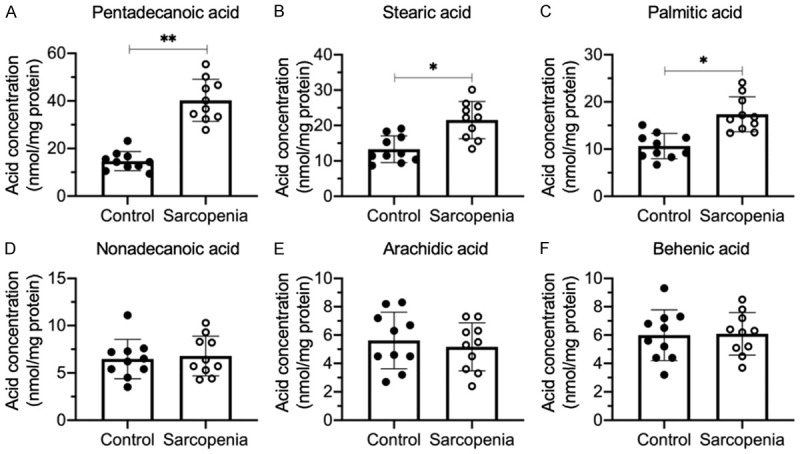
The accumulation of LCFAs in the quadriceps muscles from sarcopenia patients. LCFAs were extracted from non-sarcopenic (Control) and sarcopenic tissues (n=10 for each group). The LCFA concentrations were measured in the hexane layer mixture using GC-MS and included PDA (A), stearic acid (B), palmitic acid (C), nonadecanoic acid (D), arachidic acid (E) and behenic acid (F). Statistical significance was denoted by * for P<0.05 and *** for P<0.001.
PDA induced the expression of FOXM1 and proapoptotic genes in vitro
To determine whether PDA could alter the gene expression levels, we treated HSMM-1 cells with a series of PDA doses (0, 0.1, 0.3 and 0.6 mM) and performed a microarray analysis to examine differentially expressed genes. As presented in Figure 2A, we discovered 47 PDA-dependent genes, including 26 upregulated genes and 21 downregulated genes after PDA treatment. Among these upregulated genes, we observed the transcription factor-encoding gene FOXM1 and several proapoptotic genes, including PUMA, BAX, BAK1 and APAF1 (Figure 2A). Moreover, we also observed several proinflammatory cytokine genes, including IL-6 (interleukin 6), IL1B (interleukin 1-beta), and TNFA (tumor necrosis factor-alpha) (Figure 2A). In contrast, we found that several anti-apoptotic genes, such as BCL2, BIRC5 (baculoviral IAP repeat-containing 5) and XIAP (X-linked inhibitor of apoptosis) were downregulated after PDA treatment (Figure 2A). These results suggested that PDA might induce apoptosis and inflammation in vitro, which were recognized as two important causes of sarcopenia pathogenesis. To examine whether genes identified in the microarray results were also dysregulated in sarcopenic muscle tissues, we randomly selected five upregulated genes, including FOXM1, PUMA, APAF1, KAT5 (lysine acetyltransferase 5) and MSH6 (MutS homolog 6), and four downregulated genes, including BCL2, BIRC5, NPM1 (nucleophosmin 1) and NOD1 (nucleotide binding oligomerization domain containing 1), and performed RT-qPCR to measure their expression levels in the 24 paired muscle tissues. The expression levels of FOXM1, PUMA and APAF1 were shown to be upregulated in sarcopenic tissues compared to controls (Figure 2B-D). However, we did not observe a significant change in the expression of KAT5 and MSH6 (Figure 2E and 2F). In addition, in sarcopenic tissues, we found a significant decrease in BCL2 and BIRC5 but not in NPM1 or NOD1 compared to controls (Figure 2G-J).
Figure 2.
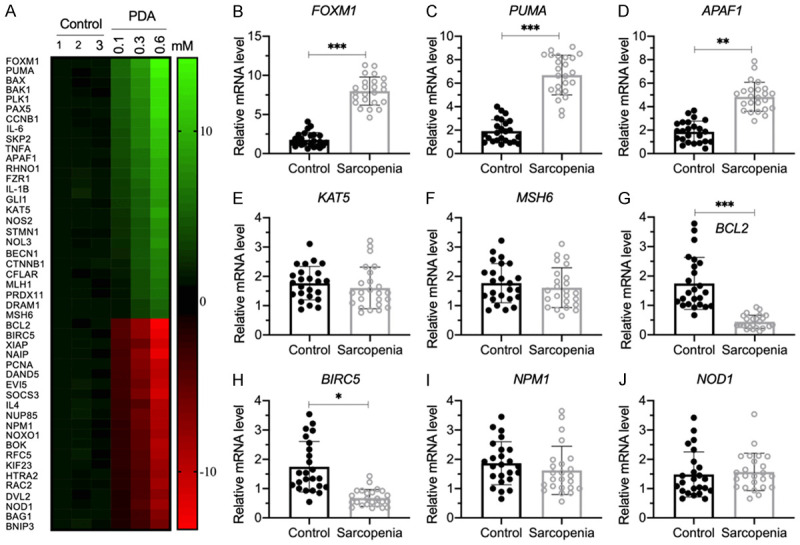
The identification of aberrantly expressed genes in PDA-treated cells and verification of nine representative gene expression levels in human sarcopenic muscles. (A) The heat map of differentially expressed genes. HSMM-1 cells were treated with different doses of PDA (0, 0.1, 0.3 and 0.6 mM) for 12 h, followed by RNA isolation and microarray analysis. The differentially expressed genes that were dose-dependent on PDA are shown. (B-J) Detection of nine representative gene expression levels by RT-qPCR. Nine representative genes, including FOXM1 (B), PUMA (C), APAF1 (D), KAT5 (E), MSH6 (F), BCL2 (G), BIRC5 (H), NPM1 (I) and NOD1 (J), were selected to examine their expression levels in the nonsarcopenic (Control) and sarcopenic tissues (n=24 for each). Statistical significance was denoted by * for P<0.05, ** for P<0.01, and *** for P<0.001.
The induction of proapoptotic genes and the reduction of anti-apoptotic genes in sarcopenic tissues suggested that apoptosis signaling pathways were activated in the pathogenesis of sarcopenia and in the PDA-treated cells. To explore which apoptosis signaling pathways were activated by PDA treatment, we examined the mRNA and protein levels of two extrinsic molecules, including FAS and TRADD, and three intrinsic molecules, including p53, BIM and PUMA, in cells treated with different doses of PDA. Our results showed that the mRNA and protein levels of FAS, TRADD, p53 and BIM were not affected by PDA treatment (Figure 3A-D, Supplementary Figure 2A and 2B). In contrast, PDA treatment resulted in a dose-dependent induction of PUMA (Figure 3E, Supplementary Figure 2A and 2B). These results suggested that the activation of PUMA after PDA treatment might be independent of p53. Moreover, we also examined the expression levels of several PUMA downstream genes in intrinsic signaling, including BCL2, BAX, BAK1 and APAF1. The RT-qPCR and western blotting results indicated that BCL2 expression was dose-dependently repressed by PDA, while the other three molecules were dose-dependently induced by PDA (Figure 3F-I, Supplementary Figure 2A and 2B). These results suggested that PDA could activate intrinsic apoptosis signaling through a p53-independent mechanism. To further confirm the activation of intrinsic apoptosis signaling, we also determined the protein levels of CASP3, -7 and -9. Consistent with the induction patterns of PUMA, BAX, BAK1 and APAF1, we also found these three caspases to be dose-dependently induced by PDA (Supplementary Figure 2A and 2C). Several studies have shown that the transcription factor FOXO3a can control the expression of PUMA in a p53-independent manner [15,16]. Additionally, FOXM1, a homolog of FOXO3a, showed an induction pattern similar to that of PUMA after PDA treatment (Figure 3E and 3J, Supplementary Figure 2A-C). These results suggested that the expression of PUMA and its downstream signaling might be controlled by FOXM1.
Figure 3.
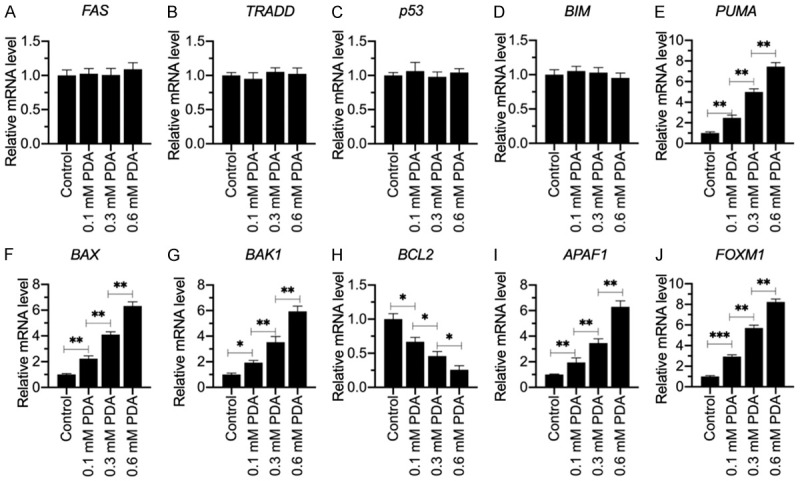
The mRNA levels of genes involved in apoptotic signaling in PDA-treated cells. Total RNA samples from cells treated with different doses of PDA (0, 0.1, 0.3 and 0.6 mM) were examined for their mRNA levels of FAS (A), TRADD (B), p53 (C), BIM (D), PUMA (E), BAX (F), BAK1 (G), BCL2 (H), APAF1 (I) and FOXM1 (J) by RT-qPCR. Statistical significance was denoted by * for P<0.05, ** for P<0.01, and *** for P<0.001.
FOXM1 regulated the expression of PUMA at the transcriptional level
To determine whether FOXM1 has a regulatory mechanism towards PUMA expression similar to that of FOXO3a, we first generated FOXM1 knockdown and overexpression cell lines and then examined the effects of FOXM1 repression and induction on PUMA expression. As shown in Supplementary Figure 3, knockdown of FOXM1 decreased the levels of PUMA mRNA and protein, while its overexpression resulted in the opposite effect. We then scanned the FOXM1 binding sites using its consensus sequence in the promoter of PUMA (Figure 4A). In a 1500-bp length of the PUMA promoter, we found two potential FOXM1 binding sites, AAATTGTGT located at -830-(-)838 (BS1) and AGATGGGGT located at -982-(-)990 (BS2) (Figure 4B). To determine the necessity of these two sites for FOXM1 binding, we constructed vectors containing the WT promoter (pGL3-pPUMAWT) and deletions of these two sites (pGL3-pPUMA▽BS1 and pGL3-pPUMA▽BS2). These plasmids were transfected into FOXM1-KD and FOXM1-OE cells. After treating with or without 0.3 mM PDA, the cells were subjected to luciferase assay. Our results showed that knockdown of FOXM1 repressed luciferase activity, but its overexpression increased luciferase activity in cells transfected with pGL3-pPUMAWT (Figure 4C). The deletion of the BS1 site on the promoter of PUMA resulted in the disappearance of luciferase signal in all cell lines (Figure 4C). In contrast, cells transfected with pGL3-pPUMA▽BS2 had the same pattern of luciferase activity as those transfected with the WT promoter (Figure 4C). These results suggested that only BS1 was necessary for FOMX1 binding to the promoter of PUMA. We also observed that PDA treatment significantly induced the luciferase activity in cells cotransfected with the pGL3-pPUMAWT and pGL3-pPUMA▽BS2 vectors (Figure 4C). These results suggested that FOXM1 could bind to the promoter of PUMA to regulate its expression, and the induction of PUMA following PDA treatment was dependent on FOXM1. In addition, we performed ChIP assays using anti-FOXM1 and IgG (negative control) to determine whether FOXM1 could directly bind to the promoter of PUMA. Our results indicated that FOXM1 binding to the promoter of PUMA was significantly repressed following FOXM1 knockdown but was markedly increased upon FOXM1 overexpression (Figure 4D). PDA treatment intensified these effects and increased the occupancy of FOXM1 on the promoter of PUMA (Figure 4D).
Figure 4.
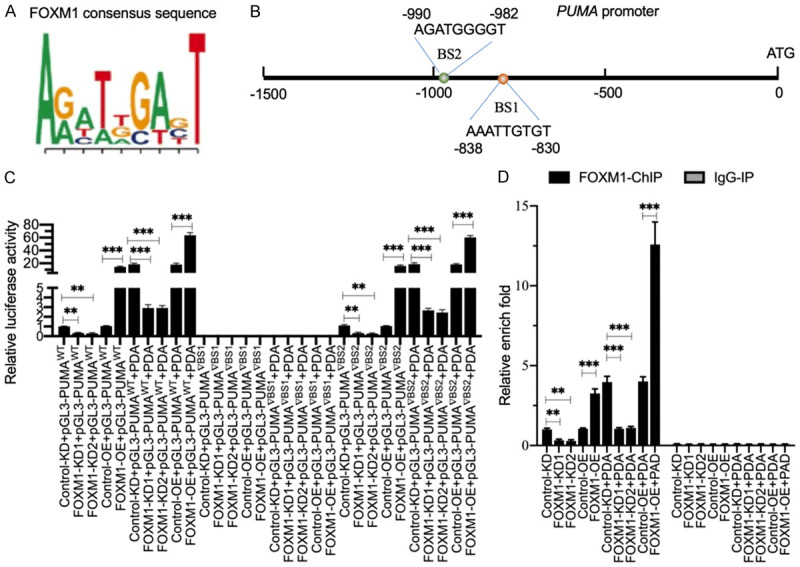
FOXM1 docked onto the promoter of PUMA at the BS1 site to regulate its expression. A. The consensus sequence of FOXM1. B. The promoter of PUMA contained two putative FOXM1 binding sites. A 1500-bp length of the PUMA promoter was assessed for FOXM1 binding sites. Two binding sites (BS1 and BS2) were identified; their positions were shown. C. The relative luciferase activities. Three plasmids, pGL4.3-pPUMAWT, pGL4.3-pPUMA▽BS1 and pGL4.3-pPUMA▽BS2, were cotransfected with Renilla into Control-KD, FOXM1-KD1, FOXM1-KD2, Control-OE and FOXM11-OE cells. The transfected cells were cultured for an additional 24 h and then subjected to a dual-luciferase reporter assay. The relative luciferase activities were determined by normalizing the firefly luciferase activities to their corresponding Renilla activities. **P<0.01 and ***P<0.001. D. The occupancy of FOXM1 on the promoter of PUMA. The ChIP assays were performed in Control-KD, FOXM1-KD1, FOXM1-KD2, Control-OE and FOXM1-OE cells using anti-FOXM1 and IgG (negative control). The purified input and output DNA samples were subjected to RT-qPCR analysis to examine the occupancy of FOXM1 on the promoter of PUMA. **P<0.01 and ***P<0.001.
PDA failed to activate apoptosis signaling in FOXM1-KD cells
The above results showed that PDA dose-dependently induced intrinsic molecules (see Figure 3 and Supplementary Figure 2). To determine whether their activation was dependent on FOXM1, we treated Control-KD and FOXM1-KD cells with 0.3 mM PDA and then examined the protein levels of intrinsic molecules. As shown in Figure 5A and 5B, FOXM1 knockdown did not change the protein levels of FAS, TRADD, p53 or BIM. By contrast, FOXM1 downregulation resulted in a significant reduction in proapoptotic proteins, including PUMA, BAX, BAK1 and APAF1, and induced the anti-apoptotic protein BCL2. After PDA treatment, these proapoptotic proteins were induced to levels comparable to those in Control-KD cells without PDA treatment, but the levels were much lower than those of Control-KD cells treated with PDA (Figure 5A and 5B). Importantly, PDA failed to activate CASP3, -7 and -9 in FOXM1-KD cells (Figure 5A and 5C), suggesting that the activation of apoptosis signaling by PDA treatment is dependent on FOXM1.
Figure 5.
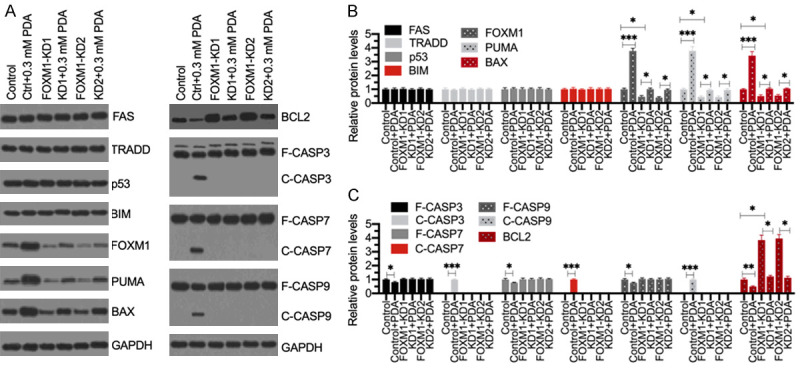
Knockdown of FOXM1 failed to active apoptosis signaling following PDA treatment. (A) Western blotting results. The Control-KD (Control), FOXM1-KD1 and FOXM1-KD2 cells were treated with or without 0.3 mM PDA for 12 h, followed by total protein extraction. Western blotting analyses were performed to detect the protein levels of FAS, TRADD, p53, BIM, FOXM1, PUMA, BAX, BCL2, CASP3, CASP7, CASP9, and GAPDH (loading control). (B and C) The normalized protein levels. The protein signals as shown in (A) were quantified using ImageJ software and then normalized to their corresponding GAPDH levels. **P<0.05, **P<0.01 and ***P<0.001.
FOXM1 assembled a transcriptional complex with NCOR1 to mediate the expression of PUMA
Transcription factors typically assemble transcriptional complexes with other regulatory proteins, such as corepressors and coactivators [18]. To investigate the transcriptional complex members associated with FOXM1, we performed an IP assay with the homogenized mixture of three sarcopenic muscle tissues using anti-FOXM1 antibody. The purified FOXM1-associated complex was subjected to mass spectrometry analysis. We obtained 53 potential candidate proteins, one of which was the corepressor NCOR1 (Supplementary Table 2). We then examined the mRNA and protein levels of NCOR1 in the 24 paired muscle tissues. The level of NCOR1 mRNA was not significantly changed in the sarcopenic tissues compared to controls (Figure 6A). However, NCOR1 protein was dramatically decreased in the sarcopenic tissues (Figure 6B). Owing to the important role of NCOR1 in coordinating transcription factors to regulate gene expression, we next sought to determine whether NCOR1 could form a complex with FOXM1. First, we examined the input and output proteins used for mass spectrometry analysis. The western blotting results showed that FOXM1 could pull down NCOR1 in vivo (Figure 6C). Second, we performed an IP assay with the same homogenized mixture with anti-NCOR1 antibody, and we also found that NCOR1 could pull down FOXM1 in vivo (Figure 6D). Finally, we investigated the direct interaction between FOXM1 and NCOR1 in cells cotransfected with pCDNA3-2 × Flag-FOXM1 and pCDNA3-6 × MYC-NCOR1. The Co-IP assay results showed that FOXM1 could directly interact with NCOR1 (Figure 6E).
Figure 6.
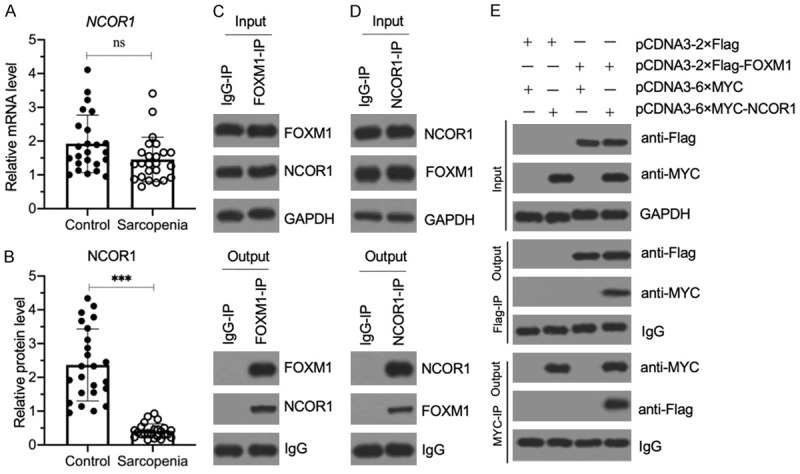
NCOR1 assembled a transcriptional complex with FOXM1. (A) The relative NCOR1 mRNA level in sarcopenic muscles. The same RNA samples as used in Figure 2B were applied to RT-qPCR analyses to examine the NCOR1 mRNA level. P>0.05 (ns indicates no significance). (B) The relative NCOR1 protein level in sarcopenic muscles. The same muscle tissues as in (A) were used to extract total proteins, and the cell extracts were subjected to immunoblotting to examine NCOR1 and GAPDH (loading control) protein. The relative NCOR1 protein level was determined by normalizing to its corresponding GAPDH level. ***P<0.001. (C and D) FOXM1 and NCOR1 could pull down each other in vivo. Equal weights of three sarcopenic tissues were mixed together, and their homogenates were subjected to IP assays with IgG, anti-FOXM1 (C) and anti-NCOR1 (D), respectively. The input and output proteins were examined for their FOXM1 and NCOR1 protein levels by western blotting. (E) FOXM1 directly interacted with NCOR1 in vitro. The HSMM-1 cells were cotransfected with the plasmid combinations shown in the figure. After culturing for 48 h, the cells were used for Co-IP assays with Flag-agarose and MYC-agarose. The input and output proteins were examined by western blot for their protein levels using anti-Flag and anti-MYC antibodies.
NCOR1 negatively regulated the expression of PUMA
Since NCOR1 is a corepressor and our results in Figure 6B show that NCOR1 protein was significantly decreased in sarcopenic muscle tissues, we speculated that NCOR1 might negatively control the expression of PUMA. To verify this hypothesis, we first generated NCOR1 knockdown and overexpression cell lines (Figure 7A-C) and then measured PUMA mRNA levels in these cells. As expected, the RT-qPCR results showed that knockdown of NCOR1 caused a significant increase of PUMA mRNA, while the overexpression of NCOR1 resulted in PUMA downregulation (Figure 7D). We then performed a ChIP assay in PUMA-KD and PUMA-OE cells using anti-NCOR1, anti-FOXM1 and IgG to determine the occupancies of NCOR1 and FOXM1 on the promoter of PUMA. The occupancy of NCOR1 on the promoter of PUMA was similar to its mRNA expression level patterns (Figure 7E). In contrast, we found that the occupancy of FOXM1 was significantly increased in NCOR1-KD cells but dramatically decreased in NCOR1-OE cells (Figure 7E). These results suggested that NCOR1 functions as a repressor of FOXM1 to regulate PUMA expression. In addition, we examined the protein levels of PUMA, BCL2, BAX, APAF1, CASP3, CASP7 and CASP9 in NCOR1-KD and NCOR1-OE cells. The immunoblot results indicated that NCOR1 knockdown resulted in the significant accumulation of proapoptotic proteins but reduced the level of BCL2 (Figure 7F and Supplementary Figure 4). The three caspases were also activated in NCOR1-KD cells, suggesting that knockdown of NCOR1 could activate apoptosis signaling.
Figure 7.
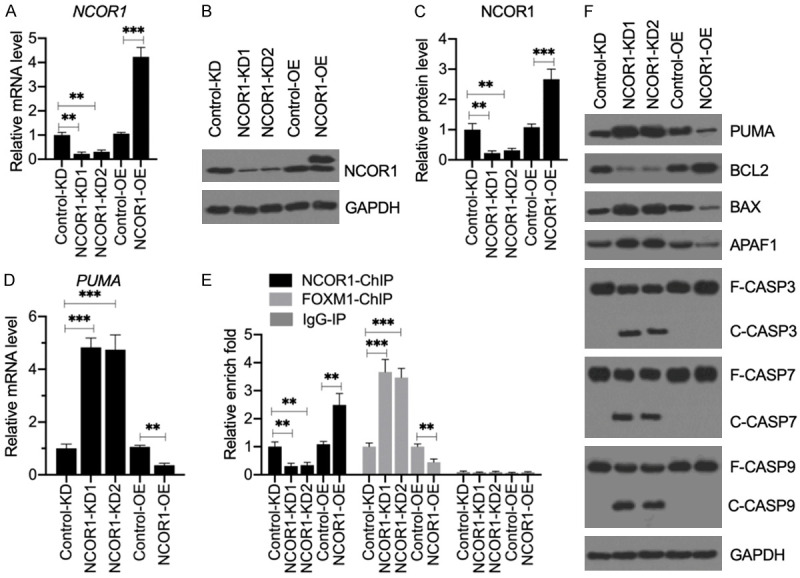
Knockdown of NCOR1 activated apoptosis signaling without PDA treatment. (A) The relative mRNA level of NCOR1. Total RNA from Control-KD, NCRO1-KD1, NCOR1-KD2, Control-OE and NCOR1-OE cells was applied to RT-qPCR analysis to examine NCOR1. mRNA levels **P<0.01 and ***P<0.001. (B and C) NCOR1 protein levels. Total cell extracts from the cells used in (A) were applied to western blotting to examine the protein levels of NCOR1 and GAPDH (loading control) (B). The NCOR1 protein signals were quantified using ImageJ software and normalized to their corresponding GAPDH levels (C). **P<0.01 and ***P<0.001. (D) The relative PUMA mRNA level. The same RNA samples as used in (A) were subjected to RT-qPCR analysis to examine the PUMA expression. **P<0.01 and ***P<0.001. (E) The occupancy of NCOR1 and FOXM1 on the promoter of PUMA. ChIP assays were performed in Control-KD, NCOR1-KD1, NCOR1-KD2, Control-OE and NCOR1-OE cells using anti-NCOR1, anti-FOXM1 and IgG (negative control). The purified input and output DNA samples were subjected to RT-qPCR analysis to examine the occupancy of NCOR1 and FOXM1 on the promoter of PUMA. **P<0.01 and ***P<0.001. (F) The effects of NCOR1 knockdown on apoptotic proteins. Cells used in (A) were subjected to western blotting to examine the protein levels of PUMA, BCL2, BAX, APAF1, CASP3, CASP7, CASP9, and GAPDH (loading control).
PDA activated AKT1 (AKT serine/threonine kinase 1) to phosphorylate NCOR1
The above result in Figure 6B indicated that the NCOR1 protein level was decreased in sarcopenic muscle tissues. We next aimed to explore whether its decrease was controlled by PDA. For this purpose, we first examined the NCOR1 protein level in PDA-treated cells. As shown in Figure 8A and 8B, we observed a dose-dependent decrease in the NCOR1 protein level after the PDA treatment. In addition, we examined the occupancies of NCOR1 and FOXM1 on the promoter of PUMA after treatment with the different PDA doses. The ChIP results showed that the NCOR1 occupancy gradually decreased with increasing PDA concentration, and this trend was reversed for the FOXM1 occupancy (Figure 8C). Interestingly, we observed a larger size of NCOR1 in the PDA-treated cells compared to the untreated cells (Figure 8A). The amount of this larger NCOR1 protein gradually increased with increasing PDA dose (Figure 8A). Given that a previous study showed that NCOR1 can be phosphorylated by the kinase AKT1 [19], we speculated that this larger size band was the phosphorylated NCOR1. To verify this possibility, we cultured cells in two doses of PDA (0.1 and 0.3 mM), followed by treatment with alkaline phosphatase. The western blotting results indicated that alkaline phosphatase eliminated the larger size of NCOR1 (Figure 8D), suggesting it to be phosphorylated NCOR1. Moreover, we also examined PUMA, APAF1 and CASP3/7/9 in these cells. The immunoblot results showed that the induction of PUMA and APAF1 and the activation of caspases could all be eliminated by alkaline phosphatase (Figure 8D and Supplementary Figure 5). These results suggested that AKT1-mediated phosphorylation of NCOR1 was required for the activation of apoptosis signaling. To further solidify this conclusion, we first examined the protein level of AKT1 in cells treated with different dosages of PDA. We found that AKT1 was dose-dependently increased following PDA treatments (Figure 8E). Next, we generated an AKT1-KD cell line and examined whether PDA could still induce apoptosis in AKT-KD cells. Following 0.3 mM PDA treatment, AKT1 protein could be induced to a level comparable to that of the Control-KD cells without PDA treatment, but it was much lower than that of the Control-KD cells induced by PDA (Figure 8F and Supplementary Figure 6). Interestingly, the NCOR1 protein level was not changed in PDA-treated AKT1-KD cells compared to untreated cells (Figure 8F and Supplementary Figure 6). Importantly, the proapoptotic proteins PUMA, APAF1 and caspases were not activated by PDA in the AKT1-KD cells (Figure 8F and Supplementary Figure 6). Using these cells, we also performed ChIP assays with anti-FOXM1, anti-NCOR1 and IgG. The occupancies of FOXM1 and NCOR1 were unchanged in the PDA-treated AKT1-KD cells compared to untreated cells (Supplementary Figure 7). These results supported our conclusion that the failed phosphorylation of NCOR1 after PDA treatment resulted in no activation of apoptosis signaling.
Figure 8.
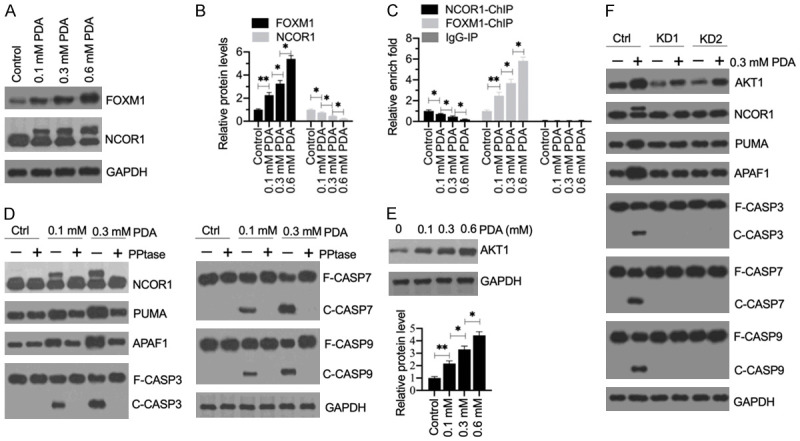
The phosphorylation of NCOR1 mediated by AKT1 was required for the activation of apoptosis signaling. (A) The protein levels of FOXM1 and NCOR1 in PDA-treated cells. Total cell extracts from cells treated with different doses of PDA (0, 0.1, 0.3 and 0.6 mM) were subjected to western blotting to examine the protein levels of FOXM1, NCOR1, and GAPDH (loading control). (B) Quantification of protein band signals. The protein band signals in (A) were quantified using ImageJ software. *P<0.05 and **P<0.01. (C) The occupancy of NCOR1 and FOXM1 on the promoter of PUMA. ChIP assays were performed in the cells used in (A) with anti-NCOR1, anti-FOXM1 and IgG (negative control). The purified input and output DNA samples were subjected to RT-qPCR analysis to examine the occupancy of NCOR1 and FOXM1 on the promoter of PUMA. **P<0.05 and **P<0.01. (D) The effect of phosphatase (PPtase) on NCOR1 and apoptotic proteins. HSMM-1 cells were treated with or without 0.1 and 0.3 mM PDA for 12 h, followed by treating with or without PPtase for 2 h. Total protein extracts were subjected to western blotting to examine the protein levels of NCOR1, PUMA, APAF1, CASP3, CASP7, CASP9, and GAPDH (loading control). (E) The protein levels of AKT1 in PDA-treated cells. The same protein samples as used in (A) were subjected to western blotting to examine the protein levels of AKT1 and GAPDH (loading control). The protein signals were quantified. (F) The effect of AKT1 knockdown on apoptotic proteins. Control-KD (Ctrl), AKT1-KD1 (KD1) and AKT1-KD2 (KD2) cells were treated with or without 0.3 mM PDA for 12 h. Total protein extracts were subjected to western blotting to examine the protein levels of AKT1, NCOR1, PUMA, APAF1, CASP3, CASP7, CASP9, and GAPDH (loading control).
Discussion
Apoptosis is an important process that leads to muscle degeneration in the pathogenesis of sarcopenia [17]. A variety of exogenous and endogenous stimuli, such as growth factor deprivation, DNA damage, viral invasion, ischemia, and oxidative stress, can trigger apoptosis [11,20]. LCFAs mainly function in two aspects: as structural components of cellular membranes and as energy store in triacylglycerols [21,22]. In the present study, we found that the aberrant accumulation of LCFAs might be associated with sarcopenia pathogenesis. Our study investigated the in vitro effects of PDA, which is the most highly accumulated LCFA in the muscle tissue of sarcopenia patients. We found that PDA could induce AKT1, which phosphorylated the transcription corepressor NCOR1, causing the disassociation of the NCOR1-FOXM1 complex. The released FOXM1 docked onto the promoter of PUMA and activated its expression. The induction of PUMA triggered its downstream apoptotic signaling and activated the caspase cascades, leading to cell apoptosis, and eventually causing sarcopenia pathogenesis (Figure 9).
Figure 9.
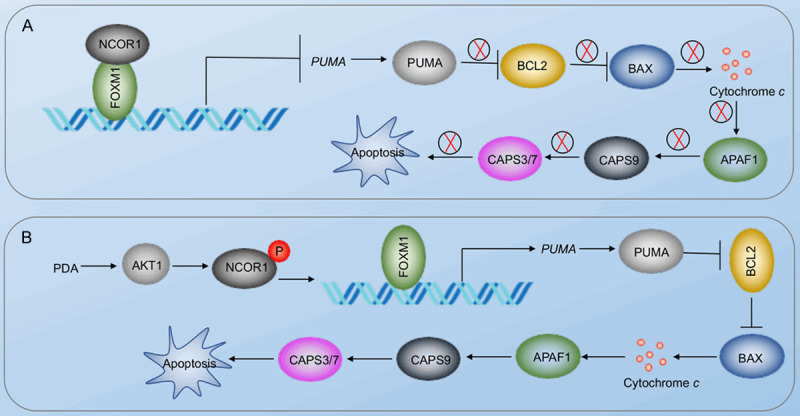
A schematic diagram of PDA-activated apoptosis signaling in the pathogenesis of sarcopenia. A. Schematic diagram of the NCOR1-FOXM1 transcriptional complex in non-sarcopenic muscles. The NCOR1-FOXM1 complex docks on the promoter of PUMA, and NCOR1 functions as a repressor to inhibit the expression of PUMA. The repression of PUMA inhibits its downstream molecules, such as BAX, APAF1, and CASP3/7/9. B. Schematic diagram of PDA-mediated signaling. The accumulation of PDA activates AKT1, causing the phosphorylation of NCOR1. The phosphorylated NCOR1 fails to assemble a complex with FOXM1, leading to the upregulation of PUMA. The induction of PUMA initiates its downstream apoptosis signaling, leading to cell apoptosis and the pathogenesis of sarcopenia.
Aging can induce changes in fat metabolism, causing the increased deposition of fat in nonadipose tissues, including skeletal muscles [23,24]. Several interesting studies have shown that the increase of intramuscular lipid may result in lipotoxicity, compromising muscle proteins and inducing inflammation [6-8]. LCFAs, such as palmitic acid and oleic acid, have been reported to induce apoptosis in a previous study [6]. In astrocytes, palmitic acid can induce autophagy and cause the degradation of Cav-1, an important protein that controls astrocyte survival [10]. Feeding a high-fat diet causes Cav-1 degradation and leads to apoptosis and inflammation in the hippocampal astrocytes of rats [10]. In some cancer types, oleic acid represses the expression of cyclin D1 and BCL2 but activates the p53-dependent apoptotic signaling pathway [25-27]. However, remains unknown whether LCFAs contribute to apoptosis in the pathogenesis of sarcopenia. We found three LCFAs, PDA, stearic acid and palmitic acid, to be significantly accumulated in muscle tissue samples from sarcopenia patients (Figure 1). Although we only investigated the role of PDA in sarcopenia pathogenesis, we cannot exclude the other two LCFAs from also contributing to this process. Our findings are considerably different from a previous report that showed linoleic acid, stearic acid, and vaccenic acid to be accumulated in the quadriceps muscle from rats that were fed a high-fat diet [6]. These differences suggest that the metabolism and deposition of LCFAs in humans and rats may be quite distinct due to the different diets. In addition, our microarray results showed that several proinflammatory cytokine genes (IL-1B, IL-6 and TNFA) were dose-dependently induced in PDA-treated cells (Figure 2A); however, we did not investigate whether AKT1-mediated signaling contributed to their induction. Given that inflammation is also an important contributor to sarcopenia pathogenesis, future studies should investigate the molecular mechanism by which PDA induces the expression of proinflammatory cytokine genes. This information would help clarify how PDA accumulation contributes to sarcopenia pathogenesis.
Several studies have shown that the autophagic degradation of FOXO3a, a homolog of FOXM1, can regulate PUMA expression to mediate apoptosis in different cancers [15,16]. In the current study, we found the significant induction of FOXM1, but not of FOXO3a, in PDA-treated cells. Unlike previous studies, we found that NCOR1 and FOXM1 form a transcriptional complex to regulate PUMA expression. In normal cells, unphosphorylated NCOR1 can negatively regulate FOXM1-mediated transcription. When PDA accumulates in sarcopenic muscles, it can activate AKT1 and cause NCOR1 to become phosphorylated. This results in the disassociation of the NCOR1-FOXM1 complex, leading to the activation of PUMA and its downstream signals. Our research further elucidates the regulatory mechanisms of the FOX family proteins. To our knowledge, this is the first report showing that FOXM1 and other FOX family members have this unique mode of regulation. Although we clearly demonstrated this signaling in vitro, future in vivo work is required to characterize the effects of PDA on AK1/NCOR1/FOXM1-mediated apoptotic signaling in animal models.
In conclusion, we revealed that the accumulation of PDA in sarcopenic muscle tissues can cause apoptosis. In vitro analyses demonstrated that PDA activates AKT1, which phosphorylates NCOR1, causing the release of FOXM1 from the NCOR1-FOXM1 transcriptional complex. FOXM1 induces the expression of PUMA through a p53-independent mechanism. The activation of PUMA initiates its downstream apoptotic signaling. The detailed description of this signaling suggests that decreasing the intake of PDA-containing food and blocking AKT1 kinase activity may be two potential strategies to improve sarcopenic outcomes.
Acknowledgements
We would like to thank muscle tissue donors for this study. This work was supported by a grant from the Department of Science and Technology, Jiangxi Province, China (No. 20161BBG70131).
Disclosure of conflict of interest
None.
Supporting Information
References
- 1.Santilli V, Bernetti A, Mangone M, Paoloni M. Clinical definition of sarcopenia. Clin Cases Miner Bone Metab. 2014;11:177–180. [PMC free article] [PubMed] [Google Scholar]
- 2.Ogawa S, Yakabe M, Akishita M. Age-related sarcopenia and its pathophysiological bases. Inflamm Regen. 2016;36:17. doi: 10.1186/s41232-016-0022-5. [DOI] [PMC free article] [PubMed] [Google Scholar]
- 3.Kalyani RR, Corriere M, Ferrucci L. Age-related and disease-related muscle loss: the effect of diabetes, obesity, and other diseases. Lancet Diabetes Endocrinol. 2014;2:819–829. doi: 10.1016/S2213-8587(14)70034-8. [DOI] [PMC free article] [PubMed] [Google Scholar]
- 4.Walewski JL, Ge F, Gagner M, Inabnet WB, Pomp A, Branch AD, Berk PD. Adipocyte accumulation of long-chain fatty acids in obesity is multifactorial, resulting from increased fatty acid uptake and decreased activity of genes involved in fat utilization. Obes Surg. 2010;20:93–107. doi: 10.1007/s11695-009-0002-9. [DOI] [PMC free article] [PubMed] [Google Scholar]
- 5.Walle P, Takkunen M, Mannisto V, Vaittinen M, Kakela P, Agren J, Schwab U, Lindstrom J, Tuomilehto J, Uusitupa M, Pihlajamaki J. Alterations in fatty acid metabolism in response to obesity surgery combined with dietary counseling. Nutr Diabetes. 2017;7:e285. doi: 10.1038/nutd.2017.33. [DOI] [PMC free article] [PubMed] [Google Scholar]
- 6.Laurentius T, Kob R, Fellner C, Nourbakhsh M, Bertsch T, Sieber CC, Bollheimer LC. Long-chain fatty acids and inflammatory markers coaccumulate in the skeletal muscle of sarcopenic old rats. Dis Markers. 2019;2019:9140789. doi: 10.1155/2019/9140789. [DOI] [PMC free article] [PubMed] [Google Scholar]
- 7.Kob R, Bollheimer LC, Bertsch T, Fellner C, Djukic M, Sieber CC, Fischer BE. Sarcopenic obesity: molecular clues to a better understanding of its pathogenesis? Biogerontology. 2015;16:15–29. doi: 10.1007/s10522-014-9539-7. [DOI] [PubMed] [Google Scholar]
- 8.Collins KH, Paul HA, Hart DA, Reimer RA, Smith IC, Rios JL, Seerattan RA, Herzog W. A high-fat high-sucrose diet rapidly alters muscle integrity, inflammation and gut microbiota in male rats. Sci Rep. 2016;6:37278. doi: 10.1038/srep37278. [DOI] [PMC free article] [PubMed] [Google Scholar]
- 9.Lee JY, Sohn KH, Rhee SH, Hwang D. Saturated fatty acids, but not unsaturated fatty acids, induce the expression of cyclooxygenase-2 mediated through Toll-like receptor 4. J Biol Chem. 2001;276:16683–16689. doi: 10.1074/jbc.M011695200. [DOI] [PubMed] [Google Scholar]
- 10.Chen Z, Nie SD, Qu ML, Zhou D, Wu LY, Shi XJ, Ma LR, Li X, Zhou SL, Wang S, Wu J. The autophagic degradation of Cav-1 contributes to PA-induced apoptosis and inflammation of astrocytes. Cell Death Dis. 2018;9:771. doi: 10.1038/s41419-018-0795-3. [DOI] [PMC free article] [PubMed] [Google Scholar]
- 11.Elmore S. Apoptosis: a review of programmed cell death. Toxicol Pathol. 2007;35:495–516. doi: 10.1080/01926230701320337. [DOI] [PMC free article] [PubMed] [Google Scholar]
- 12.Zhang F, Zhao X, Shen H, Zhang C. Molecular mechanisms of cell death in intervertebral disc degeneration (review) Int J Mol Med. 2016;37:1439–1448. doi: 10.3892/ijmm.2016.2573. [DOI] [PMC free article] [PubMed] [Google Scholar]
- 13.Yuan Z, Cao K, Lin C, Li L, Liu HY, Zhao XY, Liu L, Deng HX, Li J, Nie CL, Wei YQ. The p53 upregulated modulator of apoptosis (PUMA) chemosensitizes intrinsically resistant ovarian cancer cells to cisplatin by lowering the threshold set by Bcl-x(L) and Mcl-1. Mol Med. 2011;17:1262–1274. doi: 10.2119/molmed.2011.00176. [DOI] [PMC free article] [PubMed] [Google Scholar]
- 14.You H, Pellegrini M, Tsuchihara K, Yamamoto K, Hacker G, Erlacher M, Villunger A, Mak TW. FOXO3a-dependent regulation of Puma in response to cytokine/growth factor withdrawal. J Exp Med. 2006;203:1657–1663. doi: 10.1084/jem.20060353. [DOI] [PMC free article] [PubMed] [Google Scholar]
- 15.Fitzwalter BE, Towers CG, Sullivan KD, Andrysik Z, Hoh M, Ludwig M, O’Prey J, Ryan KM, Espinosa JM, Morgan MJ, Thorburn A. Autophagy inhibition mediates apoptosis sensitization in cancer therapy by relieving FOXO3a turnover. Dev Cell. 2018;44:555–565. e3. doi: 10.1016/j.devcel.2018.02.014. [DOI] [PMC free article] [PubMed] [Google Scholar]
- 16.Jiang K, Zhang C, Yu B, Chen B, Liu Z, Hou C, Wang F, Shen HX, Chen Z. Autophagic degradation of FOXO3a represses the expression of PUMA to block cell apoptosis in cisplatin-resistant osteosarcoma cells. Am J Cancer Res. 2017;7:1407–1422. [PMC free article] [PubMed] [Google Scholar]
- 17.Chen FX, Shen Y, Liu Y, Wang HF, Liang CY, Luo M. Inflammation-dependent downregulation of miR-532-3p mediates apoptotic signaling in human sarcopenia through targeting BAK1. Int J Biol Sci. 2020;16:1481–1494. doi: 10.7150/ijbs.41641. [DOI] [PMC free article] [PubMed] [Google Scholar]
- 18.Bulynko YA, O’Malley BW. Nuclear receptor coactivators: structural and functional biochemistry. Biochemistry. 2011;50:313–328. doi: 10.1021/bi101762x. [DOI] [PMC free article] [PubMed] [Google Scholar]
- 19.Jo YS, Ryu D, Maida A, Wang X, Evans RM, Schoonjans K, Auwerx J. Phosphorylation of the nuclear receptor corepressor 1 by protein kinase B switches its corepressor targets in the liver in mice. Hepatology. 2015;62:1606–1618. doi: 10.1002/hep.27907. [DOI] [PMC free article] [PubMed] [Google Scholar]
- 20.Redza-Dutordoir M, Averill-Bates DA. Activation of apoptosis signalling pathways by reactive oxygen species. Biochim Biophys Acta. 2016;1863:2977–2992. doi: 10.1016/j.bbamcr.2016.09.012. [DOI] [PubMed] [Google Scholar]
- 21.Schonfeld P, Wojtczak L. Short- and medium-chain fatty acids in energy metabolism: the cellular perspective. J Lipid Res. 2016;57:943–954. doi: 10.1194/jlr.R067629. [DOI] [PMC free article] [PubMed] [Google Scholar]
- 22.de Carvalho CCCR, Caramujo MJ. The various roles of fatty acids. Molecules. 2018;23:2583. doi: 10.3390/molecules23102583. [DOI] [PMC free article] [PubMed] [Google Scholar]
- 23.Carter CS, Justice JN, Thompson L. Lipotoxicity, aging, and muscle contractility: does fiber type matter? Geroscience. 2019;41:297–308. doi: 10.1007/s11357-019-00077-z. [DOI] [PMC free article] [PubMed] [Google Scholar]
- 24.Tchkonia T, Morbeck DE, Von Zglinicki T, Van Deursen J, Lustgarten J, Scrable H, Khosla S, Jensen MD, Kirkland JL. Fat tissue, aging, and cellular senescence. Aging Cell. 2010;9:667–684. doi: 10.1111/j.1474-9726.2010.00608.x. [DOI] [PMC free article] [PubMed] [Google Scholar]
- 25.Jiang L, Wang W, He Q, Wu Y, Lu Z, Sun J, Liu Z, Shao Y, Wang A. Oleic acid induces apoptosis and autophagy in the treatment of Tongue Squamous cell carcinomas. Sci Rep. 2017;7:11277. doi: 10.1038/s41598-017-11842-5. [DOI] [PMC free article] [PubMed] [Google Scholar]
- 26.Ma S, Chen F, Ye X, Dong Y, Xue Y, Xu H, Zhang W, Song S, Ai L, Zhang N, Pan W. Intravenous microemulsion of docetaxel containing an anti-tumor synergistic ingredient (brucea javanica oil): formulation and pharmacokinetics. Int J Nanomedicine. 2013;8:4045–4052. doi: 10.2147/IJN.S47956. [DOI] [PMC free article] [PubMed] [Google Scholar]
- 27.Shaikh IA, Brown I, Wahle KW, Heys SD. Enhancing cytotoxic therapies for breast and prostate cancers with polyunsaturated fatty acids. Nutr Cancer. 2010;62:284–296. doi: 10.1080/01635580903407189. [DOI] [PubMed] [Google Scholar]
Associated Data
This section collects any data citations, data availability statements, or supplementary materials included in this article.


