

Abstract
Purpose: Circular RNAs (circRNAs) have been reported to act as important regulators in pancreatic cancer. Abnormal expression of circRNAs in pancreatic cancer cells (PCCs) can promote the development of pancreatic cancer; however, the role of circRNAs in cancer-associated pancreatic stellate cells (CaPSCs) remains unclear. Patients and Methods: In this study, we isolated CaPSCs from pancreatic cancer tissues from 5 pancreatic cancer patients and NaPSCs from normal pancreatic tissue from 5 patients with benign pancreatic disease. After the PSCs were co-cultured with the pancreatic cancer cell line PANC-1, a CCK-8 assay was used to detect PANC-1 proliferation ability, and CaPSCs1, which had the strongest promoting effect on PANC-1 proliferation, and NaPSCs1, which had the weakest effect, were screened. Then, the circRNA, microRNA (miRNA) and mRNA profiles between CaPSCs1 and NaPSCs1 were compared by RNA-seq. The candidate circRNA/miRNA/target protein axis was selected using bioinformatics analysis. circRNAs were silenced and miRNAs were overexpressed in CaPSCs1, and the expression of circRNAs, miRNAs and target proteins were detected by qRT-PCR and Western blot, respectively. At the same time, CCK8, wound healing, and Transwell assays were used to detect the proliferation, migration and invasion of PANC-1 cells in the different co-culture groups. Moreover, a tumour xenograft model was used to observe the tumorigenic ability of PANC-1 cells in different co-culture groups. Finally, immunohistochemistry was used to detect the expression of target proteins in PDAC tissues, and the clinicopathological features and prognosis were analysed. Results: The expression of the differentially expressed RNAs identified by RNA-seq was verified by qRT-PCR, and the chr7:154954255-154998784+/miR-4459/KIAA0513 axis was selected from the candidate targets. Functional studies of PANC-1 cells after co-culture with chr7:154954255-154998784+-silenced CaPSCs1 showed that the proliferation, invasion and metastasis of PANC-1 cells decreased. Moreover, after chr7:154954255-154998784+ was silenced, the expression of miR-4459 in CaPSCs1 increased, and the expression of KIAA0513 decreased. When PANC-1 cells were co-cultured with CaPSCs1 with miR-4459 overexpression, they showed an increased ability to proliferate, invade and metastasize. Additionally, when miR-4459 was overexpressed in CaPSCs1, the expression of chr7:154954255-154998784+ and KIAA0513 decreased. Animal experiments revealed that silencing chr7:154954255-154998784+ in CaPSCs1 inhibited tumour growth in nude mice inoculated with CaPSCs1+PANC-1 cells. Finally, we performed immunohistochemistry and a prognostic analysis of KIAA0513 expression in paraffin tissue samples from patients with pancreatic cancer and found that high expression of KIAA0513 was associated with more aggressive clinicopathological factors. Furthermore, patients with high expression of KIAA0513 had worse disease-free survival (DFS) and overall survival (OS). Conclusion: Chr7:154954255-154998784+ may promote the development of pancreatic cancer through the miR-4459/KIAA0513 axis in CaPSCs and may be an important therapeutic target for patients with pancreatic cancer in the future.
Keywords: Cancer-associated pancreatic stellate cells, circular RNAs, pancreatic cancer, prognosis
Introduction
Pancreatic ductal adenocarcinoma (PDAC) is a digestive tract tumour with a high degree of malignancy, poor prognosis, and difficult diagnosis and treatment. Its morbidity and mortality are increasing every year [1-4]. At present, early diagnosis and radical surgery are the only options for the long-term cure of pancreatic cancer patients. Unfortunately, most patients have severe tumour infiltration or distant metastasis upon diagnosis, thus missing the optimal window for radical surgery. Only chemotherapy or radiotherapy are available, although neither of these two adjuvant therapies can achieve ideal therapeutic effects.
A prominent characteristic of pancreatic cancer is interstitial fibrosis. Increasing clinical evidence indicates that interstitial fibrosis plays a key role in the malignant progression of pancreatic cancer and that pancreatic stellate cells (PSCs) play an important role in the fibrosis of pancreatic cancer [5,6]. PSCs are the main components that contribute to interstitial fibrosis around pancreatic cancer cells (PCCs) and are an important part of the pancreatic cancer tumour microenvironment. They provide tumour cells with a drug-resistant microenvironment, prevent chemotherapy drugs from reaching the pancreas and inhibit the killing effect of chemotherapy drugs on PCCs [7,8]. Circular RNA (circRNA) are a novel non-coding RNA that differs from linear RNA, widely exists in various biological cells, functions to regulate gene expression, and is characterized by its structural stability and tissue-specific expression. These properties have resulted in circRNAs becoming the latest research hotspot in the RNA field in recent years [9-11]. Unlike linear RNA, circRNA forms a unique covalently closed loop structure, which is characterized by its high GC content, stability, diversity and conservatism, and plays an essential role in the RNA interaction network. There is literature [12-14] on the interaction between PSCs and PCCs, but studies on whether PSCs are targeted to regulate pancreatic cancer tumour progression through circRNA-microRNA (miRNA) interaction networks have not been reported.
In this study, PSCs were isolated from 5 pancreatic cancer tissues and 5 normal pancreatic tissues from humans and were co-cultured with the pancreatic cancer cell line PANC-1 to detect the proliferative ability of PANC-1 cells. Cancer-associated PSCs (CaPSCs1) with the greatest effect on the proliferation of PANC-1 cells and normal-associated PSCs (NaPSCs1) with the least effect were selected. Sequencing analysis was performed with RNA-seq technology to screen for differentially expressed RNAs. By overlapping the predicted results of the bioinformatics analysis and the results of the miRNA and mRNA sequencing data, we identified circRNAs that may target miRNAs and downstream target genes. Then, we explored the proliferation, invasion and metastasis of PANC-1 cells that were co-cultured with CaPSCs1 by silencing and overexpressing the target circRNA and miRNA and performed in vivo animal experiments to verify the in vitro results. Finally, we also detected downstream target gene expression levels in 165 matched pairs of pancreatic cancer and normal tissues by immunohistochemistry and analysed the relationship between the staining levels and the clinicopathological features and prognosis of pancreatic cancer patients.
Materials and methods
Cell lines
The human pancreatic cancer cell line PANC-1 was obtained from Shanghai Cell Bank and cultured in DMEM (HyClone Laboratories Inc) supplemented with 10% foetal bovine serum (Biological Industries). We collected PDAC tissues from 5 patients with pancreatic head cancer and normal pancreatic tissues from 5 patients with benign duodenal space from January 2018 to December 2018 at the First Affiliated Hospital of University of Science and Technology of China, Anhui Provincial Hospital. All patients included in the study provided informed consent. We isolated CaPSCs and NaPSCs by tissue explant culture and modified enzymatic perfusion with digestion-density gradient centrifugation [15-17], all of which were performed in DMEM supplemented with 10% foetal bovine serum (FBS), 100 U/mL penicillin and 100 μg/mL streptomycin.
Cell culture
Cell co-culture
In a Transwell co-culture system (Corning), the upper chamber was seeded with 3 × 10⁵ PANC-1 cells, and the lower chamber was seeded with 3 × 10⁵ human PSCs from different sources at 37°C in a 5% CO2 incubator. The cells were co-cultured for 24 hours.
PANC-1 CCK-8 assay
PANC-1 cells from each PSC co-culture system were digested and seeded into 96-well plates at 3000 cells per well. The proliferation of PCCs was detected by the CCK-8 method, and PANC-1 cells not undergoing co-culture were used as the control. The assay was performed as follows: cells in the logarithmic growth phase were trypsinized to prepare a cell suspension at a density of 1 × 10⁵ cells/mL; these cells were seeded in 96-well plates at 3000 cells/well (100 μL per well), with each group of samples set at five replicates in a CO2 (5%) incubator at 37°C. Ten microliters of CCK-8 solution was added to each well before the assay, and the plate was incubated for 1-4 hours in an incubator. The absorbance at 450 nm was measured by a microplate reader, the cells treated with solvent alone were used as a control group, and medium without cells was used as a blank group. The proliferation rate of the cells was calculated according to the following formula: cell proliferation rate % = (experimental group - blank group)/(control group - blank group) × 100%.
RNA-seq
Transcriptome high-throughput sequencing and subsequent bioinformatics analysis were performed by Genergy Biotech (Shanghai, China). RNA sequencing data have been uploaded to the website of the National Center for Biotechnology Information (NCBI) Gene Expression Omnibus (GEO). Scatter plots and cluster heatmaps were used visualize the variations in circRNA expression. The differential expression of circRNAs between CaPSCs1 and NaPSCs1 was analysed in R by the deseq-2 package. Differentially expressed circRNAs with statistical significance (fold change ≥ 1.5 and P < 0.05) between the groups were identified using the fold change cut-off and volcano map filtering, respectively. The “ClusterProfiler” package in R software was used for functional enrichment analysis, and significantly enriched GO biological processes and KEGG pathways (q-value < 0.01) were employed to predict circRNA-miRNA interactions in Arraystar homemade miRNA target prediction software based on the overlap between the TargetScan and miRanda prediction results. The circRNA-miRNA network was constructed and displayed using Cytoscape v3.5.1. Target genes of miRNAs were predicted using TargetScan, miRanda and miRDB.
Silencing of chr7:1154954255-154998784+ and overexpression of miRNA4459
CaPSCs1 were grown in six-well plates. siRNA targeting chr7:1154954255-154998784+ and RNA mimics for miR-4459 and NC were designed and purchased from Gene Chem (Shanghai, China) and transfected into CaPSCs1 using Lipofectamine RNAiMAX Transfection Reagent (Invitrogen) for 48 h. The final concentrations of the mimics and NC were 50 nM.
Wound healing assay
After 24 hours of coculture with CaPSCs1 and NaPSCs1, PANC-1 cells were trypsinized and seeded into a 6-well plate (approximately 5 × 10⁵ PANC-1 cells per well) in 2 mL of serum-free medium. The cells were wounded using a standard 10 μL pipette tip and a ruler. The cells were cultured in a cell culture incubator and imaged under an inverted microscope at 0 and 24 hours to calculate the relative migration distance of the cells, which was calculated as follows: Relative migration distance of cells = scratch distance (24 hours) - scratch distance (0 hours).
Transwell assay
The migration and invasion experiments were conducted using uncoated and Matrigel-coated 24-well chambers, respectively, with 8.0-μm PET membrane pores (Corning Incorporated). CaPSCs1 and NaPSCs1 were seeded on 24-well plates at a density of 5 × 10⁴ cells/well. At 24 hours after seeding, the medium was replaced with 750 μL of 10% FBS DMEM. The Transwell chambers were placed in a 24-well culture plate, and then 1 × 10⁵ PANC-1 cells suspended in 250 µl of DMEM were seeded into the upper chamber of the inserts. In the control experiment, 750 µL of DMEM supplemented with 10% FBS was added to the 24-well plate, and 1 × 10⁵ PANC-1 cells resuspended in 250 µl of DMEM were added to the Transwell chamber. Migration and invasion were evaluated by counting the number of cells that had moved to the membrane facing the lower chamber after 48 hours of culture in a CO2 (5%) incubator at 37°C. Then, the chambers were removed and washed with PBS. The cells in the upper chamber were removed with a cotton swab, and the invaded or migrated cells that had passed through the membrane to the lower chamber were stained with crystal violet for 10 min. After residual crystal violet solution on the surface was washed away, the cells were imaged under an inverted microscope and counted. The invasion rate was calculated as follows: Invasion rate (%) = number of invading cells in the experimental group/the number of invading cells in the control group (CaPSCs1+PANC-1) × 100%.
Western blotting
PSCs from each group were fully lysed with RIPA lysis buffer, and total protein was extracted. The protein concentration was measured, and then protein samples were mixed with loading buffer at a ratio of 4:1 and denatured in a 100°C water bath. Equal amounts of protein were loaded onto gels and subjected to SDS-PAGE, after which they were transferred to a PVDF membrane by the wet transfer method. After they were fully blocked with a blocking solution, the membranes were incubated at 4°C overnight with primary antibody diluted at the appropriate ratio. They were then washed before they were incubated for 2 hours at room temperature with secondary antibody diluted at the appropriate ratio, washed again and subjected to chemiluminescence.
Quantitative reverse transcription-polymerase chain reaction validation assay
RNA was extracted according to previous protocols and reverse transcribed into cDNA. The RNA level was determined by SYBR Green-based RT-PCR performed on a PikoReal RT-PCR system (Thermo Fisher Scientific, Waltham, MA, USA) under the following conditions: an initial denaturation step for 10 min at 95°C and 40 amplification cycles comprising a denaturation step for 15 seconds at 95°C, an annealing step for 30 seconds at 60°C, and finally an elongation step for 30 seconds at 72°C. We performed melting-curve analysis to monitor PCR product purity, and the relative gene expression data were analysed using the 2-ΔΔCt method. The sequences of the divergent primers used for the detection of the 3 circular RNAs and KIAA0513 by quantitative reverse transcription-polymerase chain reaction (qRT-PCR) are shown in Table 1. The RNA levels were normalized to those of human GAPDH.
Table 1.
Primer sequence
| Gene name | Primer sequences, 5’-3’ |
|---|---|
| chr10:76909966-77019099+ | F: TGCGGAACTCACCCAACACC |
| R: GACATGGCCACTCAGGACGG | |
| chr7:154954255-154998784+ | F: CCATCGCCTCAGCAGCATCA |
| R: TTCCAGGTGGCCAGCAGTTG | |
| chr10:12081472-12120267+ | F: GCCCCATAGAGGGAGGCTGA |
| R: ACAGGACGTCTCCAGTGGCT | |
| miR-4459 | F: ATTATCCAGGAGGCGGAGG |
| R: TCGTATCCAGTGCAGGGTC | |
| KIAA0513 | F: CGTGGGCTCGCTAATCGAC |
| R: TTCTCACTGTCCGCAGACTCA | |
| GAPDH | F: GGCCTCCAAGGAGTAAGACC |
| R: AGGGGAGATTCAGTGTGGTG |
Tumour xenograft study
Six-week-old female nude mice (15-25 g) used in the experiment were purchased and housed at the animal centre of Anhui Provincial Hospital under SPF conditions with access to sterilized feed and water. All animal experiments were approved by the Experimental Animal Ethics Committee of Anhui Provincial Hospital. During surgery, ether or isoflurane was used for inhalational anaesthesia. At the end of the animal experiments, the mice were killed by cervical dislocation after anaesthesia induction. For the tumour xenograft model, cells from different groups were digested, collected by centrifugation, and resuspended in serum-free medium. They were then mixed well at a ratio of 3:1 (3 × 10⁶ PANC-1:1 × 10⁶ PSCs per mouse). The ether, gauze, and syringe were prepared, and the collected cells were placed in an ice box. After the mice were anaesthetized with ether, their armpits were exposed, and the cells were subcutaneously injected into the right axilla (6 mice per group). The mental state and tumour formation were observed regularly, and after 28 days, all the mice were killed by cervical dislocation before the subcutaneous tumours were exposed, completely removed, weighed and measured.
Immunohistochemistry
Paraffin sections from 165 PDAC patients who had a confirmed diagnosis via pathology from January 2012 to January 2017 at the First Affiliated Hospital of University of Science and Technology of China were collected. The immunohistochemical SP method was used, and PBS was used in place of primary antibody as the negative control. Briefly, the sections were paraffin embedded, sliced into 4 μm sections and placed on glass slides. The sections were heated in an oven at 60°C for 20 min, dewaxed by xylene dehydration, rehydrated in an ethanol gradient at 100%, 95% and 75%, and rinsed with PBS. Then, the sections were placed in a container filled with citrate buffer (pH 6.0), which was then set into a pressure cooker to boil until air injection for 5 min. Endogenous peroxidase activity was blocked with 3% H2O2 for 10 min, and the sections were washed with PBS 3 times for 3 min each time. Anti-KIAA0513 rabbit polyclonal antibody diluted at 1:100 was added and incubated with the sections overnight at 4°C; the slides were washed with PBS 3 times, 3 min each time; and DAB colour evaluation was performed under a microscope. Finally, haematoxylin was used for stain the sections, which were then subject to gradient ethanol dehydration, xylene transparency, gum sealing, microscopic examination and imaging. In addition, for the negative control group, PBS was used instead of primary antibody. The KIAA0513 protein was mainly localized to the cytoplasm, with diffuse brown-yellow or yellow staining in tumour stromal cells and relatively less staining in tumour cells. The results were scored using a semi-quantitative method based on the area (0 points, no staining; 1 point, 10% staining; 2 points, 10%-30% staining; 3 points, > 30% staining) and intensity (0 points, none; 1 point, light yellow; 2 points, yellow; 3 points, brownish yellow). The total score was the product of the area and intensity scores. A total score ≤ 3 was defined as low expression, and a total score > 3 was defined as high expression. All immunohistochemical sections were independently scored by two experienced pathologists, and discrepancies were resolved by joint evaluation [18].
Statistical analysis
Categorical patient characteristics were compared using the χ2 test. Kaplan-Meier survival curves were used to analyse overall survival (OS) and disease-free survival (DFS) of PDAC patients. Differences were assessed by a log-rank test. Cox proportional hazard regression models were used to obtain unadjusted and adjusted hazard ratios (HRs) and 95% confidence intervals (CIs) for survival in univariate and multivariate analyses. A 2-sided P < 0.05 was considered statistically significant. SPSS 21.0 software (SPSS, Inc., Chicago, IL, USA) and R3.2.3 (http://www.R-project.org) were used for the statistical analysis.
Results
CCK-8 assay
To identify the PSCs that had the greatest influence on the proliferative ability of PANC-1 cells, we selected 5 primary pancreatic stellate CaPSCs (CaPSCs1-5) derived from pancreatic cancer tissues of pancreatic cancer patients and 5 primary pancreatic stellate NaPSCs (NaPSCs1-5) derived from normal pancreatic tissue of patients with duodenal adenoma. After CaPSCs and NaPSCs were co-cultured with PANC-1 cells, the CCK-8 assay was performed on PANC-1 cells. The results showed that CaPSCs1 had the strongest effect on the proliferation of PANC-1 cells (Figure 1A), whereas NaPSCs1 had the weakest effect (Figure 1B). In addition, the CaPSC group promoted the proliferation of PANC-1 cells more strongly than did the NaPSC group (Figure 1C), and the difference was statistically significant.
Figure 1.
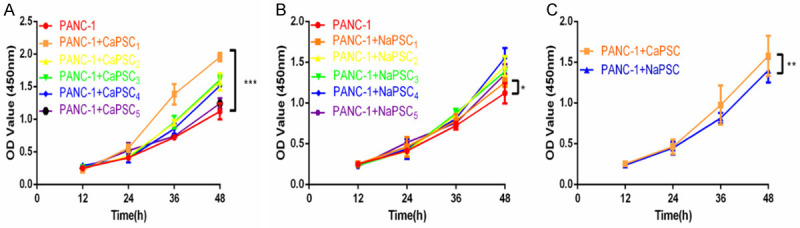
A. CCK-8 assay showing the effect of co-culturing CaPSCs1-5 on PANC-1 cells. B. CCK-8 assay showing the effect of co-culturing NaPSCs1-5 on PANC-1 cells. C. CCK-8 assay showing the effect of co-cultured CaPSCs and NaPSCs on PANC-1 cells. *P < 0.05, **P < 0.01, ***P < 0.001.
Bioinformatics analysis
To identify CaPSC1- and NaPSC1-related circRNAs, we used transcriptome high-throughput sequencing to analyse and compare the expression of circRNAs in CaPSCs1 and NaPSCs1. Total RNA was isolated from CaPSCs1 and NaPSCs1 and analysed by RNA sequencing. Differential gene expression analysis between CaPSCs1 and NaPSCs1 revealed 841 circRNAs that showed significantly differential expression between the two cell lines (fold change ≥ 2.0, P ≤ 0.05). A total of 388 circRNAs were upregulated, and 453 were downregulated (Figure 2A, 2B). In addition, we found that 73 differentially expressed miRNAs were upregulated and 16 were downregulated in CaPSCs1 compared to NaPSCs1 (Figure 2C, 2D). We also found that 8155 differentially expressed mRNAs were upregulated and 4226 were downregulated in CaPSCs1 compared to NaPSCs1 (Figure 2E, 2F).
Figure 2.

A. Clustered heatmap of the differentially expressed circRNAs in three paired samples of CaPSCs1 and NaPSCs1. B. Volcano plot showing the differential expression of circRNAs in three paired samples of CaPSCs1 and NaPSCs1. C. Clustered heatmap of the differentially expressed miRNAs in three paired samples of CaPSCs1 and NaPSCs1. D. Volcano plot showing the differential expression of miRNAs in three paired samples of CaPSCs1 and NaPSCs1. E. Clustered heatmap of the differentially expressed mRNA in three paired samples of CaPSCs1 and NaPSCs1. F. Volcano plot showing the differential expression of mRNAs in three paired samples of CaPSCs1 and NaPSCs1.
Quantitative PCR validation in CaPSCs1 and NaPSCs1
To verify the sequencing results, the expression of top 3 most differentially expressed circRNAs in CaPSCs1 and NaPSCs1-chr7:154954255-154998784+, chr10:12081472-12120267+ and chr10:76909966-77019099+ (Table 1)-was further confirmed by qRT-PCR. The qRT-PCR data showed that although the expression pattern trends of these 3 circRNAs were consistent with the sequencing results, chr7:154954255-154998784+ was the most significantly upregulated in CaPSCs1 (Figure 3F).
Figure 3.

GO enrichment and pathway analysis of dysregulated circRNA genes. A. Most significantly enriched GO terms of circRNA genes according to cellular component. B. Most significantly enriched GO terms of circRNA genes according to biological process. C. Most significantly enriched GO terms of circRNA genes according to molecular function. D. Bar graph showing the top 10 enrichment scores of the significantly enriched pathways. E. Network of circRNAs and the predicted binding miRNAs and binding mRNAs. F. The top 3 most differentially expressed circRNAs in CaPSCs1 and NaPSCs1 were validated by qRT-PCR. The results are presented as the means ± SEM. **P < 0.01, ***P < 0.001.
Network of circRNAs and the predicted binding miRNAs
To better explore and identify the upstream and downstream miRNAs associated with circRNA chr7:154954255-154998784+, we analysed the potential binding miRNAs for this circRNA by sequence analysis using TargetScan. A tree diagram of circRNA chr7:154954255-154998784+ and its potential binding miRNAs is shown in Figure 3A-D. Based on the circRNA/miRNA interaction network, chr7:154954255-154998784+ was predicted to bind to a number of miRNAs with known functions, suggesting its potential roles in promoting the progression of PDAC. We selected a target miRNA from the tree diagram (Figure 3E)-miR-4459, which may bind chr7:154954255-154998784+-and compared their expression between CaPSCs1 and NaPSCs1.
Silencing circRNAs in CaPSCs1 enhances the proliferation and invasion of PANC-1 cells
To confirm whether chr7:154954255-154998784+ can regulate the ability of CaPSCs1 to affect the biological function of PANC-1 cells, we used siRNA to silence chr7:154954255-154998784+ in CaPSCs1 and verified the knockdown efficiency by RT-qPCR, which showed that chr7:154954255-154998784+ was downregulated in CaPSCs1 (Figure 4A). Furthermore, we used RT-qPCR to detect the expression of miR-4459 and KIAA0513 mRNA (Figure 4B-D). The results showed that after silencing chr7:154954255-154998784+ in CaPSCs1, the expression of miR-4459 was upregulated, and the expression of KIAA0513 mRNA was downregulated. Next, different groups of CaPSCs1 were co-cultured with PANC-1 cells before the proliferation, migration and invasion of the latter were detected using CCK-8, wound healing and Transwell migration and invasion assays. The results of the CCK-8 assay showed that CaPSCs1 with knockdown of chr7:154954255-154998784+ promoted the proliferation of PANC-1 cells (Figure 5A). The wound healing assay showed that the migratory ability of PANC-1 cells co-cultured with CaPSCs1 with chr7:154954255-154998784+ knockdown was decreased (Figure 5B). Finally, the Transwell assays showed that the migration and invasion of PANC-1 cells co-cultured with CaPSCs1 with chr7:154954255-154998784+ knockdown were reduced to 57% and 43%, respectively, compared to the respective controls (Figure 5C). These results indicate that silencing chr7:154954255-154998784 can reduce the cancer-promoting ability of CaPSCs1 and mitigate the proliferation, migration and invasion of PANC-1 cells.
Figure 4.
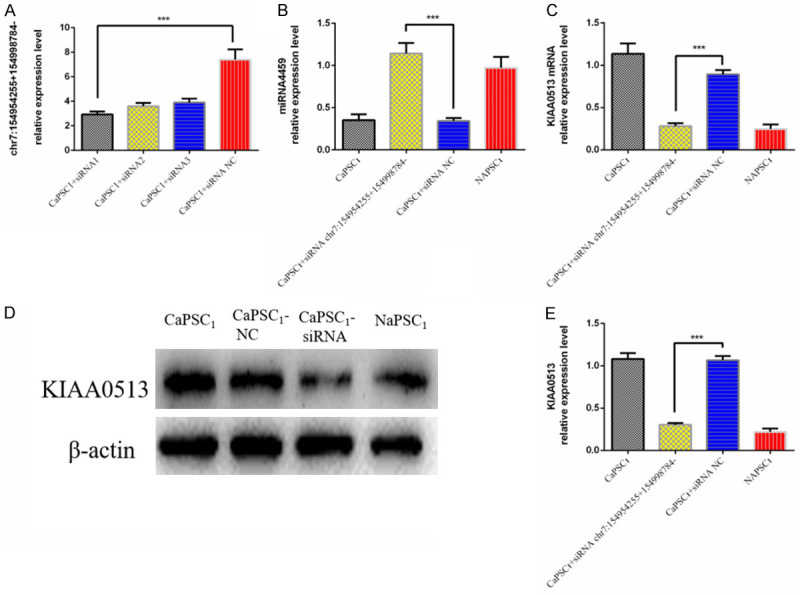
A. qRT-PCR analysis of chr7:154954255-154998784+ expression levels after siRNA transfection. NC: negative control. B. Detection of miR-4459 expression in different groups by RT-qPCR. C. Detection of KIAA0513 mRNA expression in different groups by RT-qPCR. D, E. Detection of KIAA0513 protein expression in different groups by Western blot.
Figure 5.

A. Representative images showing wound healing in different groups of PANC-1 cells. B. CCK-8 assay showing the effect of different groups of co-cultured PSCs on PANC-1 cell viability. C. Representative images of migrated PANC-1 cells.
Overexpression of miR-4459 in CaPSCs1 inhibits the proliferation and invasion of PANC-1 cells
We first overexpressed miR-4459 in CaPSCs1 and validated its overexpression by RT-qPCR (Figure 6A). Next, we used RT-qPCR to detect the expression of chr7:154954255-154998784+ and KIAA0513 mRNA and observed that after overexpression of miR-4459, the expression of chr7:154954255-154998784+ and KIAA0513 was downregulated (Figure 6B-E). Next, the different groups of CaPSCs1 were co-cultured with PANC-1 cells, and the proliferation, migration and invasion of PANC-1 cells were detected using the CCK-8, wound healing and Transwell migration/invasion assays. The results of the CCK-8 assay showed that CaPSCs1 in the miR-4459 overexpression group promoted the proliferation of PANC-1 cells (Figure 7A). The wound healing assay showed that the migration of PANC-1 cells co-cultured with CaPSCs1 overexpressing miR-4459 increased (Figure 7B). Finally, Transwells were used to detect the migration and invasion of PANC-1 cells co-cultured with CaPSCs1 overexpressing miR-4459, and the results showed that the migration and invasion of these PANC-1 cells were reduced to 63% and 35% of their respective controls (Figure 7C). These data indicate that overexpression of miR-4459 can reduce the cancer-promoting ability of CaPSCs1 and increase the proliferation, migration and invasion of PANC-1 cells.
Figure 6.
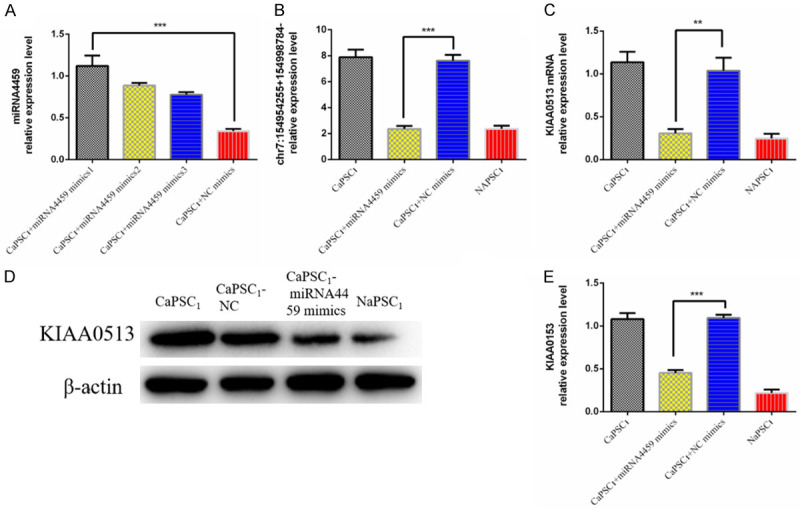
A. qRT-PCR analysis of miRNA-4459 expression levels after transfection with miRNA-4459 mimic. NC: negative control. B. Detection of chr7:154954255-154998784+ expression in different groups by RT-qPCR. C. Detection of KIAA0513 mRNA expression in different groups by RT-qPCR. D, E. Detection of KIAA0513 expression in different groups by Western blot.
Figure 7.

A. Representative images showing wound healing in different groups of PANC-1 cells. B. CCK-8 assay showing the effect of different groups of co-cultured PSCs on PANC-1 cell viability. C. Representative images of migrated PANC-1 cells.
Silencing chr7:154954255-154998784+ in CaPSCs1 inhibits tumour growth in co-culture systems in vivo
To further evaluate the effect of chr7:154954255-154998784+ on tumour growth in vivo, we employed a tumour xenograft model in nude mice. CaPSCs1 were pre-treated with chr7:154954255-154998784+ siRNA or NC siRNA and co-cultured for 24 hours with PANC-1 cells; the co-cultures were injected into the right axilla of nude mice. As controls, untreated CaPSCs1 and NaPSCs1 were co-cultured with PANC-1 cells and injected in the same fashion. PANC-1 cells were also separately cultured and injected into the right axilla of mice as a blank control. The results showed that the PANC-1+CaPSC1-siRNA-chr7:154954255-154998784+ group had smaller tumours than the CaPSC1+PANC-1 group (Figure 8A). Compared with the tumour volume (2202±114.9 mm3) (Figure 8B) and weight (346.3±14.70 mg) (Figure 8C) in the CaPSC1+PANC-1 group, the CaPSC1-siRNA-chr7:154954255-154998784+ group had a smaller tumour volume (1168±88.24 mm3) (Figure 8B) and weight (230.3±8.01 mg) (Figure 8C).
Figure 8.
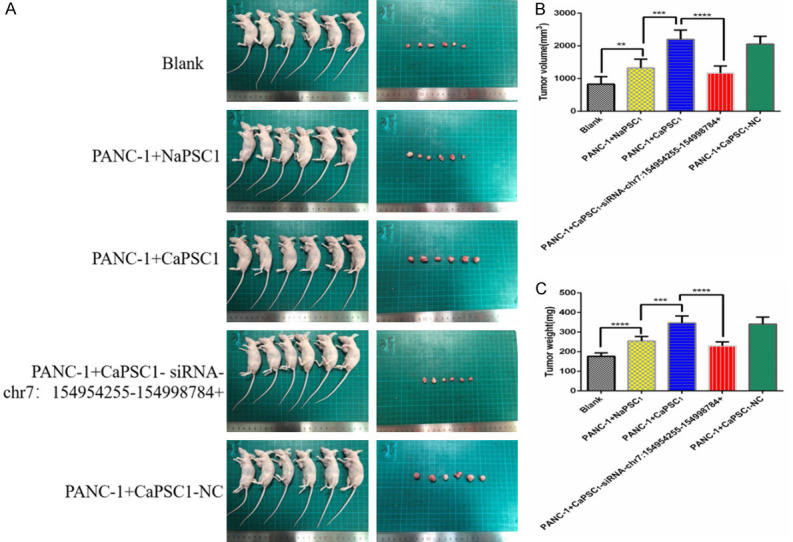
Silencing chr7:154954255-154998784+ in CaPSCs1 decreased the tumour size in an animal model of pancreatic cancer. A. Image of a tumour in the pancreatic cancer mouse model. B. Volume of tumour tissues in the three groups. C. Weight of tumour tissues in the three groups. ***P < 0.001.
Correlation between KIAA0513 expression and clinicopathological characteristics
As shown in Figure 9, the expression of KIAA0513 was mainly localized within the cytoplasm of interstitial cells surrounding the tumour. The data presented in Table 2 demonstrate that increased protein expression of KIAA0513 was significantly correlated with histological grade (P=0.042), lymph status (P=0.030), serum CA19-9 (P < 0.042) and TNM stage (P=0.001). By contrast, associations between KIAA0513 expression and other clinical parameters (age, sex, tumour location) were not significant.
Figure 9.
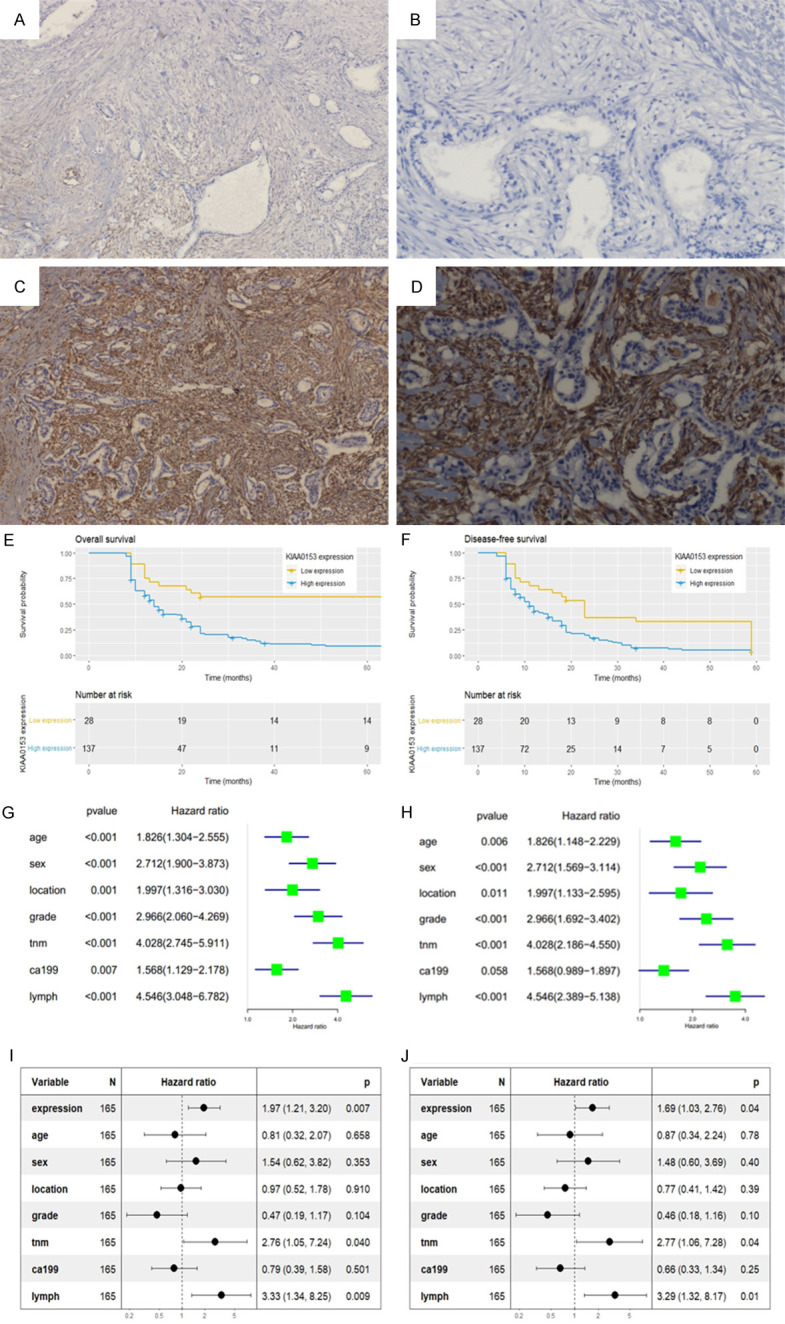
Immunohistochemical staining for KIAA0513 in PDAC tissues. A. Negative KIAA0513 expression (× 100); B. Negative KIAA0513 expression (× 400); C. Positive KIAA0513 expression (× 100); D. Positive KIAA0513 expression (× 400); E, F. Kaplan-Meier analysis of the OS and DFS curves of PDAC patients based on KIAA0513 expression; G, H. Univariate analysis of factors associated with OS and DFS; I, J. Multivariate analysis of factors associated with OS and DFS.
Table 2.
Relationship between KIAA0513 expression and clinicopathological characteristics in PDAC
| Variables | Number | KIAA0513 expression | P-value | |
|---|---|---|---|---|
|
| ||||
| Low | High | |||
| Age | 165 | |||
| < 60 years | 65 | 13 | 52 | 0.403 |
| > 60 years | 100 | 15 | 85 | |
| Gender | ||||
| Male | 72 | 11 | 61 | 0.610 |
| Female | 93 | 17 | 76 | |
| Tumor location | ||||
| Head | 89 | 19 | 70 | 0.105 |
| Body/tail | 76 | 9 | 67 | |
| Serum ca19-9 | ||||
| < 37 U/ml | 29 | 17 | 12 | < 0.001 |
| ≥ 37 U/ml | 136 | 11 | 125 | |
| Grade | ||||
| Well | 45 | 12 | 33 | 0.042 |
| Moderate/poor | 120 | 16 | 104 | |
| Lymph status | ||||
| Absent | 59 | 5 | 54 | 0.030 |
| Present | 106 | 23 | 83 | |
| Tnm stage | ||||
| I-II | 46 | 15 | 31 | 0.001 |
| III-IV | 119 | 13 | 106 | |
Correlation between KIAA0513 expression and survival time
Kaplan-Meier curves showed that patients with high expression levels of KIAA0513 had worse OS (median survival 13.5 months) and DFS (median survival 11.5 months) than those with low expression levels (median survival 23.5 months and 18.5 months, respectively) (OS, P < 0.001; DFS, P < 0.001) (Figure 9E, 9F). In the multivariable Cox analysis, high expression of KIAA0513 had a significant protective effect on OS (HR=1.97, 95% CI=1.21-3.20, P=0.007) and DFS (HR=1.69, 95% CI=1.03-2.76, P=0.04) (Figure 9G-J). TNM stage and lymph status had a significantly protective effect on OS (TNM stage: HR=2.76, 95% CI=1.05-7.24, P=0.040; lymph status: HR=3.33, 95% CI=1.34-8.25, P=0.009) and DFS (TNM stage: HR=2.77, 95% CI=1.06-7.28, P=0.04; lymph status: HR=3.29, 95% CI=1.32-8.17, P=0.01) (Figure 9G-J).
Discussion
PSCs are interstitial cells around the pancreas that are in a quiescent state in healthy pancreas. When subjected to pathological stimulation, PSCs are activated and convert to CaPSCs [16,17,19,20]. Many studies have shown that CaPSCs play an extremely important role in the growth, proliferation, invasion and metastasis of PCCs [12,21-23]. For example, CaPSCs can produce miRNAs to increase chemokine gene expression, migration, and proliferation in PCCs [24]. In addition, proteins produced by CaPSCs can enhance the ability of PCCs to invade and metastasize [13]. CaPSCs can even produce a barrier composed of extracellular matrix (ECM) proteins that seriously impairs the delivery and penetration of drugs to the tumour site, enhances the tolerance of PCCs to chemotherapy drugs, and significantly improves the viability of PCCs [25]. What is surprising is that CaPSCs can rescue the proliferation of nutrient-deprived MiaPaCa-2 and BxPC3 cells in a KRAS-independent manner by supplying these cells with metabolites [14]. Moreover, there is an interaction between PCCs and CaPSCs. At present, the focus of many studies has been mainly on the role of CaPSCs in the tumour microenvironment. For instance, PCCs can induce PSCs to express more fibrosis-related genes and a high quantity of α-SMA and type I procollagen C-peptides, which convert PSCs into CaPSCs. In addition, their interaction can also increase the activation of ERK and Akt as well as proliferation and migration in PSCs. Conversely, activated PSCs enhance the ability of PCCs to proliferate and invade [26]. PCCs can also recruit a large number of PSCs by activating the Lin28B/let-7/HMGA2/PDGFB signalling pathway, and these recruited PSCs can increase the ability of PCCs to migrate [27]. It appears that PCCs and PSCs together construct a microenvironment for optimal tumour development and may use this method to regulate the progression of pancreatic cancer. These studies suggest that CaPSCs play an irreplaceable role in the development and progression of pancreatic cancer and highlight that CaPSCs are important targets for potential treatments of pancreatic cancer.
CircRNAs have become a hot research topic due to their covalently closed structure, high stability and role in gene regulation. Many studies have shown that circRNAs can function as traps for mRNAs by binding their target transcripts and regulating the expression of the protein downstream of the transcript. As a consequence, as the protein level changes, the cell function changes as well [9-11]. More interestingly, circRNAs may also contain conserved binding sites for miRNAs and can act as molecular sponges that bind to miRNAs to effectively inhibit their activity to regulate cell function. These findings all indicate the importance of circRNAs in the regulation of cell function [28]. The current study also confirmed a causal relationship between a chromosomal translocation encoding an oncogenic fusion protein and the occurrence of tumours. Moreover, Guarnerio J and his collaborators determined that a well-established cancer-associated chromosomal translocation could produce a fusion circRNA (f-circRNA), which could generate different transcriptional exons due to the different genes affected by the translocation, thereby regulating cell functions. Their group also confirmed that this f-circRNA could contribute to the transformation of cancer cells, promote their viability and drug resistance and have a tumour-promoting effect in an in vivo model. This study extends the current knowledge of the molecular mechanisms involved in cancer onset and progression and demonstrates the diagnostic and therapeutic implications of circRNAs in cancer. Based on this knowledge, we may be able to alter the functional characterization of cells by genetically modifying or knocking out circRNAs [29]. Although the circular nature of circRNAs makes their detection, quantification and functional characterization challenging, recent advances in high-throughput RNA sequencing and circRNA-specific computational tools have overcome this limitation [30]. In this study, RNA sequencing was used to explore the mechanism by which CaPSCs affect the proliferation and migration of PCCs through a circRNA-miRNA-protein axis.
In this study, we selected CaPSCs1, which had the strongest effect on the proliferative ability of the pancreatic cancer cell line PANC-1, and NaPSCs1, which had the weakest effect on the proliferative ability of PANC-1 cells. Then, we simulated the tumour microenvironment in pancreatic cancer by co-culturing the above PSCs with PANC-1 cells to explore the effect of mesenchymal cells on the biological behaviour of tumour cells. Subsequently, we used RNA sequencing analysis to compare the differences in the circRNA and miRNA expression profiles between the CaPSC1 and NaPSC1 cell lines. From the sequencing data, 68 upregulated circRNAs and 58 downregulated circRNAs were found in CaPSCs1; these genes could be related to the promotion of PANC-1 proliferation. Finally, we chose the circRNA chr7:154954255-154998784+ because it showed the greatest difference in expression. In addition, the effects of the relationship between the miRNA-4459/KIAA0513 axis and chr7:154954255-154998784+ on the biological behaviour of PANC-1 cells co-cultured with PSCs were investigated by bioinformatics analysis and corresponding miRNA and mRNA sequencing results. By using siRNA to silence chr7:154954255-154998784+ in CaPSCs1, we found that the proliferation, invasion and metastasis of PANC-1 cells in the co-culture system decreased, the expression of miRNA-4459 increased, and the expression of KIAA0513 decreased. Moreover, we silenced miRNA-4459 in CaPSCs1 by siRNA and observed that the proliferation, invasion and metastasis of PANC-1 cells increased in the co-culture system, and the corresponding expression of chr7:154954255-154998784+ and KIAA0513 also increased. Animal experiments showed that silencing chr7:154954255-154998784+ in CaPSCs1 inhibited tumour growth of PANC-1-derived tumours in vivo. Further histological experiments showed that in paraffin-embedded sections from 132 patients with pancreatic cancer, KIAA0513 expression was significantly higher in tumour tissues than in adjacent tissues. Perhaps more surprisingly, we found that high expression of KIAA0513 may be associated with TNM staging, high CA19-9 expression, and lymph node metastasis in patients with pancreatic cancer. Univariate and multivariate survival analyses showed that the OS and DFS of patients with high KIAA0513 expression were significantly lower than those of patients with low expression. These experimental results indicated that CaPSCs may promote the proliferation, invasion and metastasis of pancreatic cancer through the chr7:154954255-154998784+/miRNA-4459/KIAA0513 axis. However, due to the heterogeneity of CaPSCs and the ageing of CaPSCs in vitro, our experimental results still require verification with a multi-centre study with a larger cohort of PSC samples. Therefore, additional work should be conducted in future studies.
Conclusion
We identified that circRNA chr7:154954255-154998784+ is most likely upregulated in CaPSCs. In addition, CaPSCs may promote the development and progression of pancreatic cancer through the miR-4459/KIAA0513 axis. In summary, the circRNA chr7:154954255-154998784+/miR-4459/KIAA0513 axis in CaPSCs may be developed as a promising strategy for pancreatic cancer therapy in the future.
Acknowledgements
This study was supported by funds from Anhui Provincial Natural Science Foundation (2008085QH416 and 2008085QH419).
Disclosure of conflict of interest
None.
References
- 1.Castillo L, Young AIJ, Mawson A, Schafranek P, Steinmann AM, Nessem D, Parkin A, Johns A, Chou A, Law AMK, Lucas MC, Murphy KJ, Deng N, Gallego-Ortega D, Caldon CE Australian Pancreatic Cancer Genome Initiative (APGI) Timpson P, Pajic M, Ormandy CJ, Oakes SR. MCL-1 antagonism enhances the anti-invasive effects of dasatinib in pancreatic adenocarcinoma. Oncogene. 2020;39:1821–1829. doi: 10.1038/s41388-019-1091-0. [DOI] [PMC free article] [PubMed] [Google Scholar]
- 2.Dai WF, Beca J, Guo H, Isaranawatchai W, Schwartz D, Naipaul R, Arias J, Qiao Y, Gavura S, Redmond-Misner R, Ismail Z, Barbera L, Chan K. Are population-based patient-reported outcomes associated with overall survival in patients with advanced pancreatic cancer? Cancer Med. 2020;9:215–224. doi: 10.1002/cam4.2704. [DOI] [PMC free article] [PubMed] [Google Scholar]
- 3.Lai E, Puzzoni M, Ziranu P, Pretta A, Impera V, Mariani S, Liscia N, Soro P, Musio F, Persano M, Donisi C, Tolu S, Balconi F, Pireddu A, Demurtas L, Pusceddu V, Camera S, Sclafani F, Scartozzi M. New therapeutic targets in pancreatic cancer. Cancer Treat Rev. 2019;81:101926. doi: 10.1016/j.ctrv.2019.101926. [DOI] [PubMed] [Google Scholar]
- 4.Vitiello GA, Cohen DJ, Miller G. Harnessing the microbiome for pancreatic cancer immunotherapy. Trends Cancer. 2019;5:670–676. doi: 10.1016/j.trecan.2019.10.005. [DOI] [PubMed] [Google Scholar]
- 5.Apte MV, Pirola RC, Wilson JS. Pancreatic stellate cells: a starring role in normal and diseased pancreas. Front Physiol. 2012;3:344. doi: 10.3389/fphys.2012.00344. [DOI] [PMC free article] [PubMed] [Google Scholar]
- 6.Pereira BA, Vennin C, Papanicolaou M, Chambers CR, Herrmann D, Morton JP, Cox TR, Timpson P. CAF subpopulations: a new reservoir of stromal targets in pancreatic cancer. Trends Cancer. 2019;5:724–741. doi: 10.1016/j.trecan.2019.09.010. [DOI] [PubMed] [Google Scholar]
- 7.Augstein P, Loudovaris T, Bandala-Sanchez E, Heinke P, Naselli G, Lee L, Hawthorne WJ, Gonez LJ, Neale AM, Vaillant F, Thomas HE, Kay TW, Banakh I, Harrison LC. Characterization of the human pancreas side population as a potential reservoir of adult stem cells. Pancreas. 2018;47:25–34. doi: 10.1097/MPA.0000000000000950. [DOI] [PubMed] [Google Scholar]
- 8.Blank U, Karlsson G, Karlsson S. Signaling pathways governing stem-cell fate. Blood. 2008;111:492–503. doi: 10.1182/blood-2007-07-075168. [DOI] [PubMed] [Google Scholar]
- 9.Beermann J, Piccoli MT, Viereck J, Thum T. Non-coding RNAs in development and disease: background, mechanisms, and therapeutic approaches. Physiol Rev. 2016;96:1297–1325. doi: 10.1152/physrev.00041.2015. [DOI] [PubMed] [Google Scholar]
- 10.Li J, Yang J, Zhou P, Le Y, Zhou C, Wang S, Xu D, Lin HK, Gong Z. Circular RNAs in cancer: novel insights into origins, properties, functions and implications. Am J Cancer Res. 2015;5:472–480. [PMC free article] [PubMed] [Google Scholar]
- 11.Qu S, Yang X, Li X, Wang J, Gao Y, Shang R, Sun W, Dou K, Li H. Circular RNA: a new star of noncoding RNAs. Cancer Lett. 2015;365:141–148. doi: 10.1016/j.canlet.2015.06.003. [DOI] [PubMed] [Google Scholar]
- 12.Erkan M, Hausmann S, Michalski CW, Fingerle AA, Dobritz M, Kleeff J, Friess H. The role of stroma in pancreatic cancer: diagnostic and therapeutic implications. Nat Rev Gastroenterol Hepatol. 2012;9:454–467. doi: 10.1038/nrgastro.2012.115. [DOI] [PubMed] [Google Scholar]
- 13.Leca J, Martinez S, Lac S, Nigri J, Secq V, Rubis M, Bressy C, Serge A, Lavaut MN, Dusetti N, Loncle C, Roques J, Pietrasz D, Bousquet C, Garcia S, Granjeaud S, Ouaissi M, Bachet JB, Brun C, Iovanna JL, Zimmermann P, Vasseur S, Tomasini R. Cancer-associated fibroblast-derived annexin A6+ extracellular vesicles support pancreatic cancer aggressiveness. J Clin Invest. 2016;126:4140–4156. doi: 10.1172/JCI87734. [DOI] [PMC free article] [PubMed] [Google Scholar]
- 14.Zhao H, Yang L, Baddour J, Achreja A, Bernard V, Moss T, Marini JC, Tudawe T, Seviour EG, San Lucas FA, Alvarez H, Gupta S, Maiti SN, Cooper L, Peehl D, Ram PT, Maitra A, Nagrath D. Tumor microenvironment derived exosomes pleiotropically modulate cancer cell metabolism. Elife. 2016;5:e10250. doi: 10.7554/eLife.10250. [DOI] [PMC free article] [PubMed] [Google Scholar]
- 15.Meng FT, Huang M, Fan FF, Shao F, Wang C, Huang Q. A modified method for isolating human quiescent pancreatic stellate cells. Cancer Manag Res. 2019;11:1533–1539. doi: 10.2147/CMAR.S192354. [DOI] [PMC free article] [PubMed] [Google Scholar]
- 16.Apte MV, Haber PS, Applegate TL, Norton ID, McCaughan GW, Korsten MA, Pirola RC, Wilson JS. Periacinar stellate shaped cells in rat pancreas: identification, isolation, and culture. Gut. 1998;43:128–133. doi: 10.1136/gut.43.1.128. [DOI] [PMC free article] [PubMed] [Google Scholar]
- 17.Bachem MG, Schneider E, Gross H, Weidenbach H, Schmid RM, Menke A, Siech M, Beger H, Grunert A, Adler G. Identification, culture, and characterization of pancreatic stellate cells in rats and humans. Gastroenterology. 1998;115:421–432. doi: 10.1016/s0016-5085(98)70209-4. [DOI] [PubMed] [Google Scholar]
- 18.Meng FT, Huang M, Shao F, Huang Q. Upregulated FFAR4 correlates with the epithelial-mesenchymal transition and an unfavorable prognosis in human cholangiocarcinoma. Cancer Biomark. 2018;23:353–361. doi: 10.3233/CBM-181358. [DOI] [PubMed] [Google Scholar]
- 19.Sparmann G, Hohenadl C, Tornoe J, Jaster R, Fitzner B, Koczan D, Thiesen HJ, Glass A, Winder D, Liebe S, Emmrich J. Generation and characterization of immortalized rat pancreatic stellate cells. Am J Physiol Gastrointest Liver Physiol. 2004;287:G211–219. doi: 10.1152/ajpgi.00347.2003. [DOI] [PubMed] [Google Scholar]
- 20.Watari N, Hotta Y, Mabuchi Y. Morphological studies on a vitamin A-storing cell and its complex with macrophage observed in mouse pancreatic tissues following excess vitamin A administration. Okajimas Folia Anat Jpn. 1982;58:837–858. doi: 10.2535/ofaj1936.58.4-6_837. [DOI] [PubMed] [Google Scholar]
- 21.Zhan HX, Zhou B, Cheng YG, Xu JW, Wang L, Zhang GY, Hu SY. Crosstalk between stromal cells and cancer cells in pancreatic cancer: new insights into stromal biology. Cancer Lett. 2017;392:83–93. doi: 10.1016/j.canlet.2017.01.041. [DOI] [PubMed] [Google Scholar]
- 22.Qian D, Lu Z, Xu Q, Wu P, Tian L, Zhao L, Cai B, Yin J, Wu Y, Staveley-O’Carroll KF, Jiang K, Miao Y, Li G. Galectin-1-driven upregulation of SDF-1 in pancreatic stellate cells promotes pancreatic cancer metastasis. Cancer Lett. 2017;397:43–51. doi: 10.1016/j.canlet.2017.03.024. [DOI] [PubMed] [Google Scholar]
- 23.Ferdek PE, Jakubowska MA. Biology of pancreatic stellate cells-more than just pancreatic cancer. Pflugers Arch. 2017;469:1039–1050. doi: 10.1007/s00424-017-1968-0. [DOI] [PMC free article] [PubMed] [Google Scholar]
- 24.Takikawa T, Masamune A, Yoshida N, Hamada S, Kogure T, Shimosegawa T. Exosomes derived from pancreatic stellate cells: microRNA signature and effects on pancreatic cancer cells. Pancreas. 2017;46:19–27. doi: 10.1097/MPA.0000000000000722. [DOI] [PubMed] [Google Scholar]
- 25.Han X, Li Y, Xu Y, Zhao X, Zhang Y, Yang X, Wang Y, Zhao R, Anderson GJ, Zhao Y, Nie G. Reversal of pancreatic desmoplasia by re-educating stellate cells with a tumour microenvironment-activated nanosystem. Nat Commun. 2018;9:3390. doi: 10.1038/s41467-018-05906-x. [DOI] [PMC free article] [PubMed] [Google Scholar]
- 26.Masamune A, Yoshida N, Hamada S, Takikawa T, Nabeshima T, Shimosegawa T. Exosomes derived from pancreatic cancer cells induce activation and profibrogenic activities in pancreatic stellate cells. Biochem Biophys Res Commun. 2018;495:71–77. doi: 10.1016/j.bbrc.2017.10.141. [DOI] [PubMed] [Google Scholar]
- 27.Zhang YF, Zhou YZ, Zhang B, Huang SF, Li PP, He XM, Cao GD, Kang MX, Dong X, Wu YL. Pancreatic cancer-derived exosomes promoted pancreatic stellate cells recruitment by pancreatic cancer. J Cancer. 2019;10:4397–4407. doi: 10.7150/jca.27590. [DOI] [PMC free article] [PubMed] [Google Scholar]
- 28.Guarnerio J, Bezzi M, Jeong JC, Paffenholz SV, Berry K, Naldini MM, Lo-Coco F, Tay Y, Beck AH, Pandolfi PP. Oncogenic role of fusion-circRNAs derived from cancer-associated chromosomal translocations. Cell. 2016;166:1055–1056. doi: 10.1016/j.cell.2016.07.035. [DOI] [PubMed] [Google Scholar]
- 29.Vo JN, Cieslik M, Zhang Y, Shukla S, Xiao L, Zhang Y, Wu YM, Dhanasekaran SM, Engelke CG, Cao X, Robinson DR, Nesvizhskii AI, Chinnaiyan AM. The landscape of circular RNA in cancer. Cell. 2019;176:869–881. e813. doi: 10.1016/j.cell.2018.12.021. [DOI] [PMC free article] [PubMed] [Google Scholar]
- 30.Kristensen LS, Andersen MS, Stagsted LVW, Ebbesen KK, Hansen TB, Kjems J. The biogenesis, biology and characterization of circular RNAs. Nat Rev Genet. 2019;20:675–691. doi: 10.1038/s41576-019-0158-7. [DOI] [PubMed] [Google Scholar]